Article

Comparison of Empirical ETo Relationships with ERA5-Land and In Situ Data in Greece

by
Nikolaos Gourgouletis
1,*,
Marianna Gkavrou
1,2 and
Evangelos Baltas
1
1
Department of Water Resources & Environmental Engineering, School of Civil Engineering, National Technical University of Athens, Str. Iroon Politexniou 9, 15780 Zografou, Greece
2
Neuropublic S.A., Information Systems & Technologies, Str. Methonis 6, 18545 Piraeus, Greece
*
Author to whom correspondence should be addressed.
Geographies 2023, 3(3), 499-521; https://doi.org/10.3390/geographies3030026
Submission received: 22 June 2023 / Revised: 22 July 2023 / Accepted: 31 July 2023 / Published: 3 August 2023

Abstract

:
Reference evapotranspiration (ETo) estimation is essential for water resources management. The present research compares four different ETo estimators based on reanalysis data (ERA5-Land) and in situ observations from three different cultivation sites in Greece. ETo based on FAO56-Penman–Monteith (FAO-PM) is compared to ETo calculated from the empirical methods of Copais, Valiantzas and Hargreaves-Samani using both reanalysis and in situ data. The daily and monthly biases of each method are calculated against the FAO56-PM method. ERA5-Land data are also compared to ground-truth observations. Additionally, a sensitivity analysis is conducted on each site for different cultivation periods. The present research finds that the use of ERA5-Land data underestimates ground-truth-based ETo by 35%, approximately, when using the FAO56-PM method. Additionally, the use of other methodologies also shows underestimation of ETo when calculated with ERA5-Land data. On the contrary, the use of the Valiantzas and Copais methodologies with in situ observations shows overestimation of ETo when compared to FAO56-PM, in the ranges of 32–62% and 24–56%, respectively. The sensitivity analysis concludes that solar radiation and relative humidity are the most sensitive variables of the Copais and Valiantzas methodologies. Overall, the Hargreaves-Samani methodology was found to be the most efficient tool for ETo estimation. Finally, the evaluation of the ERA5-Land data showed that only air temperature inputs can be utilized with high levels of confidence.

1. Introduction

Sustainable water resources management is one of the great global challenges of the 21st century, as freshwater demand is not likely to be covered sufficiently in the coming decades [1]. Agriculture and especially irrigation constitute the most significant freshwater consumer, absorbing about 70% of total water consumption [2]. The European Mediterranean countries, due to their relative dry climate, show a greater percentage of water consumption for irrigation, approximately 80% [3,4]. Thus, the proper estimation of irrigation water consumption is fundamental for the sustainable allocation of water resources and the efficient design of irrigation systems [5].
Climate change is expected to intensify the quantitative pressures on water resources, particularly in the Mediterranean region [6,7,8,9]. Fluctuations in regional water cycles are anticipated, exerting the vulnerability of agricultural production due to its dependence on and interconnection with irrigation water [10,11,12,13,14,15]. Recently, the EU set the goal of additional investments particularly in irrigation infrastructure along with the use of precise tools for irrigation water accounting [16].
The quantitative assessment of irrigation water use/demand is based on modeling the water balance in cultivation [17,18,19,20]. Evapotranspiration is considered the most significant component of crop water balance, especially in regions where the contributions of precipitation and groundwater are negligible during the irrigation period [21,22]. Evapotranspiration is usually calculated by the FAO-56 Penman–Monteith approach [23] as the product of the crop coefficient and the reference evapotranspiration, where the latter is a hypothetical grass reference crop with an assumed crop height of 0.12 m, a fixed surface resistance of 70 s m−1 and an albedo of 0.23 [23]. The FAO-56 PM approach requires the following data as inputs: solar radiation, air temperature, air humidity and wind speed data.
However, consistent meteorological data are sparse from in situ observations; hence, properly maintained and fully equipped in situ meteorological stations are hard to find, even in technologically advanced countries. Often, the timeseries of variables present data gaps, and they are not always subjected to validation and outlier clearing [24]. Moreover, access to these data may be limited, as the public or private services that manage them may supply their data after complex and time-consuming procedures. There are also numerous instances where accessing these data requires significant payment [25].
A regional estimation of ETo may be calculated by a spatial interpolation from the available in situ stations when the latter contain complete timeseries over a reference time period [26,27]. Nevertheless, spatial interpolations are subject to several misleading factors, including measurement bias and errors, uncertainties regarding the structure of the interpolated area as well as the possibility of nonrepresentative positions of the stations [28]. Another approach to estimating ETo more effortlessly is with the application of methodologies requiring fewer variables than the FAO56-PM approach. These methodologies may have empirical elements for specific regional climates.
Coming to the present research’s country of interest, Greece, it is acknowledged that a widespread lack of good-quality in situ meteorological data hinders the proper estimation of daily crop water irrigation needs. Additionally, the lack of specific reference crop cultivations makes the FAO-56 PM method more difficult to apply [29]. A potential solution to the abovementioned drawbacks to properly estimating ETo is considered to be the use of global datasets of satellite or reanalysis origin. Since the beginning of the 2000s, the use of these types of datasets has gained ever-growing attention [30,31].
Climate reanalysis data combine lengthy timeseries from the past with algorithms in order to recreate continuous timeseries of many variables. Reanalysis data are widely utilized in geosciences in order to close the gap caused by insufficient ground measurements, as well as in the management of irrigation water resources. Meteorological organizations supply reanalysis data openly and freely, making them accessible on the Internet, and end users can easily download them for their area of interest [32].
The ERA5-Land reanalysis launched in 2019 by the Copernicus Climate Change Service offers a broad range of variables timeseries at a spatial resolution of 9 km. Contemporary research has concluded that the precision of estimating ETo by using the ERA5-Land reanalysis dataset is comparable to the approach of spatial interpolation of ground stations, acknowledging the solar radiation variable as the most prone to bias in the estimation of ETo [32].
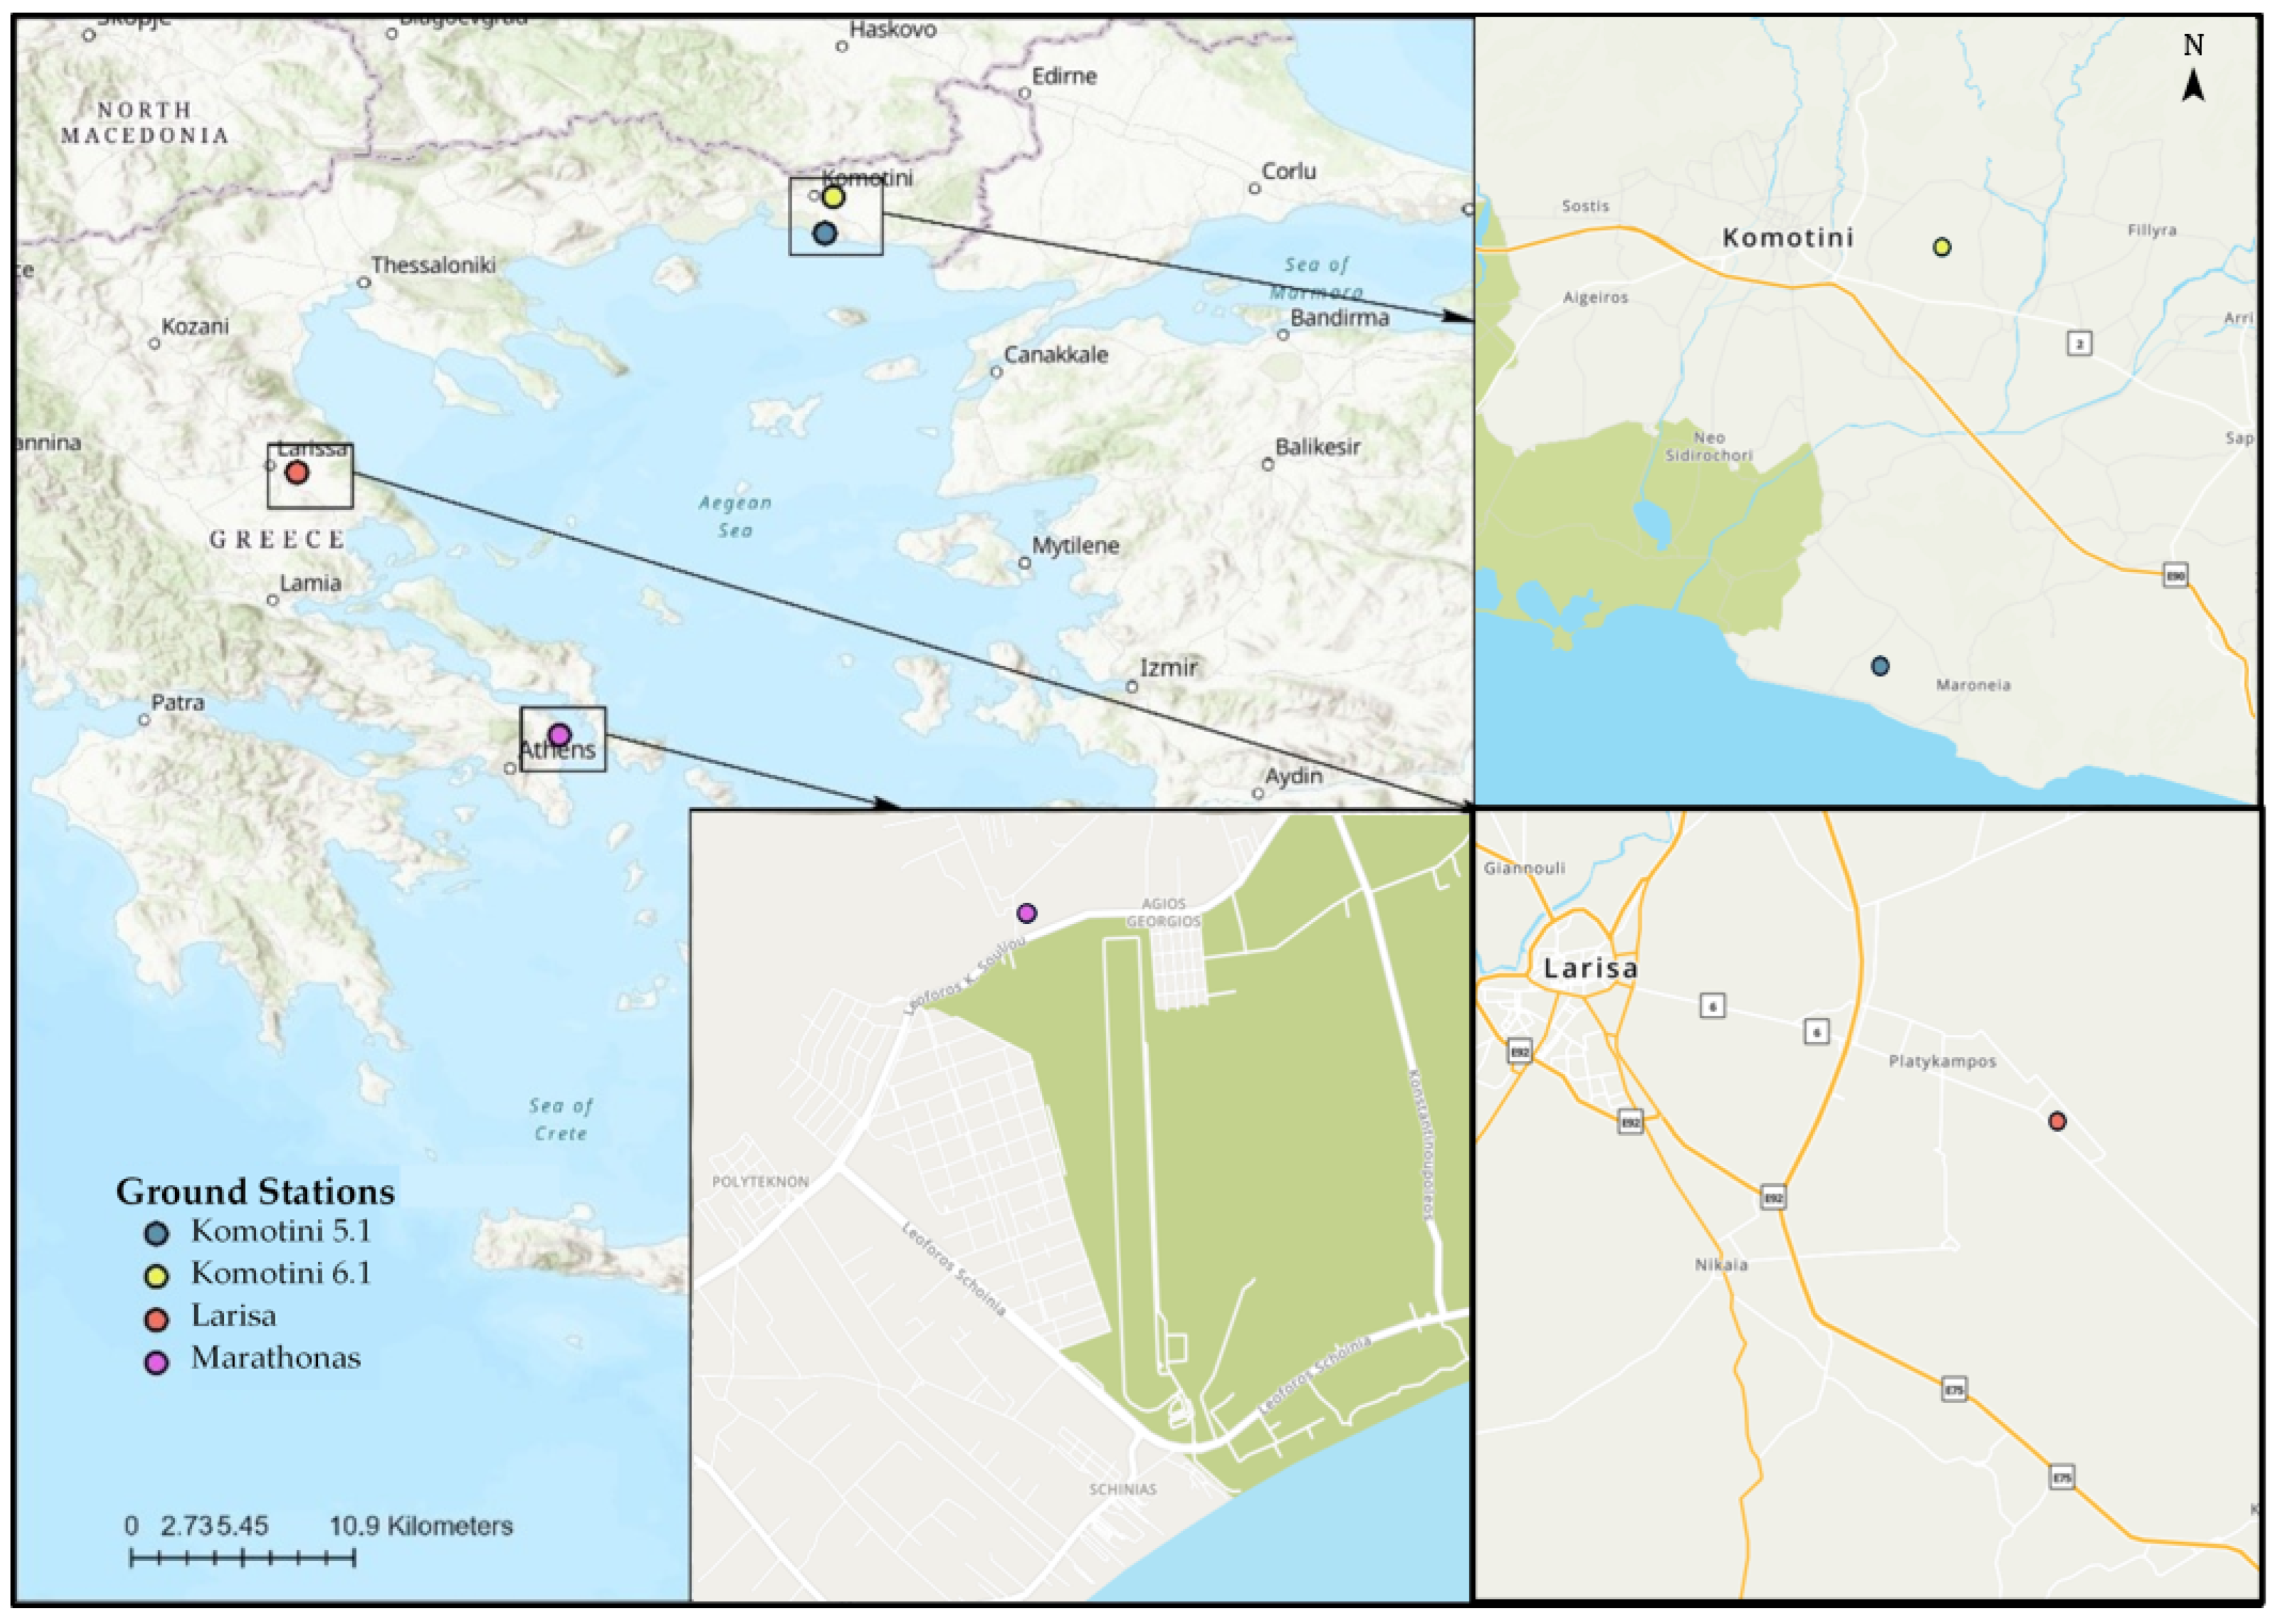
The present research aims to assess the accuracy of the ERA5-Land data for estimating ETo in several extensively cultivated regions of Greece: Larissa, Komotini and Marathonas. The assessment is conducted by exploiting the available ground measurements of the information systems and technologies company Neuropublic S.A. Neuropublic S.A. installed company-owned GAIAtron ground stations in these areas during different crops cultivation periods. More specifically, a comparative assessment is conducted between estimating ETo with the FAO56-PM approach with GAIAtron and ERA5-Land data, followed by the assessment of three different approaches (Copais [33], Hargreaves-Samani [34] and Valiantzas [35]). Finally, a sensitivity analysis is also conducted of how the applied meteorological variables affect the estimation of ETo within each approach.
Similar research of comparing different ETo estimates has been previously conducted; these studies relied heavily on in situ measurements from a great number of meteorological stations [36,37,38]. On the contrary, the present research aims to identify the potential of estimating reference ETo by solely utilizing remote sensing reanalysis (ERA5-Land) data, which are then tested against a small number of in situ stations.

2. Materials and Methods

2.1. Study Areas

The three areas on which the present research focuses hosted GAIAtron meteorological stations during specific cultivation periods. Larisa, Komotini and Marathonas present intense agricultural activity with differentiating climate regimes where the estimation of ET is of vital importance for sustainable irrigation water resources management. The abovementioned areas are presented in Figure 1.
Larisa (N 39°38′19″ E 22°24′47″, +70 mamsl) is located in the River Basin District of Thessaly (RBD EL08) in the central plain of Thessaly. The central plain of Thessaly shows a continental climate regime with an average annual air temperature between 16 and 17 °C and a high temperature range (22 °C), while the RBD EL08 records 678 mm of annual precipitation on average [39]. Irrigation water is considered to account for around 95% of the total water demand [40], signifying the importance of irrigation water in the RBD EL08. Many river water bodies have been identified as under quantitative pressures due to the high usage of irrigation water [39]. Thus, the importance of properly estimating ETo is self-evident for the sustainable continuity of agricultural activities and adequacy of water resources.
Komotini (N 41°7′0″ E 25°24′0″, +45 mamsl) is located in the River Basin District of Attica (RBD EL06) in the Komotini river basin. The RBD EL12 shows a mixed climate regime with an average annual air temperature between 14.5 and 16.5 °C and a high temperature range (above 20 °C), and it records 778 mm of annual precipitation on average. The river basin of Komotini is occupied by cultivated land at around 40%, and the irrigation water demand for the RBD EL12 stands for 59% of the total water demand [41].
Marathonas (N 38°9′18″ E 23°57′49″, +28 masl) is located in the River Basin District of Thessaly (RBD EL08) on the eastern coast of the Attica basin. The Attica basin shows mostly a Mediterranean climate regime with an average annual air temperature between 16 and 18 °C and a high temperature range (16 °C) while recording variant ranges of annual precipitation: 350 mm in the central plain of Athens to 1000 mm in the mountainous areas [42]. Irrigation water is considered to account for around 13.2% of the total water demand [42], due to the high urban density of the Attica RBD. The Marathonas plain combines significant agricultural activity with urban development, with arable land accounting for 17 km2. The over-abstraction of groundwater resources for irrigation purposes has caused several water resources management issues in the broader area.

2.2. Data Used

The present research exploited the in situ data offered by Neuropublic S.A.’s GAIAtron agrometeorological stations. These stations were positioned in agricultural fields during specific cultivation periods. These are presented in Table 1. As an effect, the reanalysis ERA5-Land data are downloaded for the same time periods.

2.2.1. GAIAtron Stations

GAIAtrons are agrometeorological stations designed, manufactured and operated by Neuropublic S.A. They incorporate Internet of Things (Iot) sensors and provide continuous monitoring of agrometeorological variables. They are installed inside or right next to croplands of interest. Typically, they comprise several sensors, which measure the following variables: air temperature, relative humidity, barometric pressure, wind direction, rainfall depth, wind speed, leaf binary, incoming solar radiation, soil moisture and salinity/conductivity. GAIAtrons record the above variables at a 10 min time step, which were cured by the present research to 24h average values, minima and maxima, accordingly.
A typical GAIAtron station is equipped with the following sensor equipment:
  • SHT31 weatherproof air temperature and humidity sensor;
  • LPS33HW barometric pressure sensor;
  • CYL49E Hall Effect Sensor;
  • Auto-emptying rain collector with 0.2 mm increments;
  • Peripheral leaf wetness sensor;
  • SHT31—remote on-leaf wetness PCB;
  • TEPT5700 ambient light sensor;
  • Sentek EnviroSCAN Type II peripheral soil sensor for soil moisture, salinity and temperature.

2.2.2. ERA5-Land Data

The ERA5-Land dataset is distributed by the European Centre for Medium Range Weather Forecasts (ECMWF). The whole dataset covers climate variables over the world land areas at 2 m above ground level with a temporal analysis of 1 h, starting from the year 1950 until 2–3 months before the present date. The ERA5-Land datasets were downloaded from the CEU Copernicus Climate Change Service online portal at https://cds.climate.copernicus.eu (accessed on 1 February 2023). ERA5-Land datasets are extensively applied in hydrology and remote sensing [43,44]. Therefore, they are considered suitable for the scope of the present research.
Specifically, air temperature timeseries were download at an hourly time step, and daily mean, minimum and maximum temperature records were created. In the same manner, incoming solar radiation, wind speed, dew point temperature and barometric pressure were downloaded, processed and applied to the equations described in the Methodology section.

2.3. Methodology

The present research applied four different approaches to estimate daily reference evapotranspiration (ETo) using the two abovementioned datasets (the agrometeorological GAIAtron ground stations and the ERA5-Land datasets). Following that, a sensitivity analysis was conducted on each ETo estimation approach. All approaches and datasets were compared to the ETo estimation approach of FAO-56 PM, calculated from GAIAtron in situ data.
The FAO-56 PM method calculates the daily ETo using the following Equation (1):
E T o = 0.408 Δ R n G + γ 900 T + 273 u 2 ( e s e a ) Δ + γ ( 1 + 0.34 u 2 )
where
  • ETo = reference evapotranspiration → (mm/d);
  • Rn = net radiation at surface → (MJ m−2/day−1);
  • G = soil heat flux density → (MJ m−2/day);
  • T = mean daily air temperature at 2 m height → (°C);
  • u2 = wind speed at 2 m height → (m/s);
  • es = saturation vapor pressure → (kPa);
  • ea = actual vapor pressure → (kPa);
  • es − ea = saturation vapor pressure deficit → (kPa);
  • Δ = slope vapor pressure curve → (kPa/°C);
  • γ = psychrometric constant → (kPa/°C).
The Hargreaves-Samani [34] approach was initially developed in 1975 and modified in 1985 for specific grass conditions. The approach is described in Equation (2).
E T o = 0.0023 T m a x T m i n 0.5 ( T + 17.8 ) R α
where
  • ETo = reference evapotranspiration → (mm/d);
  • Tmax = maximum daily surface temperature → (°C);
  • Tmin = minimum daily surface temperature → (°C);
  • T = mean daily air temperature at 2 m height → (°C);
  • Ra = extraterrestrial radiation → (mm/d).
The Copais approach [33,45] was developed in order to require only three pertinent meteorological attributes: solar radiation Rs, air temperature T and relative humidity RH. The method, described in Equations (3)–(5), was developed and calibrated with data from the Copais region in Central Greece.
E T o = m 1 + m 2 C 2 + m 3 C 1 + m 4 C 1 C 2
C 1 = 0.6416 0.00784 R H + 0.372 R S 0.00264 R S R H
C 2 = 0.0033 + 0.00812 T + 0.101 R S 0.00584 R S T
where
  • ETo = reference evapotranspiration → (mm/d);
  • RH = average relative humidity → (%);
  • T = mean daily air temperature at 2 m height → (°C);
  • Rs = average incoming solar radiation → (MJ/m2/day);
  • m1 = 0.057, m2 = 0.277, m3 = 0.124.
The Valiantzas approach [35] was developed as a simplified version of the PM methodology in order to compensate for limited data availability. The method focuses on cases where wind speed and/or relative humidity data are not available. The development of the Valiantzas method was tested on a network of over 120 active automated weather stations in the U.S. state of California. It is described in Equation (6).
E T o 0.0393 R S T + 9.5 0.19 R S 0.6 φ 0.15 + 0.078 ( T + 20 ) ( 1 R H 100 )
where
  • ETo = reference evapotranspiration → (mm/d);
  • RH = average relative humidity → (%);
  • T = mean daily air temperature at 2 m height → (°C);
  • Rs = average incoming solar radiation → (MJ/m2/day);
  • φ = latitude of the site → (rad).
For the comparative analysis between the empirical approaches (Hargreaves-Samani, Copais and Valiantzas) and the reference method of FAO56-PM, as well as their data input sources (GAIAtron or ERA5-Land), the percentage difference, each set’s correlation and the RMSE were calculated. Moreover, the coefficient of determination was calculated for each approach’s two data inputs: ERA5-Land and GAIAtrons.
Additionally, each agrometeorological variable was tested with a sensitivity analysis of its impact on the estimation of ETo by each of the four methodologies. The limited temporal range of the ground-recorded variables was treated by conducting the analysis for two distinct time periods: a dry hydrologic period (July–September) and a spring period (March–May).

2.4. Statistics and Sensitivity Analysis

Besides the direct comparison of the entire cultivation period of the estimated ETo values, the generated timeseries were tested with the root mean square error (RMSE) against the calculated daily ETo of the ground-station-based FAO56-PM method. The RMSE is commonly used for measuring the performance of models and estimators in the fields of meteorology, hydrology and climate research [46]. The RMSE can be defined by the following Equation (7), where n is the size of the sample, Dpre is the predicted variable and Dact is the actual variable:
R M S E = 1 n × 1 n D p r e D a c t 2
Sensitivity analyses test the effect of a change in one variable on another [47]. The change in a meteorological variable to the change in reference evapotranspiration, when it tends to zero, is the partial derivative of this variable to reference evapotranspiration [48]. A dimensionless approach to the different meteorological variables and ETo enables the comparison between them. Dimensionless sensitivity coefficients for meteorological variables can be defined using Equation (8) [49], where p is the examined variable and M is the modeled value:
K S p = M p × p / M

3. Results

The results are presented per region and per temporal period. The full timeseries calculated for each site are presented in Appendix A.

3.1. Estimation of ET

3.1.1. Larisa, June–December 2019

The Larisa GAIAtron station operated during the cultivation period of June to December 2019. The daily ETo estimations were accumulated, resulting in the total ETo of the abovementioned time period, as shown in Table 2.
Reference evapotranspiration is found to be underestimated when using ERA5-L data when compared to the in situ data. The reference methodology of FAO56-PM underestimates ETo by 39% during the examined months. All other approaches show a similarly high discrepancy when using ERA5-L data, with an average daily RMSE higher than 2 mm/d.
When the examined approaches are tested with the in situ data, only the Hargreaves-Samani methodology shows a cumulative difference greater than 100 mm during the examined months. On the other hand, the Copais and Valiantzas approaches show a small cumulative difference of only a few millimeters. However, their average daily RMSEs are relatively high, greater than 1 mm/d.

3.1.2. Larisa, January–December 2020

The Larisa GAIAtron station operated during the cultivation period of January to December 2020. The daily ETo estimations were accumulated, resulting in the total ETo of the abovementioned time period, as shown in Table 3.
Reference evapotranspiration is found to be underestimated when using ERA5-L data when compared to the in situ data. The reference methodology of FAO56-PM underestimates ETo by 19% during the examined year, 2020. The Copais and Valiantzas approaches show a similarly high discrepancy when using ERA5-L data, with an average daily RMSE higher than 1 mm/d. However, when the Hargreaves-Samani method is applied using ERA5-Land data, the resulting total ETo is estimated with high accuracy. The total difference stands for 2% of the reference ETo with an RMSE of 0.81 mm/d.
When the examined approaches are tested with the in situ data, they show a divergence greater than 20%, overestimating the total ETo. Additionally, all approaches when tested with GAIAtron data present an RMSE of around 1 mm/d.

3.1.3. Larisa, January–December 2021

The Larisa GAIAtron station operated during the cultivation period of January to December 2021. The daily ETo estimations were accumulated, resulting in the total ETo of the abovementioned time period, as shown in Table 4.
Reference evapotranspiration is found to be significantly underestimated using ERA5-L data when compared to the in situ data. The reference methodology of FAO56-PM underestimates ETo by 30% during the examined year, 2021. The Copais and Valiantzas approaches show a similarly high discrepancy when using ERA5-L data, with an average daily RMSE higher than 1.8 mm/d. The Hargreaves-Samani method is found to be the most accurate when using ERA5-Land data, resulting in a total ETo of 1043.17 mm. The total difference stands for 22% of the reference ETo with an RMSE of 1.32 mm/d.
When the Copais and Valiantzas approaches are tested with in situ data, they show a divergence greater than 10%, overestimating the total ETo. However, the Hargreaves-Samani method accurately calculates ETo, with a difference of 0.75% when compared to the reference method of FAO56-PM. The Hargreaves-Samani approach’s daily RMSE accounts for 0.86 mm/d when using in situ data.

3.1.4. Komotini 5.1, July–December 2020

The Komotini 5.1 GAIAtron station operated during the cultivation period of June to December 2020. The daily ETo estimations were accumulated, resulting in the total ETo of the abovementioned time period, as shown in Table 5.
Reference evapotranspiration is found to be significantly underestimated when using ERA5-L data when compared to the in situ data. The reference methodology of FAO56-PM underestimates ETo by 47% during the examined months. All other approaches show a similarly high discrepancy when using ERA5-L data, with an average daily RMSE higher than 3 mm/d.
When the examined approaches are tested with the in situ data, the Hargreaves-Samani methodology fails to show adequate accuracy, estimating a lower ETo by 506.91 mm during the examined months. On the other hand, the Copais and Valiantzas approaches show a smaller cumulative difference, 103.79 mm and 125.71 mm, accordingly. However, their average daily RMSEs are relatively high, greater than 1.5 mm/d.

3.1.5. Komotini 6.1, July–December 2020

The Komotini 6.1 GAIAtron station operated during the cultivation period of July to December 2020. The daily ETo estimations were accumulated, resulting in the total ETo of the abovementioned time period, as shown in Table 6.
Reference evapotranspiration is found to be significantly underestimated when using ERA5-L data when compared to the in situ data. The reference methodology of FAO56-PM underestimates ETo by 52% during the examined months. All other approaches show a similarly high discrepancy when using ERA5-L data, with an average daily RMSE higher than 3.2 mm/d.
When the examined approaches are tested with the in situ data, only the Hargreaves-Samani methodology shows a cumulative difference of 402.62 mm during the examined months. On the other hand, the Copais and Valiantzas approaches show a smaller but still important cumulative difference of 168.70–181.53 mm. Also, their average daily RMSEs are relatively high, greater than 1.7 mm/d.

3.1.6. Marathonas, February–May 2021

The Marathonas GAIAtron station operated during the cultivation period of February to May 2021. The daily ETo estimations were accumulated, resulting in the total ETo of the abovementioned time period, as shown in Table 7.
Reference evapotranspiration is found to be underestimated when using ERA5-L data when compared to the in situ data. The reference methodology of FAO56-PM underestimates ETo by 25% during the examined months. All other approaches show a similarly high discrepancy when using ERA5-L data, with an average daily RMSE higher than 1.3 mm/d.
When the examined approaches are tested with the in situ data, all three approaches, Copais, Hargreaves-Samani and Valiantzas, show a cumulative difference greater than 58 mm during the examined months, greater than 10% of the reference ETo. Their daily RMSEs are greater than or equal to 0.7 mm/d.

3.2. Agrometeorological Variables Testing

3.2.1. Larisa, June–December 2019

The measurements of agrometeorological variables from the in situ station and ERA5-L that were utilized to estimate the above values of ETo in Larisa during the period of June–December 2019 are tested for ERA5-Land accuracy in the manners of slope α of linear regression and of their coefficient of determination. Table 8 depicts the high accuracy of ERA5-L data in monitoring the maximum and average temperatures and moderate performance when it comes to minimum temperature and relative humidity. Solar radiation is found to have low accuracy when it is measured by the ERA5-L and compared to ground-truth data.

3.2.2. Larisa, January–December 2020

The measurements of agrometeorological variables from the in situ station and ERA5-L that were utilized to estimate the above values of ETo in Larisa during 2020 are tested for ERA5-Land accuracy in the manners of slope α of linear regression and of their coefficient of determination. Table 9 depicts the high accuracy of ERA5-L data in monitoring the maximum and average temperatures and moderate performance when it comes to minimum temperature and relative humidity. Solar radiation is found to have low accuracy when it is measured by the ERA5-L and compared to ground-truth data.

3.2.3. Larisa, January–December 2021

The measurements of agrometeorological variables from the in situ station and ERA5-L that were utilized to estimate the above values of ETo in Larisa during 2021 are tested for ERA5-Land accuracy in the manners of slope α of linear regression and of their coefficient of determination. Table 10 depicts the high accuracy of ERA5-L data in monitoring the maximum and average temperatures and moderate performance when it comes to minimum temperature. Solar radiation and relative humidity are found to have low accuracy when measured by the ERA5-L and compared to ground-truth data.
The total measurements of Larisa during 2019, 2020 and 2021 regarding Tavg, RH and Rs are presented also in the scatter plots of Figure 2. The plots reaffirm the above period-specific findings of slight overestimation of air temperature, slight underestimation of relative humidity and significant underestimation of solar radiation.

3.2.4. Komotini 5.1, July–December 2020

The measurements of agrometeorological variables from the in situ station and ERA5-L that were utilized to estimate the above values of ETo in Komotini during July–December 2020 are tested for ERA5-Land accuracy in the manners of slope α of linear regression and of their coefficient of determination. Table 11 depicts the high accuracy of ERA5-L data in monitoring the maximum and average temperatures and moderate to high performance when it comes to minimum temperature and relative humidity. Solar radiation is found to have low accuracy when measured by the ERA5-L and compared to ground-truth data.

3.2.5. Komotini 6.1, July–December 2020

The measurements of agrometeorological variables from the in situ station and ERA5-L that were utilized to estimate the above values of ETo in Komotini during July–December 2020 are tested for ERA5-Land accuracy in the manners of slope α of linear regression and of their coefficient of determination. Table 12 depicts the high accuracy of ERA5-L data in monitoring the maximum and average temperatures and moderate performance when it comes to minimum temperature. The variables of relative humidity and solar radiation are found to have low accuracy when measured by the ERA5-L and compared to ground-truth data.
The total measurements of Komotini 5.1 and 6.1 during 2020 regarding Tavg, RH and Rs are presented also in the scatter plots of Figure 3. The plots reaffirm the above period-specific findings of small differences in air temperature, slight to negligible differences in relative humidity and significant underestimation of solar radiation.

3.2.6. Marathonas, February–May 2021

The measurements of agrometeorological variables from the in situ station and ERA5-L that were utilized to estimate the above values of ETo in Marathonas during February–May 2021 are tested for ERA5-Land accuracy in the manners of slope α of linear regression and of their coefficient of determination. Table 13 depicts the high accuracy of ERA5-L data in monitoring the maximum and average temperatures and moderate performance when it comes to minimum temperature. Relative humidity and solar radiation are found to have low accuracy when measured by the ERA5-L and compared to ground-truth data.
The measurements of Marathonas during 2020 regarding Tavg, RH and Rs are presented also in the scatter plots of Figure 4. The plots reaffirm the above period-specific findings of small differences in air temperature, small underestimation of relative humidity and significant underestimation of solar radiation.

3.3. Sensitivity Analysis

As mentioned in Section 2.3, Methodology, a sensitivity analysis is conducted covering two distinct time periods; this is due to the specific temporal coverage of GAIAtron data. The first period examined spans the months of July to September (dry period). The other examined period comprises the spring months, March to May.

3.3.1. Dry Period: Larisa and Komotini

During the dry period of July to September, data were available for the study sites of Larisa and Komotini. A sensitivity analysis was conducted of the parameters of average temperature, relative humidity and solar radiation with a range of ±30% of their average value, originating from GAIAtron data, and is presented in Figure 5.
The average daily temperature sensitivity analysis showed that the Hargreaves-Samani and Valiantzas approaches are the most sensitive to temperature changes. A temperature change of 30% may alter the estimated daily ETo value by almost 1 mm. On the other hand, the FAO56-PM method is weakly affected by temperature changes.
The relative humidity sensitivity analysis showed that the Copais method is the most sensitive to relative humidity changes, followed by the Valiantzas approach. A relative humidity change of 30% may alter the estimated daily ETo value by 1 mm when calculated with the Copais method. On the contrary, the Hargraves-Samani and FAO56-PM methods show negligible impacts caused by relative humidity changes.
The solar radiation sensitivity analysis showed the strongest impact on the daily ETo estimation when it was calculated by the Copais and Valiantzas approaches. A 30% alteration of the solar radiation value results in 2 mm of ETo difference when calculated by the Copais approach. The Hargreaves-Samani approach is not affected by solar radiation, while the FAO-56 PM approach shows moderate sensitivity.

3.3.2. Spring Period: Larisa and Marathonas

During the spring period of March to May, data were available for the study sites of Larisa and Marathonas. The sensitivity analysis conducted on the parameters of average temperature, relative humidity and solar radiation with a range of ±30% of their average value, originating from GAIAtron data, is presented in Figure 6.
The average daily temperature sensitivity analysis showed that the Hargreaves-Samani and Valiantzas approaches are the most sensitive to temperature changes. A temperature change of 30% may alter the estimated daily ETo value by about 0.5 mm. On the other hand, the Copais and FAO56-PM methods are weakly affected by temperature changes.
The relative humidity sensitivity analysis showed that the Copais method is the most sensitive to relative humidity changes, followed by the Valiantzas approach. A relative humidity change of 30% may alter the estimated daily ETo value by 1 mm, when calculated with the Copais method. On the contrary, the Hargraves-Samani and FAO56-PM methods show negligible impacts caused by relative humidity changes.
The solar radiation sensitivity analysis showed the strongest impact on the daily ETo estimation when it was calculated by the Copais and Valiantzas approaches. A 30% alteration of the solar radiation value results in more than 1 mm of ETo difference when calculated by the Copais approach. The Hargreaves-Samani approach is not affected by solar radiation, while the FAO-56 PM approach shows moderate sensitivity.

4. Discussion

The present research attempted to evaluate the use of different methodologies and data sources towards estimating reference evapotranspiration, ETo. Specifically, the investigation assessed the Hargreaves-Samani, Copais and Valiantzas methods of estimating the reference ETo by comparing them to the FAO56-PM method. Moreover, the utilized timeseries of ERA5-Land agrometeorological variables were compared to data from the in situ GAIAtron stations. Finally, a sensitivity analysis was conducted of the four methodologies’ behavior regarding changes in the average daily air temperature, relative humidity and solar radiation.
Remote sensing and reanalysis were tested in the calculation of daily and cumulative ETo at three cultivation sites in Greece with different climatic conditions. The comparison with the available GAIAtron ground stations highlighted the potential and the limitations of ERA5-Land data usage to estimate ETo with various methodologies. An ERA5-Land fine-resolution grid of 9 km is considered the most capable of the different remote sensing datasets and capable of covering relatively small homogenous morphological areas, such as the sites examined [50,51,52].
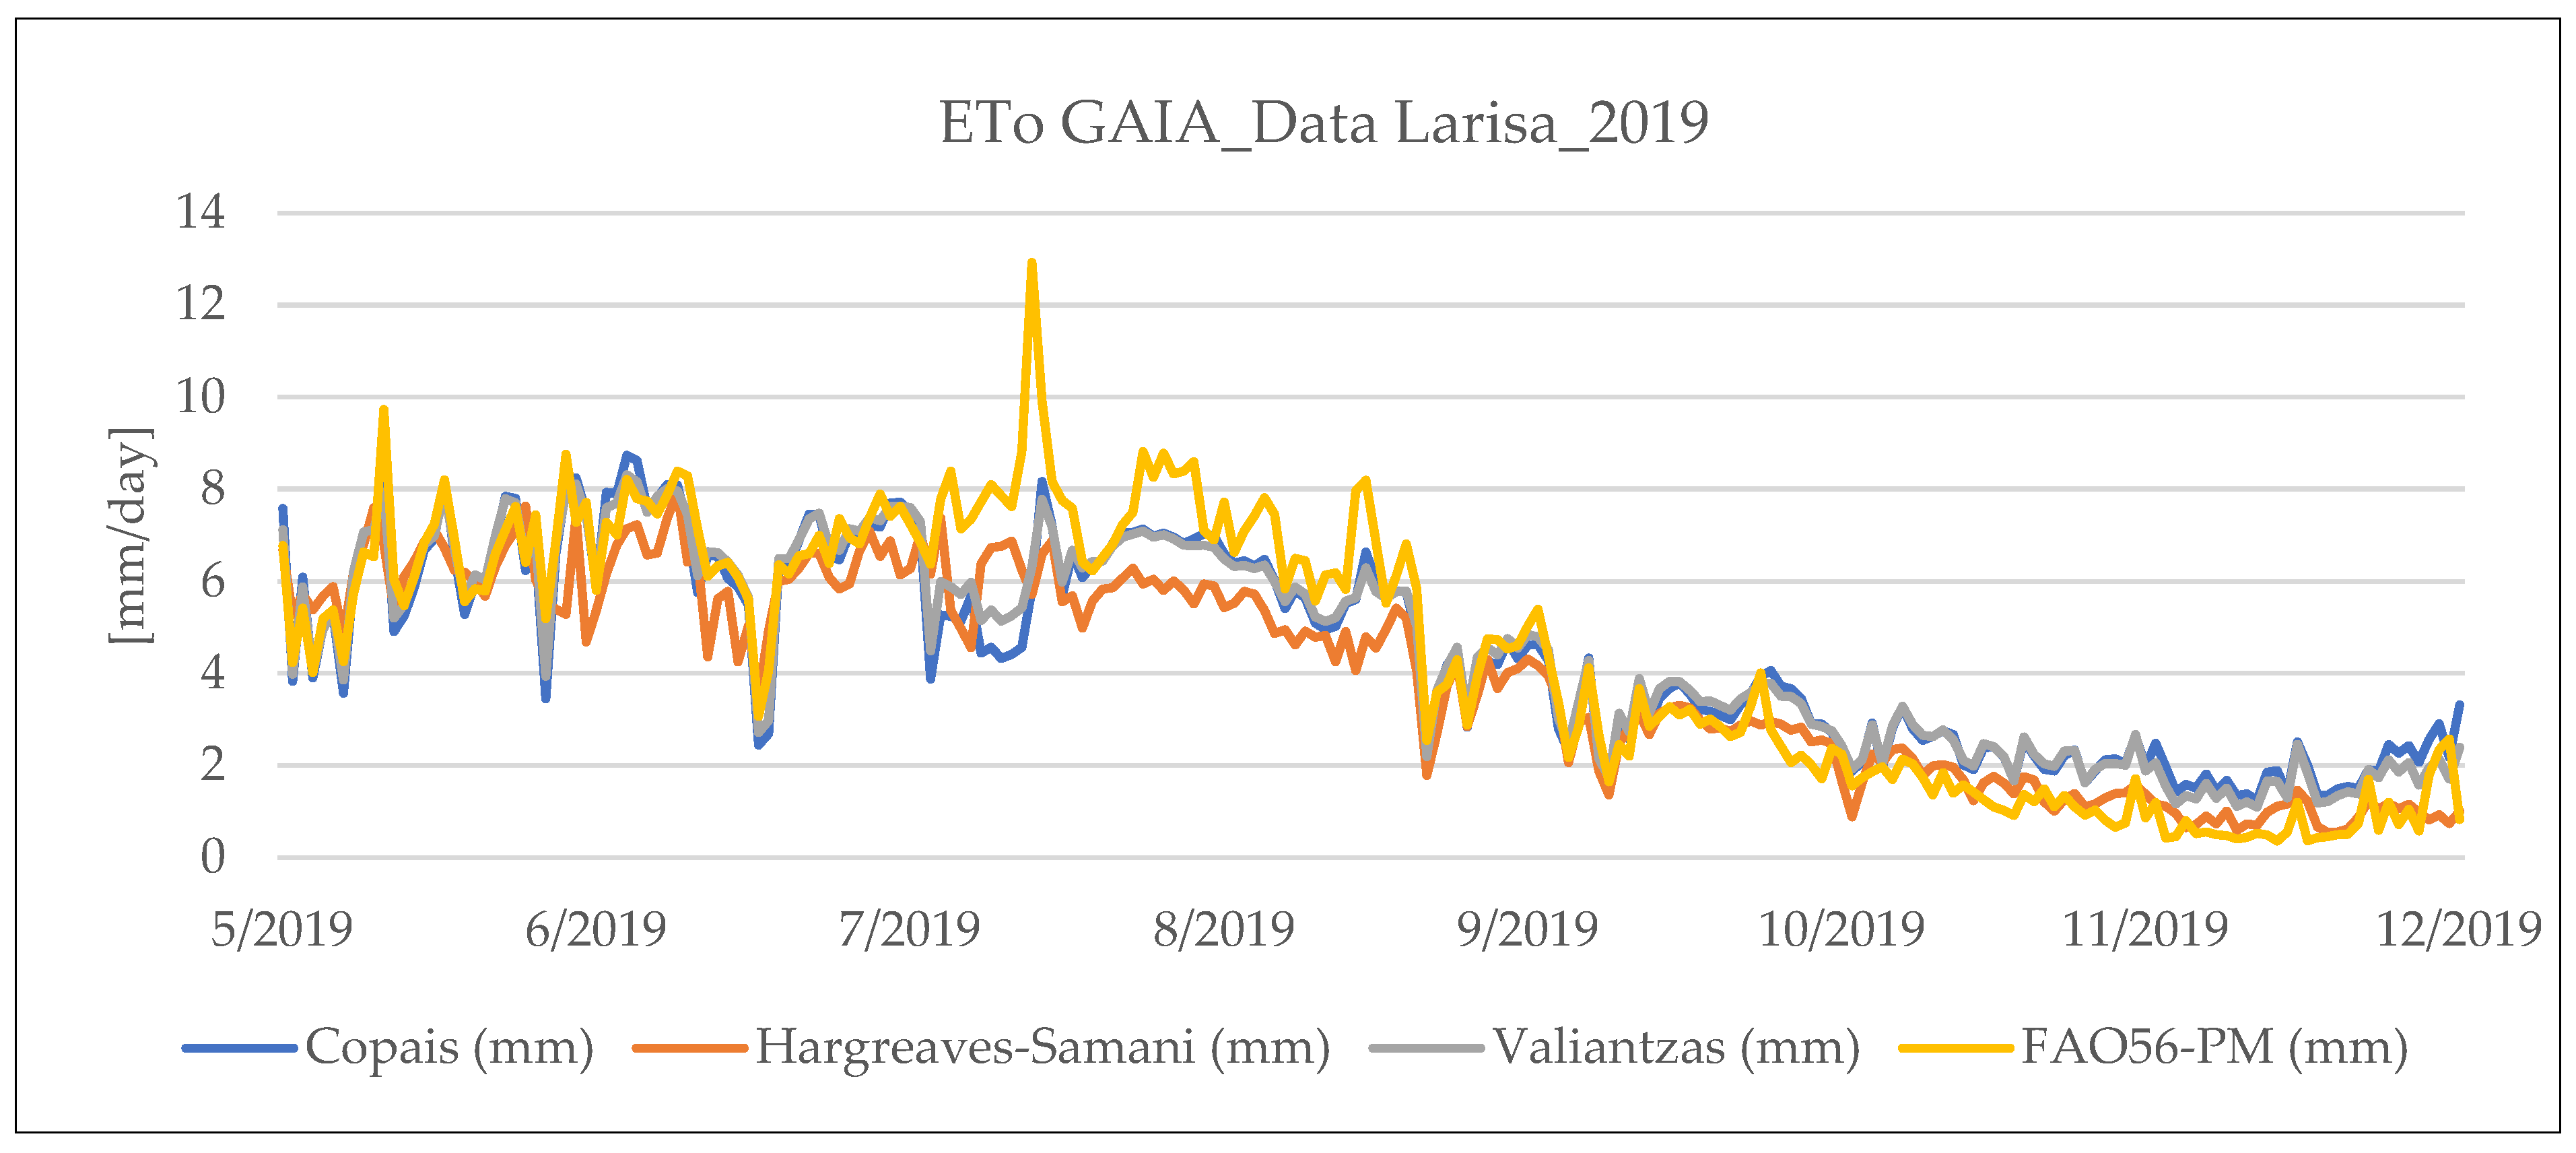
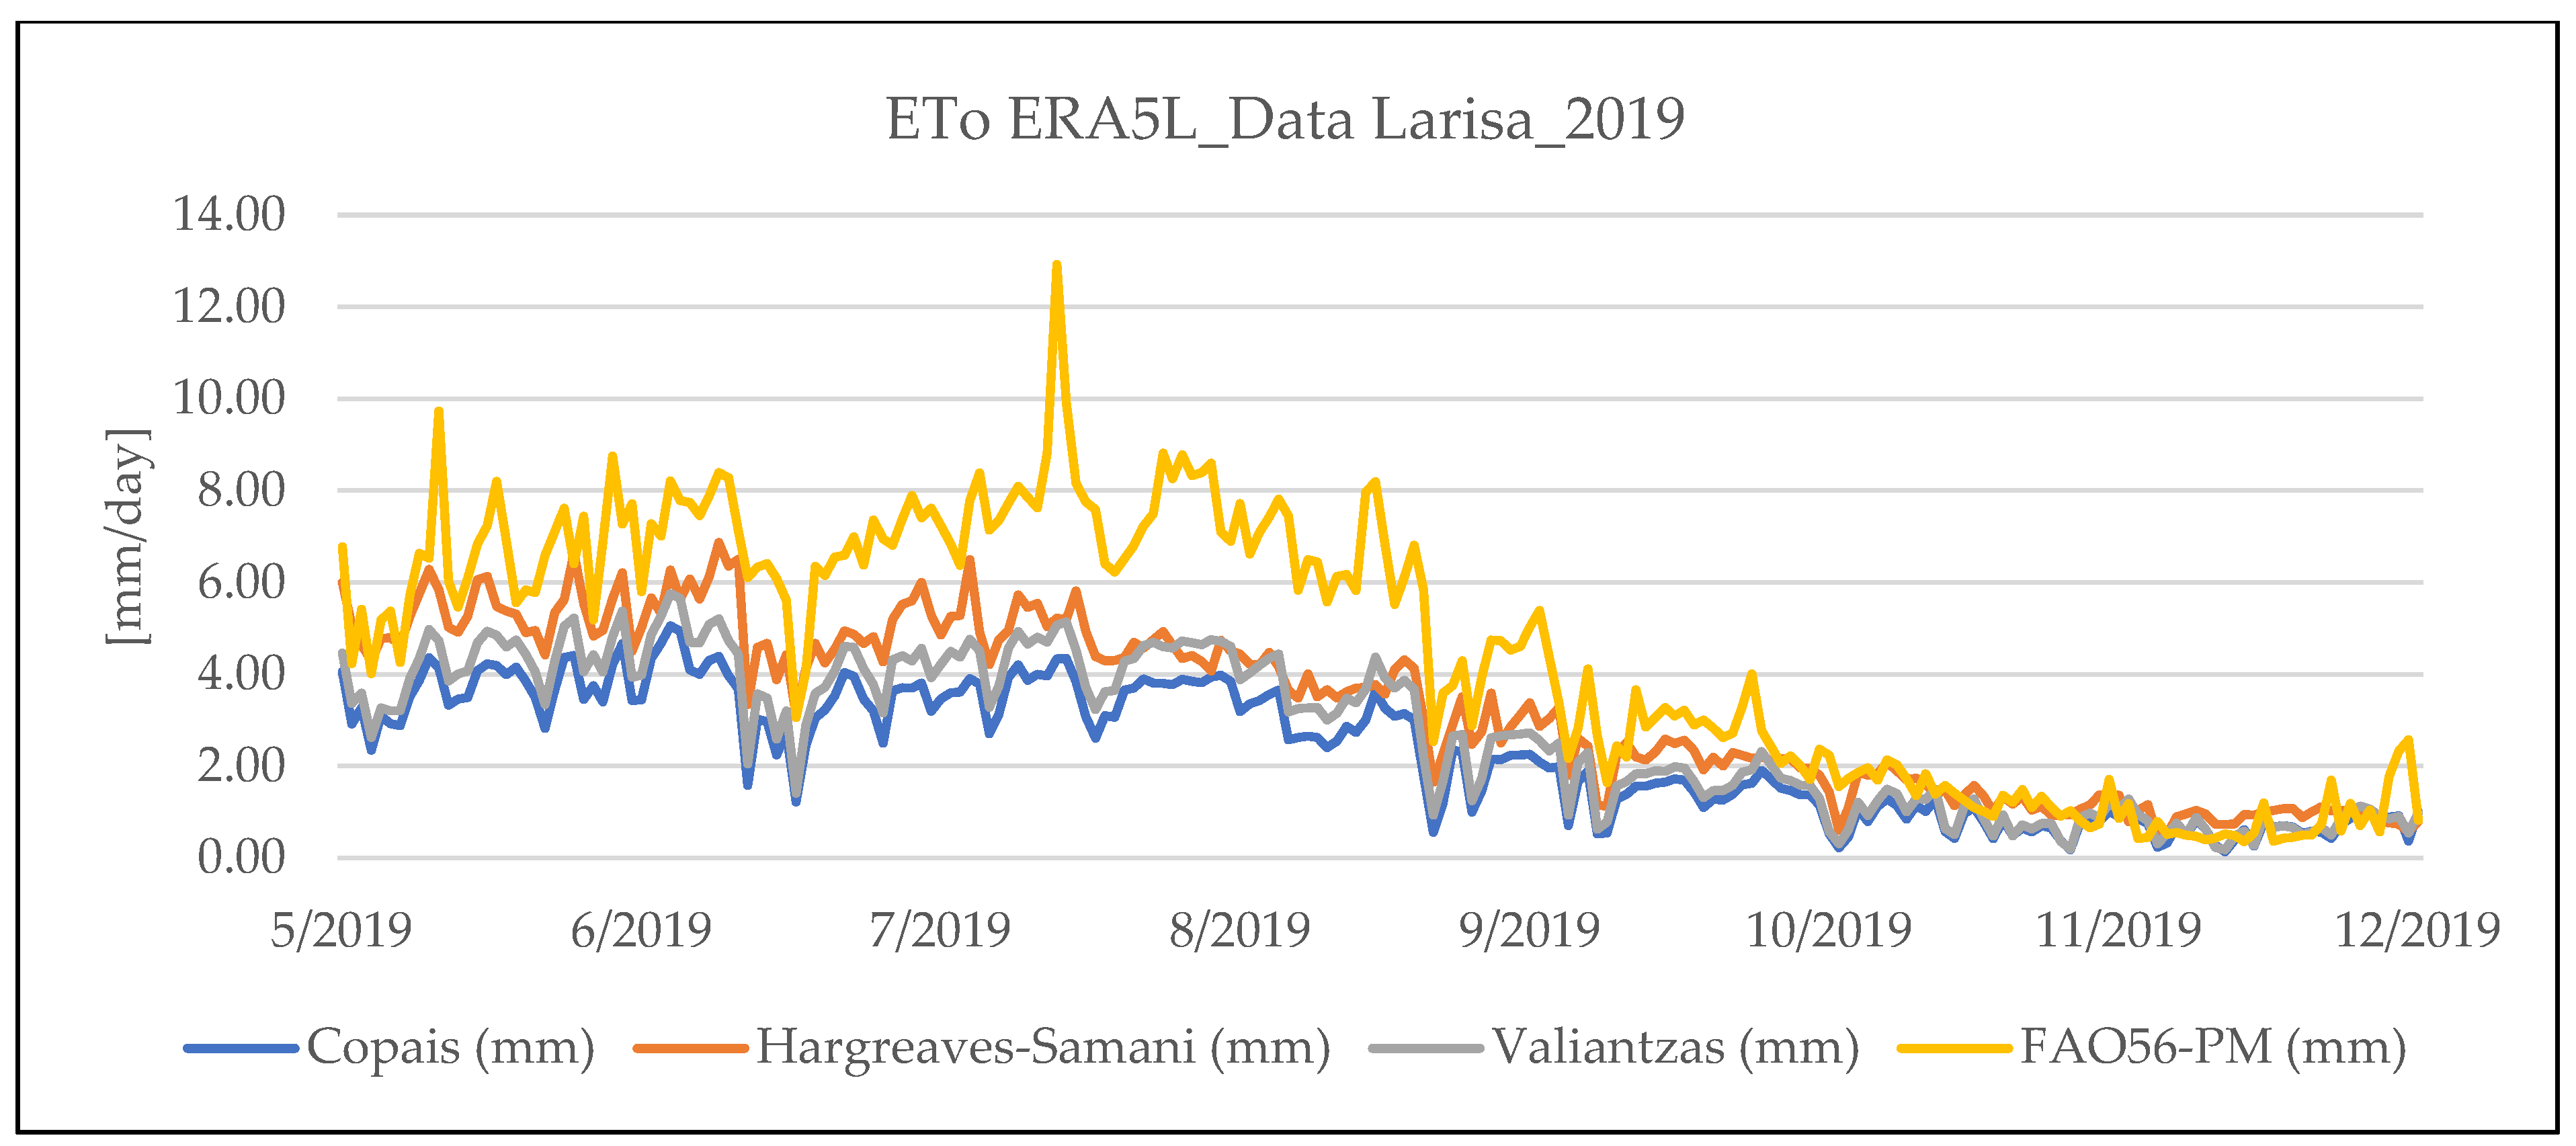
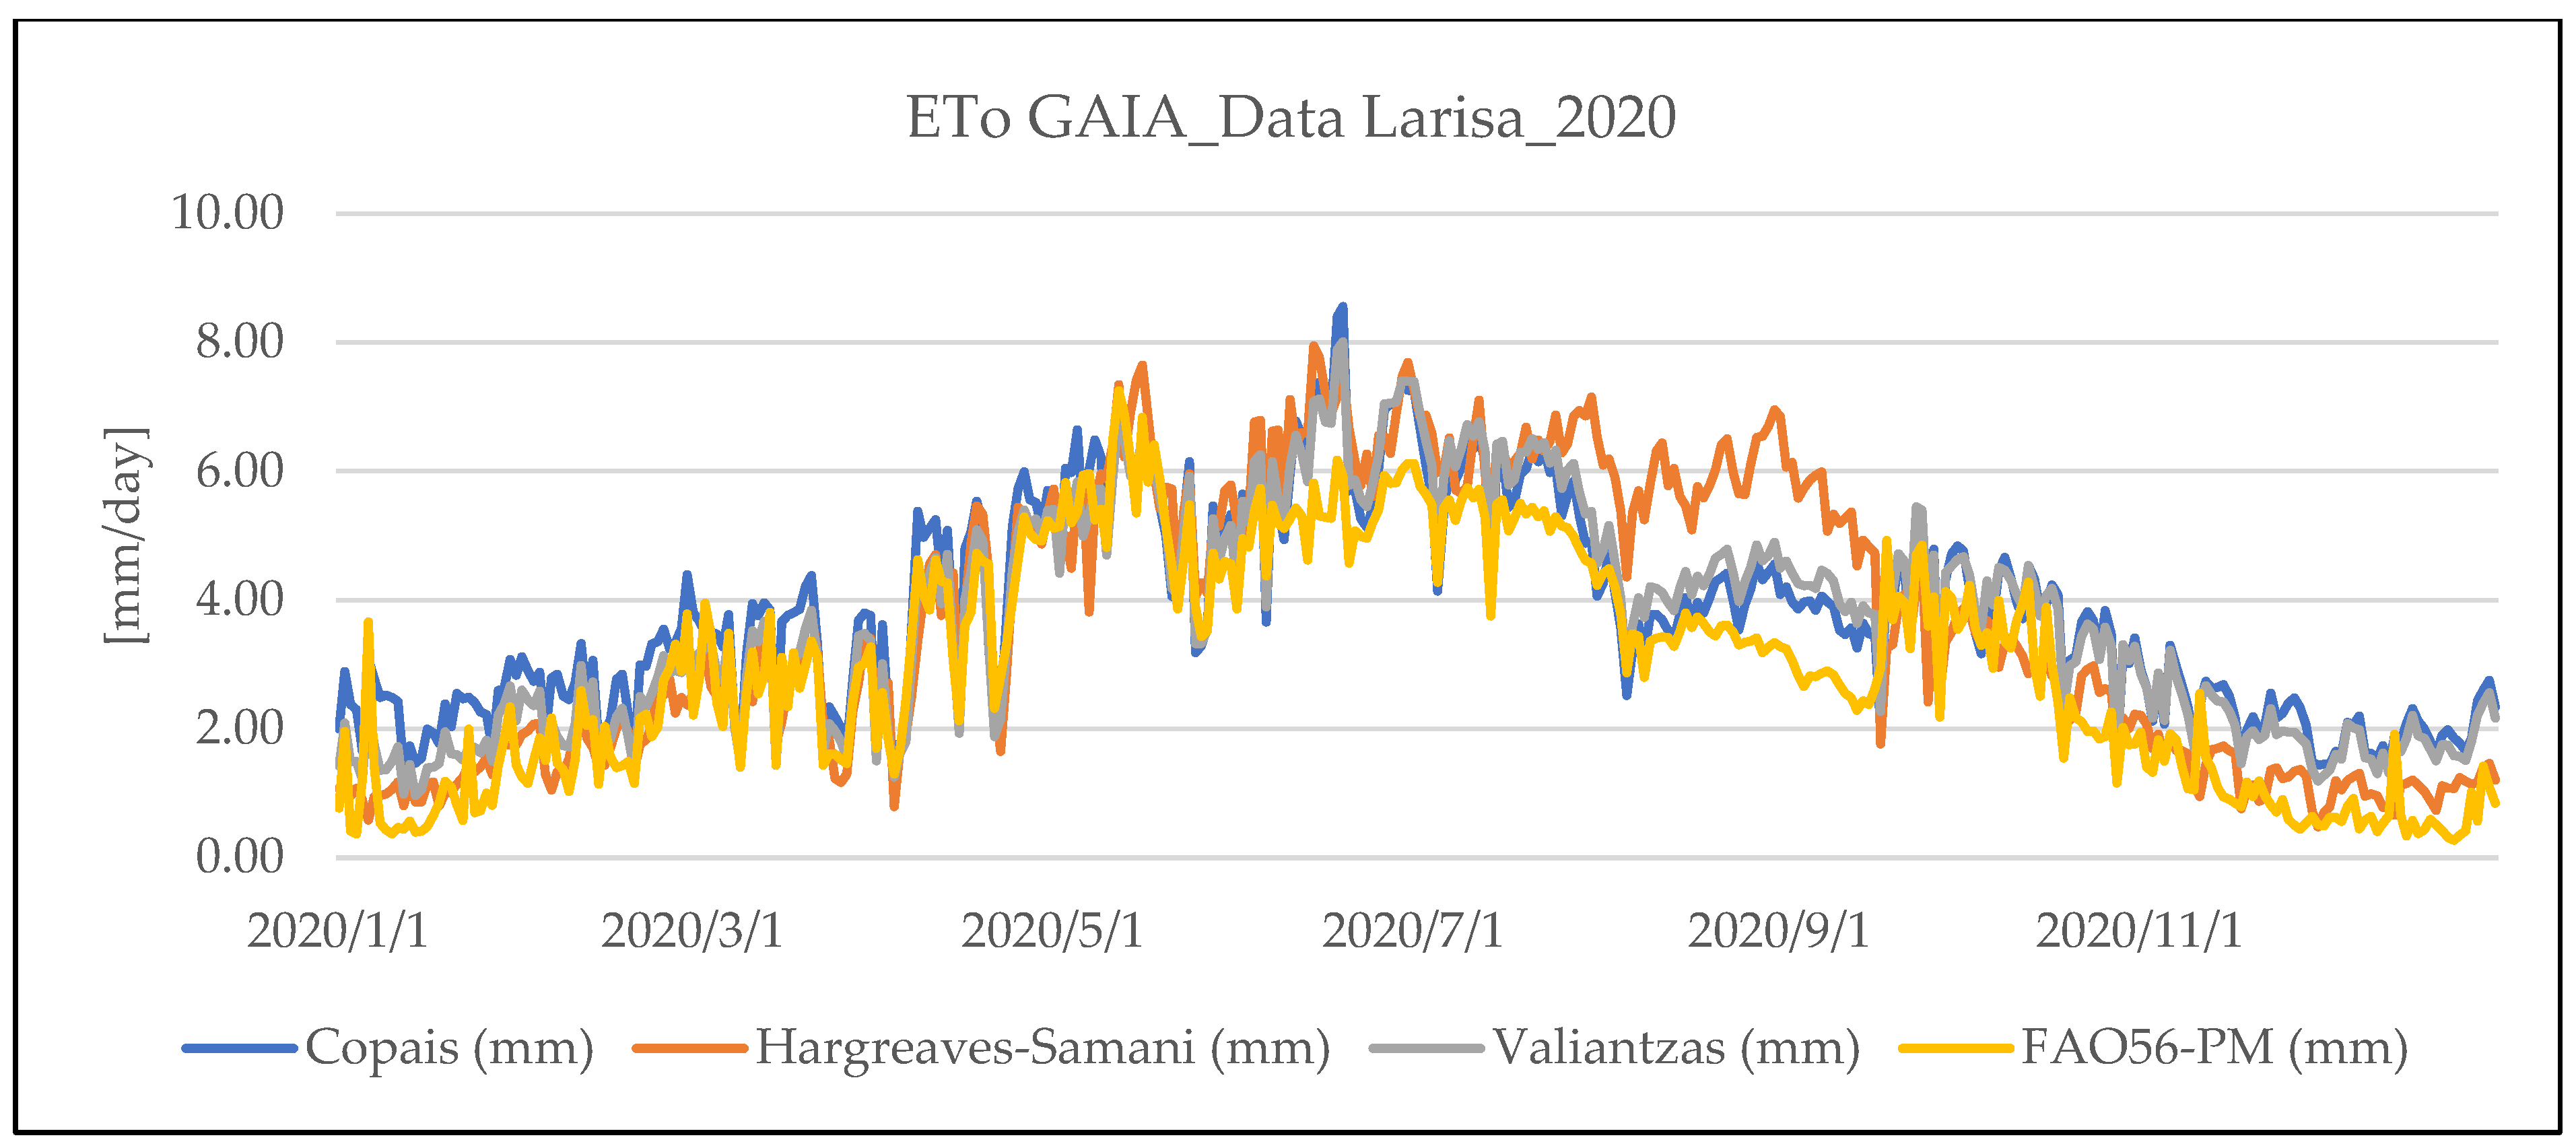
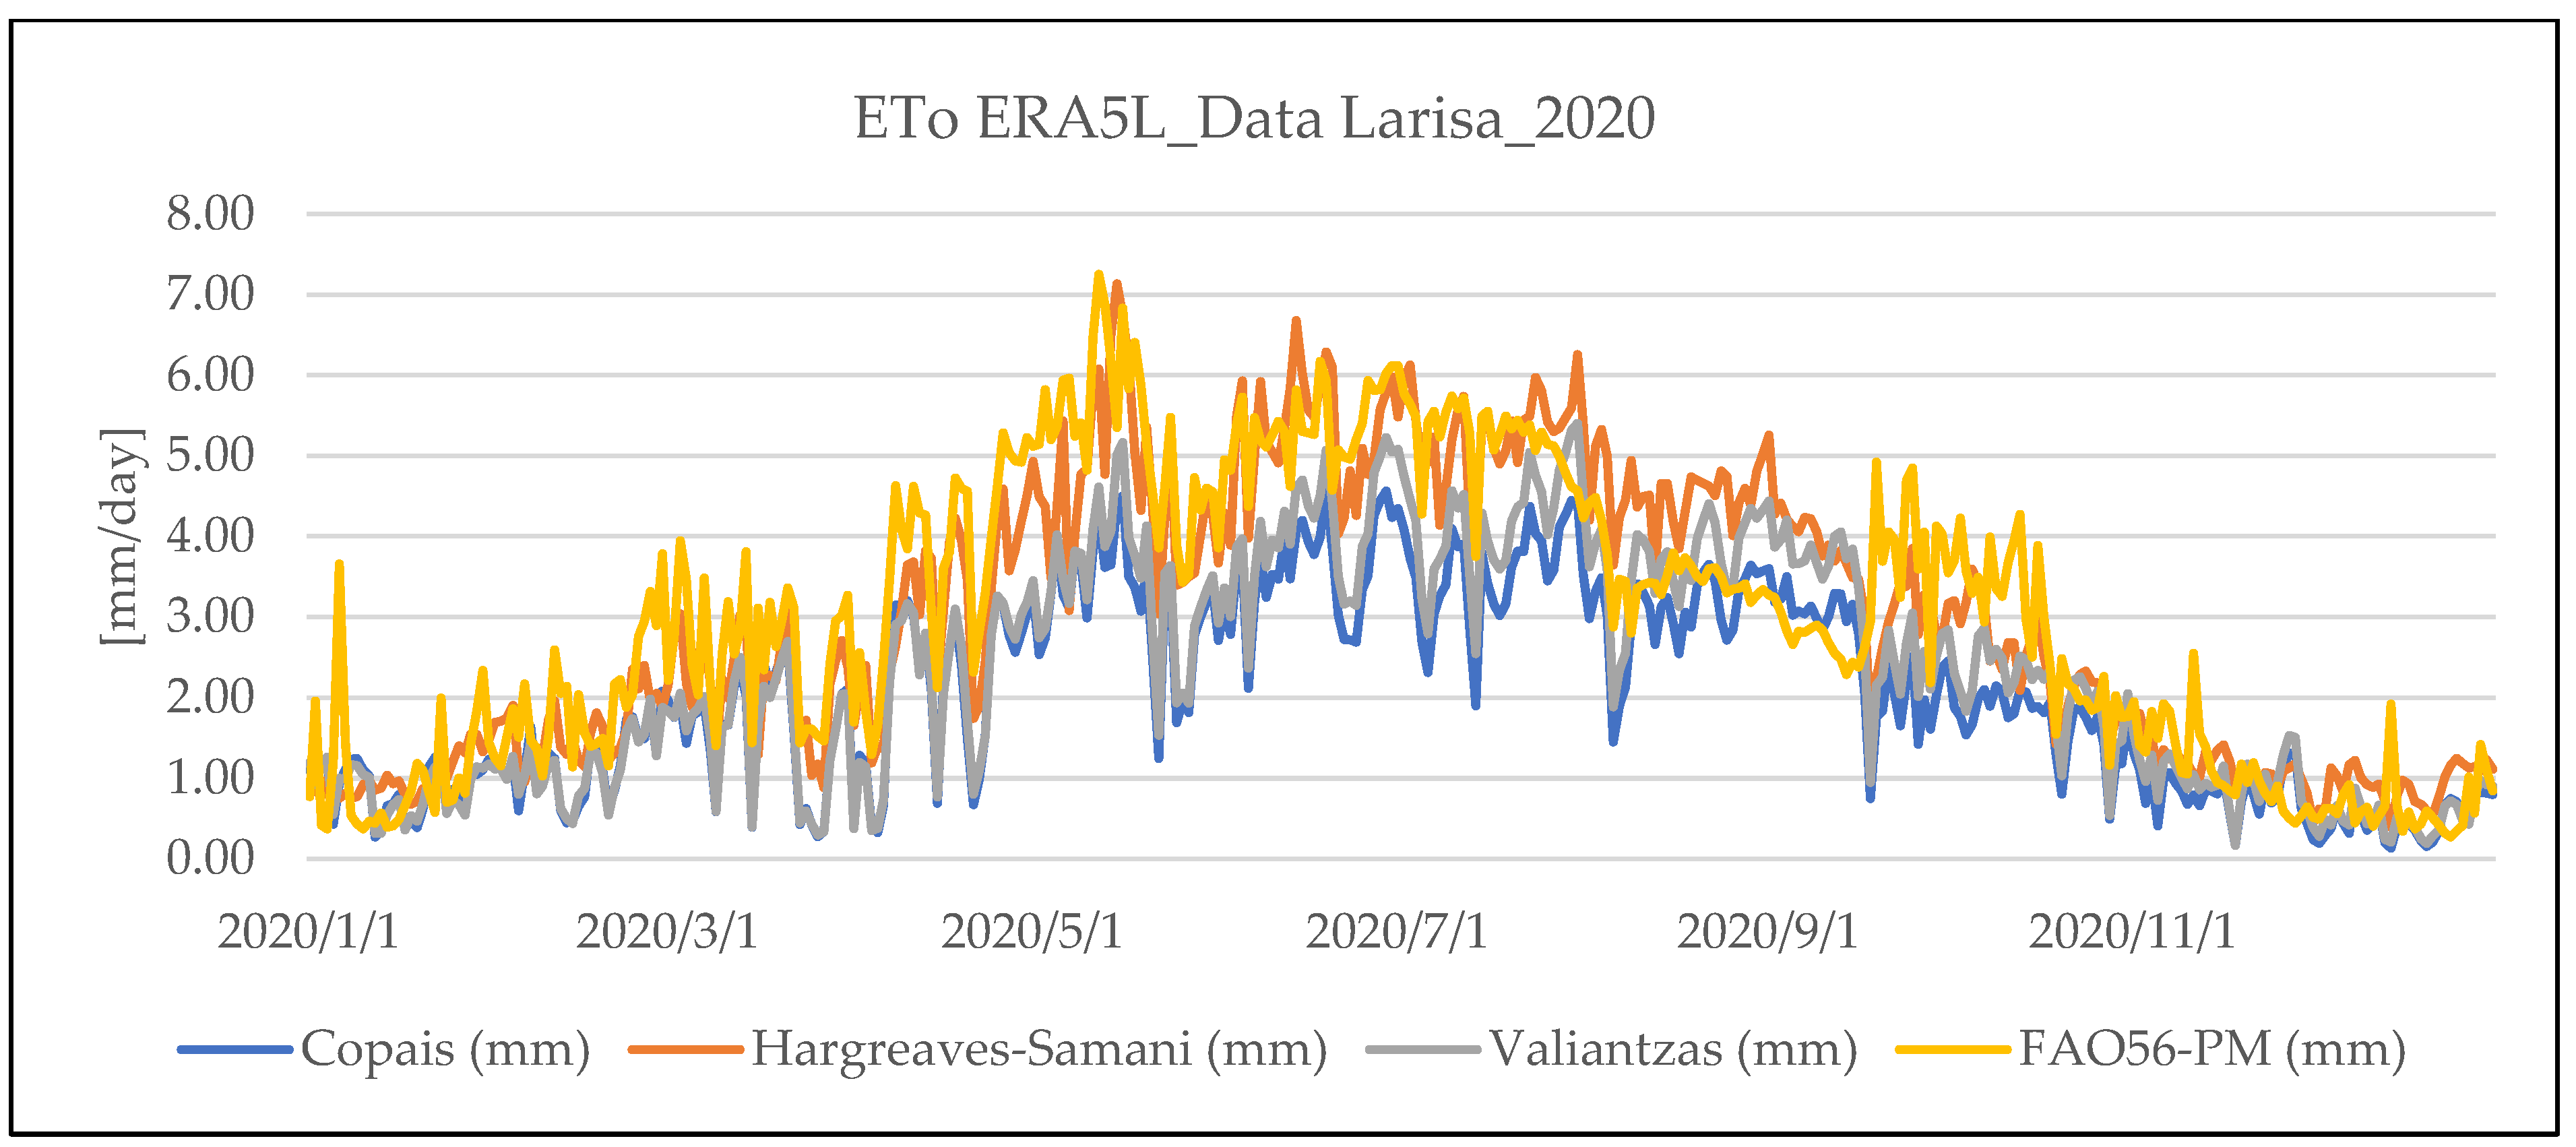
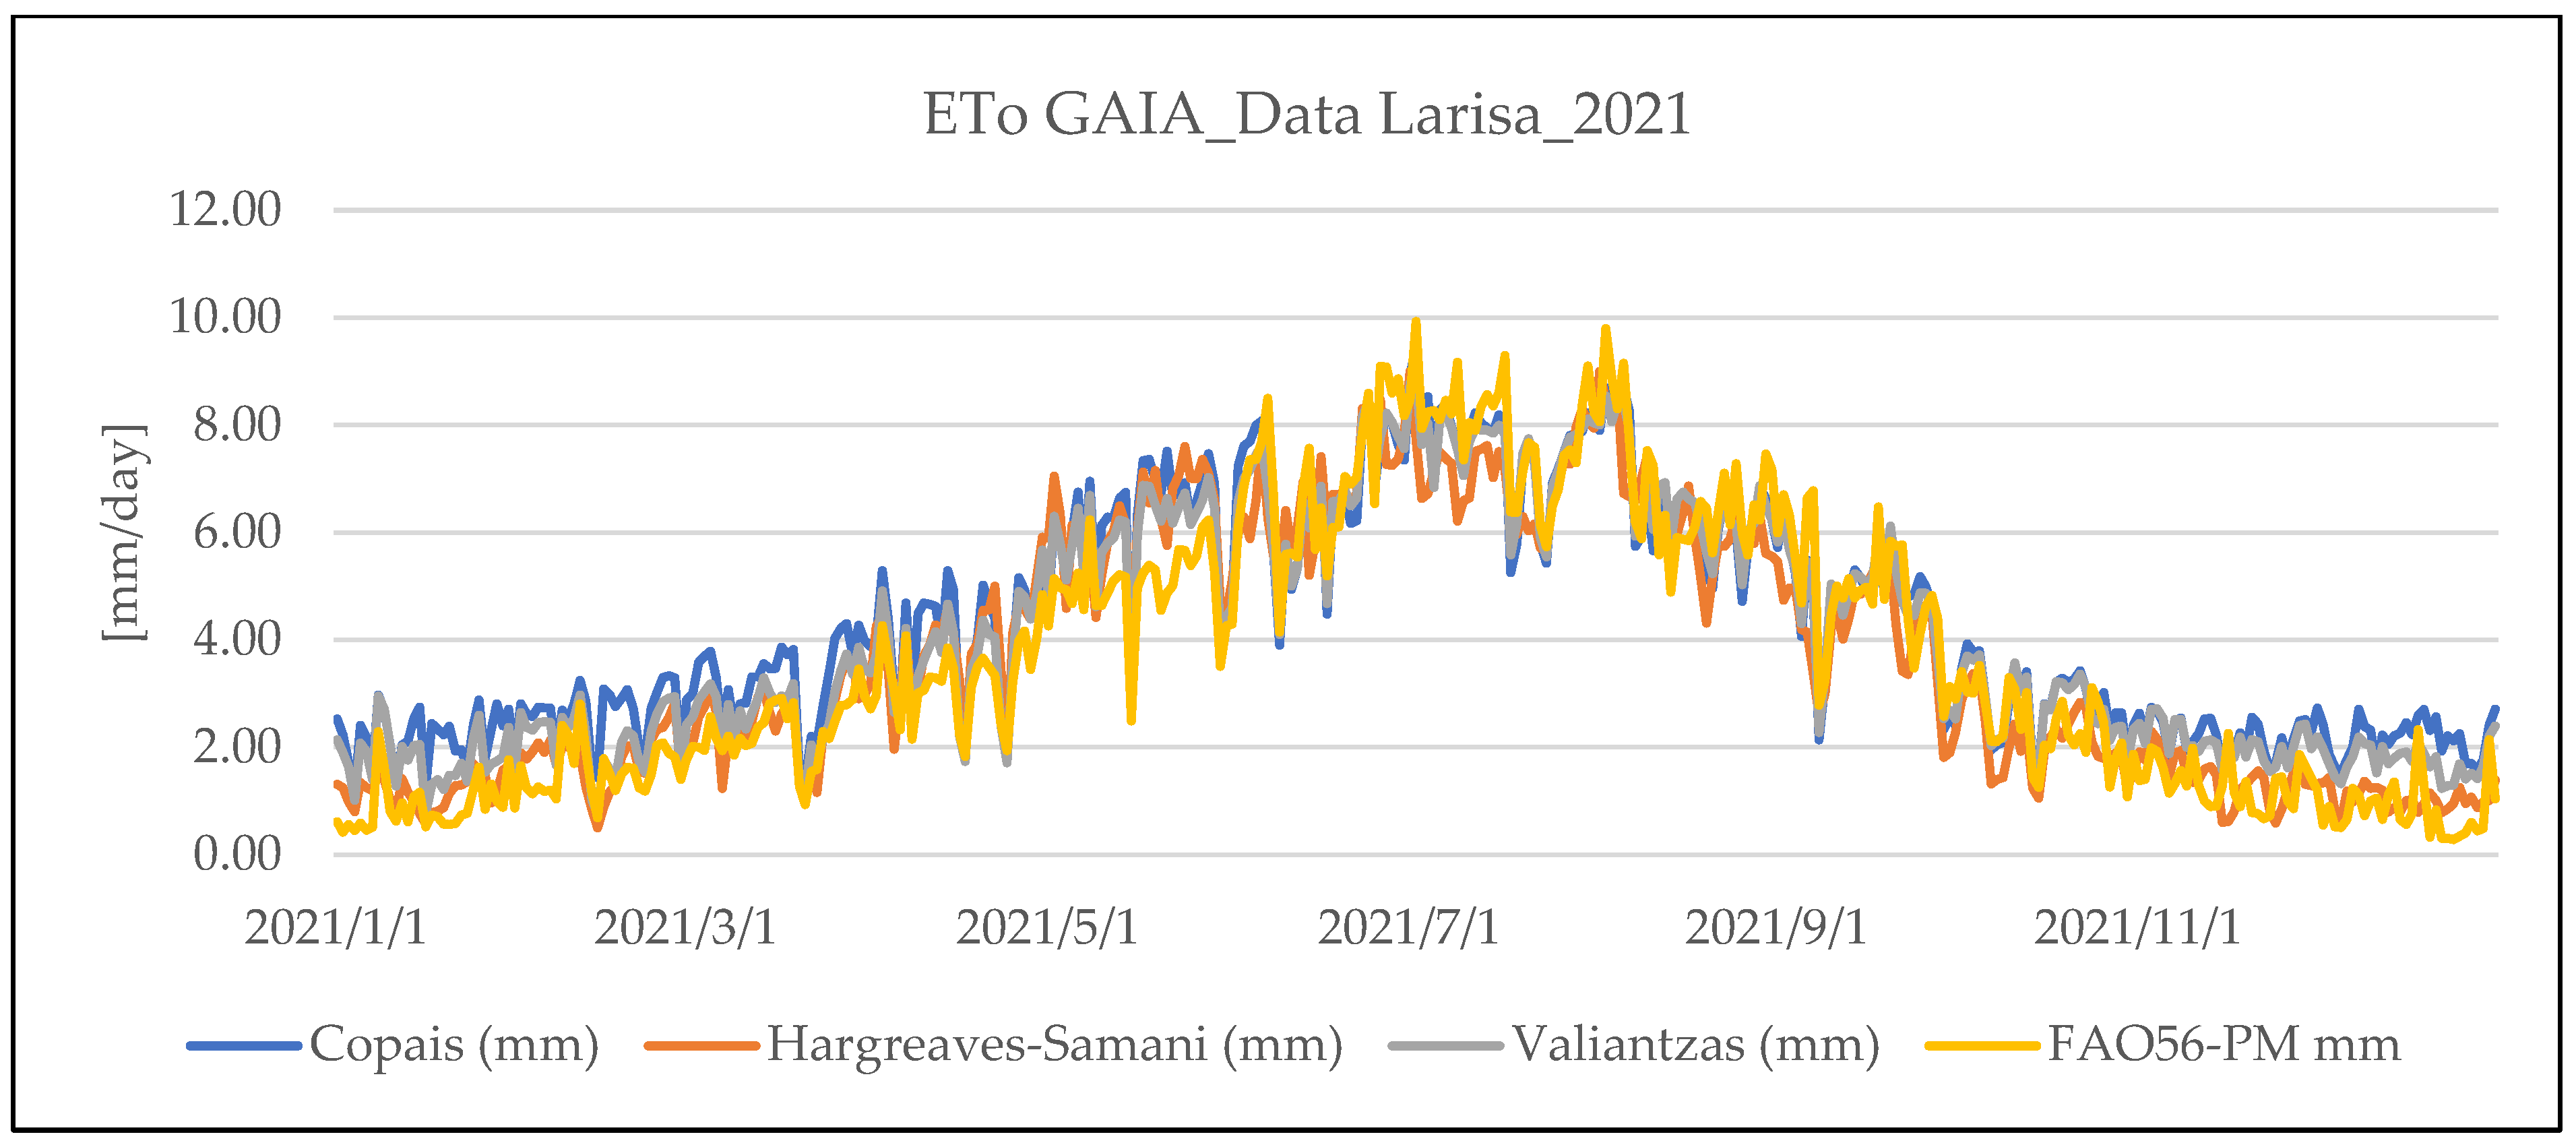
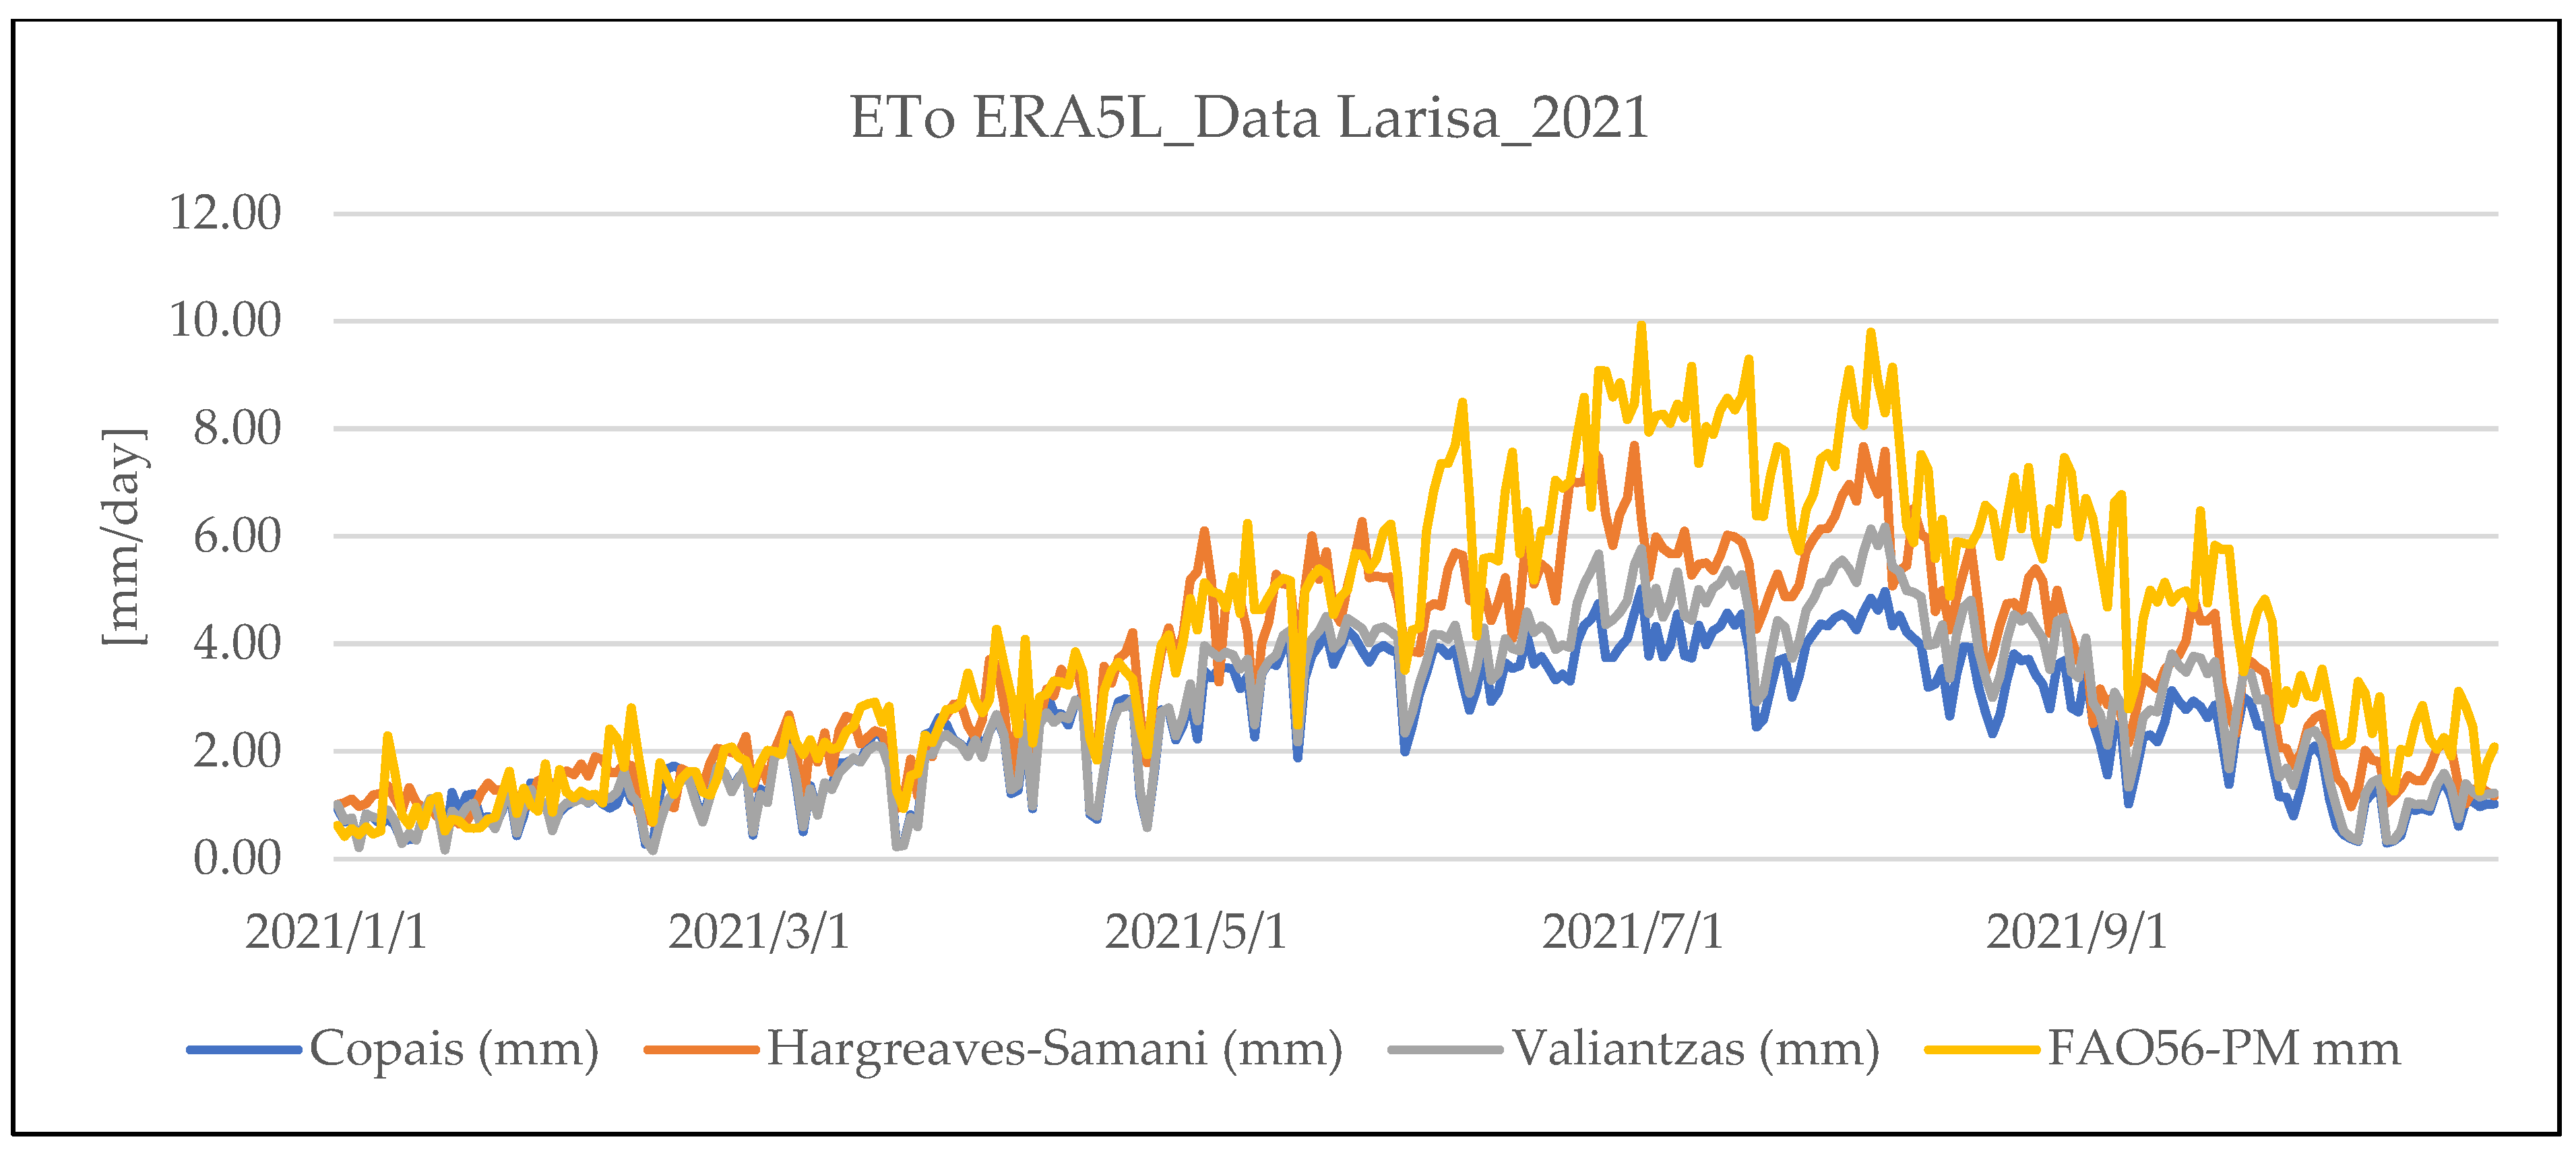
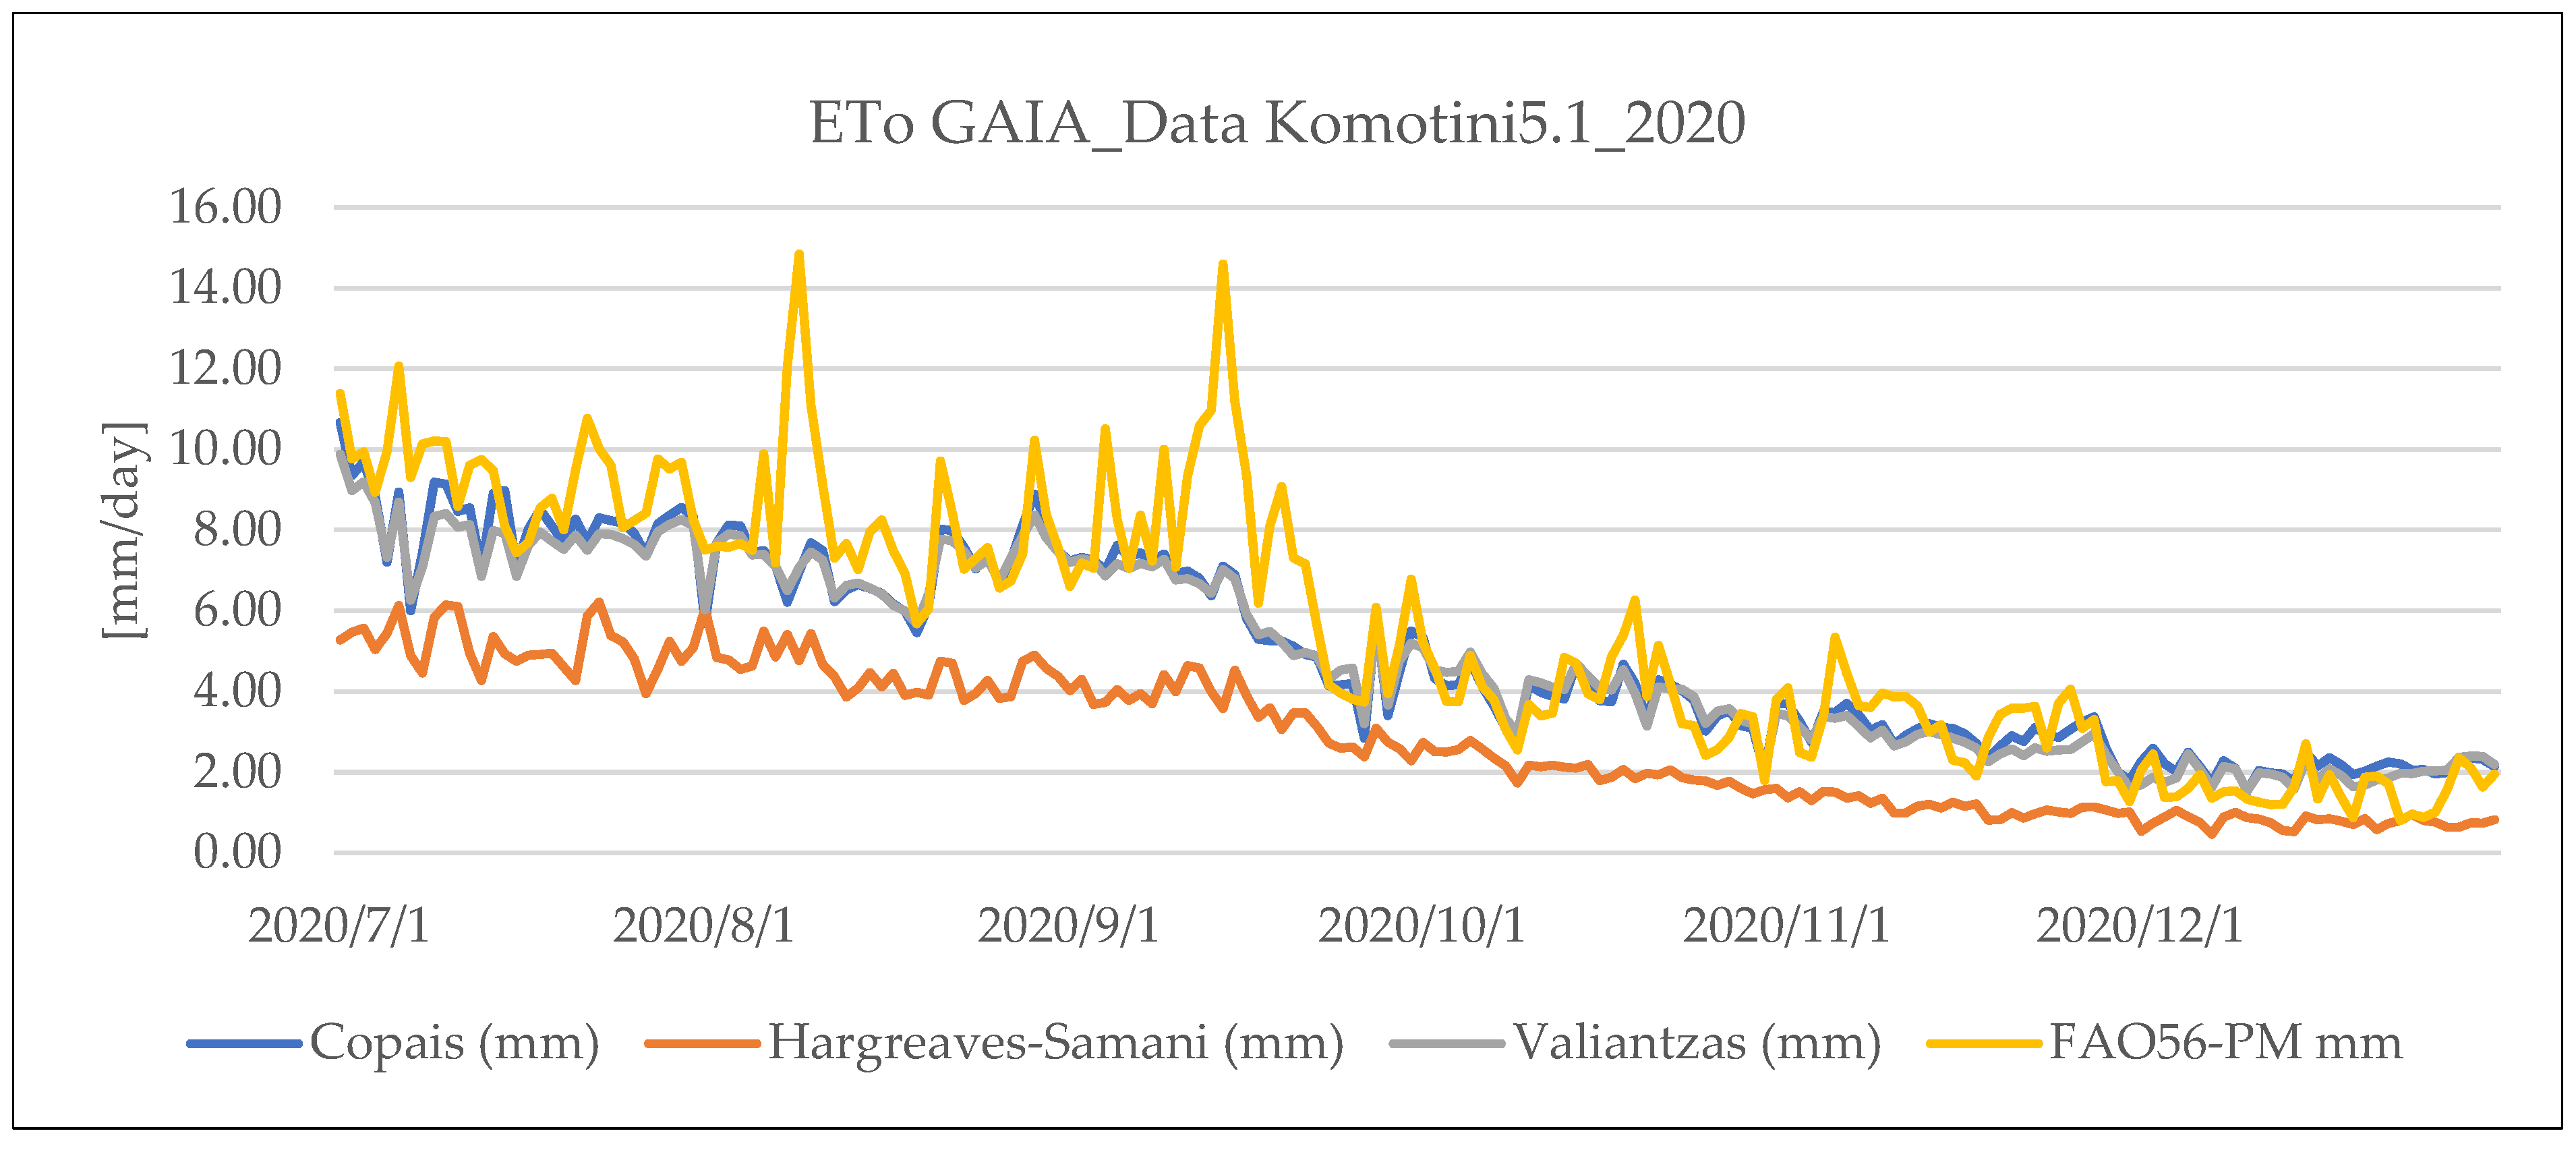
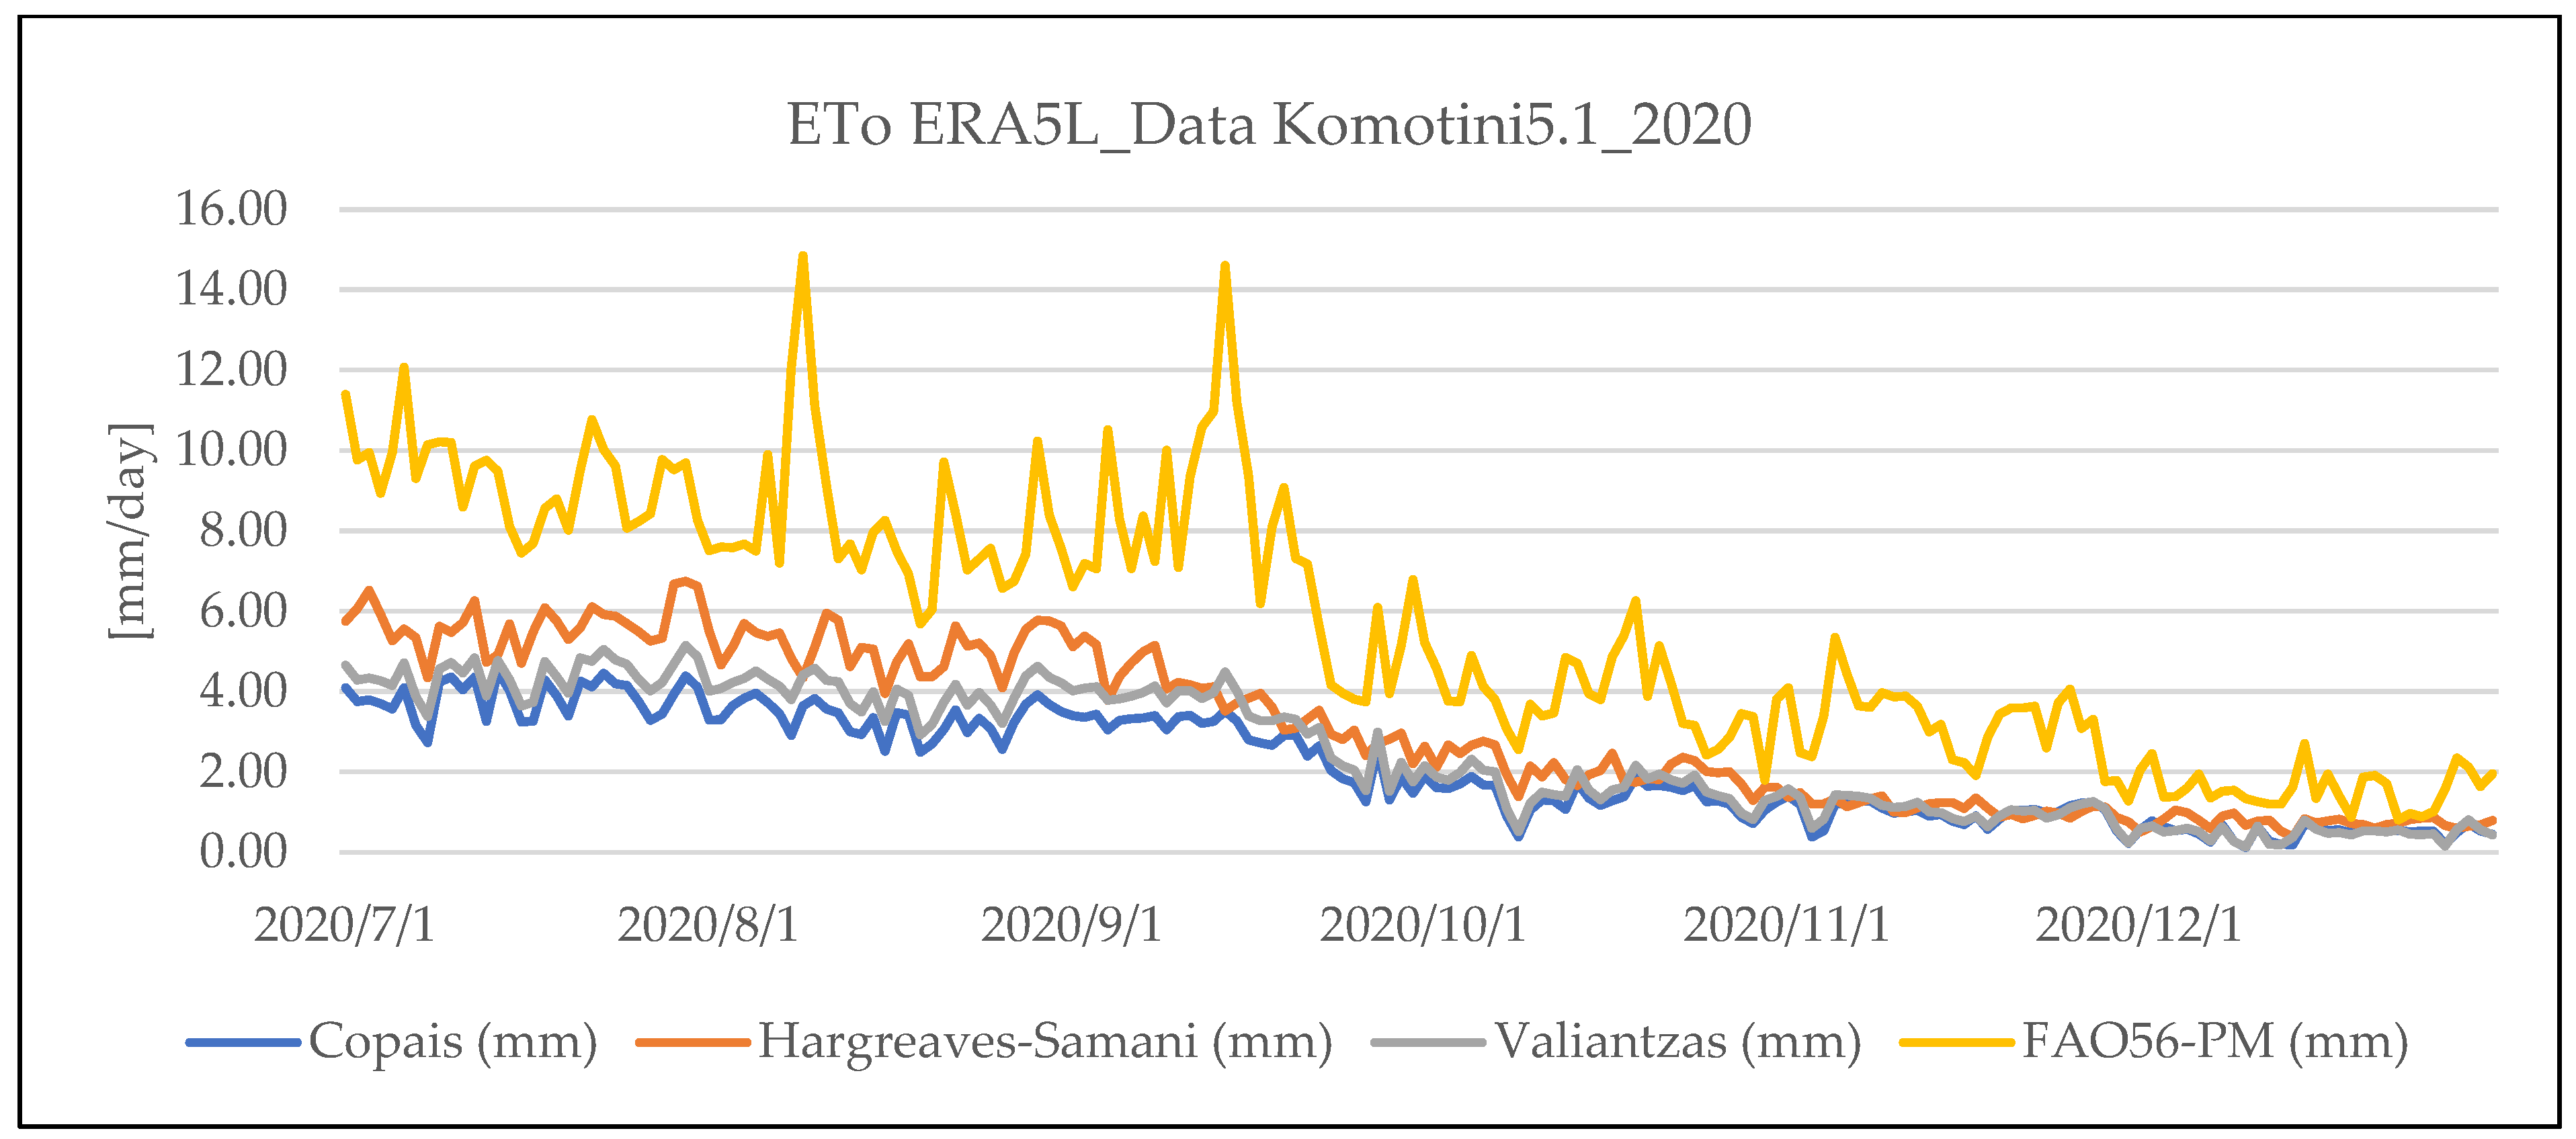
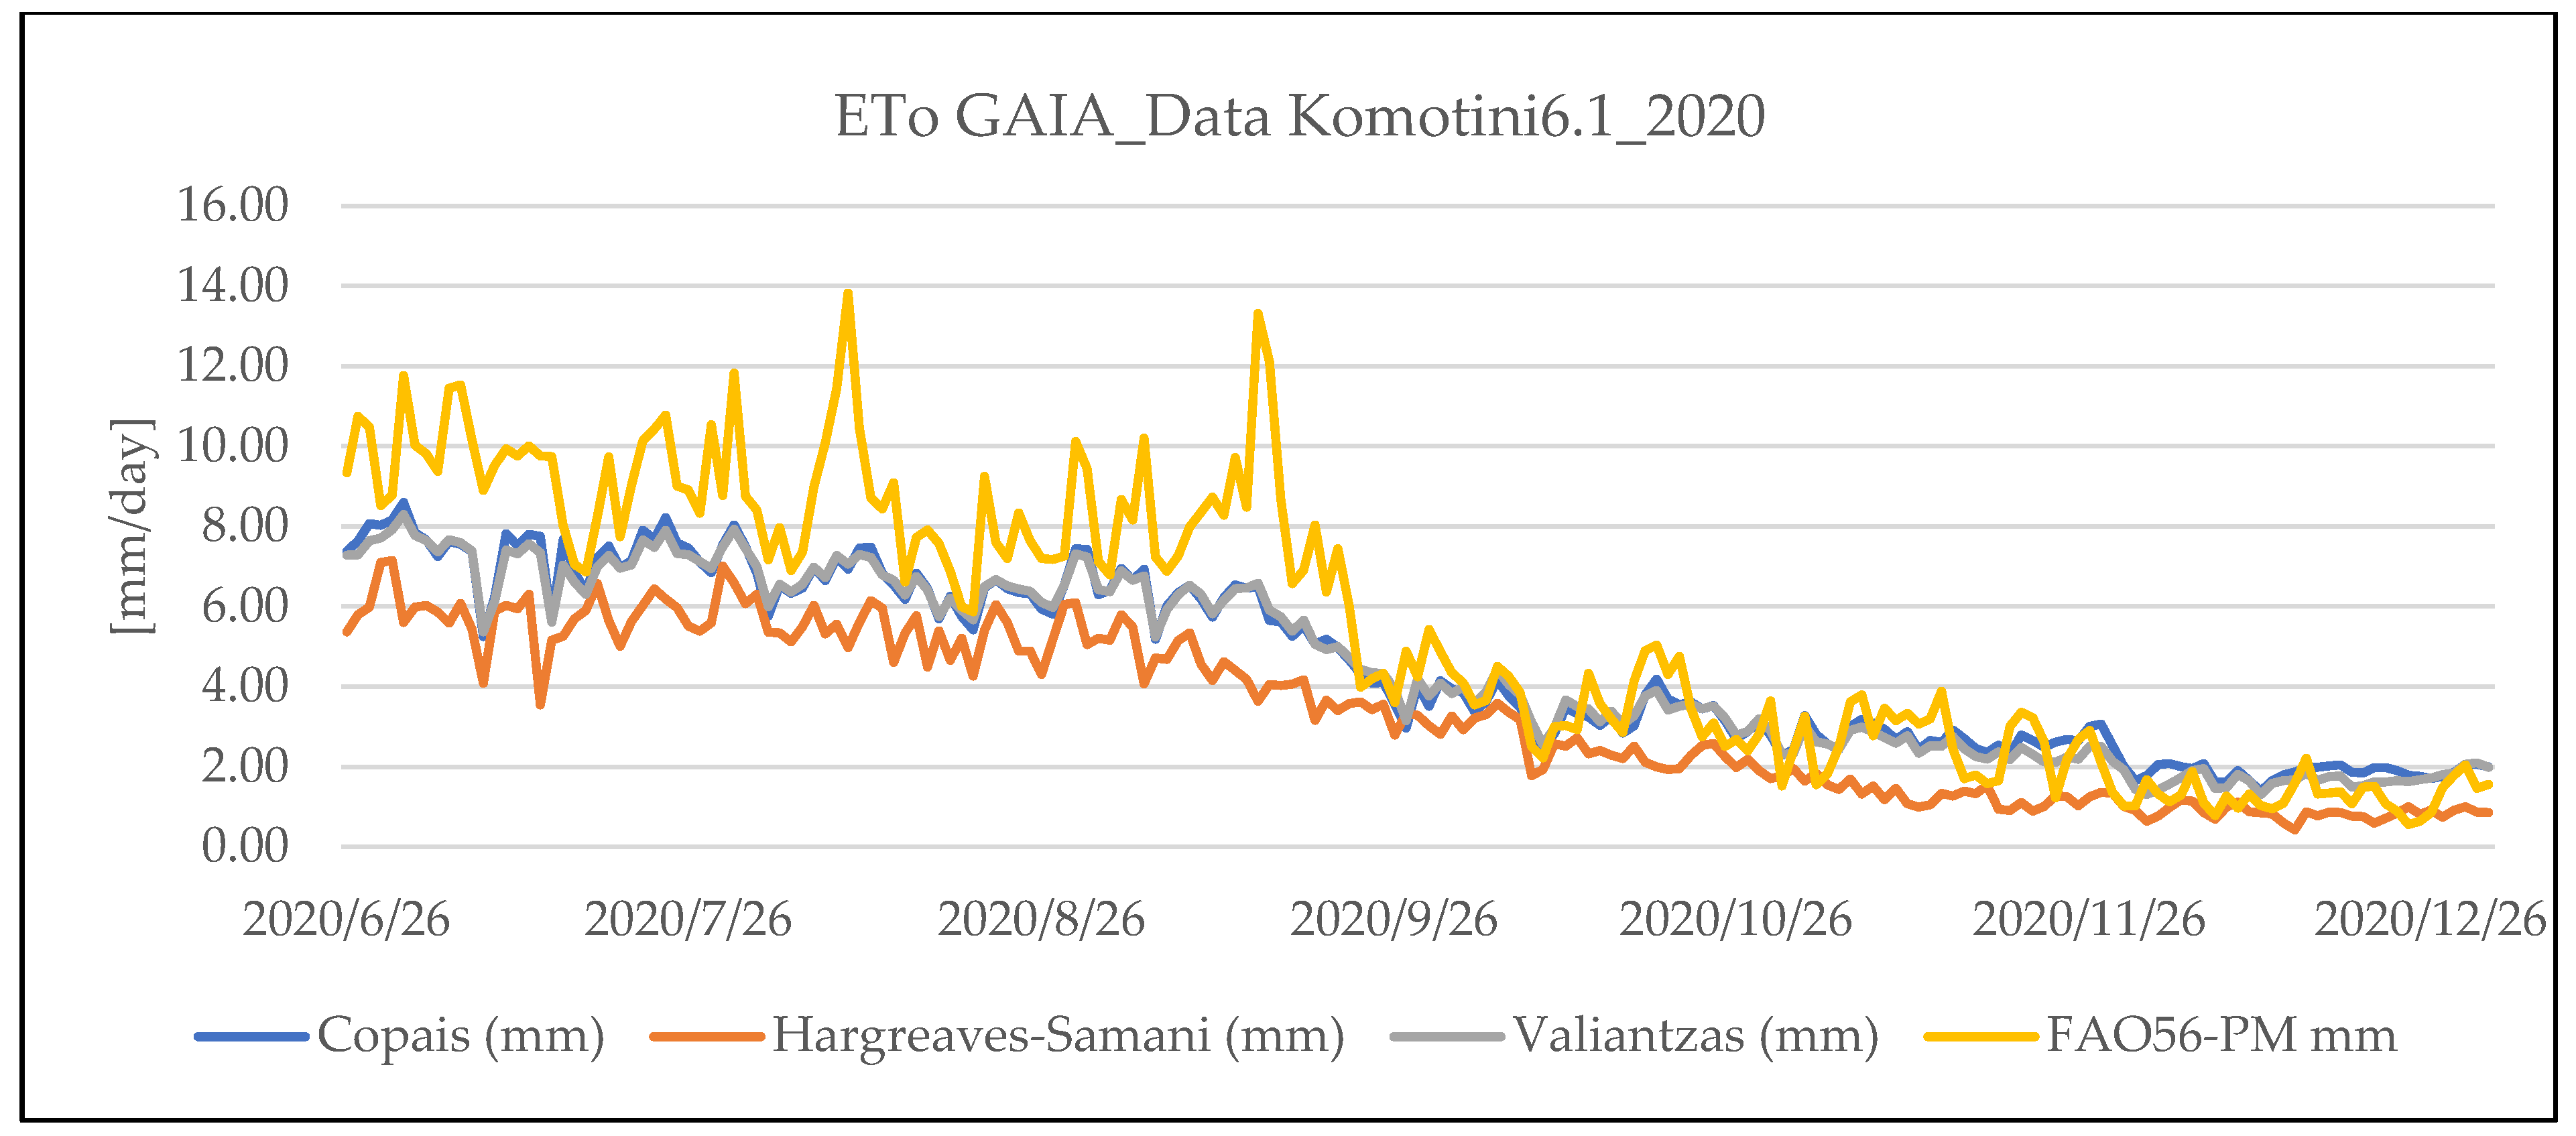
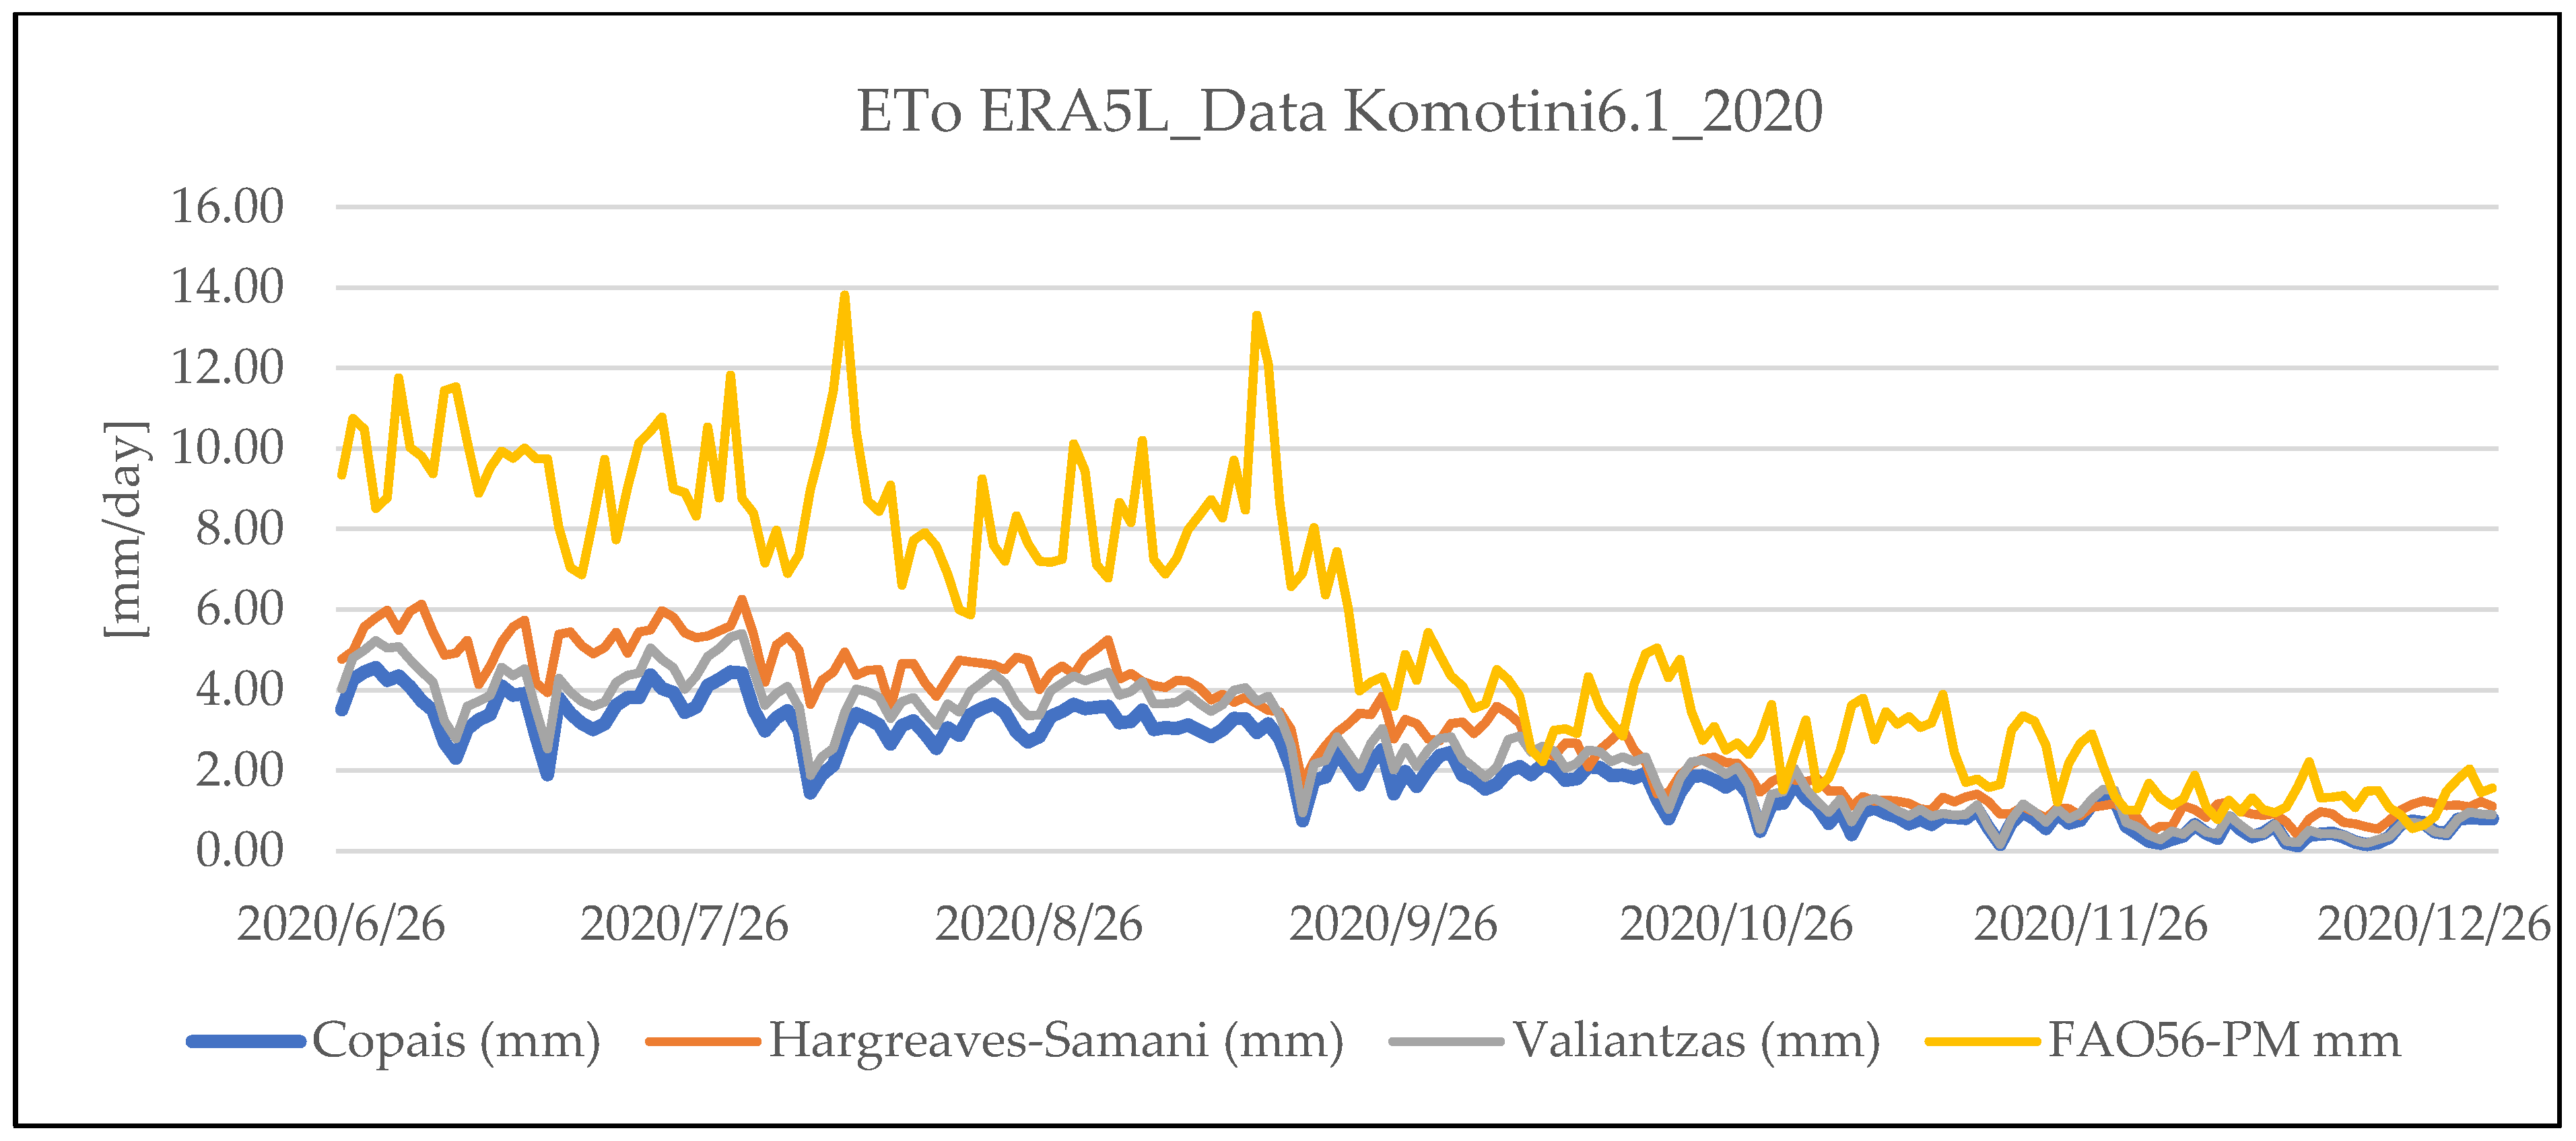
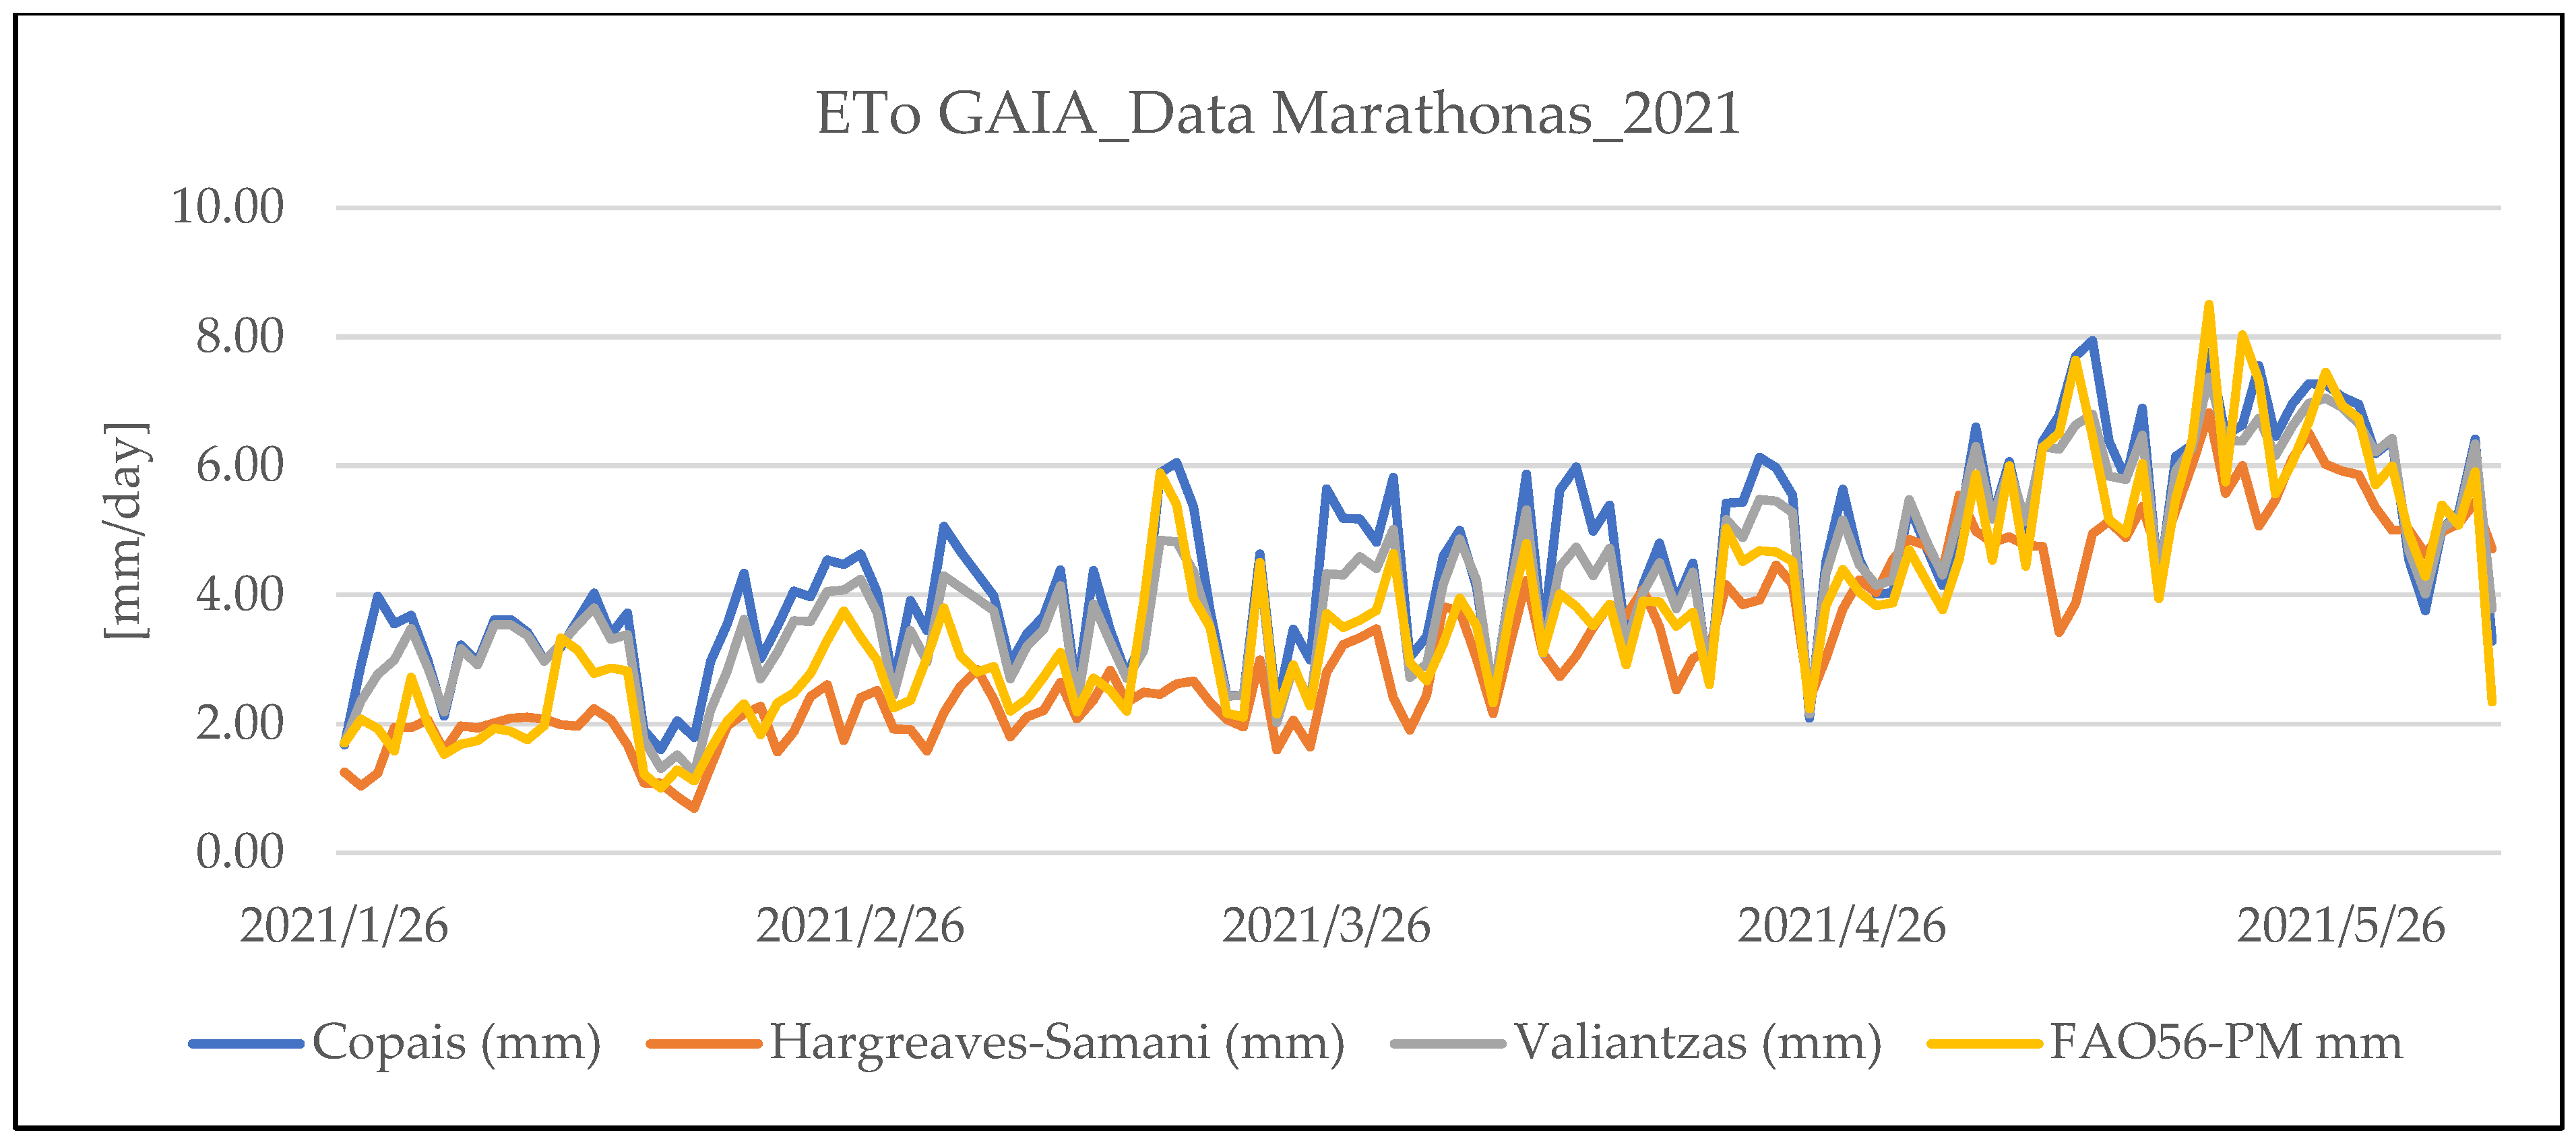
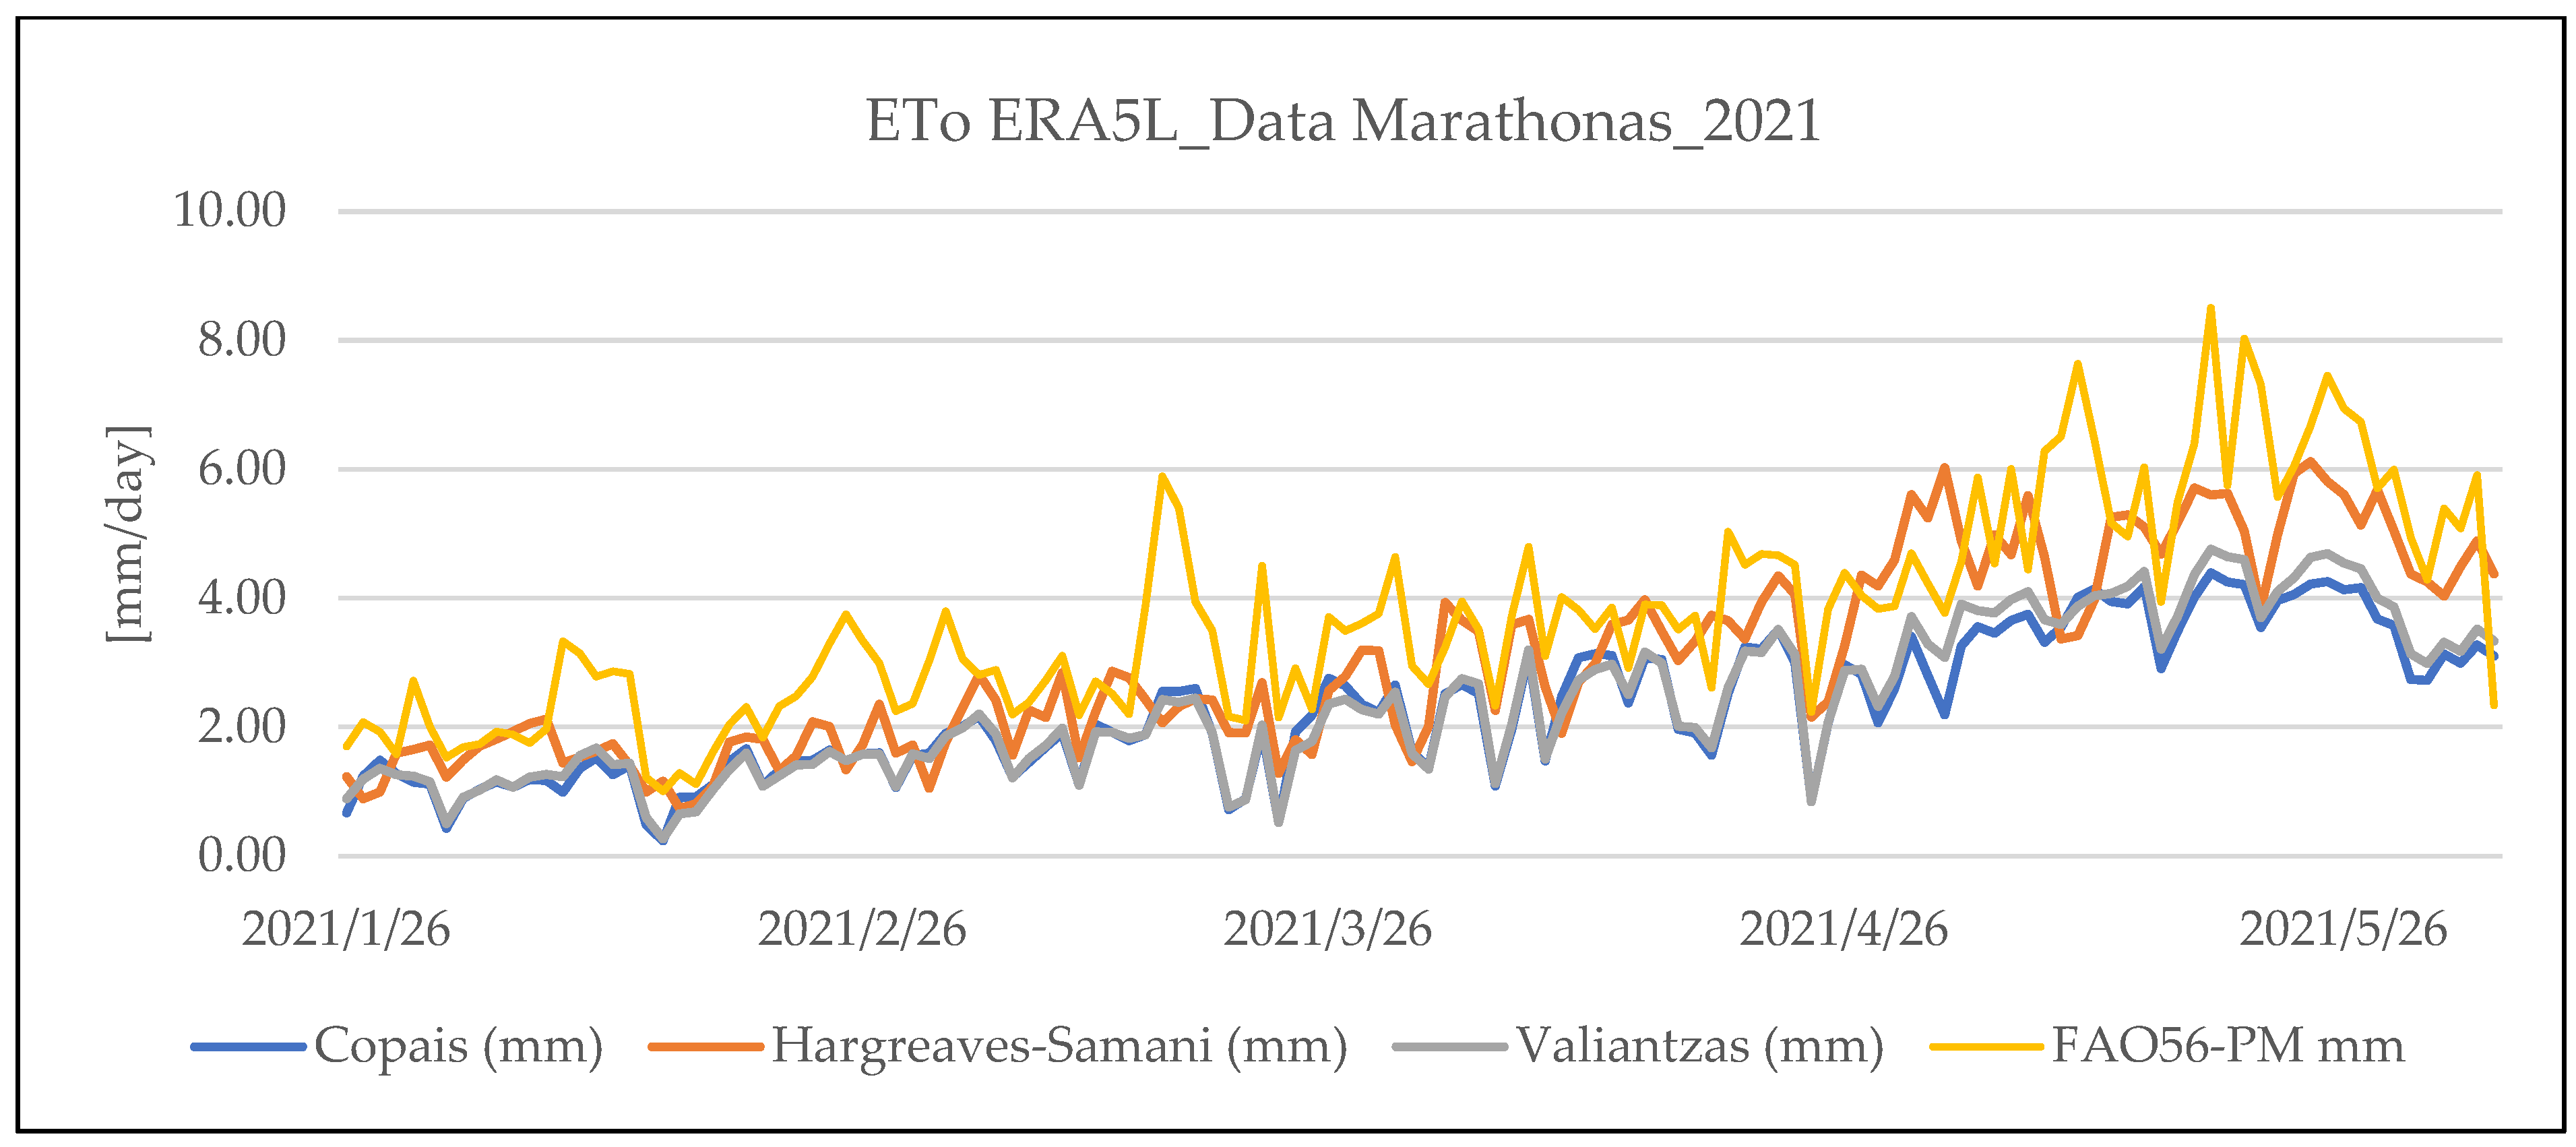
Out of six cultivation periods, there was only one occasion where one methodology, Hargreaves-Samani, properly estimated the cumulative ETo. On the other five occasions, all approaches when fed with ERA5-Land data showed significant underestimation in comparison to ETo calculated by FAO56-PM and GAIAtron data. The above finding is in agreement with similar research conducted in northern Ethiopia, where remote sensing data resulted in underestimation of ETo compared to ground stations [53]. However, another example of estimating ETo with remote sensing products in the state of Indiana, U.S.A., showed different results, with remote sensing products estimating greater values of ETo than ground-based estimations [54].
The difference ranged from 19 to 62% of the reference value. Additionally, the daily RMSE stood higher than 1 mm/d in all five non-accurate cases, greater than 10% of the maximum daily FAO56-PM ETo corresponding values. Thus, it is evident that the direct use of reanalysis data cannot provide precise estimates of ETo [25], and some bias correction procedures remain necessary. However, ERA5-Land may provide critical insights on ETo, especially in data-scarce areas, due to its consistent data production rate [51].
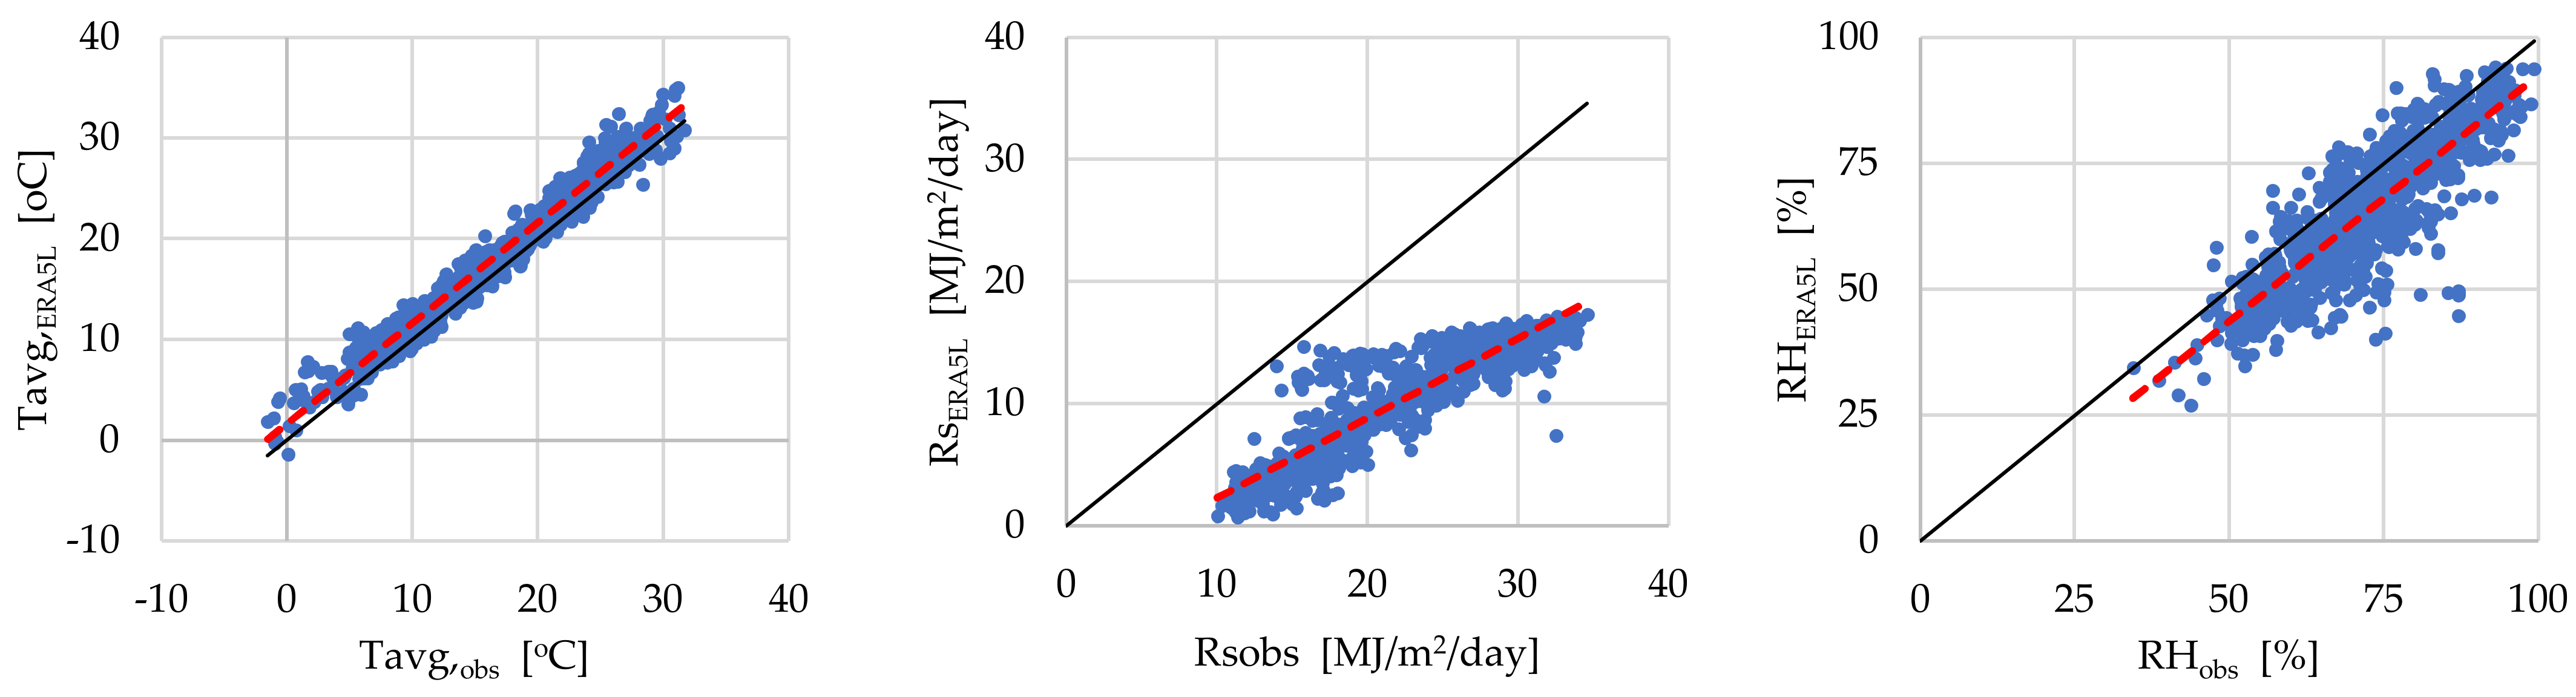
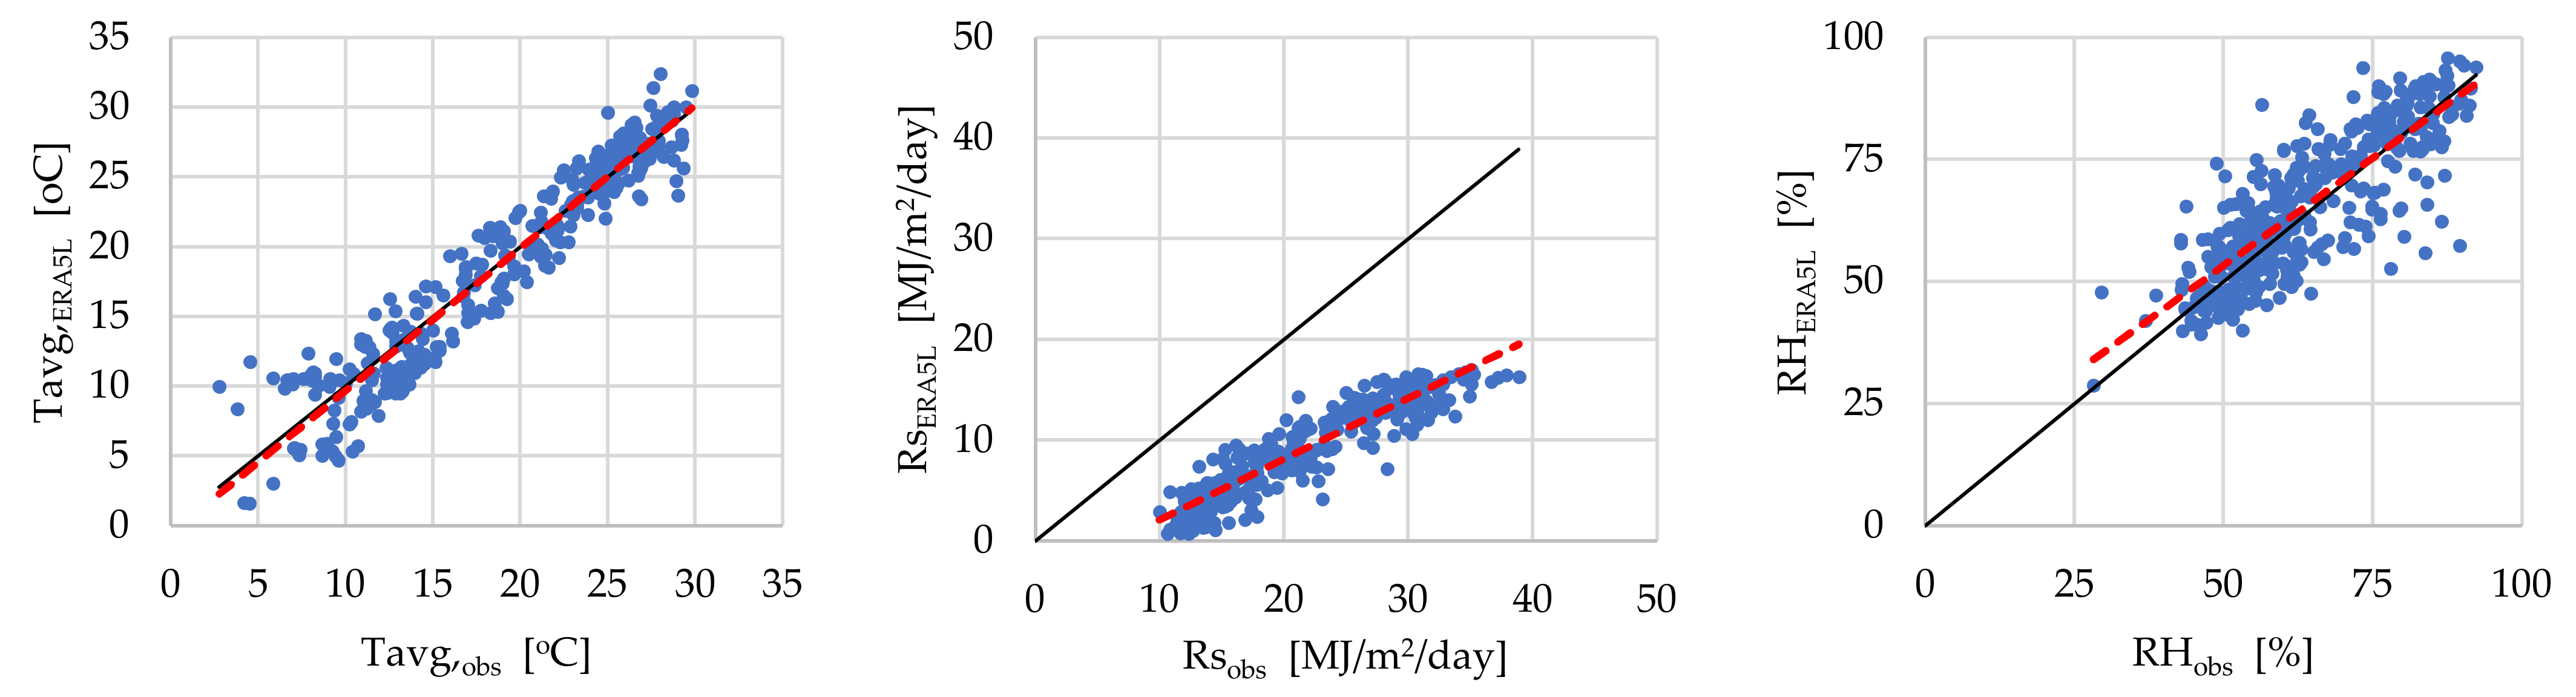
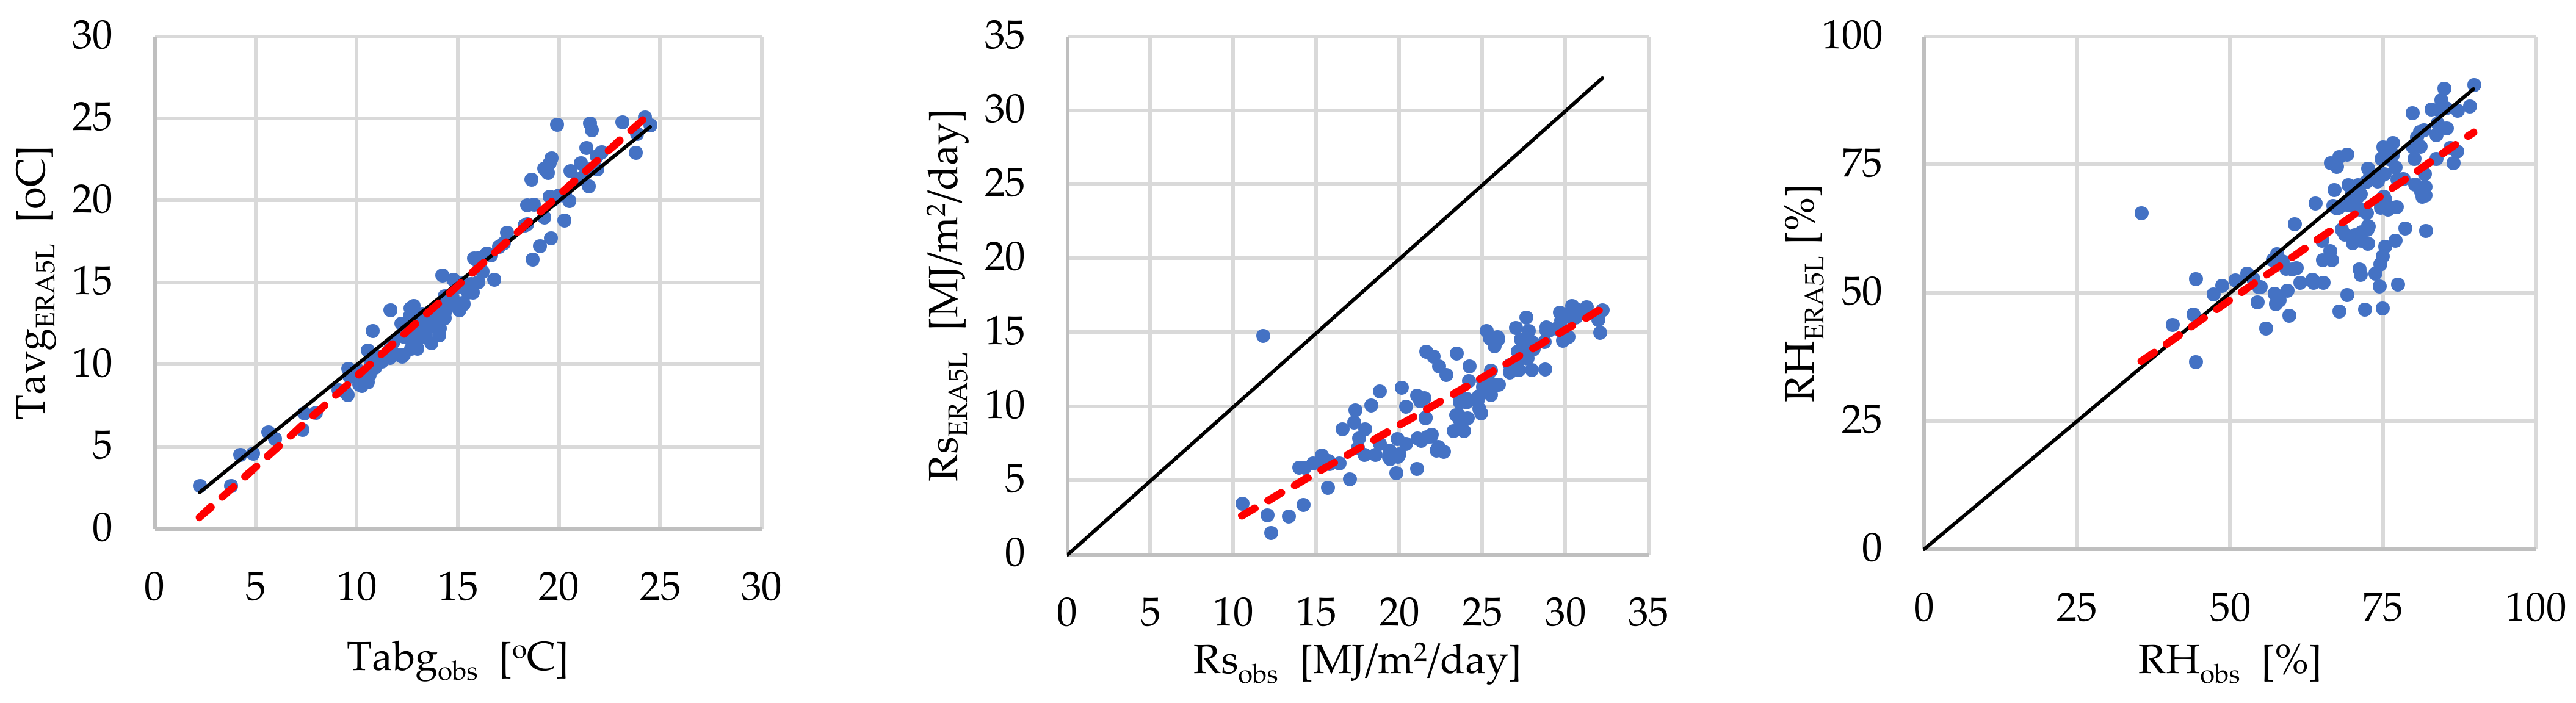
Additionally, the present research compared the unique agrometeorological variables commonly used to estimate ETo by their data source. ERA5-Land derived incoming solar radiation and relative humidity with moderate accuracy compared to GAIAtron data, affecting the estimated values of ETo. Similar research conducted in Italy with a significantly larger number of study sites and lengthier available timeseries showed better performance of Rs estimation by ERA5-Land compared to the Greek sites examined, while the performance of estimating RH was found to be similar [52]. On the contrary, temperature records presented high accuracy levels in every site and cultivation period. This finding is in agreement with similar research where temperature was also found to be consistent and capable of being used to derive significant agricultural insights [52,55]. It should be noted that the limited available timeseries of the study sites may pose a limitation to the complete assessment of the performance of ERA5-Land estimations of the meteorological variables and consequently of ETo.
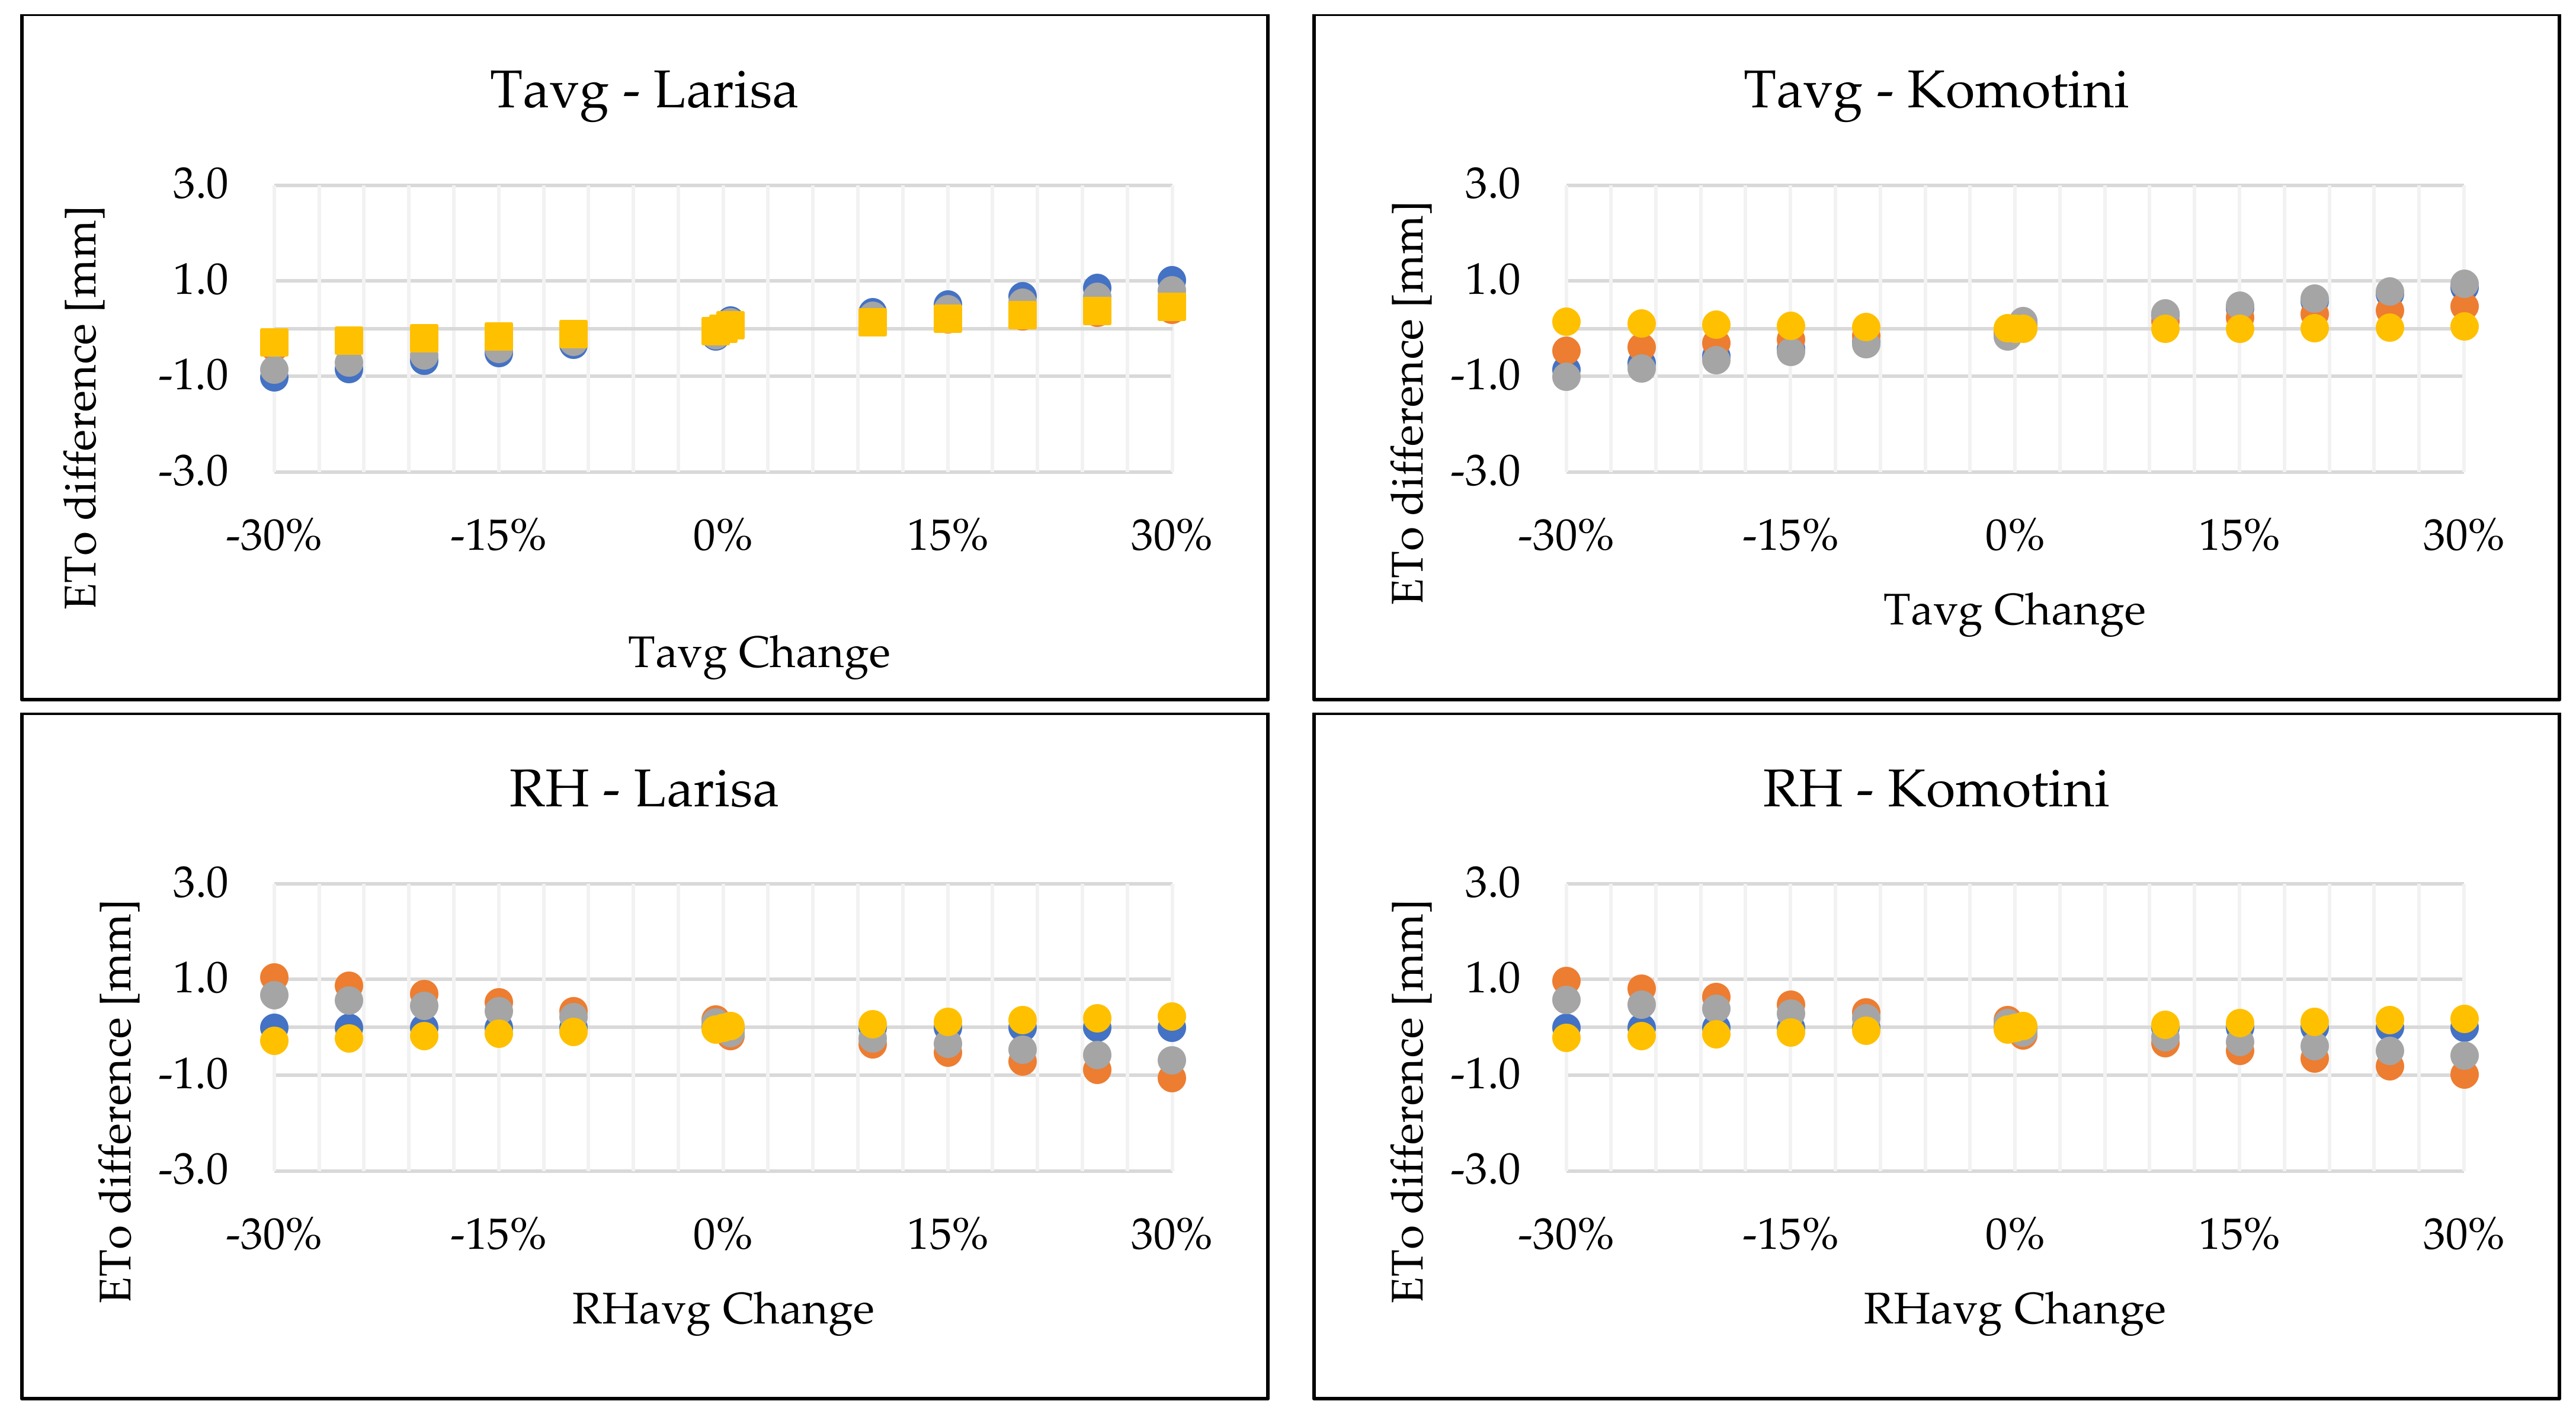
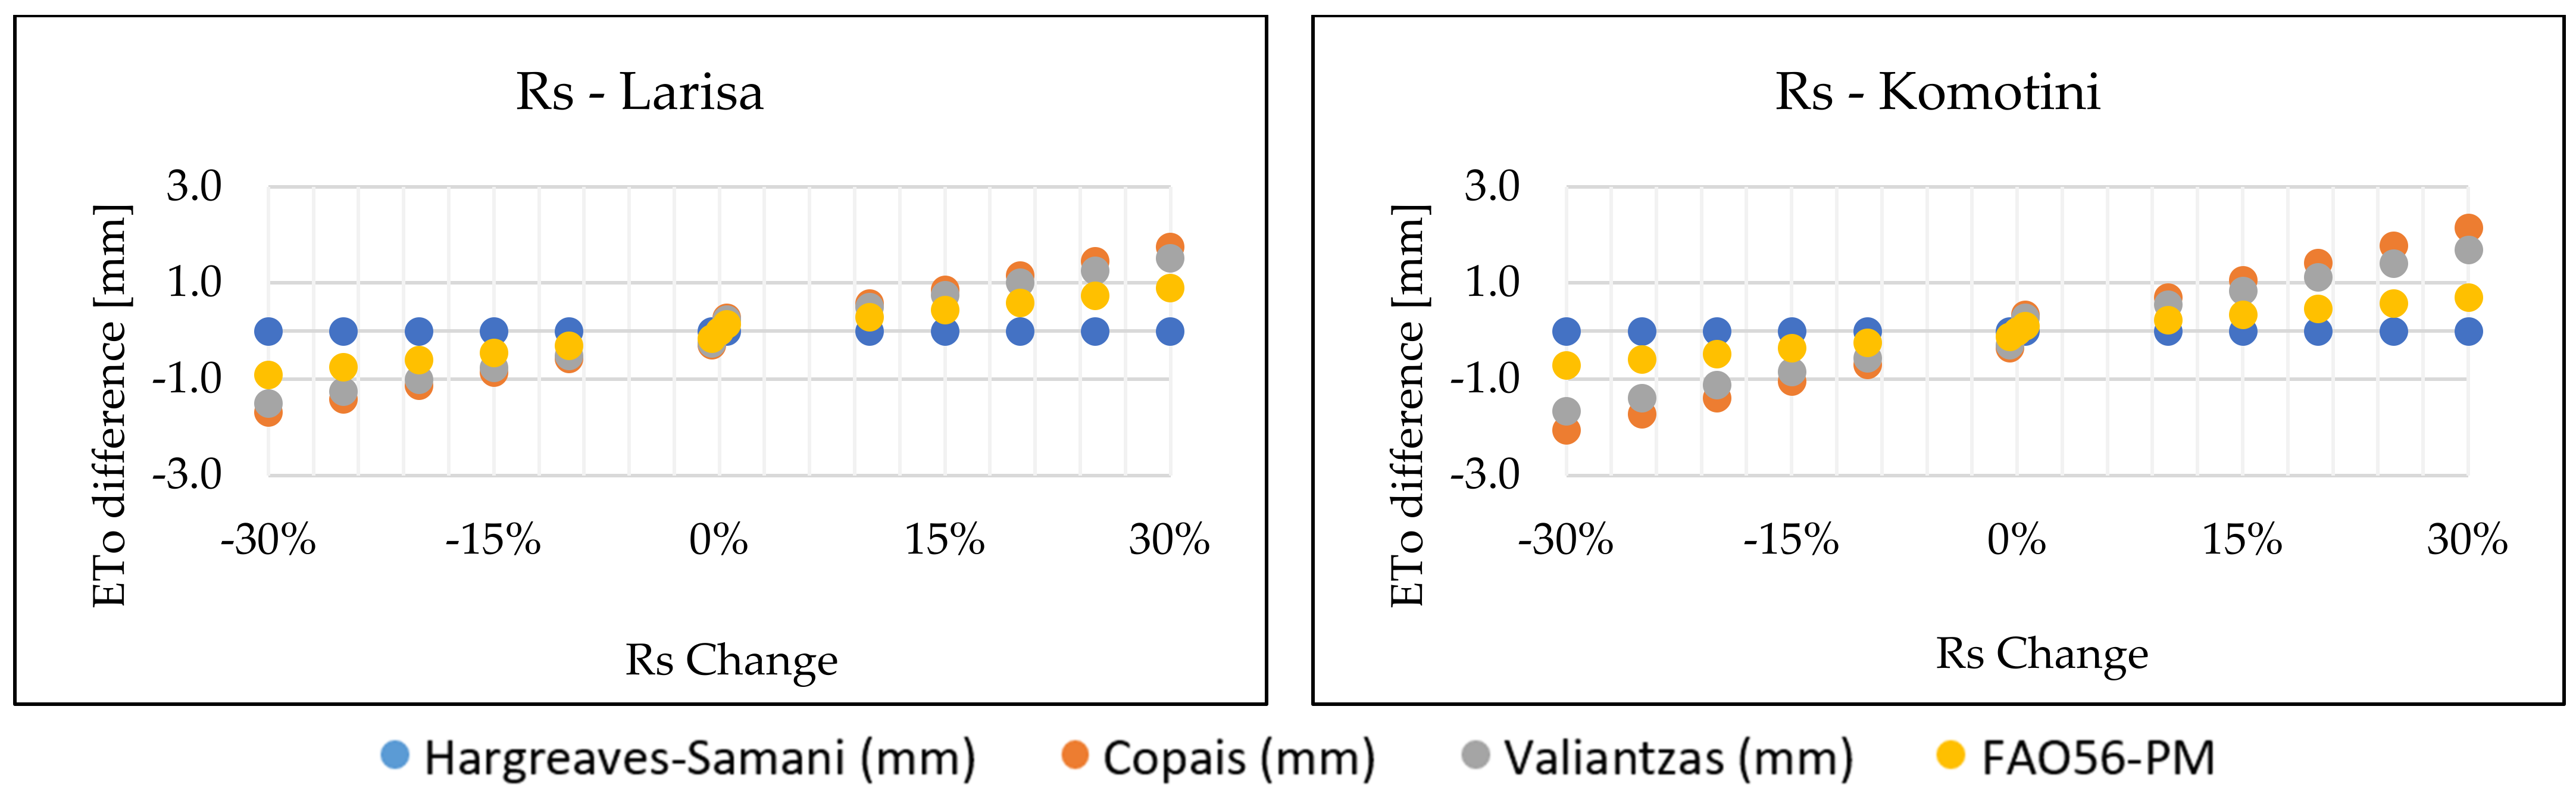
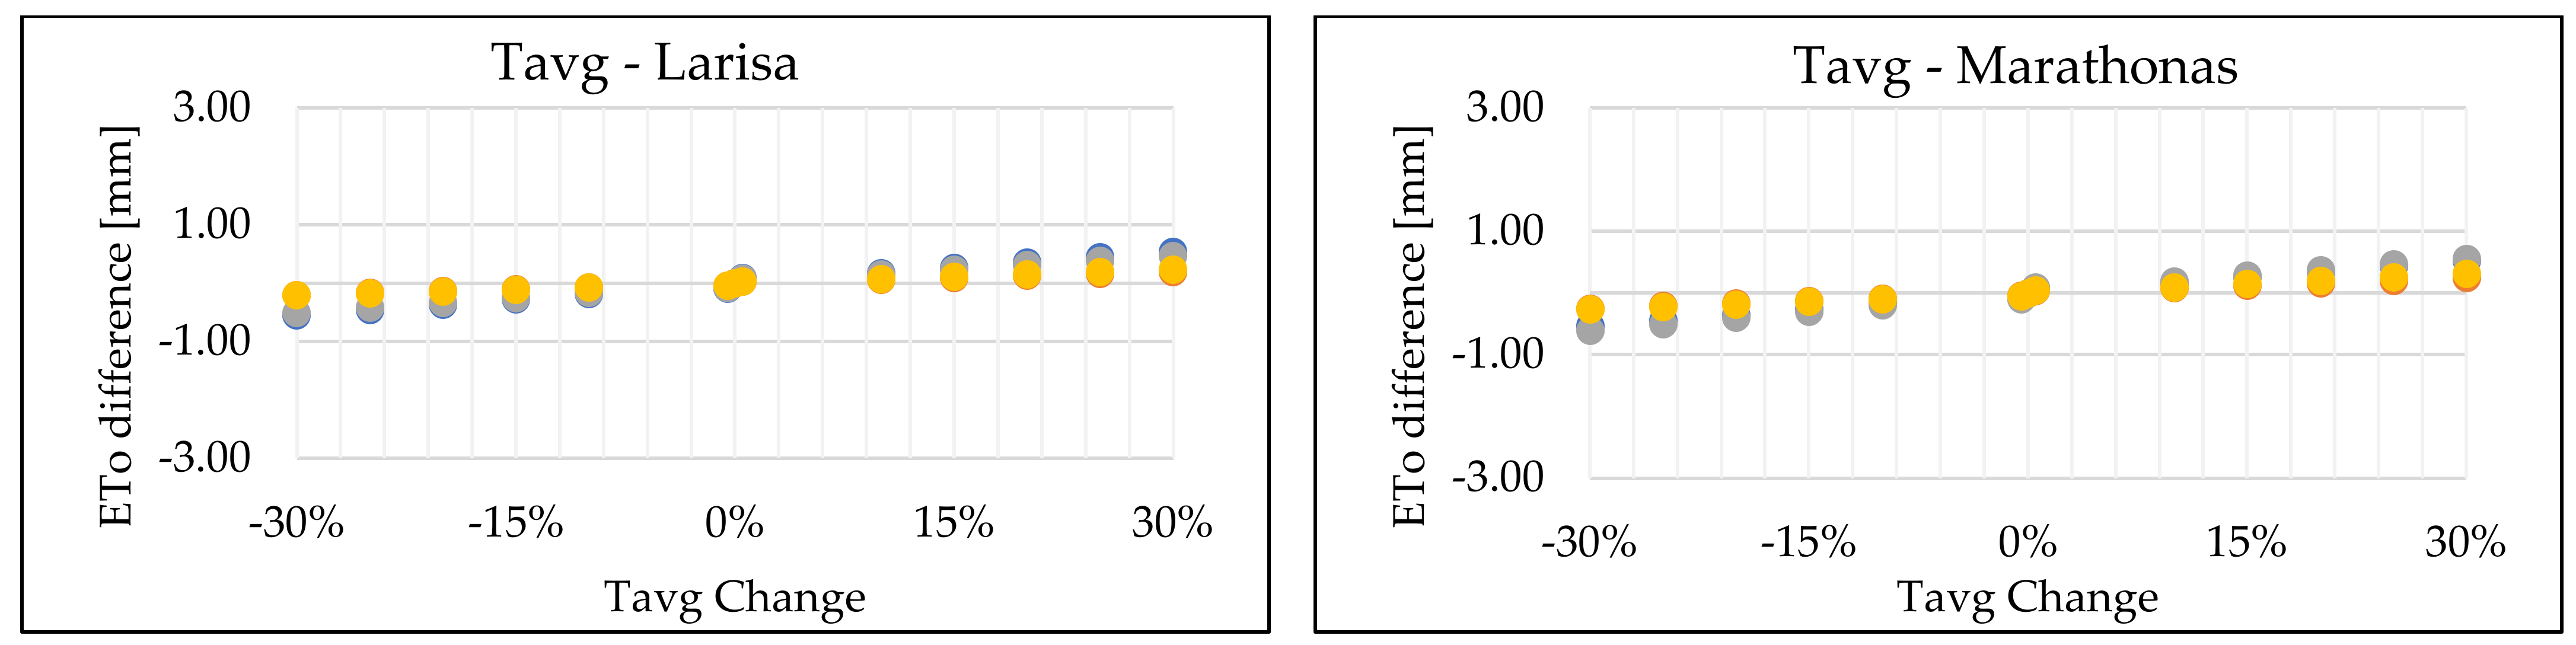
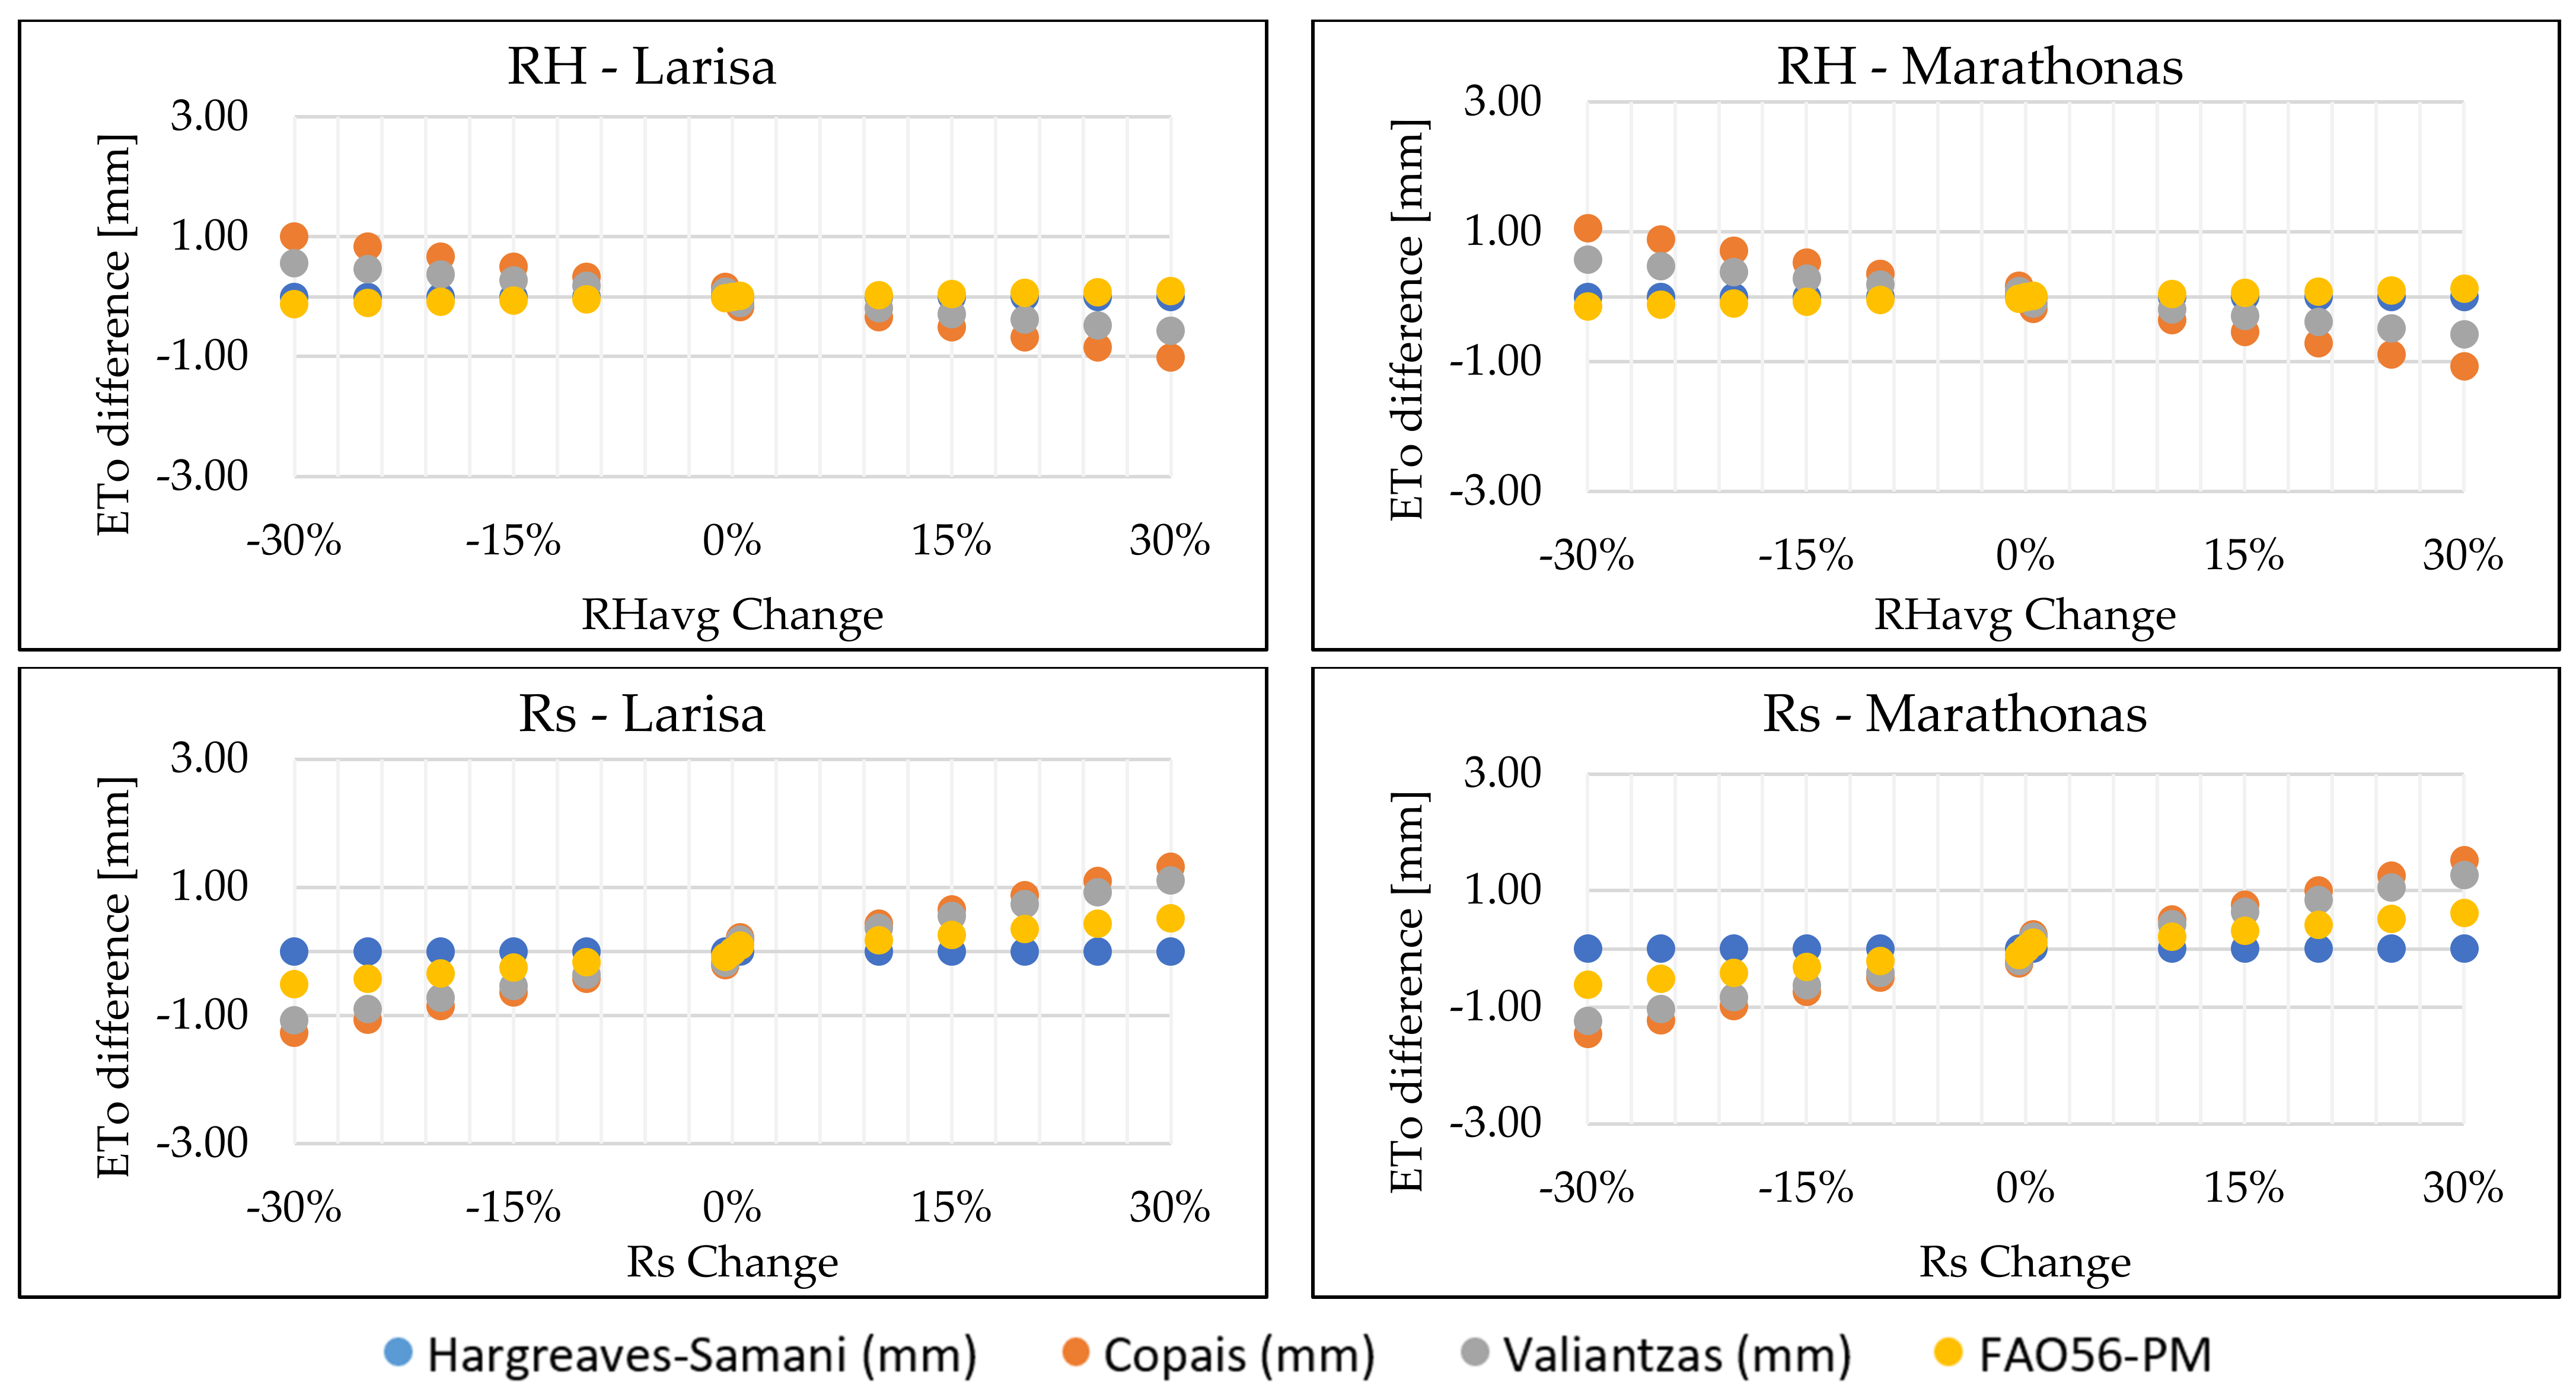
Finally, the sensitivity analysis conducted reaffirmed the complexity of the FAO56-PM. The latter showed little sensitivity to the examined variables due to the greater number of variables included in its calculation. The Copais and Valiantzas approaches showed significant sensitivity to incoming solar radiation and relative humidity. The abovementioned finding explains the inconsistent estimation of ETo by these approaches due to the significant difference in ERA5-Land and GAIAtron timeseries of the two variables. Lastly, the Hargreaves-Samani method was found, as expected, to be sensitive to the temperature variable. This explains the better performance of the Hargreaves-Samani approach with ERA5-Land data in the estimation of ETo when compared to the Copais or Valiantzas approaches.

5. Conclusions

The main findings of this research are summarized below:
  • When estimating cumulative daily ETo for three Greek cultivation sites using ERA5-Land data, four different methodologies, FAO56-PM, Hargreaves-Samani, Copais and Valiantzas, underestimated total ETo on average by 38% when compared to FAO56-PM with in situ observed calculations.
  • In comparing the different approaches, Hargreaves-Samani emerges as the least bias-prone in estimating ETo with ERA5-Land data, showing an average underestimation of 26%.
  • When applying the in situ agrometeorological variables record, the Valiantzas approach is proved the most accurate, with an average difference of 12.2% when compared to the FAO56-PM reference ETo.
  • Comparisons of the individual variables recorded by in situ GAIAtron stations and ERA5-Land depicted moderate performance of the reanalysis data regarding relative humidity and solar radiation. On the other hand, temperature was proved to be well-recorded by ERA5-Land.
The present research highlights the potential and current limitations of using open access ERA5-Land reanalysis data towards the estimation of ETo. Additionally, the proper choice of ETo approach is essential when there is not sufficient data for applying the FAO56-PM method, as shown by the significant differences observed. The results presented, as well as the discussion that followed, highlight the need for additional procedures, such as downscaling of the reanalysis data, in order to achieve independent-of-ground-data usage. However, the use of ERA5-Land data may provide critical insights in data-scarce areas. Additionally, future research approaches should investigate the optimization of the number and setting of in situ agrometeorological stations, which will provide the necessary observations to properly assess and utilize reanalysis data. Furthermore, the identification of ERA5-Land’s high accuracy in recording temperature data allows a more confident approach in various climate-related studies, such as in recording frost days or very high heat days, as well as in assessing long-term trends and persistence.

Author Contributions

Conceptualization, N.G., M.G. and E.B.; methodology, N.G. and M.G.; software, M.G.; validation, N.G. and E.B.; resources, M.G.; data curation, M.G.; writing—original draft preparation, N.G.; writing—review and editing, N.G. and E.B.; visualization, N.G.; supervision, E.B. All authors have read and agreed to the published version of the manuscript.

Funding

This research received no external funding.

Data Availability Statement

All data sources are mentioned in Section 2.2, Data Used.

Acknowledgments

The authors acknowledge the contribution of Neuropublic S.A. to their research for providing the relevant GAIAtron data.

Conflicts of Interest

The authors declare no conflict of interest.

Appendix A

Figure A1. June–December 2019 ETo estimated daily timeseries, data source: GAIAtron station.
Geographies 03 00026 g0a1
Figure A2. June–December 2019 ETo estimated daily timeseries, data source: ERA5-Land.
Geographies 03 00026 g0a2
Figure A3. ETo estimated daily timeseries for 2020, data source: GAIAtron station.
Geographies 03 00026 g0a3
Figure A4. ETo estimated daily timeseries for 2020, data source: ERA5-Land.
Geographies 03 00026 g0a4
Figure A5. ETo estimated daily timeseries for 2021, data source: GAIAtron station.
Geographies 03 00026 g0a5
Figure A6. ETo estimated daily timeseries for 2021, data source: ERA5-Land.
Geographies 03 00026 g0a6
Figure A7. July–December 2020 ETo estimated daily timeseries, data source: GAIAtron station.
Geographies 03 00026 g0a7
Figure A8. July–December 2020 ETo estimated daily timeseries, data source: ERA5-Land.
Geographies 03 00026 g0a8
Figure A9. July–December 2020 ETo estimated daily timeseries, data source: GAIAtron station.
Geographies 03 00026 g0a9
Figure A10. July–December 2020 ETo estimated daily timeseries, data source: ERA5-Land.
Geographies 03 00026 g0a10
Figure A11. February–May 2021 ETo estimated daily timeseries, data source: GAIAtron station.
Geographies 03 00026 g0a11
Figure A12. February–May 2021 ETo estimated daily timeseries, data source: ERA5-Land.
Geographies 03 00026 g0a12

References

  1. Moore, F.C.; Lobell, D.B. Adaptation Potential of European Agriculture in Response to Climate Change. Nat. Clim. Change 2014, 4, 610–614. [Google Scholar] [CrossRef]
  2. Siebert, S.; Döll, P. The Global Crop Water Model (GCWM): Documentation and First Results for Irrigated Crops. Frankf. Hydrol. Pap. 2008, 7, 1–42. [Google Scholar]
  3. Kustas, W.P.; Norman, J.M. Use of Remote Sensing for Evapotranspiration Monitoring over Land Surfaces. Hydrol. Sci. J. 2009, 41, 495–516. [Google Scholar] [CrossRef] [Green Version]
  4. Pereira, L.S.; Perrier, A.; Allen, R.G.; Alves, I. Evapotranspiration: Review of Concepts and Future Trends. J. Irrig. Drain. Eng. 1996, 125, 45–51. [Google Scholar] [CrossRef]
  5. Iglesias, A.; Garrote, L. Adaptation Strategies for Agricultural Water Management under Climate Change in Europe. Agric. Water Manag. 2015, 155, 113–124. [Google Scholar] [CrossRef] [Green Version]
  6. Cisneros, B.E.J.; Oki, T.; Arnell, N.W.; Benito, G.; Cogley, J.G.; Döll, P.; Jiang, T.; Mwakalila, S.S. Freshwater Resources. In Climate Change 2014: Impacts, Adaptation, and Vulnerability. Part A: Global and Sectoral Aspects. Contribution of Working Group II to the Fifth Assessment Report of the Intergovernmental Panel on Climate Change; Field, C.B., Barros, V.R., Dokken, D.J., Mach, K.J., Mastrandrea, M.D., Bilir, T.E., Chatterjee, M., Ebi, K.L., Estrada, Y.O., Genova, R.C., et al., Eds.; Cambridge University Press: Cambridge, UK, 2014; pp. 1199–1265. [Google Scholar]
  7. Kovats, R.S.; Valentini, R.; MBouwer, L.; Georgopoulou, E.; Jacob, D.; Martin, E.; Rounsevell, M.; Soussana, J.-F. Europe. In Climate Change 2014: Impacts, Adaptation, and Vulnerability. Part B: Regional Aspects. Contribution of Working Group II to the Fifth Assessment Report of the Intergovernmental Panel on Climate Change; Field, C.B., Barros, V.R., Dokken, D.J., Mach, K.J., Mastrandrea, M.D., Bilir, T.E., Chatterjee, M., Ebi, K.L., Estrada, Y.O., Genova, R.C., et al., Eds.; Cambridge University Press: Cambridge, UK, 2014; pp. 1267–1326. [Google Scholar]
  8. Gutiérrez, J.M.; Mernild, S.H.; Jones, R.G.; Narisma, G.T.; Alves, L.M.; Amjad, M.; Gorodetskaya, I.V.; Grose, M.; Klutse, N.A.B.; Krakovska, S.; et al. Atlas. In Climate Change 2021: The Physical Science Basis. Contribution of Working Group I to the Sixth Assessment Report of the Intergovernmental Panel on Climate Change; Masson-Delmotte, V., Zhai, P., Pirani, A., Connors, S.L., Péan, C., Berger, S., Caud, N., Chen, Y., Goldfarb, L., Gomis, M.I., et al., Eds.; Cambridge University Press: Cambridge, UK, 2021; pp. 1927–2058. [Google Scholar]
  9. Ali, E.; Cramer, W.; Carnicer, J.; Georgopoulou, E.; Hilmi, N.J.M.; le Cozannet, G.; Lionello, P.; Pörtner, H.-O.; Roberts, D.C.; Tignor, M.; et al. Cross-Chapter Paper 4: Mediterranean Region. In Climate Change 2022: Impacts, Adaptation and Vulnerability. Contribution of Working Group II to the Sixth Assessment Report of the Intergovernmental Panel on Climate Change; Cambridge University Press: Cambridge, UK, 2022; pp. 2233–2272. [Google Scholar]
  10. Weatherhead, E.K.; Howden, N.J.K. The Relationship between Land Use and Surface Water Resources in the UK. Land Use Policy 2009, 26, S243–S250. [Google Scholar] [CrossRef]
  11. Thornton, P.K.; Herrero, M. The Inter-Linkages between Rapid Growth in Livestock Production, Climate Change, and the Impacts on Water Resources, Land Use, and Deforestation. Background Paper to the 2010 World Development Report; The World Bank: Washington, DC, USA, 2010. [Google Scholar]
  12. Busker, T.; de Roo, A.; Gelati, E.; Schwatke, C.; Adamovic, M.; Bisselink, B.; Pekel, J.-F.; Cottam, A. A Global Lake and Reservoir Volume Analysis Using a Surface Water Dataset and Satellite Altimetry. Hydrol. Earth Syst. Sci. Discuss. 2018, 23, 669–690. [Google Scholar] [CrossRef] [Green Version]
  13. Khazaei, B.; Khatami, S.; Alemohammad, S.H.; Rashidi, L.; Wu, C.; Madani, K.; Kalantari, Z.; Destouni, G.; Aghakouchak, A. Climatic or Regionally Induced by Humans? Tracing Hydro-Climatic and Land-Use Changes to Better Understand the Lake Urmia Tragedy. J. Hydrol. 2019, 569, 203–217. [Google Scholar] [CrossRef]
  14. Satgé, F.; Espinoza, R.; Zolá, R.P.; Roig, H.; Timouk, F.; Molina, J.; Garnier, J.; Calmant, S.; Seyler, F.; Bonnet, M.P. Role of Climate Variability and Human Activity on Poopó Lake Droughts between 1990 and 2015 Assessed Using Remote Sensing Data. Remote Sens. 2017, 9, 218. [Google Scholar] [CrossRef] [Green Version]
  15. Bhattacharya, A. Global Climate Change and Its Impact on Agriculture. In Changing Climate and Resource Use Efficiency in Plants; Elsevier: Amsterdam, The Netherlands, 2019; pp. 1–50. [Google Scholar]
  16. The European Parliament; The Council of The European Union. Regulation (EU) No 1292/2013 of the European Parliament and of the Council of 11 December 2013 amending Regulation (EC) No 294/2008 establishing the European Institute of Innovation and Technology Text with EEA relevance. Off. J. Eur. Union 2020, L347, 174–184. [Google Scholar]
  17. Allen, R.G. Using the FAO-56 Dual Crop Coefficient Method over an Irrigated Region as Part of an Evapotranspiration Intercomparison Study. J. Hydrol. 2000, 229, 27–41. [Google Scholar] [CrossRef]
  18. Consoli, S.; Vanella, D. Mapping Crop Evapotranspiration by Integrating Vegetation Indices into a Soil Water Balance Model. Agric. Water Manag. 2014, 143, 71–81. [Google Scholar] [CrossRef]
  19. Calera, A.; Campos, I.; Osann, A.; D’Urso, G.; Menenti, M. Remote Sensing for Crop Water Management: From ET Modelling to Services for the End Users. Sensors 2017, 17, 1104. [Google Scholar] [CrossRef] [Green Version]
  20. Gonzalez-dugo, M.P.; Neale, C.M.U.; Mateos, L.; Kustas, W.P.; Prueger, J.H.; Anderson, M.C.; Li, F. Agricultural and Forest Meteorology A Comparison of Operational Remote Sensing-Based Models for Estimating Crop Evapotranspiration. Agric. For. Meteorol. 2009, 149, 1843–1853. [Google Scholar] [CrossRef]
  21. Pereira, L.S.; Cordery, I.; Iacovides, I. Improved Indicators of Water Use Performance and Productivity for Sustainable Water Conservation and Saving. Agric. Water Manag. 2012, 108, 39–51. [Google Scholar] [CrossRef]
  22. Pereira, L.S. Water, Agriculture and Food: Challenges and Issues. Water Resour. Manag. 2017, 31, 2985–2999. [Google Scholar] [CrossRef]
  23. Allen, R.G.; Pereira, L.S.; Raes, D.; Smith, M. Crop Evapotranspiration—Guidelines for Computing Crop Water Requirements—FAO Irrigation and Drainage Paper 56; FAO: Rome, Italy, 1998. [Google Scholar]
  24. Battisti, R. Assessment of Different Gridded Weather Data for Soybean Yield Simulations in Brazil. Theor. Appl. Clim. 2019, 135, 237–247. [Google Scholar] [CrossRef]
  25. Pelosi, A.; Chirico, G.B. Regional Assessment of Daily Reference Evapotranspiration: Can Ground Observations Be Replaced by Blending ERA5-Land Meteorological Reanalysis and CM-SAF Satellite-Based Radiation Data? Agric. Water Manag. 2021, 258, 107169. [Google Scholar] [CrossRef]
  26. Lewis, C.S.; Geli, H.M.E.; Neale, C.M.U. Comparison of the NLDAS Weather Forcing Model to Agrometeorological Measurements in the Western United States. J. Hydrol. 2014, 510, 385–392. [Google Scholar] [CrossRef]
  27. Strong, C.; Khatri, K.B.; Kochanski, A.K.; Lewis, C.S.; Allen, L.N. Reference Evapotranspiration from Coarse-Scale and Dynamically Downscaled Data in Complex Terrain: Sensitivity to Interpolation and Resolution. J. Hydrol. 2017, 548, 406–418. [Google Scholar] [CrossRef] [Green Version]
  28. Chirico, G.B.; Medina, H.; Romano, N. Geoderma Functional Evaluation of PTF Prediction Uncertainty: An Application at Hillslope Scale. Geoderma 2010, 155, 193–202. [Google Scholar] [CrossRef]
  29. Alexandris, S.; Tsesmelis, D.; Proutsos, N.; Chatzithomas, C.; Skondras, N.; Stamatakos, D.; Vasilakou, C.; Gkotsis, I.; Fassouli, V.; Vitoratos, E.; et al. Contribution of Empirical Methods and Satellite Data Use for Estimating Daily Reference Evapotranspiration. 2016, pp. 72–84. Available online: https://ejournals.lib.auth.gr/hydrotechnica/article/view/5076 (accessed on 22 June 2023).
  30. Calibration, I.; Model, M.; Allen, R.G.; Tasumi, M.; Trezza, R. Satellite-Based Energy Balance for Mapping Evapotranspiration with Satellite-Based Energy Balance for Mapping Evapotranspiration with Internalized Calibration (METRIC)—Model. J. Irrig. Drain. Eng. 2007, 133, 9437. [Google Scholar]
  31. Mu, Q.; Heinsch, F.A.; Zhao, M.; Running, S.W. Development of a Global Evapotranspiration Algorithm Based on MODIS and Global Meteorology Data. Remote Sens. Environ. 2007, 111, 519–536. [Google Scholar] [CrossRef]
  32. Pelosi, A.; Terribile, F.; Urso, G.D. Comparison of ERA5-Land and UERRA MESCAN-SURFEX Reanalysis Data with Spatially Interpolated Weather Observations for the Regional Assessment of Reference Evapotranspiration. Water 2020, 12, 1669. [Google Scholar] [CrossRef]
  33. Alexandris, S.; Kerkides, P.; Liakatas, A. Daily Reference Evapotranspiration Estimates by the “Copais” Approach. Agric. Water Manag. 2006, 82, 371–386. [Google Scholar] [CrossRef]
  34. Hargreaves, G.H.; Samani, Z.A. Reference Crop Evapotranspiration from Temperature. Appl. Eng. Agric. 1985, 1, 96–99. [Google Scholar] [CrossRef]
  35. Valiantzas, J.D. Simple ET0 Forms of Penman’s Equation without Wind and/or Humidity Data. II: Comparisons with Reduced Set-FAO and Other Methodologies. J. Irrig. Drain. Eng. 2013, 139, 9–19. [Google Scholar] [CrossRef] [Green Version]
  36. Lykhovyd, P. Comparing Reference Evapotranspiration Calculated in ETo Calculator (Ukraine) Mobile App with the Estimated by Standard FAO-Based Approach. Agriengineering 2022, 4, 747–757. [Google Scholar] [CrossRef]
  37. Dimitriadou, S.; Nikolakopoulos, K.G. Reference Evapotranspiration (Eto) Methods Implemented as Arcmap Models with Remote-Sensed and Ground-Based Inputs, Examined along with Modis et, for Peloponnese, Greece. ISPRS Int. J. Geoinf. 2021, 10, 390. [Google Scholar] [CrossRef]
  38. Paredes, P.; Fontes, J.C.; Azevedo, E.B.; Pereira, L.S. Daily Reference Crop Evapotranspiration in the Humid Environments of Azores Islands Using Reduced Data Sets: Accuracy of FAO-PM Temperature and Hargreaves-Samani Methods. Theor. Appl. Climatol. 2018, 134, 595–611. [Google Scholar] [CrossRef]
  39. Ministry of Environment, Special Secretariat for Water. 1st Revision RBDMP of Thessaly. Greek Government Gazette. 2017. Available online: http://wfdver.ypeka.gr/en/home/ (accessed on 22 June 2023). (In Greek).
  40. Gourgouletis, N.; Bariamis, G.; Baltas, E. Water Saving Potential in the RBD of Thessaly. WSEAS Trans. Environ. Dev. 2020, 16, 226–236. [Google Scholar] [CrossRef]
  41. Ministry of Environment, Special Secretariat for Water. 1st Revision RBDMP of Thrace. Greek Government Gazette. 2017. Available online: http://wfdver.ypeka.gr/en/home/ (accessed on 22 June 2023). (In Greek).
  42. Ministry of Environment, Special Secretariat for Water. 1st Revision RBDMP of Attica. Greek Government Gazette. 2017. Available online: http://wfdver.ypeka.gr/en/home/ (accessed on 22 June 2023). (In Greek).
  43. Khaki, M.; Awange, J. The 2019–2020 Rise in Lake Victoria Monitored from Space: Exploiting the State-of-the-Art Grace-Fo and the Newly Released Era-5 Reanalysis Products. Sensors 2021, 21, 4304. [Google Scholar] [CrossRef] [PubMed]
  44. Cerlini, P.B.; Saraceni, M.; Silvestri, L.; Meniconi, S.; Brunone, B. Monitoring the Water Mass Balance Variability of Small Shallow Lakes by an ERA5-Land Reanalysis and Water Level Measurement-Based Model. An Application to the Trasimeno Lake, Italy. Atmosphere 2022, 13, 949. [Google Scholar] [CrossRef]
  45. Alexandris, S.; Kerkides, P. New Empirical Formula for Hourly Estimations of Reference Evapotranspiration. Agric. Water Manag. 2003, 60, 157–180. [Google Scholar] [CrossRef]
  46. Chai, T.; Draxler, R.R. Root Mean Square Error (RMSE) or Mean Absolute Error (MAE)?—Arguments against Avoiding RMSE in the Literature. Geosci. Model Dev. 2014, 7, 1247–1250. [Google Scholar] [CrossRef] [Green Version]
  47. Mccuen, R.H. The Role of Sensitivity Analysis in Hydrologic Modeling. J. Hydrol. 1973, 18, 37–53. [Google Scholar] [CrossRef]
  48. Ambas, V.T.; Baltas, E. Sensitivity Analysis of Different Evapotranspiration Methods Using a New Sensitivity Coefficient. Glob. NEST J. 2012, 14, 335–343. [Google Scholar]
  49. Saxton, K.E. Sensitivity Analyses of the Combination Evapotrans-Piration Equation. Agric. Meteorol. 1975, 15, 343–353. [Google Scholar] [CrossRef]
  50. Yu, T.; Jiapaer, G.; Bao, A.; Zhang, J.; Tu, H.; Chen, B.; De Maeyer, P.; Van de Voorde, T. Evaluating Surface Soil Moisture Characteristics and the Performance of Remote Sensing and Analytical Products in Central Asia. J. Hydrol. 2023, 617, 128921. [Google Scholar] [CrossRef]
  51. Muñoz-Sabater, J.; Dutra, E.; Agustí-Panareda, A.; Albergel, C.; Arduini, G.; Balsamo, G.; Boussetta, S.; Choulga, M.; Harrigan, S.; Hersbach, H.; et al. ERA5-Land: A State-of-the-Art Global Reanalysis Dataset for Land Applications. Earth Syst. Sci. Data 2021, 13, 4349–4383. [Google Scholar] [CrossRef]
  52. Vanella, D.; Longo-Minnolo, G.; Belfiore, O.R.; Ramírez-Cuesta, J.M.; Pappalardo, S.; Consoli, S.; D’Urso, G.; Chirico, G.B.; Coppola, A.; Comegna, A.; et al. Comparing the Use of ERA5 Reanalysis Dataset and Ground-Based Agrometeorological Data under Different Climates and Topography in Italy. J. Hydrol. Reg. Stud. 2022, 42, 101182. [Google Scholar] [CrossRef]
  53. Gebremedhin, M.A.; Lubczynski, M.W.; Maathuis, B.H.P.; Teka, D. Deriving Potential Evapotranspiration from Satellite-Based Reference Evapotranspiration, Upper Tekeze Basin, Northern Ethiopia. J. Hydrol. Reg. Stud. 2022, 41, 101059. [Google Scholar] [CrossRef]
  54. Niyogi, D.; Jamshidi, S.; Smith, D.; Kellner, O. Evapotranspiration Climatology of Indiana Using In Situ and Remotely Sensed Products. J. Appl. Meteorol. Clim. 2020, 59, 2093–2111. [Google Scholar] [CrossRef]
  55. Jedlička, K.; Valeš, J.; Hájek, P.; Kepka, M.; Pitoňák, M. Calculation of Agro-Climatic Factors from Global Climatic Data. Appl. Sci. 2021, 11, 1245. [Google Scholar] [CrossRef]
Figure 1. Study areas: Larisa, Komotini (5.1 and 6.1) and Marathonas.
Geographies 03 00026 g001
Figure 2. Larisa, 2019, 2020 and 2021: scatter plots of Tavg, RH and Rs. Solid black line; y = x line, Dotted line; linear trendline, Blue dots; Daily measurements.
Geographies 03 00026 g002
Figure 3. Komotini 5.1 and 6.1: scatter plots of Tavg, RH and Rs. Solid black line; y = x line, Dotted line; linear trendline, Blue dots; Daily measurements.
Geographies 03 00026 g003
Figure 4. Marathonas: scatter plots of Tavg, RH and Rs. Solid black line; y = x line, Dotted line; linear trendline, Blue dots; Daily measurements.
Geographies 03 00026 g004
Figure 5. Dry period: Larisa and Komotini sensitivity analysis results.
Geographies 03 00026 g005aGeographies 03 00026 g005b
Figure 6. Spring period: Larisa and Marathonas sensitivity analysis results.
Geographies 03 00026 g006aGeographies 03 00026 g006b
Table 1. Cultivation time periods with GAIAtron meteorological records.
GAIAtron StationTime Period (dd/mm/yyyy)
Larisa30/05/2019–31/12/2021
Komotini 5.101/07/2020–31/12/2020
Komotini 6.126/06/2020–31/12/2020
Marathonas26/01/2021–04/06/2021
Table 2. June–December 2019 ETo total estimates.
MethodGAIAtron StationERA5-Land
FAO56-PM987.30598.82
Hargraves-Samani870.56718.91
Copais982.63503.79
Valiantzas989.88592.94
Table 3. January–December 2020 ETo total estimates.
MethodGAIAtron StationERA5-Land
FAO56-PM1111.67898.50
Hargraves-Samani1338.631086.54
Copais1394.65753.65
Valiantzas1351.07847.8
Table 4. January–December 2021 ETo total estimates.
MethodGAIAtron StationERA5-Land
FAO56-PM1344.43937.52
Hargraves-Samani1354.471043.17
Copais1558.60729.77
Valiantzas1479.59819.61
Table 5. Komotini 5.1; July–December 2020 ETo total estimates.
MethodGAIAtron StationERA5-Land
FAO56-PM1034.44544.68
Hargraves-Samani527.53566.06
Copais930.65391.87
Valiantzas908.73454.38
Table 6. Komotini 6.1; July–December 2020 ETo total estimates.
MethodGAIAtron StationERA5-Land
FAO56-PM1038.94497.35
Hargraves-Samani636.32576.29
Copais870.24396.89
Valiantzas857.41474.20
Table 7. February–May 2021 ETo total estimates.
MethodGAIAtron StationERA5-Land
FAO56-PM488.23366.91
Hargraves-Samani423.66397.27
Copais586.20299.17
Valiantzas546.34308.71
Table 8. June–December 2019 agrometeorological variables source testing.
TestTair,maxTair,minTair,avgRHRs
α (y = a × x)0.951.231.070.900.46
R20.950.740.960.730.77
Table 9. January–December 2020 agrometeorological variables source testing.
TestTair,maxTair,minTair,avgRHRs
α (y = a × x)0.931.281.090.910.48
R20.970.710.950.610.66
Table 10. January–December 2021 agrometeorological variables source testing.
TestTair,maxTair,minTair,avgRHRs
α (y = a × x)0.941.281.080.910.50
R20.870.810.970.510.67
Table 11. Komotini 5.1; July–December 2020 agrometeorological variables source testing.
TestTair,maxTair,minTair,avgRHRs
α (y = a × x)0.990.890.961.010.42
R20.940.900.950.850.83
Table 12. Komotini 6.1; July–December 2020 agrometeorological variables source testing.
TestTair,maxTair,minTair,avgRHRs
α (y = a × x)0.971.111.041.020.46
R20.930.730.920.390.78
Table 13. February–May 2021 agrometeorological variables source testing.
TestTair,maxTair,minTair,avgRHRs
α (y = a × x)0.961.041.000.930.48
R20.910.870.940.550.71
Disclaimer/Publisher’s Note: The statements, opinions and data contained in all publications are solely those of the individual author(s) and contributor(s) and not of MDPI and/or the editor(s). MDPI and/or the editor(s) disclaim responsibility for any injury to people or property resulting from any ideas, methods, instructions or products referred to in the content.

