Article

Quantifying Who Will Be Affected by Shifting Climate Zones

by
Andrew G. O. Malone
Department of Earth and Environmental Sciences, University of Illinois Chicago, Chicago, IL 60607, USA
Geographies 2023, 3(3), 477-498; https://doi.org/10.3390/geographies3030025
Submission received: 29 June 2023 / Revised: 25 July 2023 / Accepted: 27 July 2023 / Published: 30 July 2023

Abstract

:
Climate change is altering the conditions to which communities have adapted. The Köppen–Geiger classification system can provide a compact metric to identify regions with notable changes in climatic conditions. Shifting Köppen–Geiger climate zones will be especially impactful in regions with large populations. This study uses high-resolution datasets on Köppen–Geiger climate zones and populations to quantify the number of people affected by shifting climate zones (i.e., population exposure to shifting climate zones). By the end of this century, 9–15% of the Earth’s land surface is projected to shift its climate zone. These shifts could affect 1.3–1.6 billion people (14–21% of the global population). Many of the affected people live in areas that were classified as temperate in the historical period. These areas are projected to be classified as tropical or arid in the future. This study presents a new metric for exposure to climate change: the number of people living in areas whose climate zone classification is projected to shift. It also identifies populations that may face climatic conditions in the future that deviate from those to which they have adapted.

1. Introduction

Contemporary climate change poses many challenges to societies. Temperature and precipitation events once considered extreme are becoming more frequent [1,2,3]. Climate change also affects the environments people depend on and the ecosystem services those environments can provide [4,5]. Most fundamentally, the climatic conditions to which communities have long adapted are rapidly changing. The human impacts of these changes depend, in part, on how many people are affected (i.e., the exposure) [6]. Thus, assessments are needed of where climates are changing and how these changes intersect with present and future populations.
The Köppen–Geiger classification system provides a compact metric to identify where climate changes may be particularly challenging. It is often called the generic climate classification [7]. It is commonly utilized by geographers and climatologists [8]. Combining monthly air temperature and precipitation data and metrics for their seasonality, it defines five broad zones: tropical (Zone A), arid (Zone B), temperate (Zone C), boreal (Zone D), and polar (Zone E) [9,10]. The climate variables that characterize Köppen–Geiger climate zones influence economic activities. Its climate zones can predict a range of human endeavors, including agricultural activities [11], COVID-19 transmission [12], hospital health outcomes [13], and optimal building materials [14].
Contemporary climate change is causing Köppen–Geiger climate zones to shift. Since the 1950s, about 5.7% of the land area has shifted its climate zone classification [15]. The arid zone is growing, while the polar zone is shrinking, but changes for the tropical, temperate, and boreal zones are less pronounced [8,15,16]. By the end of this century, more than 13% of the land area could shift climate zones for a future with high greenhouse gas emissions [10,17]. In the future, tropical and arid zones are expected to expand, while polar zones are expected to contract [10,15,16,17,18,19]. Future changes for the temperate and boreal zones may depend on how much the climate changes [15,18].
Shifting climate zones can directly impact societies when they occur where people live. For example, projected climate zone shifts in central Europe that occur in densely populated regions with intensive agriculture will lead to strong impacts [20]. Past assessments at the global scale, however, have primarily focused on where shifts will occur and the amount of area affected. The potential human impacts of these shifts have been largely absent. Thus, global-scale assessments are needed to quantify the number of people living in areas of shifting climate zones (i.e., the exposure).
Exposure to shifting climate zones will depend on both climatic and demographic changes. For climate changes, the scientific community has developed a series of plausible climate futures: Representative Concentration Pathways (RCPs) [21]. For demographic changes, the community has developed a series of plausible socioeconomic futures: Shared Socioeconomic Pathways (SSPs) [22]. Pairings of SSPs and RCPs have been used to project changes in exposure to extreme weather events [23,24,25,26,27]. These studies have found that both climatic and demographic factors play a role in future changes in exposure.
To quantify the human exposure to climate change, this study identifies projected shifts in Köppen–Geiger climate zones and compares them with population projections. Climate zone shifts are identified for a recently published, high-resolution climate zone dataset [28]. Assessments are made at mid-century and late-century for two pathways of future climate change: midrange mitigation emissions (RCP4.5) and high emissions (RCP8.5). The number of people living in regions of shifting climate zones is quantified for two pathways of future socioeconomic development: ‘middle of the road’ (SSP2) and ‘fossil-fueled development’ (SSP5). This study provides the first estimates of the human impacts of shifting climate zones. It also identifies locations with high exposure to shifting climate zones.

2. Materials and Methods

2.1. Datasets Used

This study analyzed previously published reconstructions and projections of Köppen–Geiger climate zones and population. The climate zone data are from Cui et al. (2021) [28]. The population data are from Gao (2020) [29]. Both datasets are provided as gridded products at roughly 1 km resolution.
The climate zone data provide a climate zone classification for each land grid cell, excluding Antarctica but including islands. Reconstructions for the historical period (1979–2013) were created using multiple climate datasets and statistical downscaling. The reconstructions have improved accuracy compared to earlier reconstructions [28]. Projections for the future (2020–2099) were created for four Representative Concentration Pathways (RCPs): RCP2.6, RCP4.5, RCP6.0, and RCP8.5. Output from multiple bias-corrected climate models was statistically downscaled for each pathway: 26 models for RCP2.6, 31 for RCP4.5, 19 for RCP6.0, and 30 for RCP8.5. The classification at each grid cell is the most common climate zone classification between models. The data are provided for 30-year intervals, which Cui et al. (2021) [28] found to be the most accurate timescale.
The population data provide the number of people residing in each grid cell. A reconstruction was made for the year 2000. Projections were made at 10-year intervals from 2010 through 2100 for the five Shared Socioeconomic Pathways (SSPs): SSP1, SSP2, SS3, SS4, and SSP5. The Gao (2020) [29] population data were produced by downscaling the one-eighth-degree resolution population data from Jones and O’Neill (2016) [30]. The Jones and O’Neill (2016) [30] data provide each grid cell’s urban and rural populations. The Gao (2000) [29] data are available at higher resolution (~30 arcseconds) for the rural, urban, and total population per grid cell. This study used the data for the total population.

2.2. Analyses Conducted

This study identified climate zone shifts at mid-century (2040–2069) and late-century (2070–2099) relative to the historical period (1981–2010). These comparisons were made for the midrange mitigation emissions trajectory (RCP2.6) and the high emissions trajectory (RCP8.5). These RCPs have been used in past studies on projected climate zone shifts [15,31]. Additionally, they are comparable to the trajectories used in an earlier generation of studies [18,19]. RCP4.5 provides a moderate warming climate future, and RCP8.5 provides a future with high warming. Neither pathway, however, is consistent with the warming targets in the 2015 Paris Climate Accords [32].
Climate zone comparisons were made for the five primary climate zones: Zone A (tropical), Zone B (arid), Zone C (temperate), Zone D (boreal), and Zone E (polar). The area distribution of climate zones was calculated for each time window. Additionally calculated was the amount of area that shifted climate zones relative to the historical period. Each pixel was weighted by its area. The total land area, which excludes Antarctica, is 135.761 million km2 for the historical period. Some pixels in the Cui et al. (2021) [28] dataset were classified in the historical period but not classified in the projections. Moreover, some pixels classified in the projections were not classified in the historical period. The ‘removed’ pixels accounted for 0.951 million km2 (i.e., about 0.70% of the land area classified in the historical period) and were concentrated along coastlines and in the Caspian Sea. The ‘added’ pixels accounted for 0.022 million km2 (i.e., about 0.02% of the area). Analyses of climate zones were made relative to the area classified in the historical period and are presented as a percent of the total area in the historical period.
This study also quantified the number of people affected by shifting climate zones. Population data for 2000 were used for the historical period. For population projections, 2060 was used for mid-century, and 2090 was used for late-century. The SSP2 (‘middle of the road’) pathway was used with the climate zone shifts under RCP4.5. The SSP5 (‘fossil-fueled development’) pathway was used with the climate zone shifts under RCP8.5. These SSP-RCP combinations are commonly used pairings [32]. Under both SSPs, the global population is projected to grow from 6.052 billion in 2000 to a peak around mid-century. The peak will be higher for SSP2 than SSP5. In 2060, the global population is projected to be 9.399 billion for SSP2 and 8.599 billion for SSP5. In 2090, it is projected to be 9.244 billion people and 7.845 billion people for SSP2 and SSP5.
The number of people affected by shifting climate zones was quantified by calculating the number of people living in areas where the climate zone is projected to change (i.e., the exposure). To conduct the analyses, the two datasets were aligned using nearest-neighbor interpolation in the QGIS software package. Calculations were restricted to only the grid cells where the climate zone was defined in both the historical period and the projections. This constraint conserved more than 99.4% of the population in the Gao (2020) [29] dataset. The number of people living in areas where the climate zone is projected to change (i.e., the exposure) is presented in millions of people.

3. Results

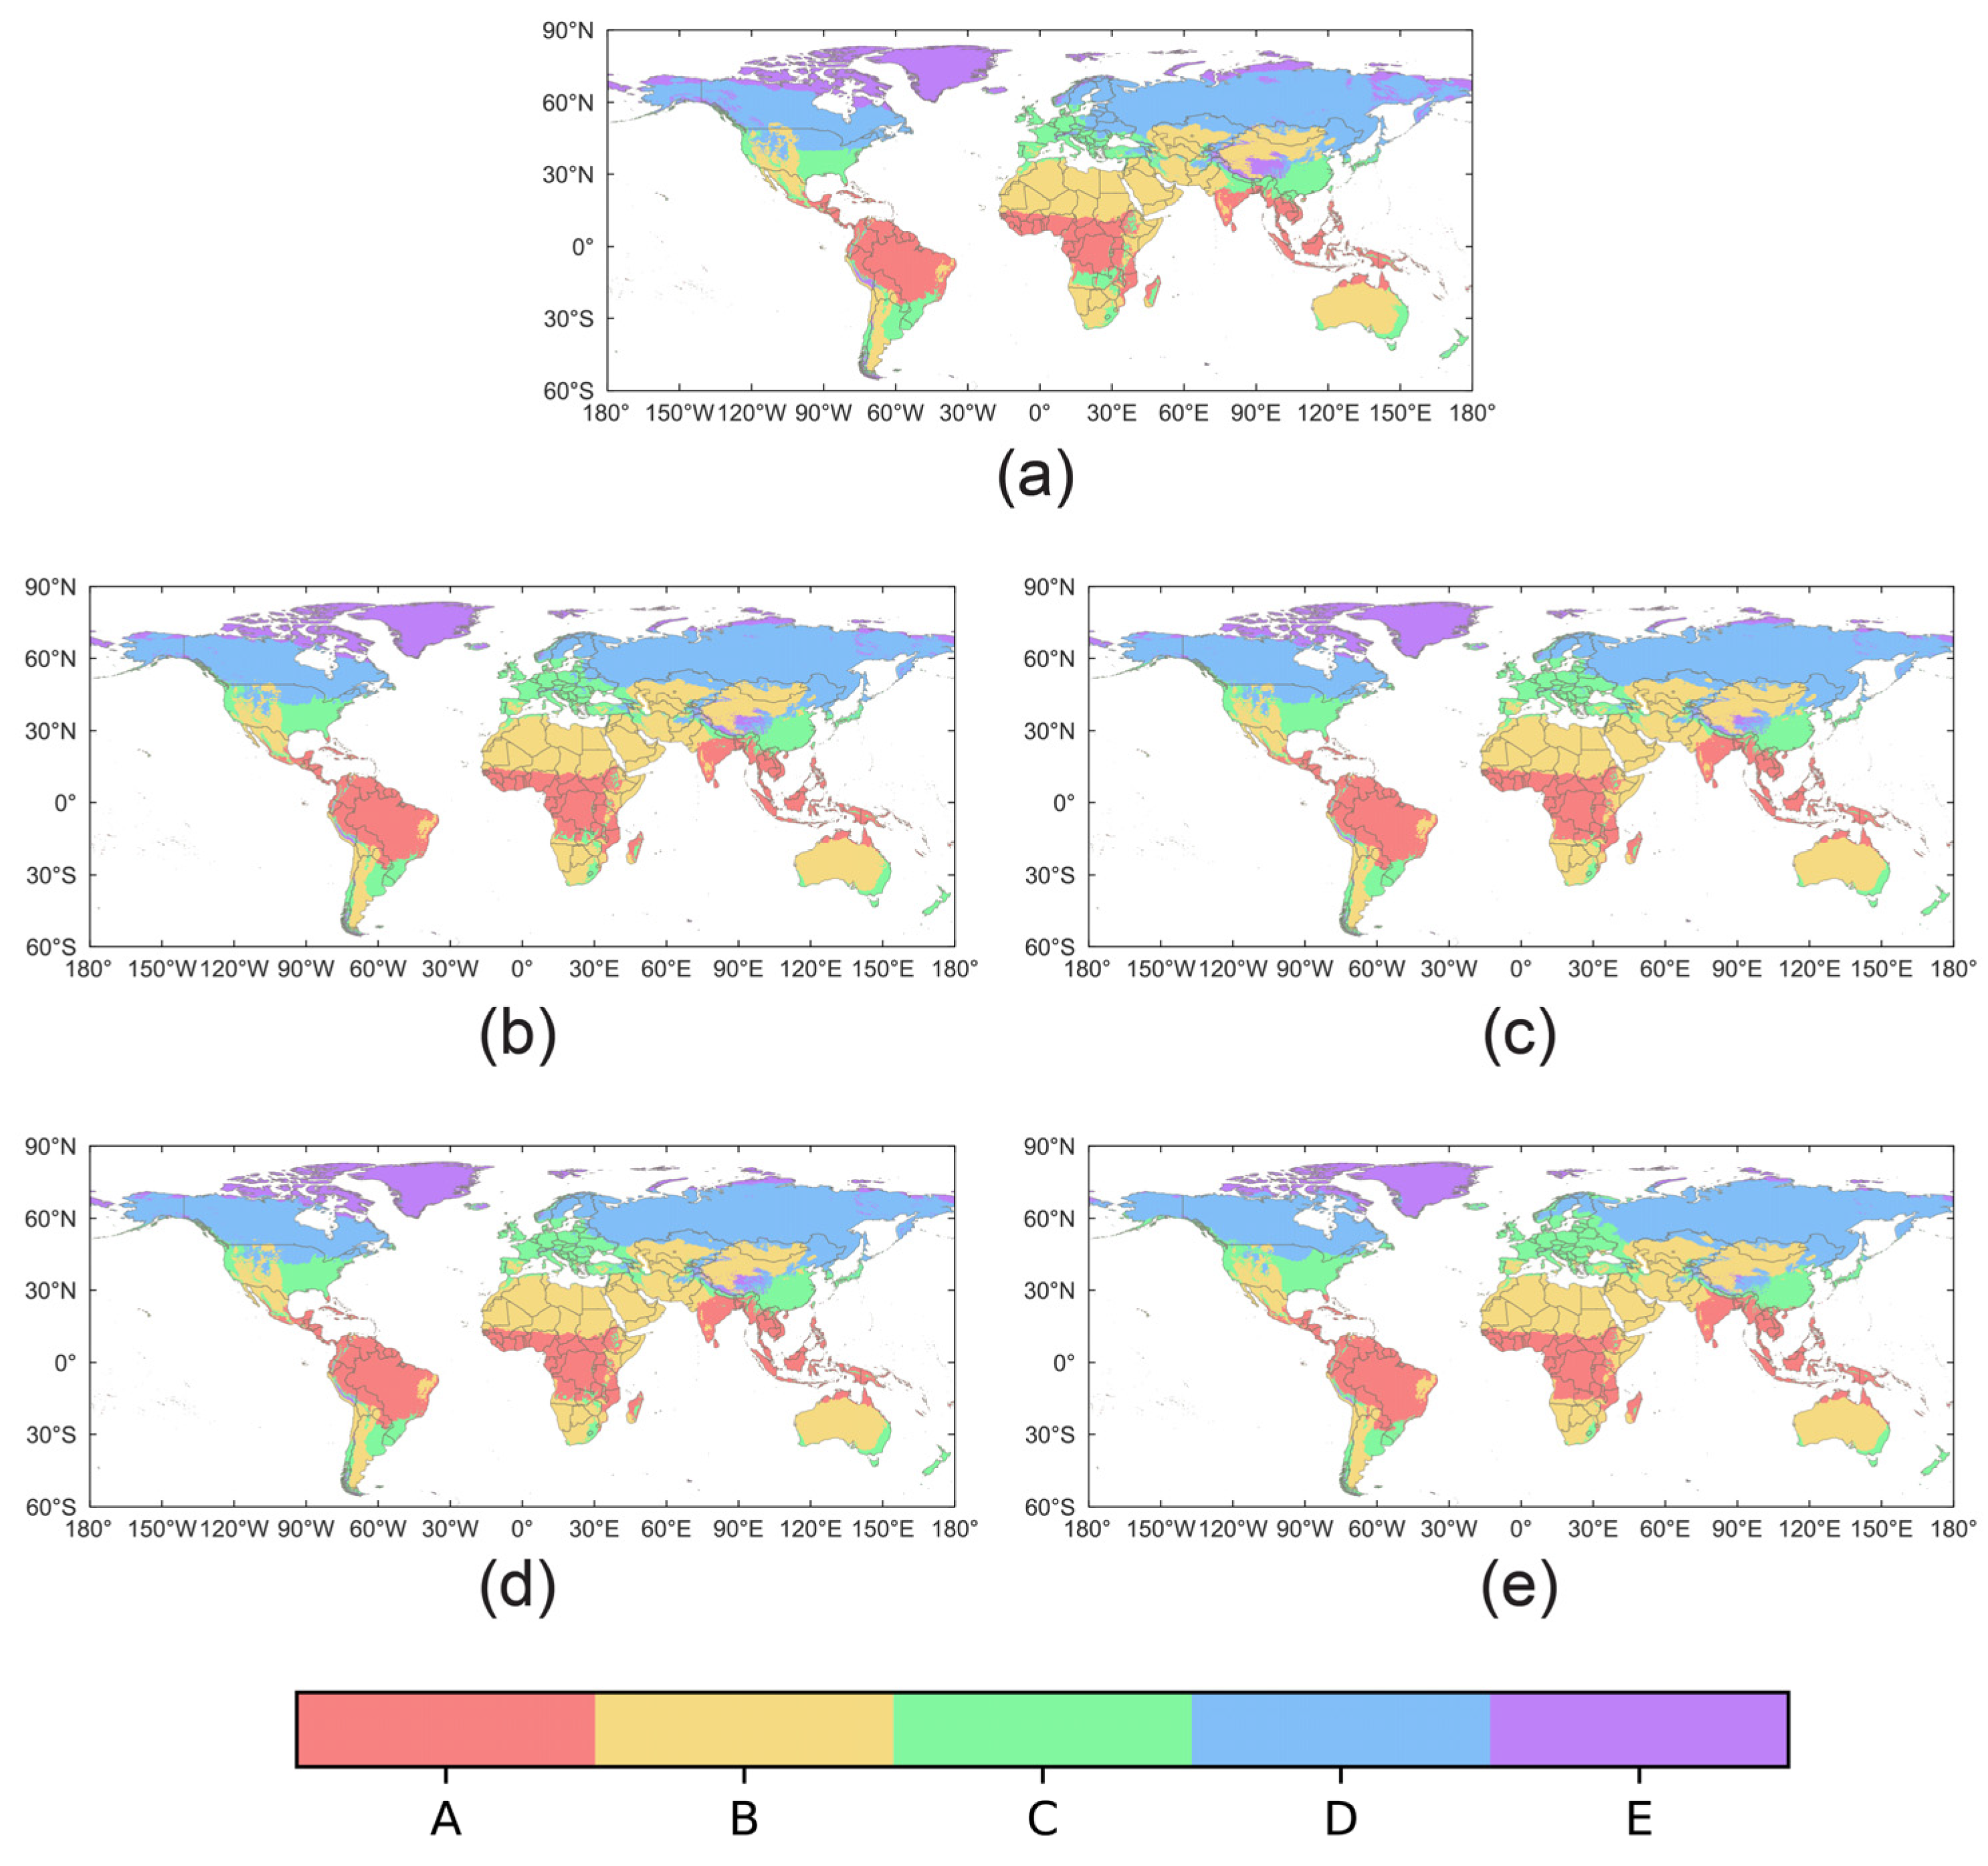
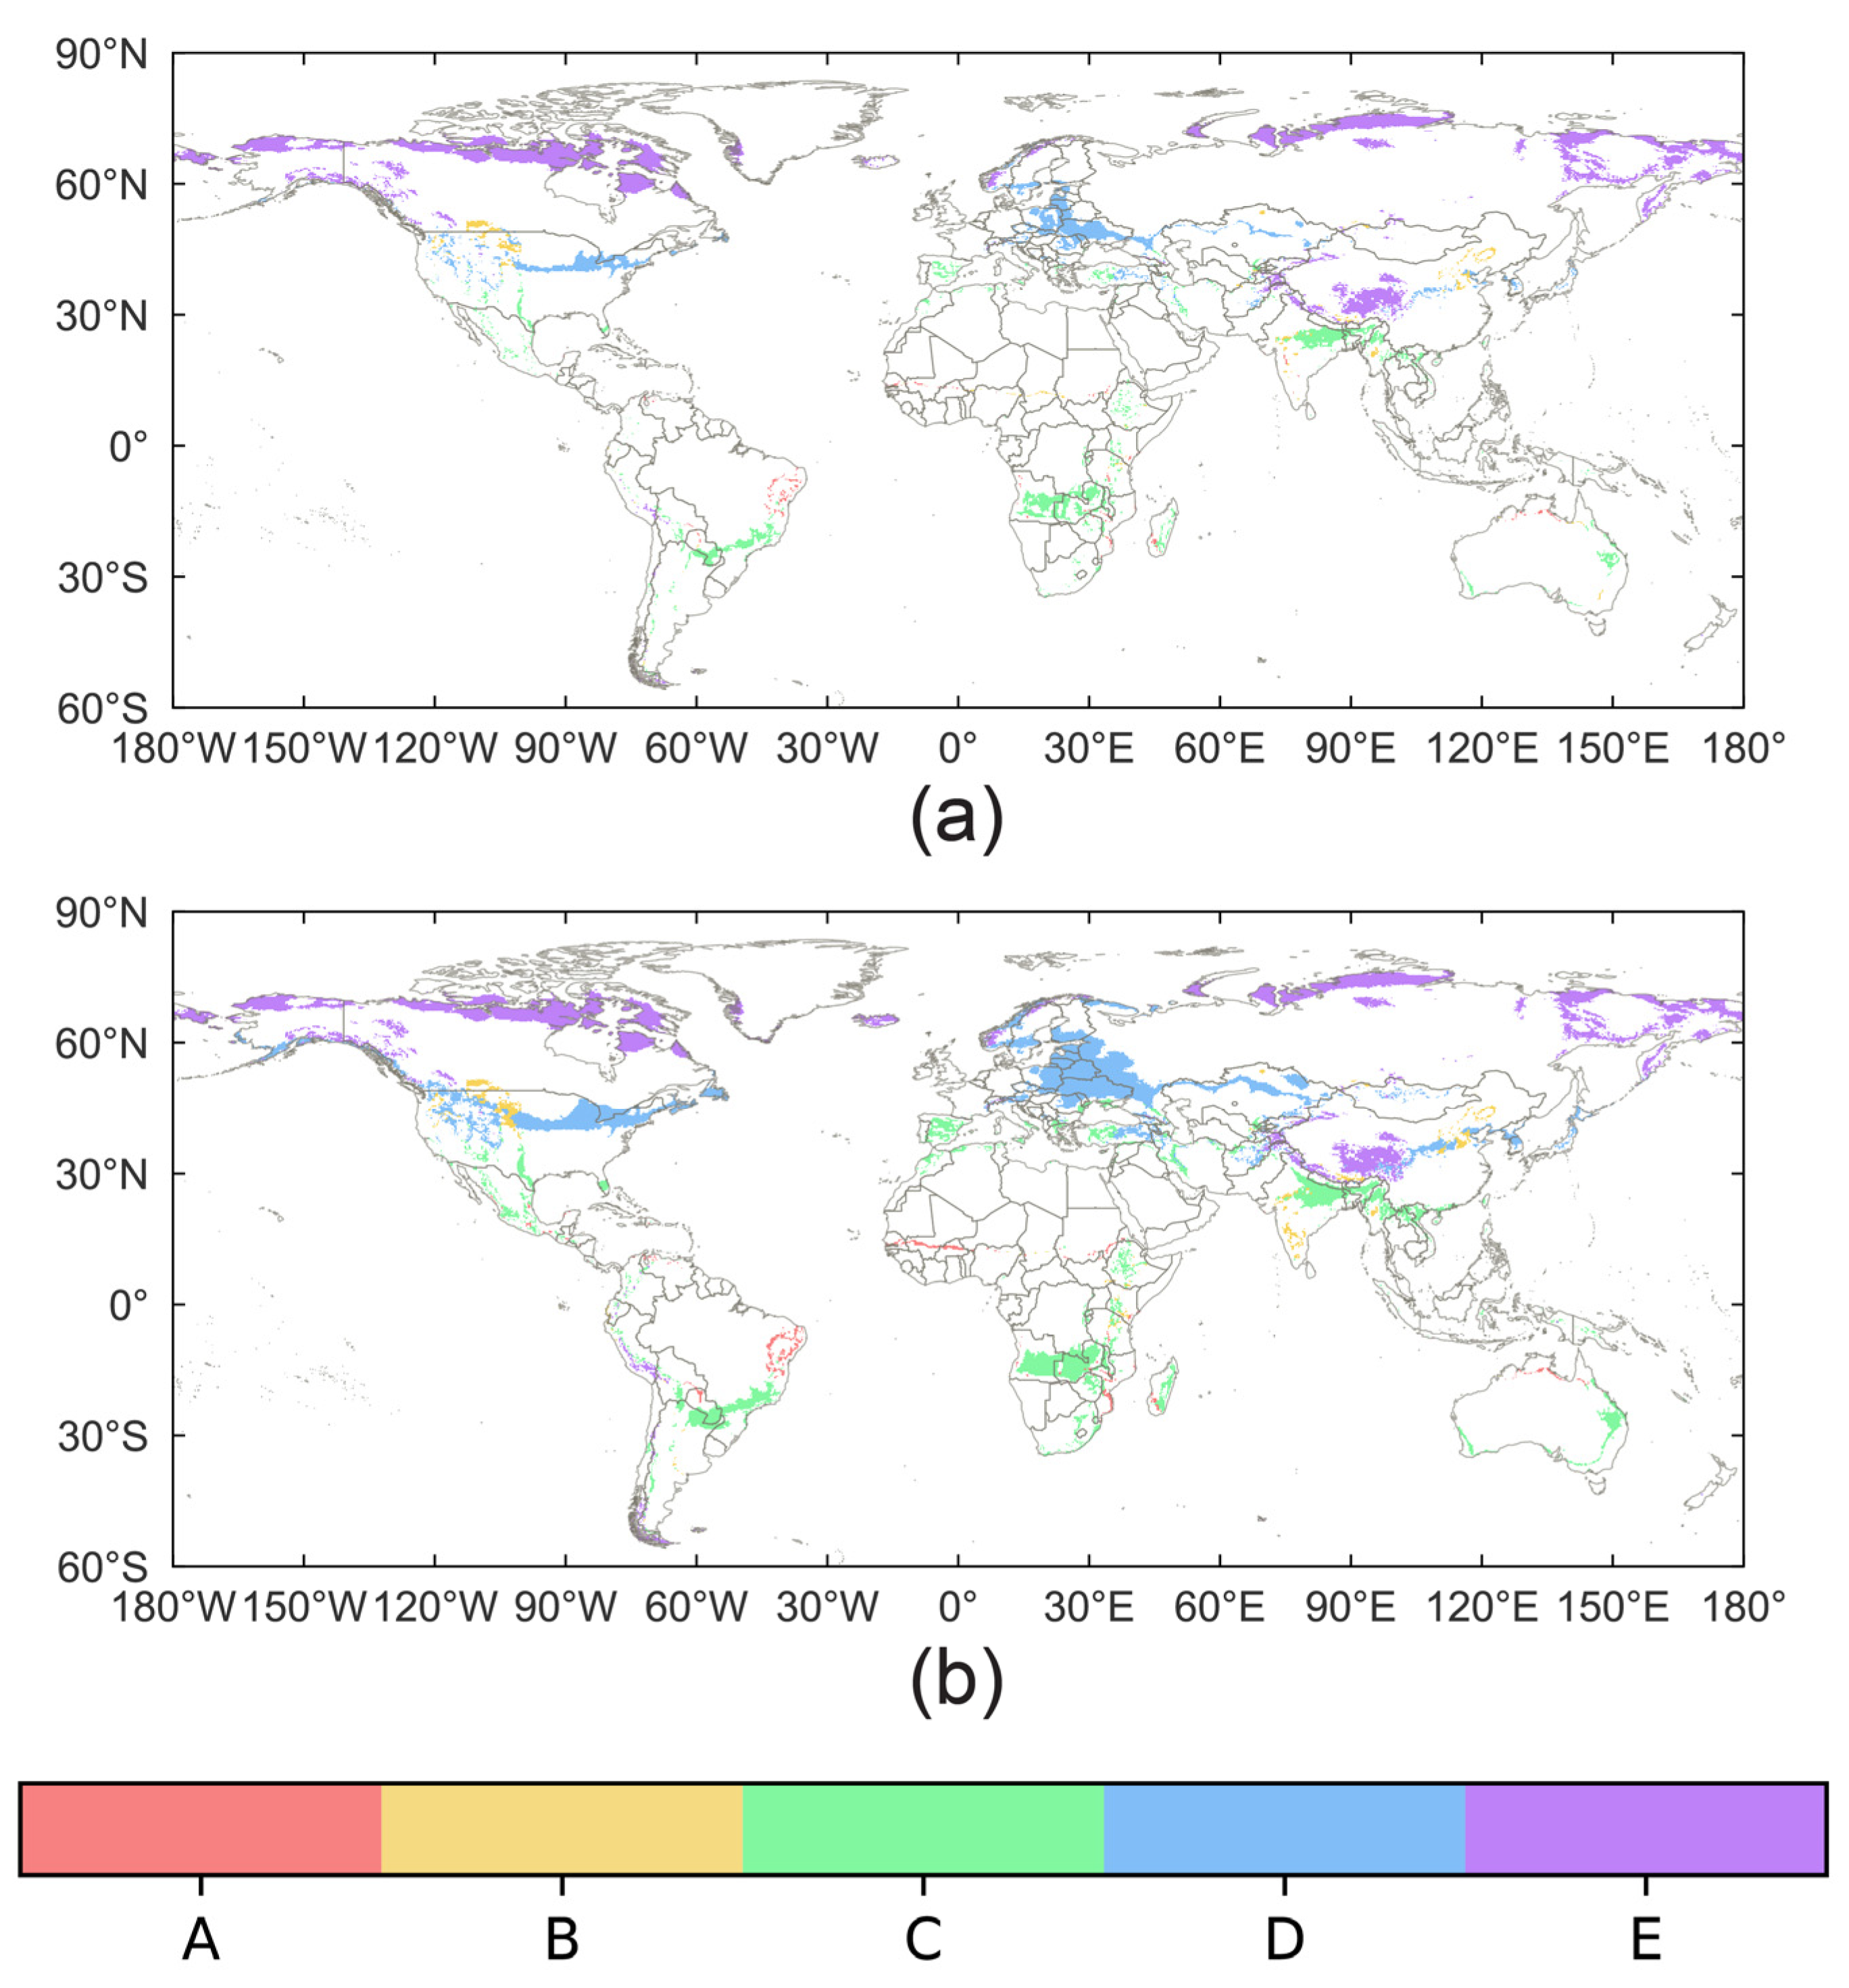
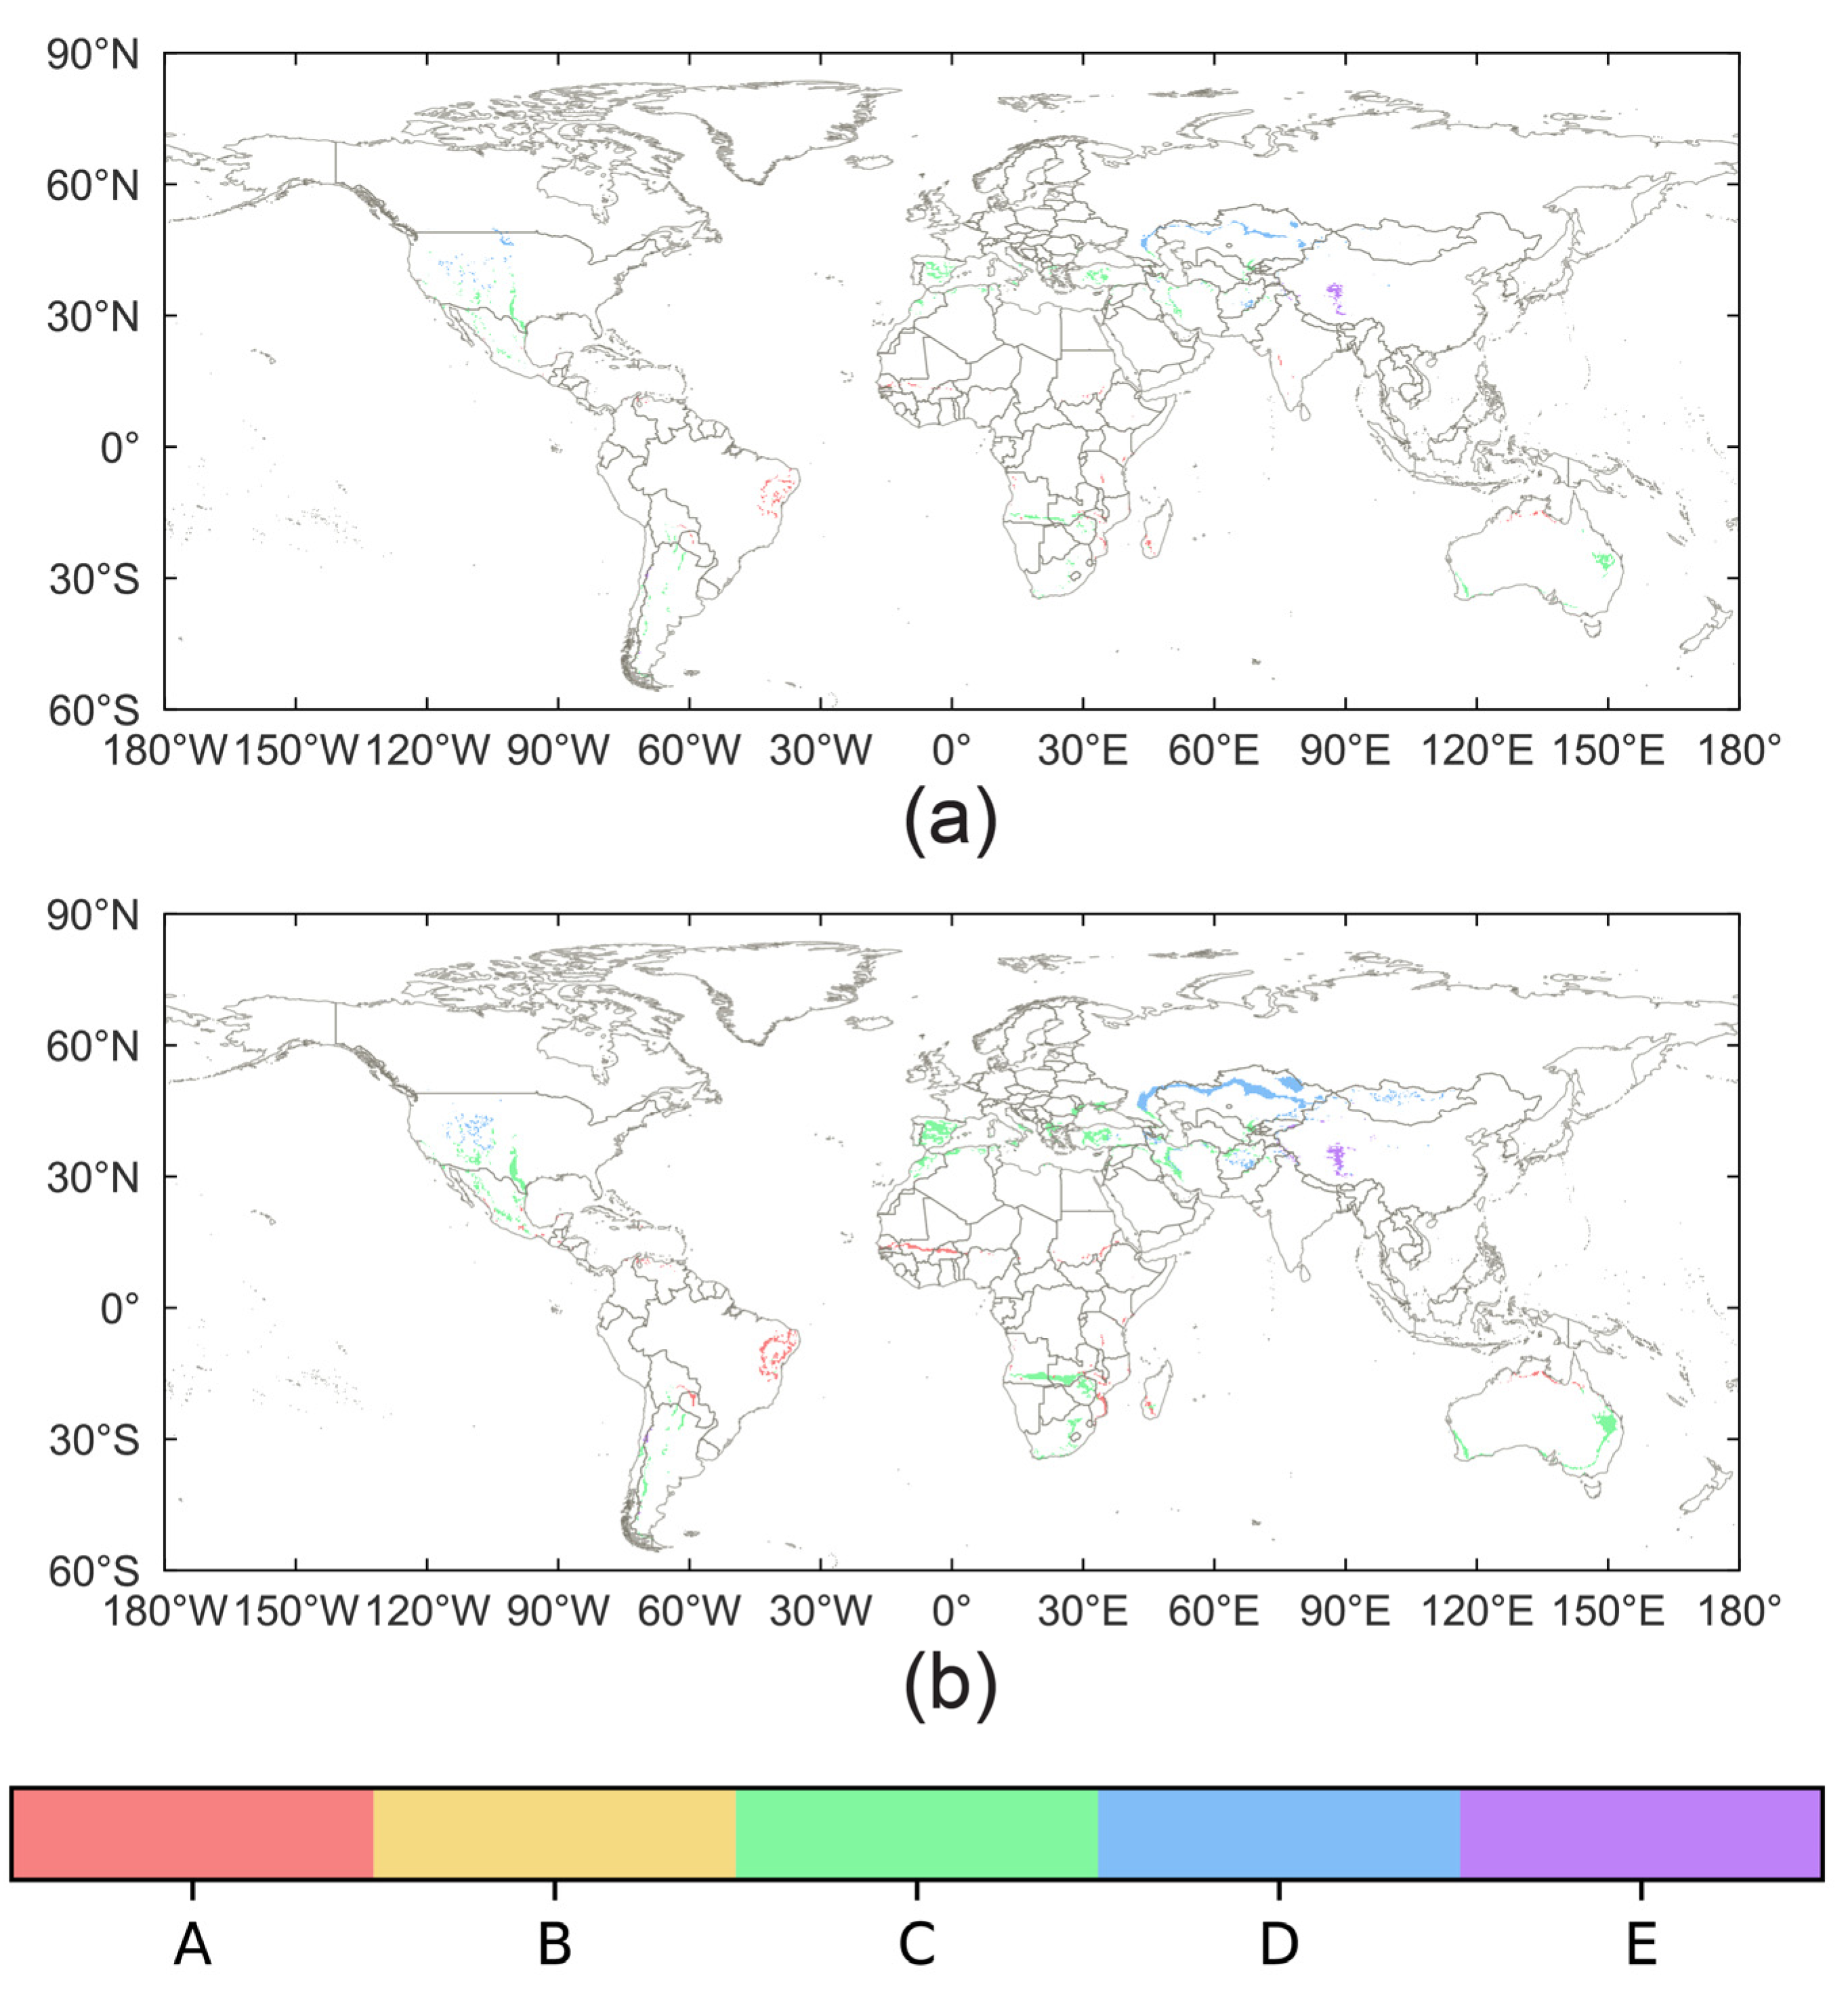
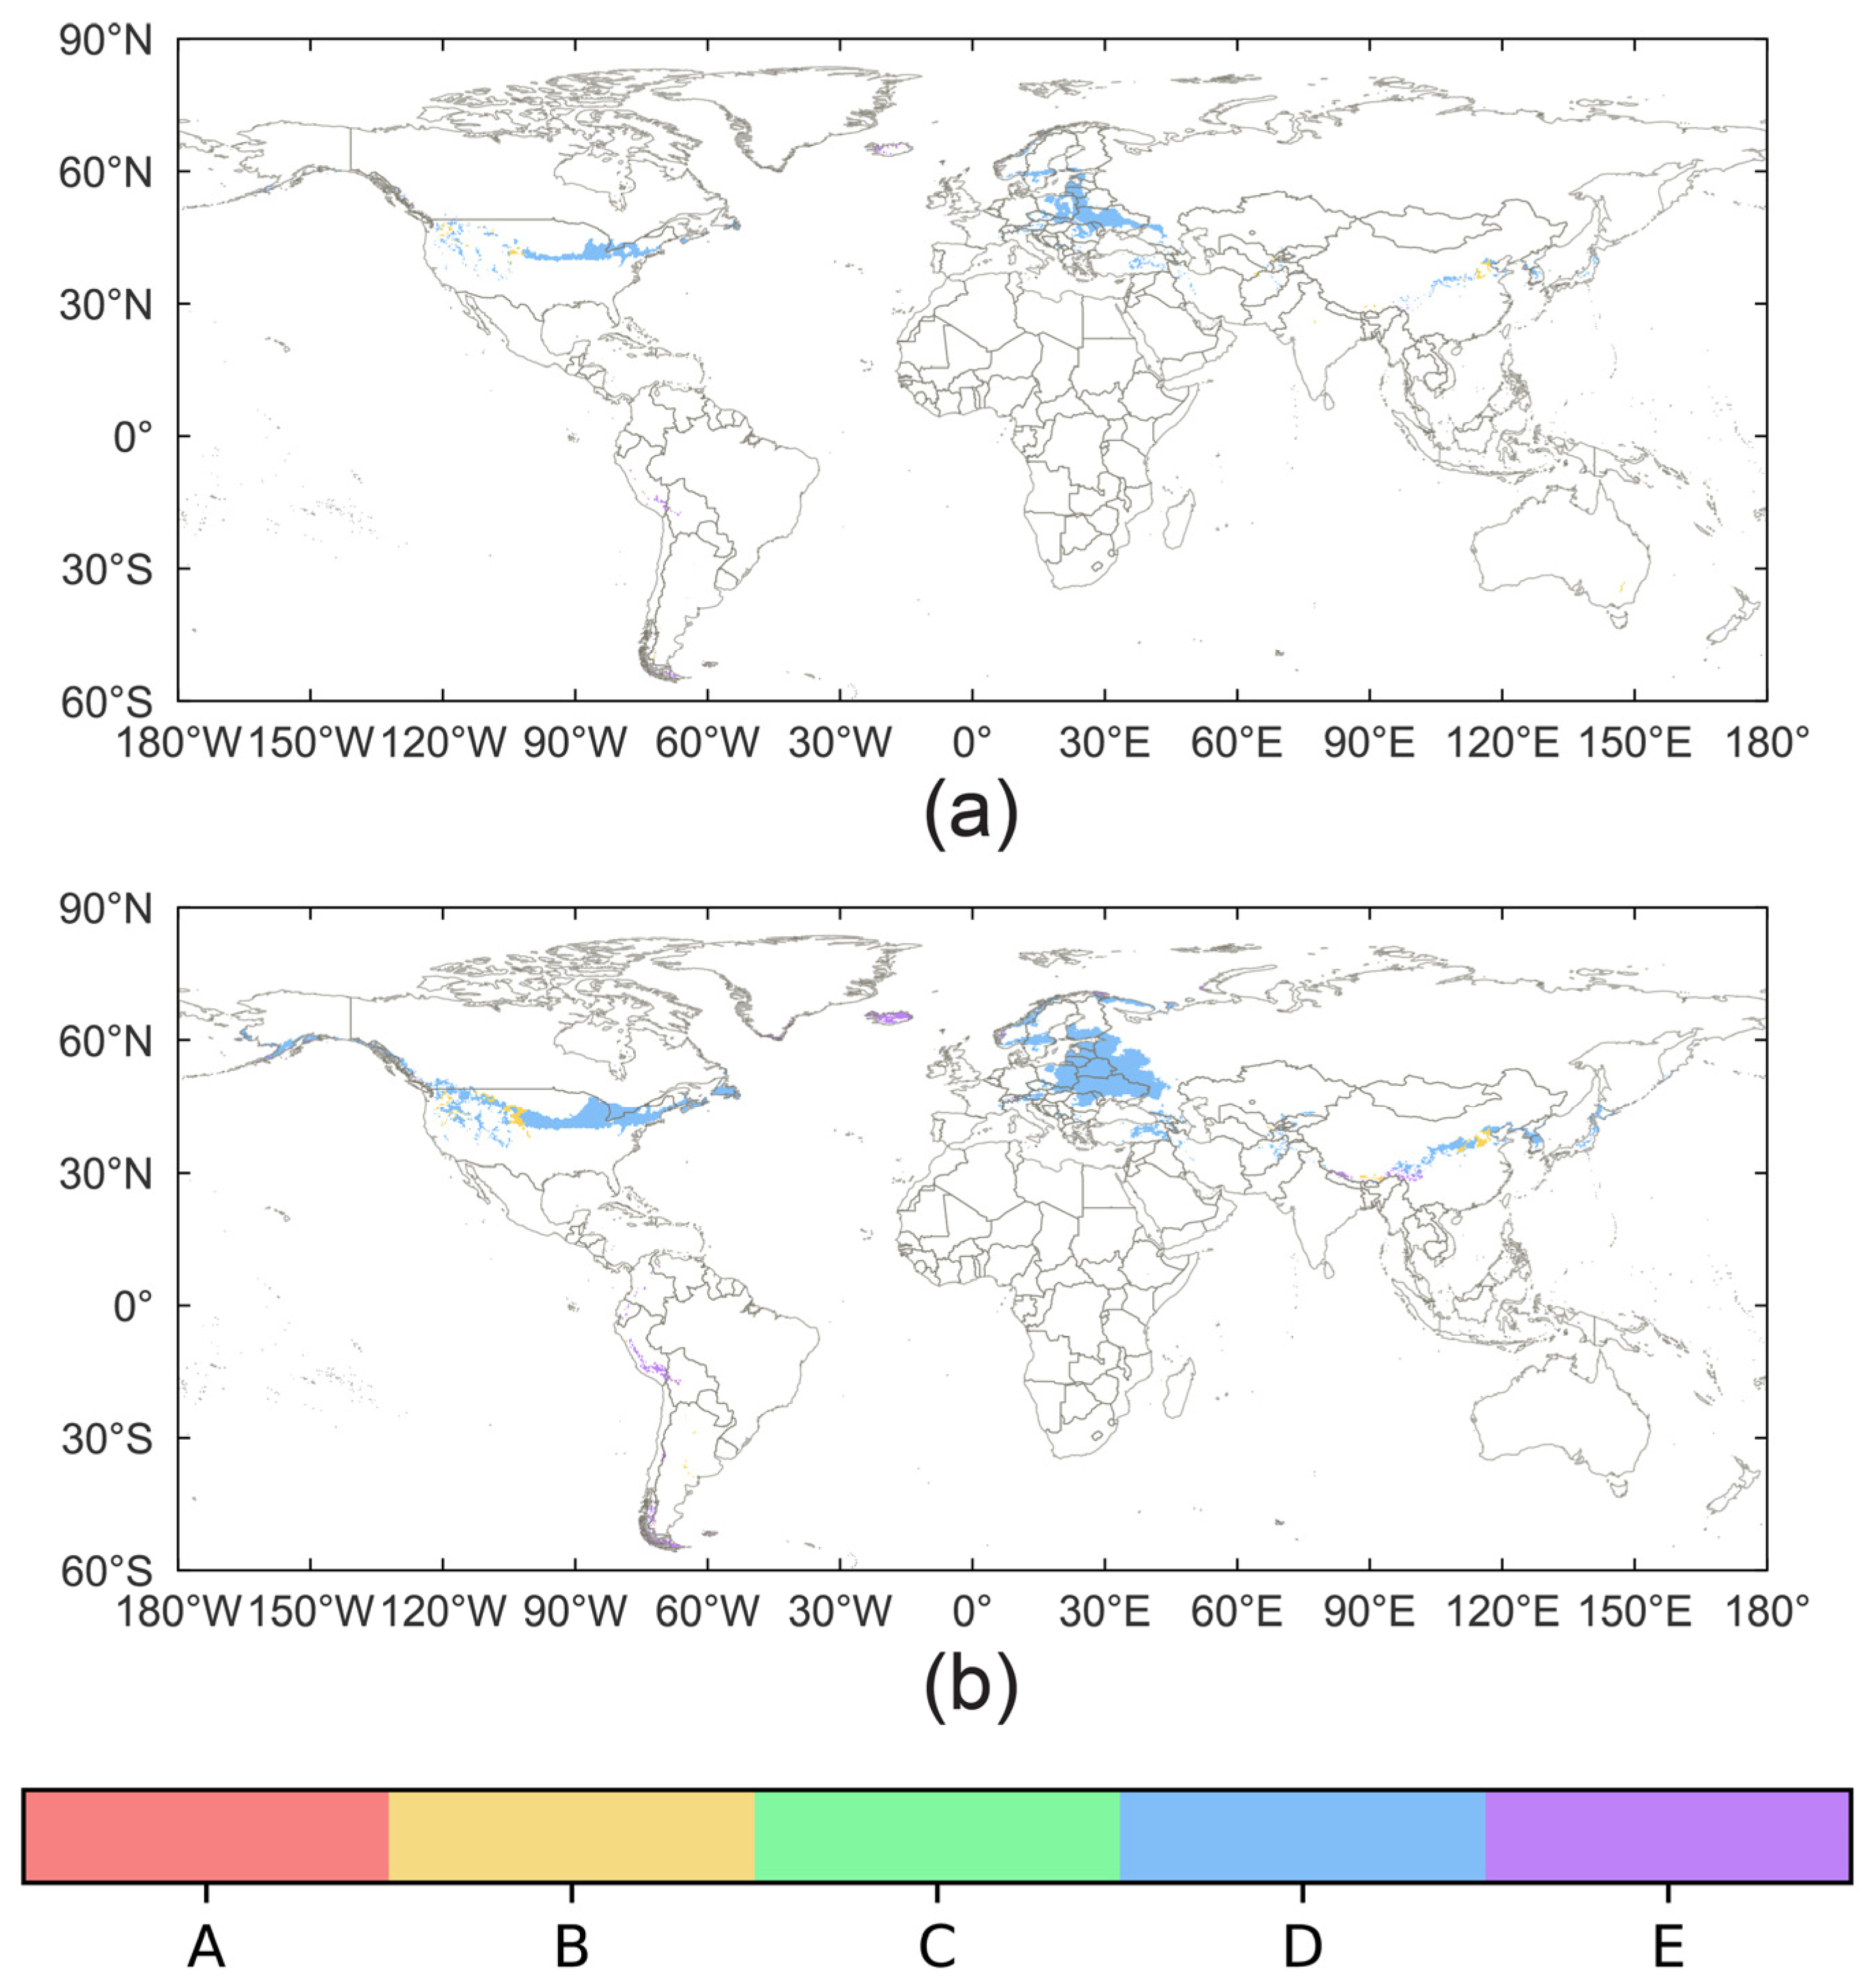
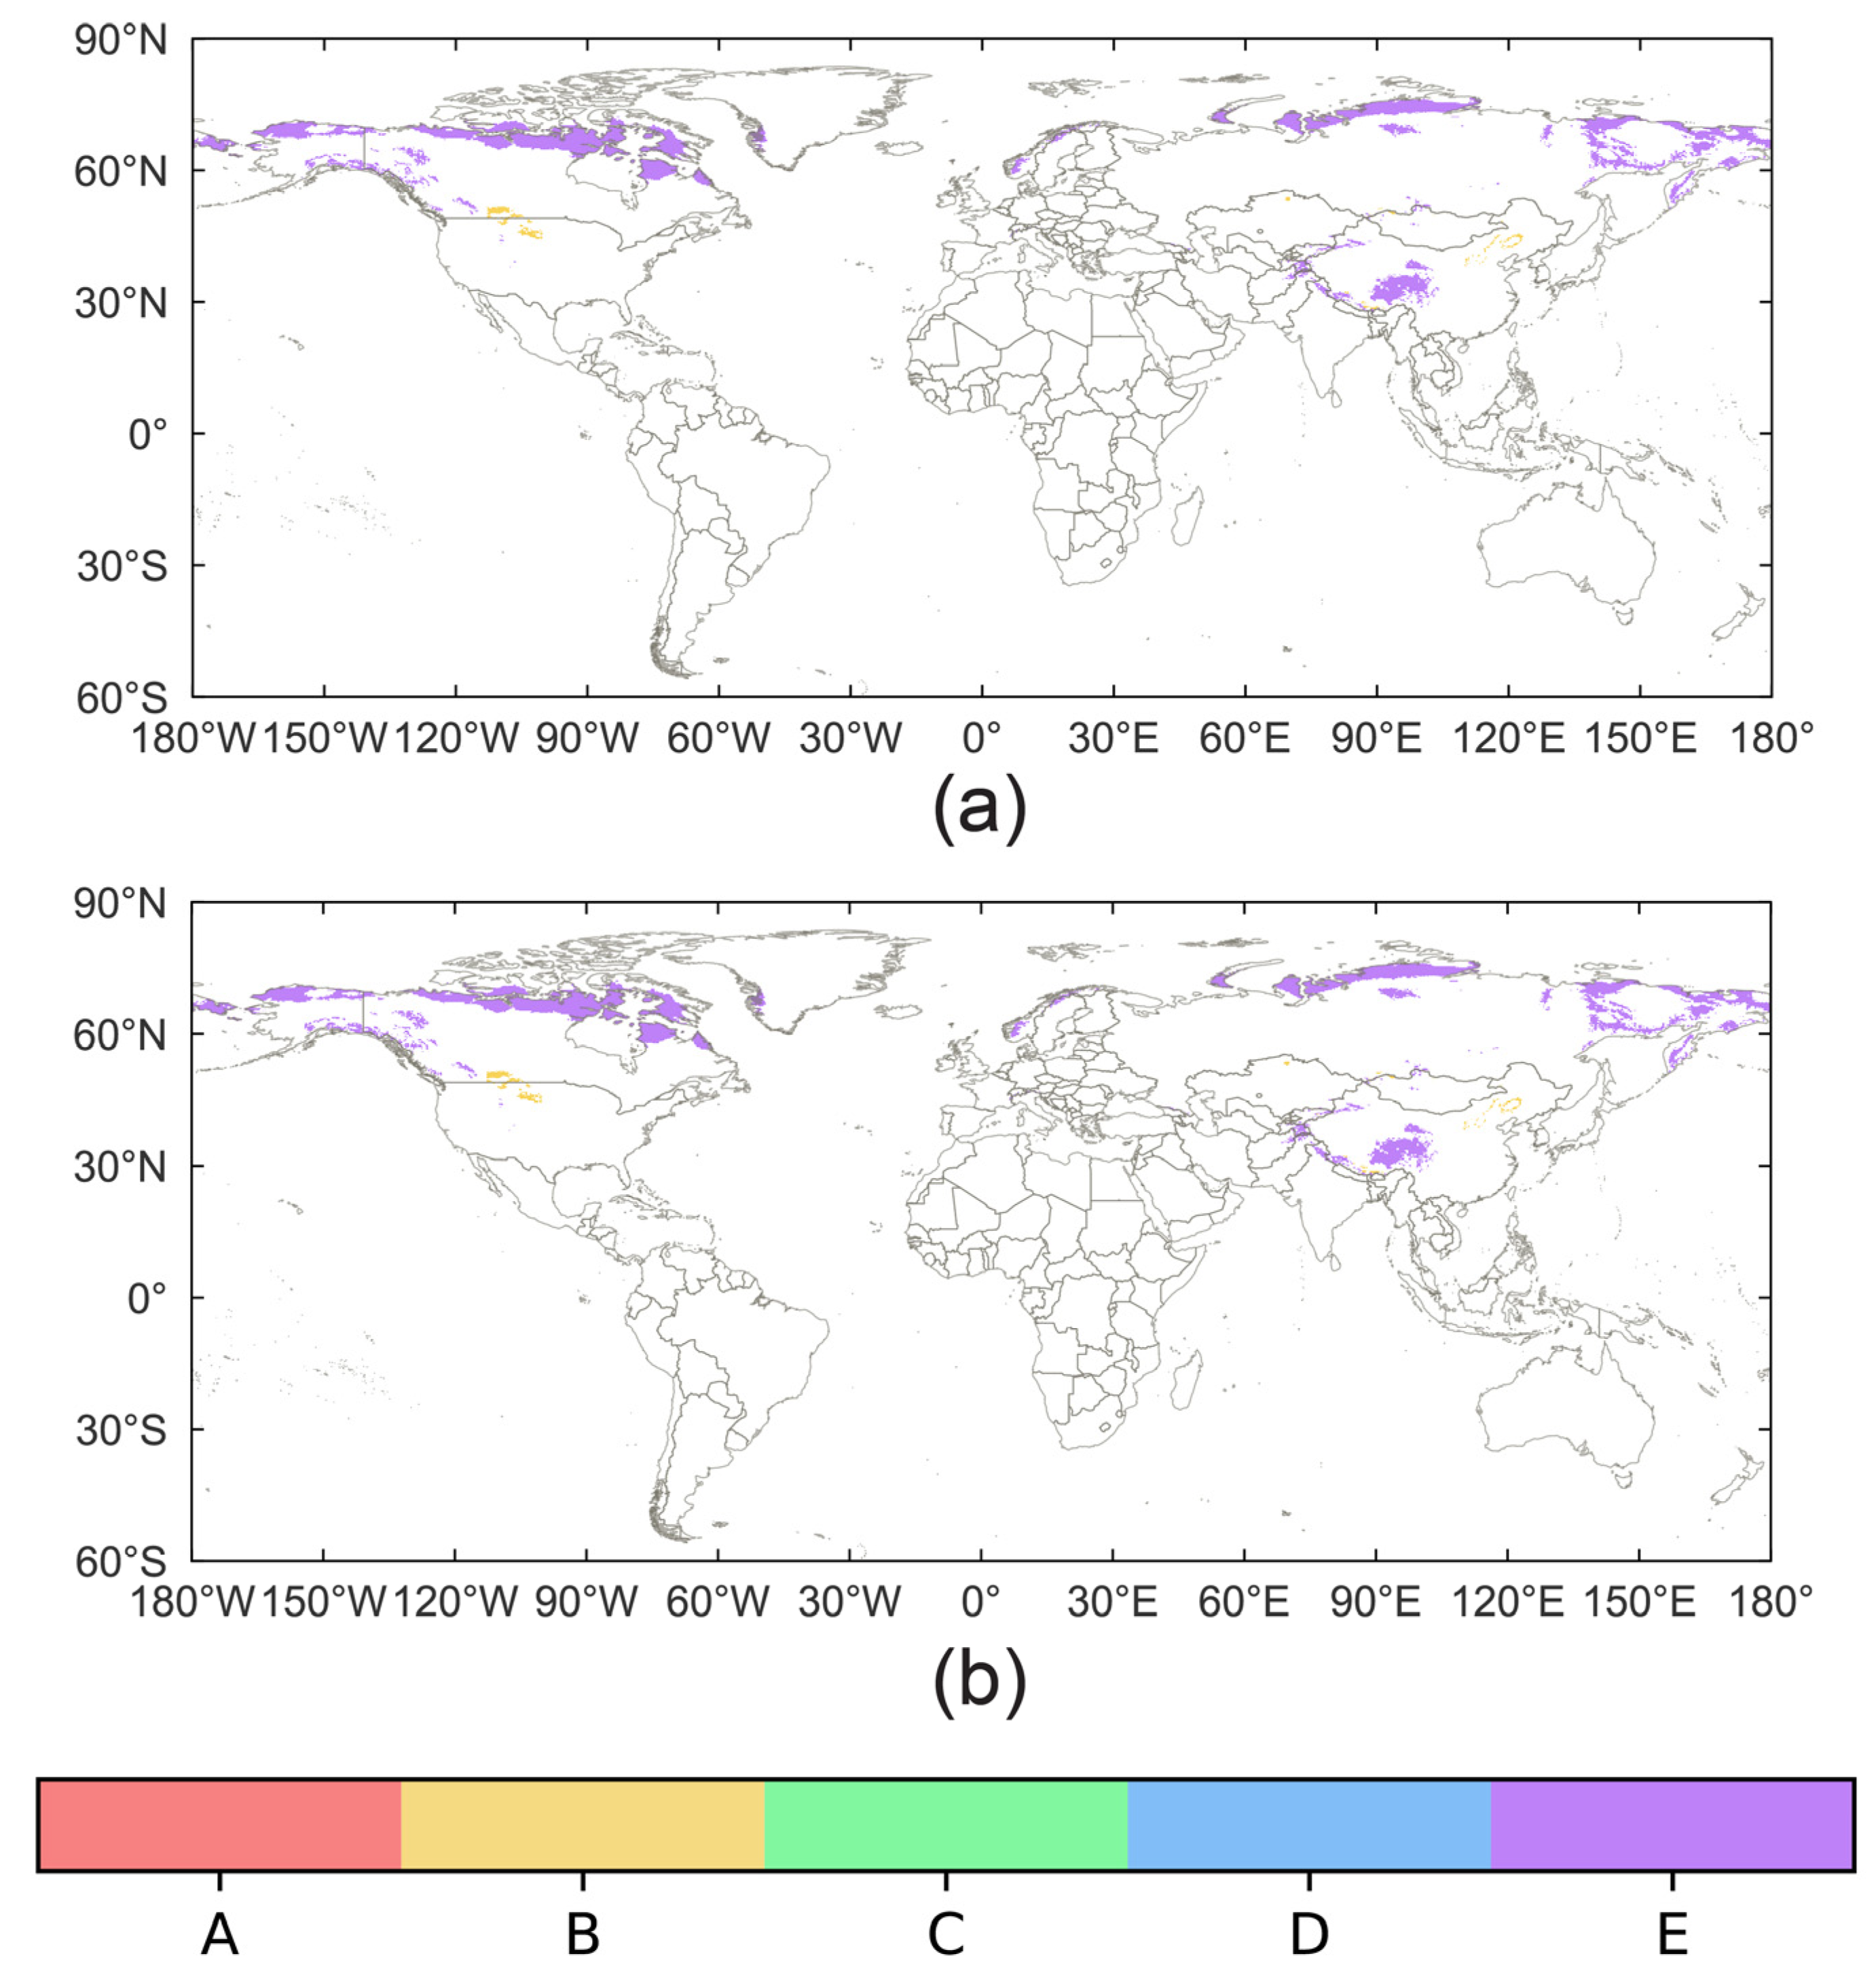
3.1. Projected Climate Zone Shifts

The distribution of climate zones is projected to change over the 21st century. Figure 1 displays the spatial patterns of climate zones in the Cui et al. (2021) [28] dataset. The spatial patterns of climate zone shifts are displayed in Appendix A (Figure A1, Figure A2, Figure A3, Figure A4 and Figure A5). Table 1 presents the proportion of the land surface within each climate zone. At mid-century under RCP4.5 (RCP8.5), 7.81% (10.17%) of the land area, excluding Antarctica, is projected to have shifted climate zones. By late-century, 9.31% (15.09%) of the land area is projected to have its climate zone classification change.
The tropical zone (Zone A) is projected to expand into higher latitudes (Figure 1) and account for a greater proportion of Earth’s land surface (Table 1). Its expansion is mainly into formerly temperate regions, notably in northern India, South Asia, and the Southern Hemisphere in Africa and South America (Figure A2). The tropical zone also gains area from formerly arid regions in Southern India, East Africa, and the Pacific coast of South America, especially under RCP8.5. The tropical zone loses area to the arid zone, notably in eastern Brazil and in Africa along the southern edge of the Sahel (Figure A3). Projected area gains greatly exceed projected losses, leading to growth in the proportion of land area classified as tropical. By late-century under RCP4.5 (RCP8.5), an additional 1.96% (2.74%) of the land surface is projected to be classified as tropical.
The arid zone (Zone B) is also projected to account for a greater proportion of the land surface (Table 1) as gains from the other zones exceed losses to the other zones (Figure 1). The largest gains come from formerly temperate regions (Figure A3). These include in the Mediterranean, southern Africa north of the Kalahari Desert, south-central United States, and eastern Australia. The next largest gains come from boreal regions, notably in Kazakhstan and southeastern Russia. The arid zone is projected to lose small amounts of area to the other zones. By late-century under RCP4.5 (RCP8.5), an additional 0.99% (2.28%) of the land surface is projected to be classified as arid.
The temperate zone (Zone C) is projected to gain and lose large amounts of area (Figure 1). The net effect can vary depending on the climate change trajectory and time window (Table 1). Gains are primarily from expansion into formerly boreal regions in North America, Eurasia, northern China, and the Korean Peninsula (Figure A4). It is particularly notable in Eastern Europe and the northeastern United States, especially under RCP8.5 by late-century. Most of the losses for the temperate zone are the gains for the tropical and arid zones (Figure A2 and Figure A3). The land surface classified as temperate is projected to decrease monotonically under RCP4.5. Under RCP8.5, it is projected to decrease rapidly to mid-century, followed by a moderate reversal by late-century.
The boreal zone (Zone D) is also projected to have large gains and losses (Figure 1). The net effect also depends on the climate change trajectory (Table 1). Gains are primarily from the polar zone in the high latitudes of the Northern Hemisphere and high elevations of High-Mountain Asia (Figure A5). Expansion into Siberia and northern Canada is especially acute by late-century under RCP8.5. Most of the losses for the boreal zone are the primary gains for the temperate zone (Figure A4). The land surface classified as boreal is projected to decrease monotonically under RCP8.5. Under RCP4.5, its projected net changes are negligible.
The polar zone (Zone E), which occupies the highest latitudes and elevations in the historical period, is projected to contract (Figure 1, Table 1). There are no perceivable gains for this zone. Most of its losses are the primary gains for the boreal zone (Figure A5). Some losses are to the temperate zone, notably in Iceland and the Andes mountains of South America (Figure A4). By late-century under RCP4.5 (RCP8.5), the polar region is projected to lose an area equivalent to 2.68% (4.15%) of the land surface.

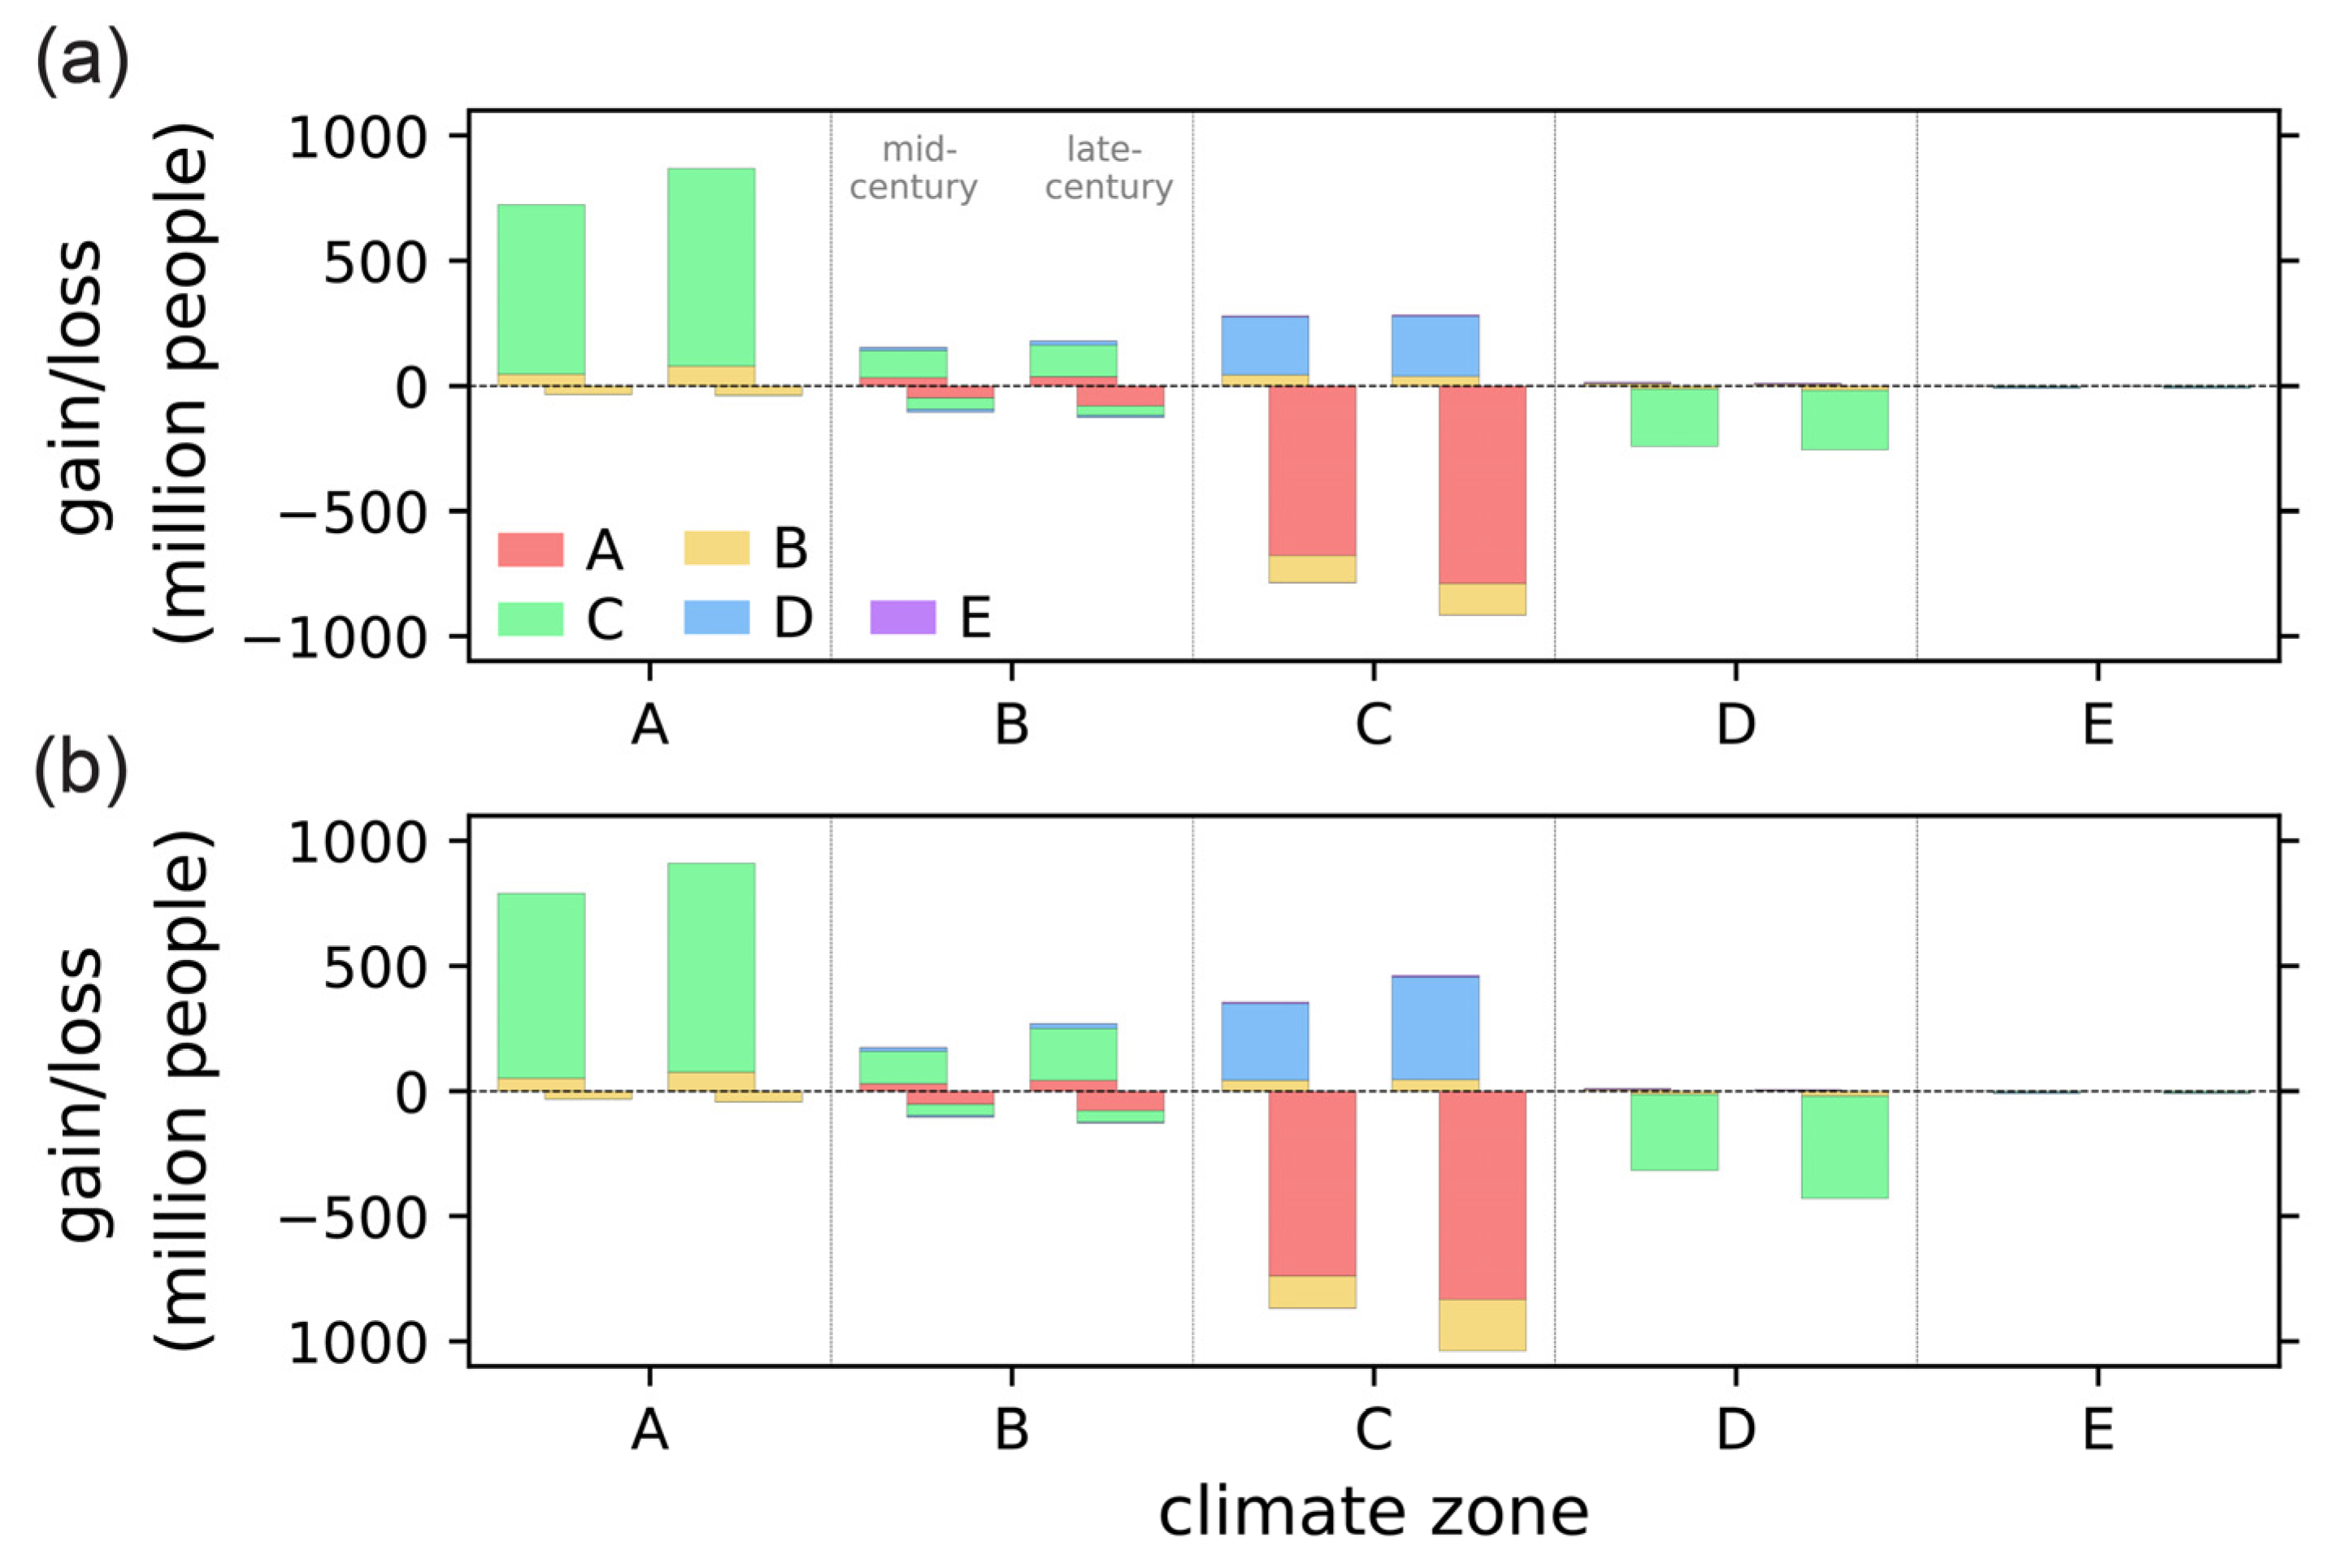
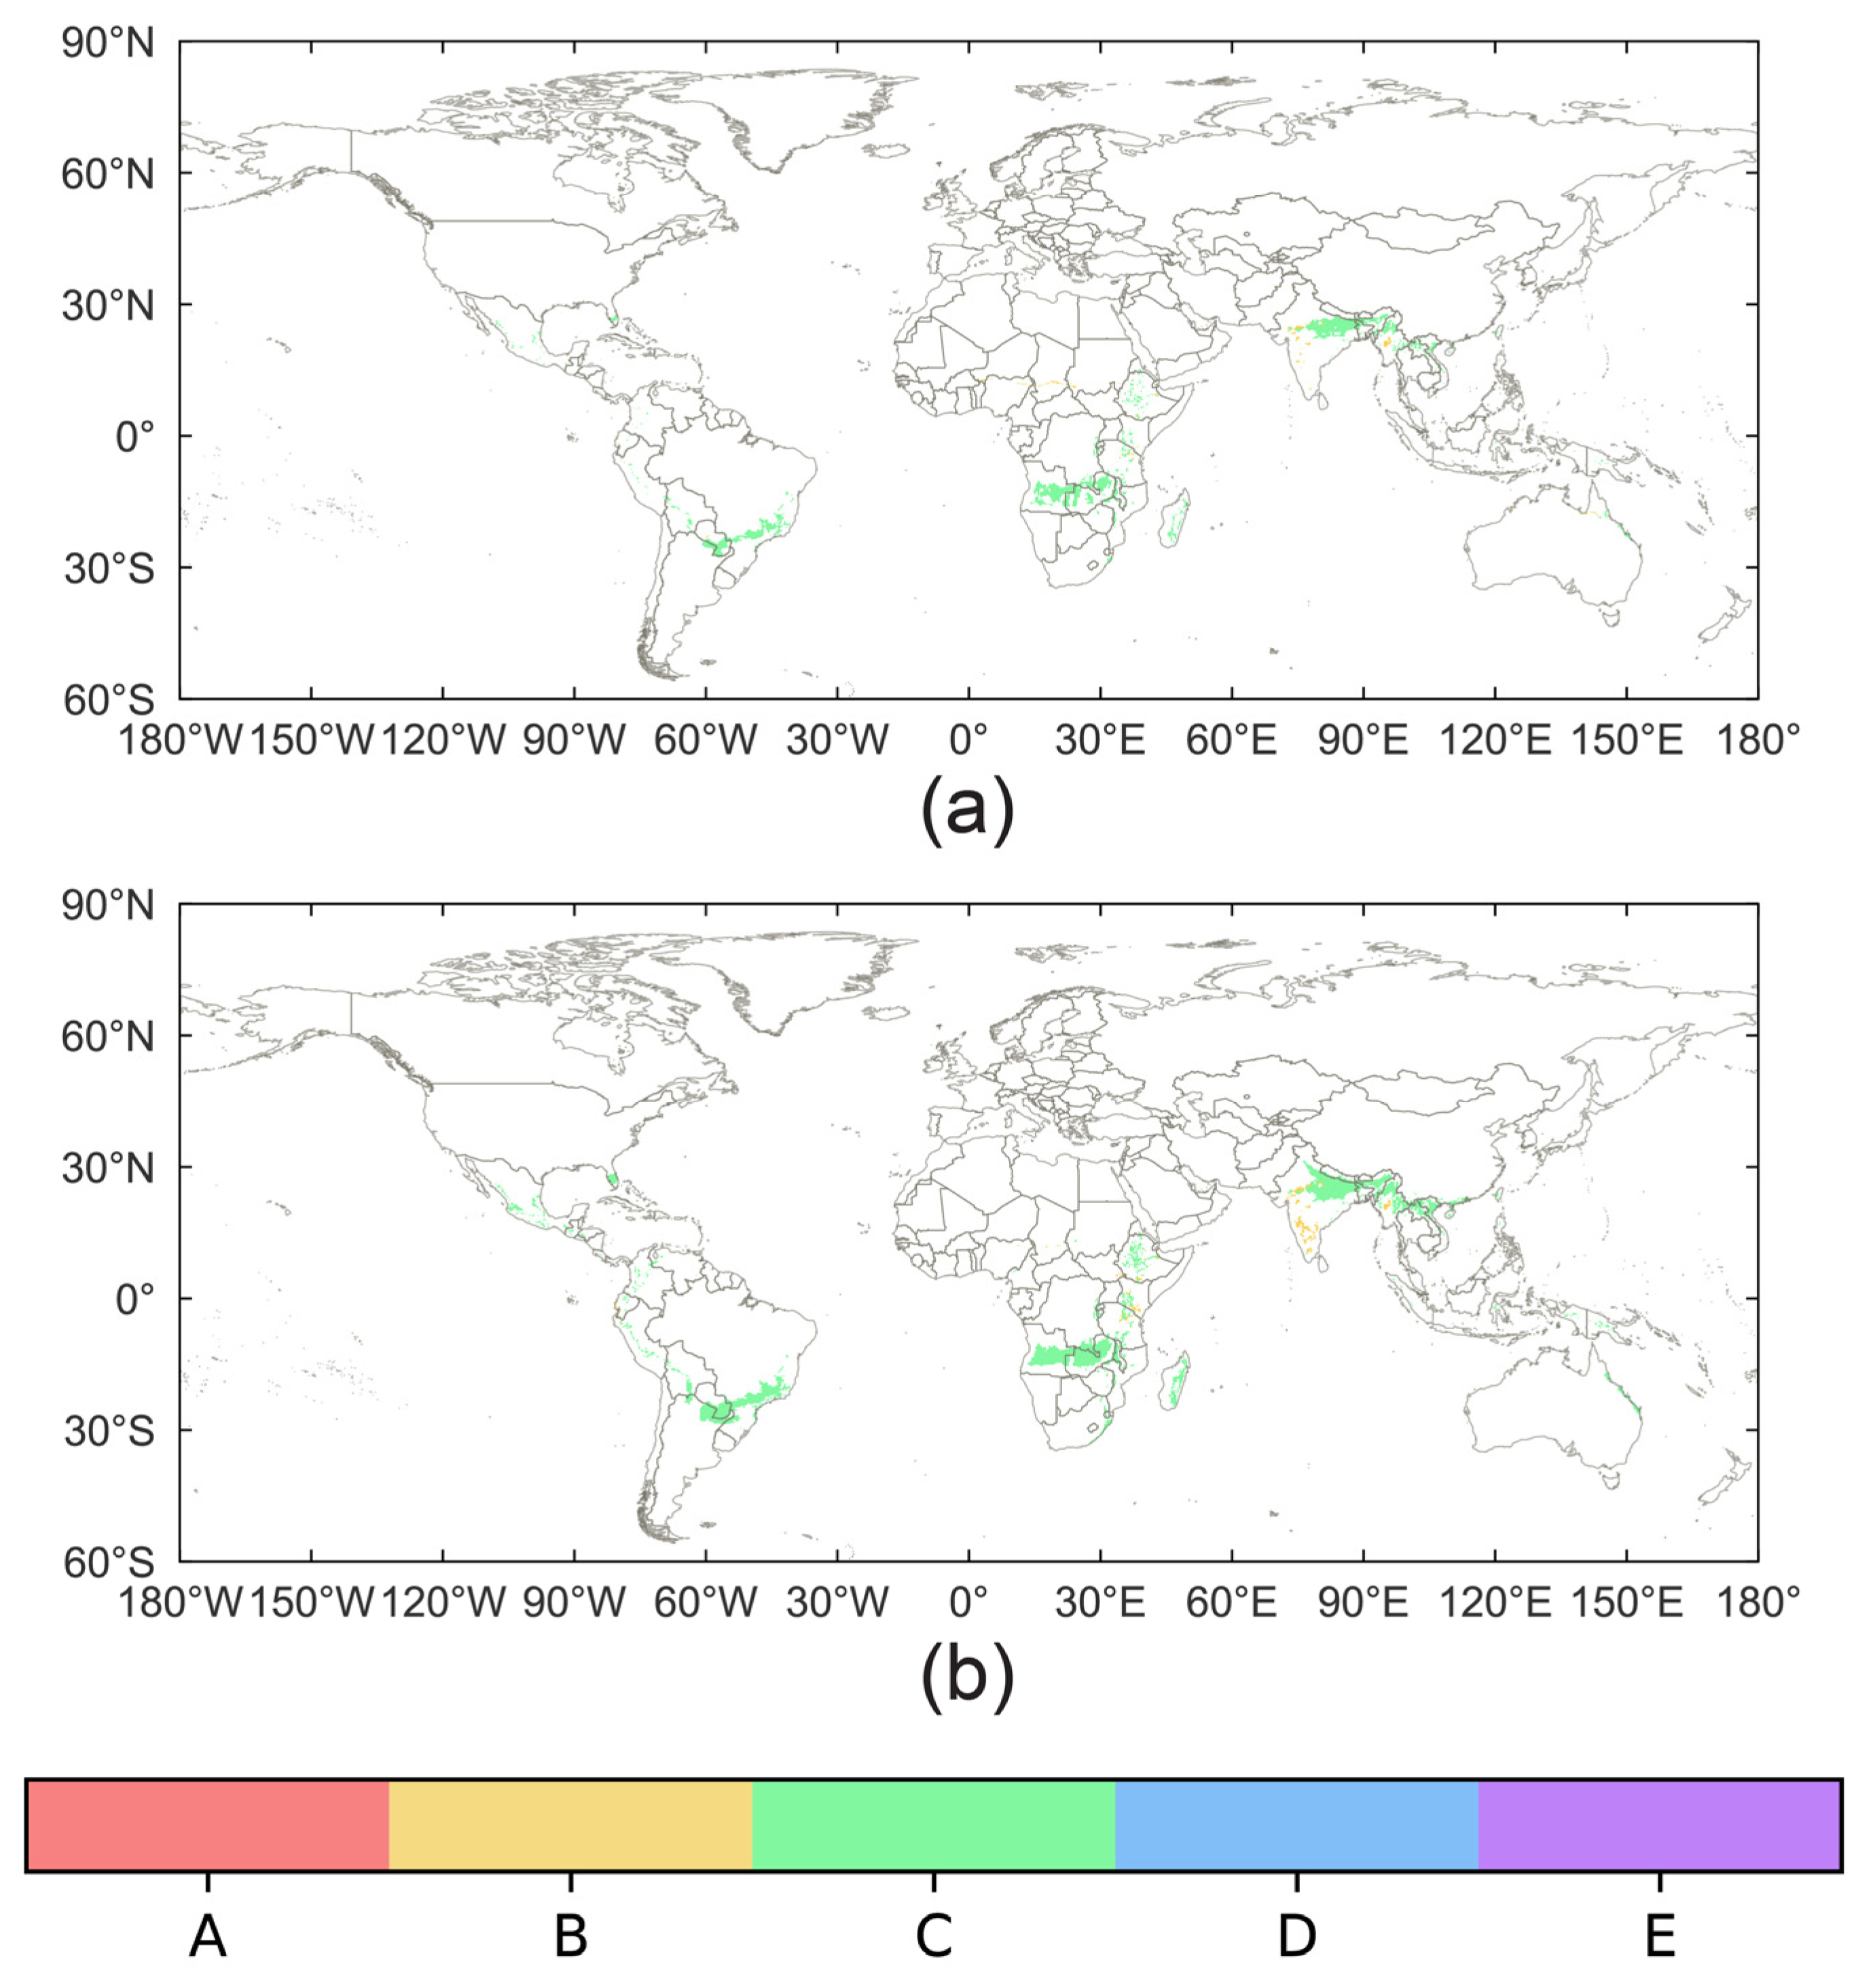
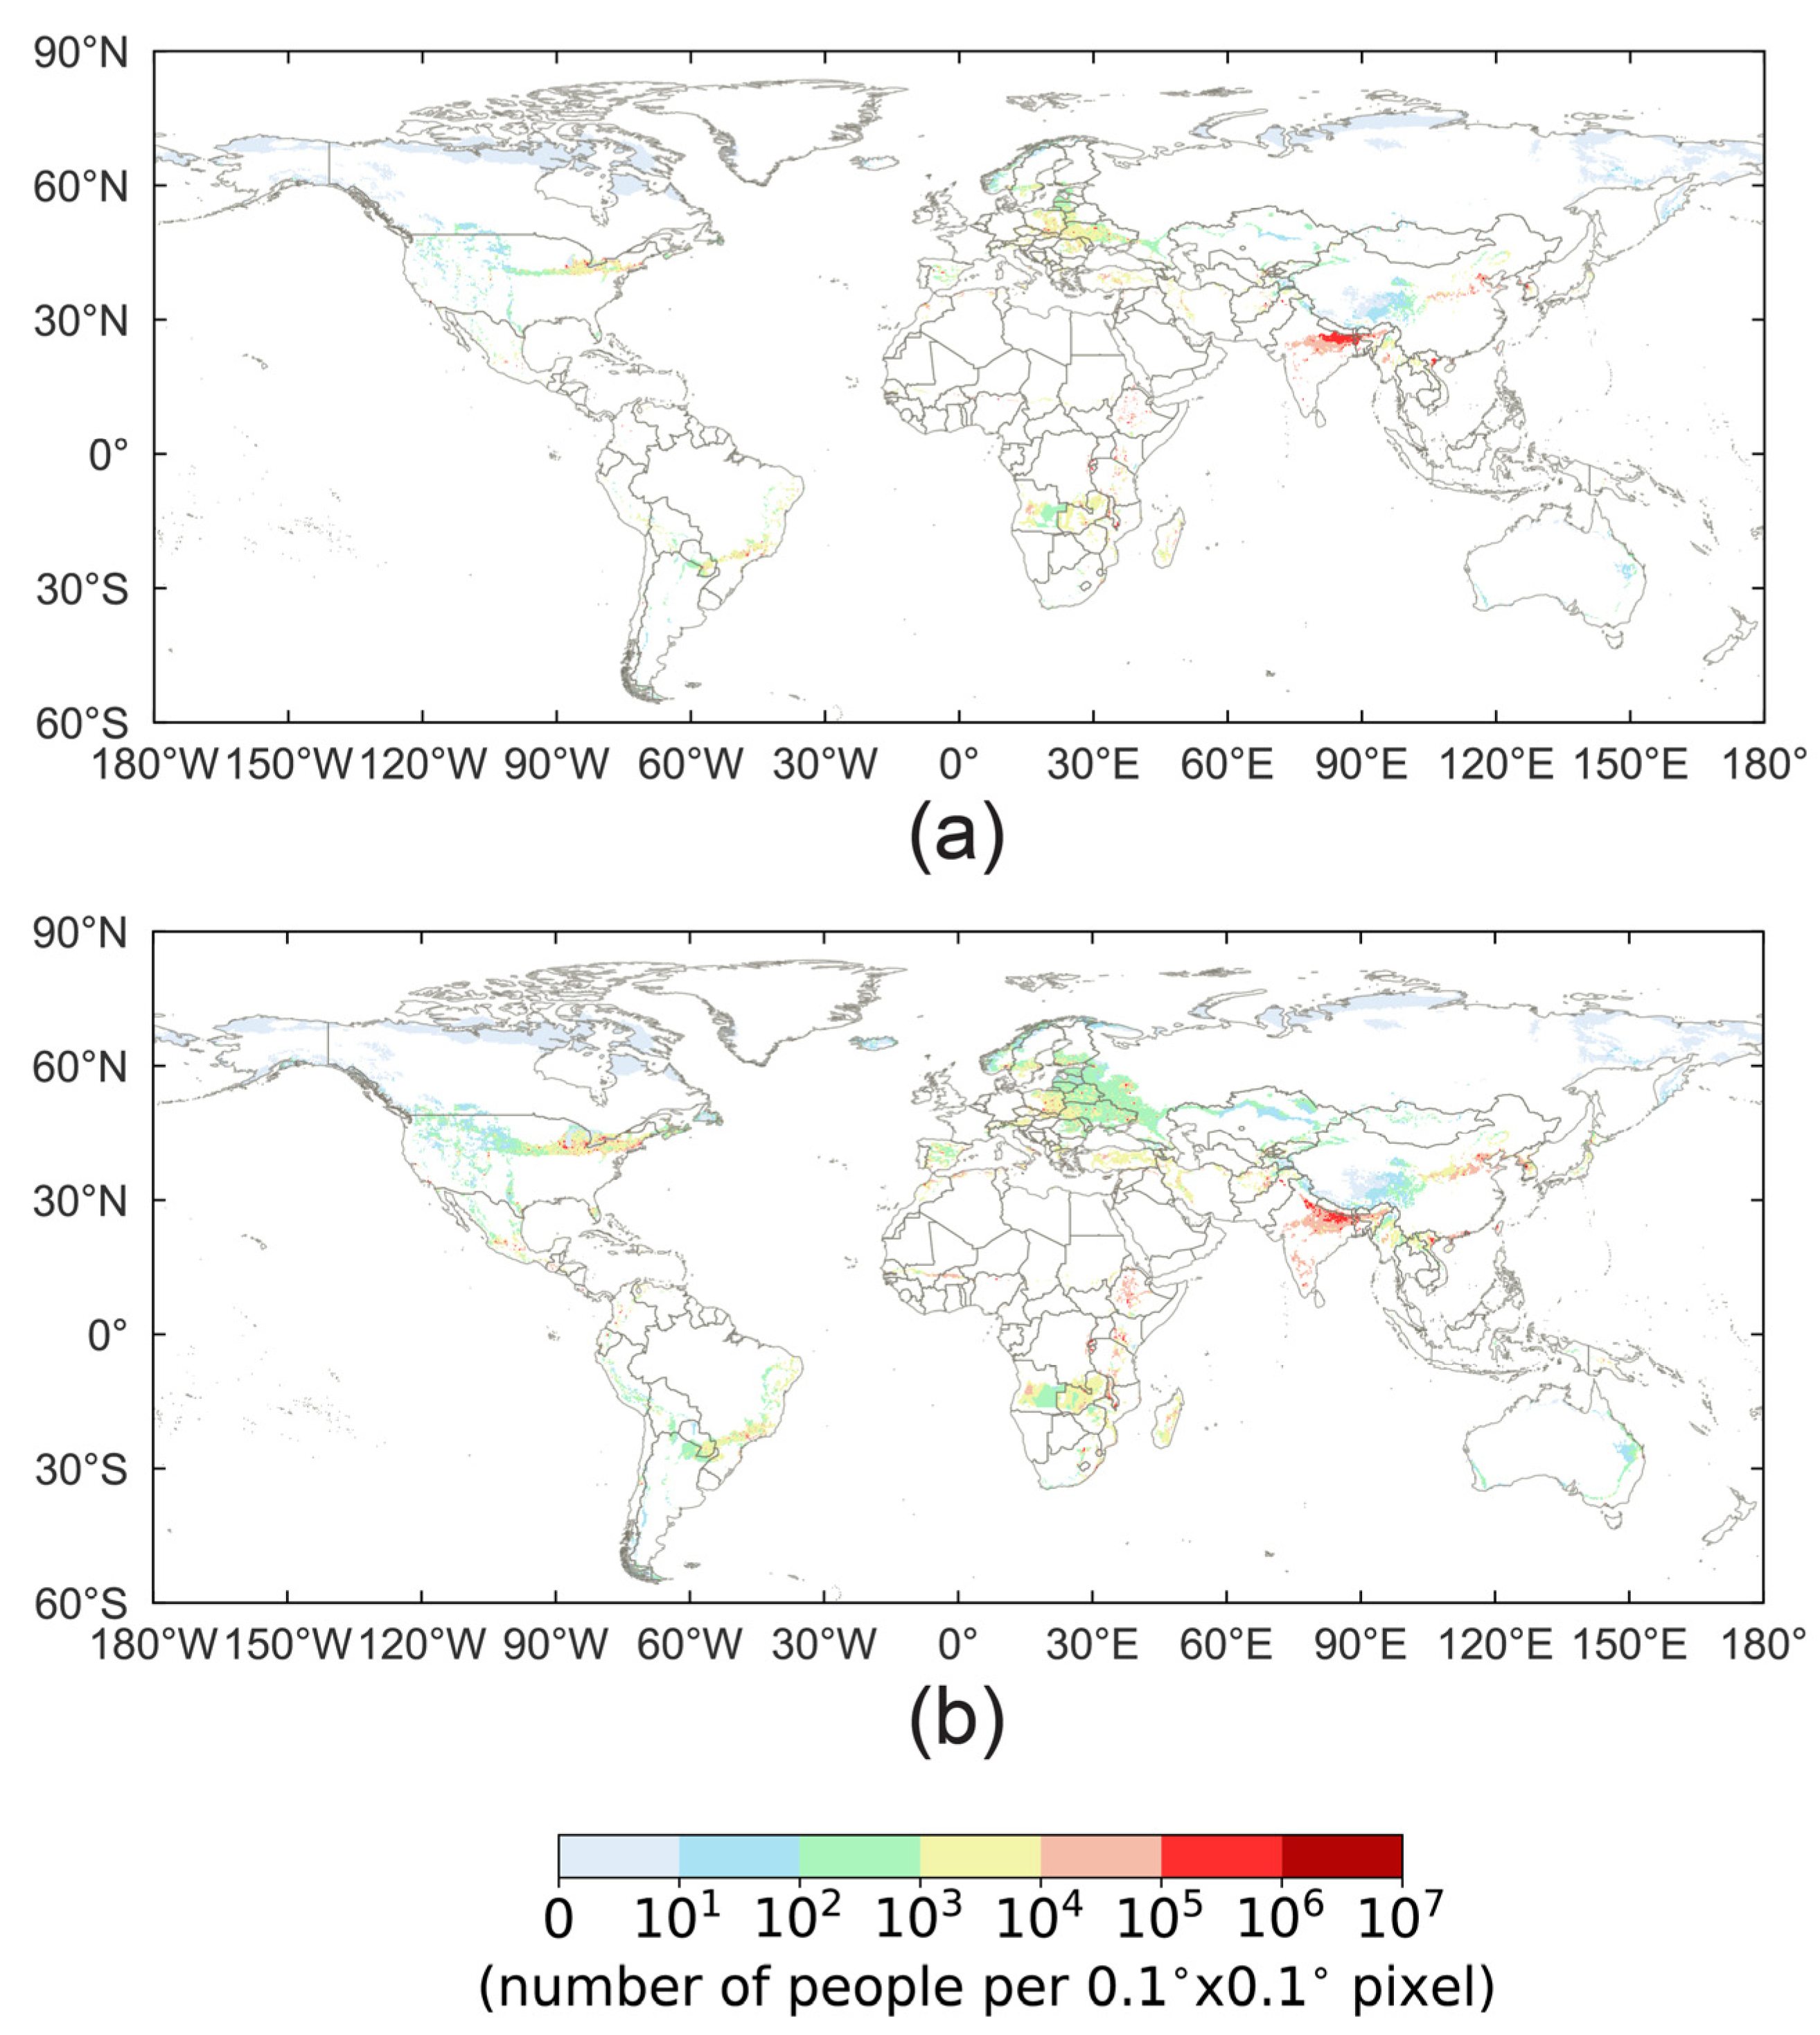
3.2. Projected Population Exposure to Climate Zone Shifts

Many people are projected to live in regions where there is a change in the climate zone classification (i.e., population exposure to shifting climate zones). Figure 2 displays the number of people affected by a reclassification of a region’s climate zone. The spatial patterns of exposure to shifting climate zones are displayed in Appendix B (Figure A6, Figure A7, Figure A8, Figure A9 and Figure A10). At mid-century under the SSP2-RCP4.5 (SSP5-RCP8.5) scenario, 1173 million (1424 million) people are projected to be living in areas where the climate zone classification shifts. By late-century, 1342 million (1646 million) people are projected to live in such areas.
The largest population exposure to shifting climate zones will be for people living in areas that were classified as temperate (Zone C) in the historical period (Figure 2). A total of 915 million (1038 million) people by late-century under the SSP2-RCP4.5 (SSP5-RCP8.5) scenario are projected to live in areas formerly classified as temperate. Most (80–86%) live in areas projected to be reclassified as tropical (Zone A). The rest live in areas projected to be reclassified as arid (Zone B). A hotspot for exposure is in northern India, where population centers formerly classified as temperate are projected to be reclassified as tropical (Figure A7). Other such exposure hot spots include Northern Vietnam, Southeastern China, and the East African Rift Valley. Populations affected by temperate regions shifting to arid regions are less concentrated. Many live in the Mediterranean and along the Atlantic coast of North Africa (Figure A8).
The next largest population exposure will be for people living in areas that were classified as boreal (Zone D) in the historical period (Figure 2). A total of 225 million (429 million) people by late-century under the SSP2-RCP4.5 (SSP5-RCP8.5) scenario are projected to live in areas formerly classified as boreal. Almost all (93–96%) live in areas projected to be reclassified as temperate. Hotspots of exposure occur in the northern United States, Eastern Europe, northern China, and the Korean Peninsula (Figure A4 and Figure A9). Under the SSP5-RCP8.5 scenario, the poleward expansion of the temperate zone in North America extends into some of the population centers in southeastern Canada, and the expansion in Eastern Europe extends eastward into population centers in eastern Ukraine and western Russia.

4. Discussion

4.1. Repartitioning Land Area and People between Climate Zones

This study identified projected changes in Köppen–Geiger climate zones in a recently published, high-resolution dataset of Köppen–Geiger climate zones by Cui et al. (2021) [28]. In the future, tropical (Zone A) and arid (Zone B) regions are projected to expand, while polar (Zone E) regions are projected to contract (Figure 1, Table 1). For temperate (Zone C) and boreal (Zone D) regions, the net changes depend on the climate change trajectory (Table 1). By the end of this century, 9% to 15% of the land area is projected to have its climate zone classification change.
The climate zone shifts in the Cui et al. (2021) [28] dataset are broadly consistent with earlier studies. The projected expansion of the tropical and arid zones and contraction of the polar zone have previously been identified [10,15,16,17,18,19]. This trend was also noted by Cui et al. (2021) [28] in their presentation of the dataset. The dependence on climate change trajectory for the temperate and boreal zones has also previously been identified [15,18]. This dependence has yet to be shown for the Cui et al. (2021) [28] dataset. As this dataset can produce the expected changes in climate zones, it is a viable product to calculate population exposure to shifting climate zones.
The global population is also projected to shift between climate zones. Table 2 presents the proportion of the global population within each climate zone. A greater proportion of the world’s population is projected to live in tropical and arid regions (Table 2). Demographic changes partially explain the repartitioning. Population growth is projected to be larger in developing countries (i.e., the Global South) [33,34,35], which occupy warmer and drier regions (Figure 1). Shifting boundaries between climate zones can also repartition people between climate zones. Climate zone shifts will add people to the tropical and arid zones and remove them from the temperate, boreal, and polar zones (Figure 2).
The role of shifting climate zones in the repartitioning of population can vary. Appendix C quantifies its role within each zone (Table A1). For the tropical zone, between 30% and 50% of the projected population addition is due to shifting climate zones. For the arid zone, it contributes between 15% and 23%. Shifting climate zone boundaries remove people from the temperate, boreal, and polar zones. In total, projected shifts in climate zones due to future warming will alter the geographic distribution of climate zones and global population as well as expose many people to unfamiliar climatic conditions.

4.2. Exposure to Shifting Climate Zones Compared with Other Exposure Metrics

This study also quantified the number of people living in areas where the Köppen–Geiger climate zone is projected to shift (i.e., the population exposure). Figure 3 displays two types of climate zone shifts that produce large exposures. The largest population exposure is associated with densely populated temperate regions projected to be classified as tropical (Figure 2 and Figure 3). A secondary exposure hot spot involves populated boreal regions projected to be classified as temperate (Figure 2 and Figure 3). By the end of this century, 1.3 billion to 1.6 billion people are projected to live in areas where the climate zone classification changes.
The metric for exposure in this study adds a new dimension to human exposure to climate change. It identifies populations that will experience future climates that differ notably from historical conditions. Past studies have explored the exposure to extreme temperature [23,25,27,36] and precipitation [24,26,37] events. Recent studies have also highlighted how climate change could lead to many people living in regions where temperatures exceed optimal levels (i.e., exceeding climate niches) [38,39]. This study’s metric is similar in spirit to the climate-niche metric. As climate zones shift, people will no longer reside in their optimal climatic conditions, posing challenges for those communities.
This study identifies new populations that may experience heightened exposure in a changing climate. Large exposure to shifting climate zones is projected for densely populated temperate regions reclassified as tropical and populated boreal regions reclassified as temperate (Figure 3). Large exposure to extreme weather events [23,24] and exceeding climate niches [38] tend to occur in regions that are already hot. These regions are classified as tropical or arid in the historical period and are not projected to shift climate zones. The exposure metric of this study highlights new geographic locations where communities might face adverse impacts from a changing climate.
A hot spot common to all exposure metrics is India. Many people in northern India are projected to experience shifting climate zones (Figure 3). Exposure to temperature extremes [23] and exceeding climate niches [38] are projected for central and southern India. Exposure to precipitation extremes [24] is projected for southern India and some areas in northern India where climate zones are projected to shift. India is especially susceptible to climate change exposure given its large population, number of large cities [40,41], and sizeable projected population [38]. In addition to the previously identified challenges [23,24,38,40,41], India must contend with many people living in regions where the climate zone is projected to shift.

4.3. Limitations and Future Directions for Study

This study focuses on populations that live in areas where the Köppen–Geiger climate zone is projected to shift. It does not account for impacts to populations in regions where the climate zone does not change. Other metrics for exposure [23,24,25,26,27,37,38,39] can identify some of the impacts facing these populations. Moreover, this study does not account for Earth System changes in response to climate change that may impact societies, such as rising sea levels [42] and thawing permafrost [43]. Therefore, the more than 1 billion people projected to live in regions where the climate zone shifts represent just a portion of those affected by current and future climate changes.
A second possible limitation of this study is one common to all studies that use projections of climate change and population: the quality of the projections. The Cui et al. (2021) [28] climate zone dataset, however, provides a high-quality dataset. It was created using bias-corrected and downscaled models, and its historical classifications have improved accuracy compared to earlier Köppen–Geiger datasets. Although its climate zone projections become less certain at higher latitudes and in more rugged terrain, especially for the RCP8.5 projections [28], their impact on population exposure is small. These regions have low population densities, limiting their influence. The Gao (2020) [29] population data are also of high quality and have been used in previous studies on population exposure to climate change [37,38].
A limitation specific to the population dataset is that climate change is not factored into the projections [30]. This limitation warrants further study. Regions with the largest projected population growth are not the colder ones that may become more habitable in a warmer world [38]. Climate migration, which is not accounted for in the projections, could offset some of the repartitioning of people to hotter and drier climate zones. Additionally, people living in regions of shifting climate zones may choose to migrate as a form of adaptation. However, climate migration will reflect both the ability and willingness of individuals to move. To assess the feasibility of populations to migrate, the next generation of projections would benefit from more demographic and socioeconomic details about the populations [36]. Future projections could also utilize insights about shifting climate zones to account for climate migration and the changing geography of habitability.
Another area for further study is identifying the impacts communities will face in areas where the climate zone is projected to shift. The Köppen–Geiger classification scheme is often used in ecological applications, such as predicting the distribution of vegetation, soil types, and biomes [10,44]. While the classification scheme has been shown to relate to human endeavors [11,12,13,14], the human impacts of shifting climate zones are less known. This study identifies two key climate zone shifts for future studies: (1) temperate regions shifting to tropical regions and (2) boreal regions shifting to temperate regions. With many people projected to live in regions of shifting climate zones (>1.3 billion by the end of this century), further research is needed into the human impacts of such shifts.

5. Conclusions

This study focuses on the human impacts of shifting Köppen–Geiger climate zones. It quantifies the number of people that could live in regions where the climate zone classification shifts (i.e., population exposure), using high-resolution data on climate zones [28] and population [29]. The key findings include:
  • Changing climate zones will affect a large amount of the land surface and global population. By the end of this century, 9% to 15% of the land surface could shift its climate zone classification. These shifts will occur in areas that are home to 1.3 billion to 1.6 billion people (14% to 21% of the global population).
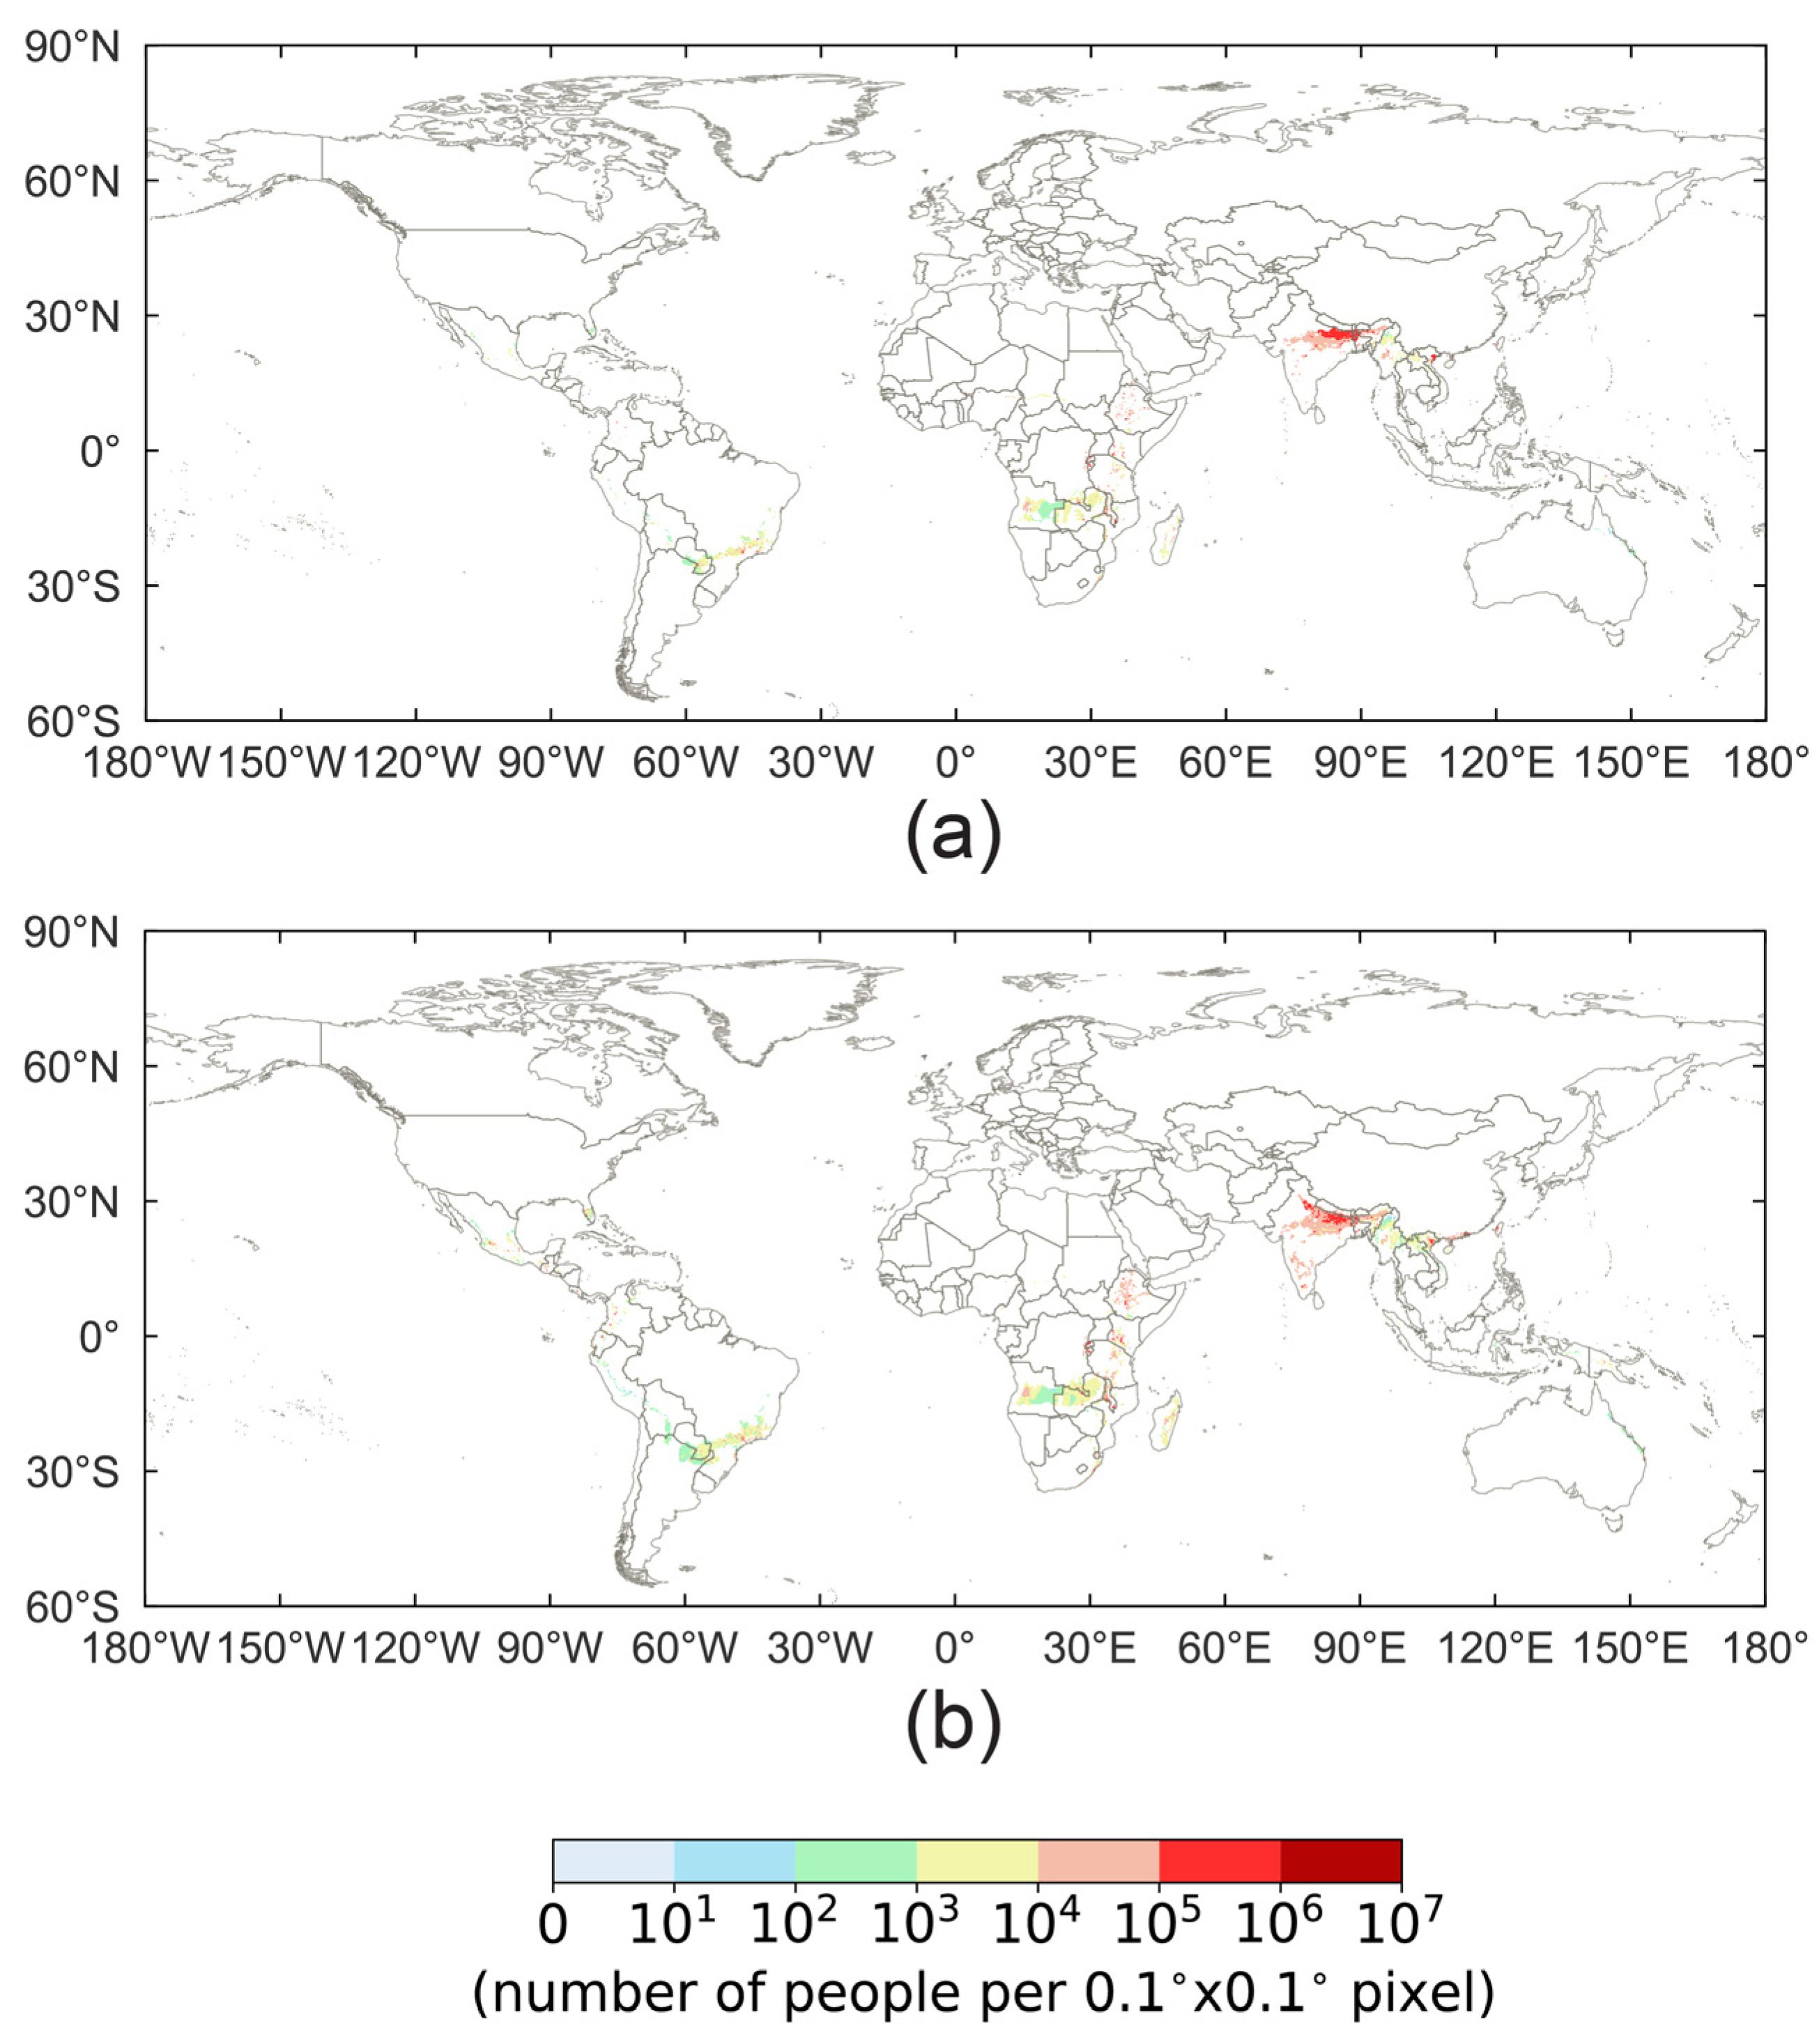
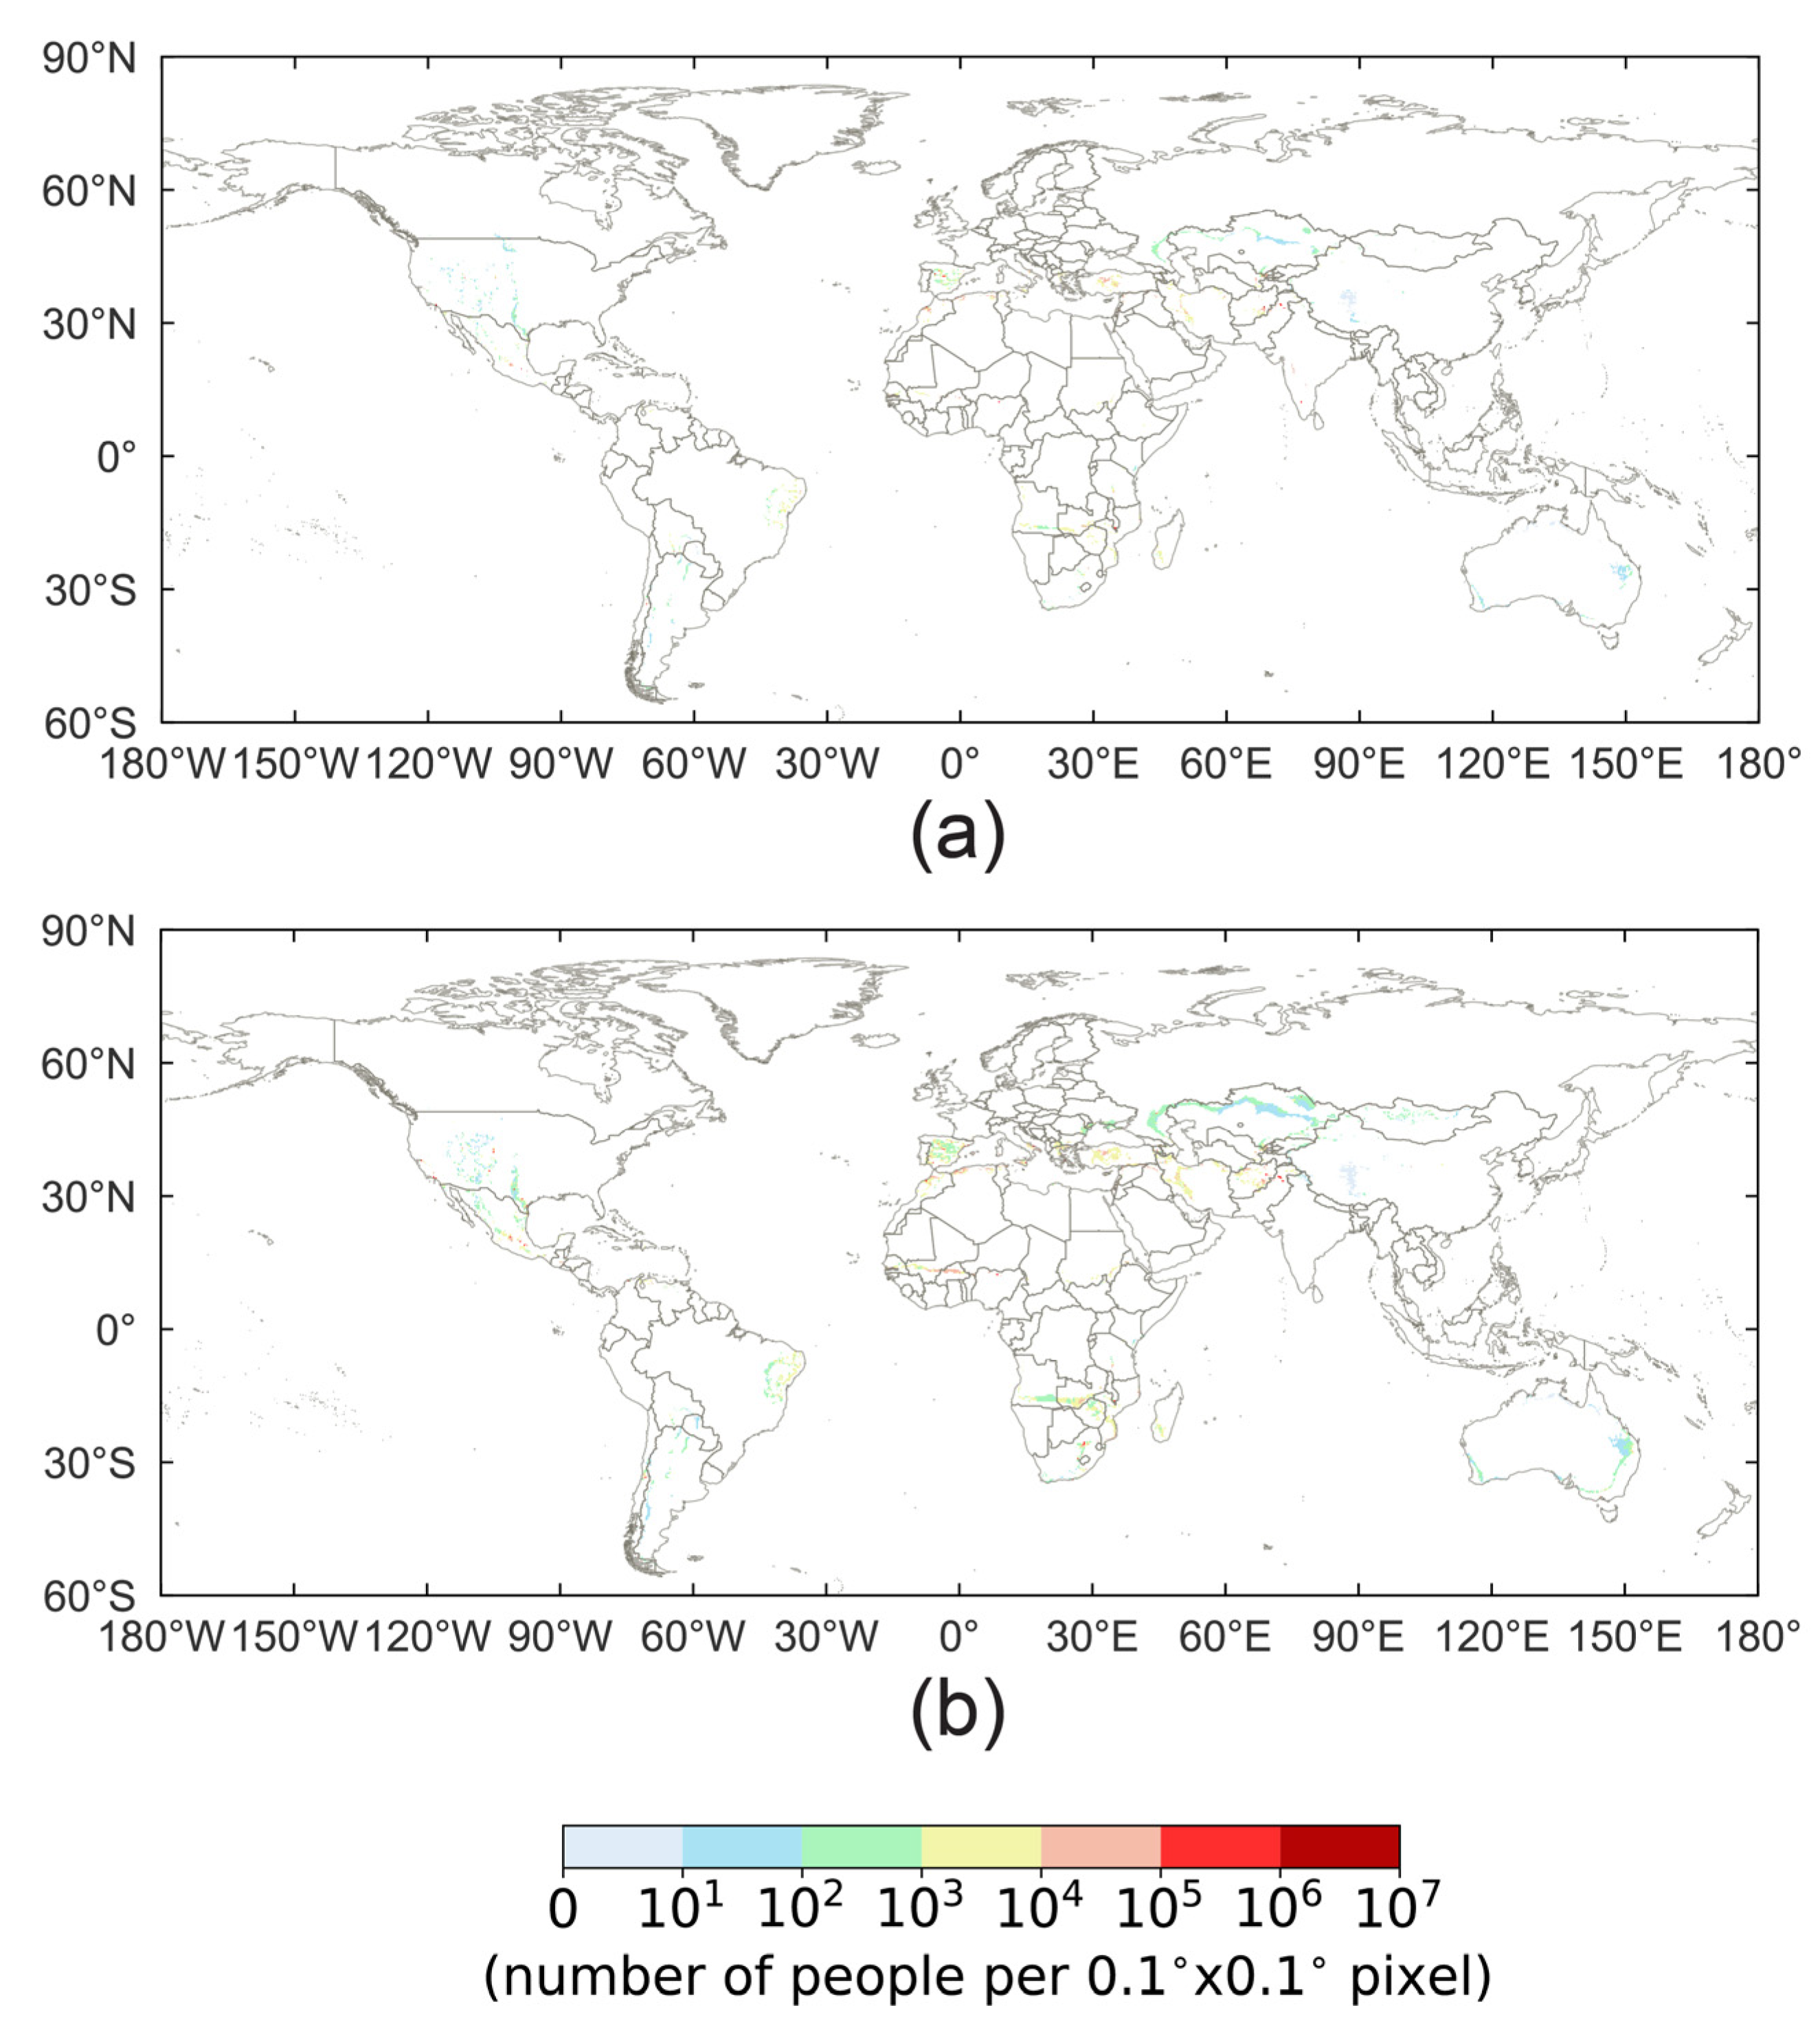
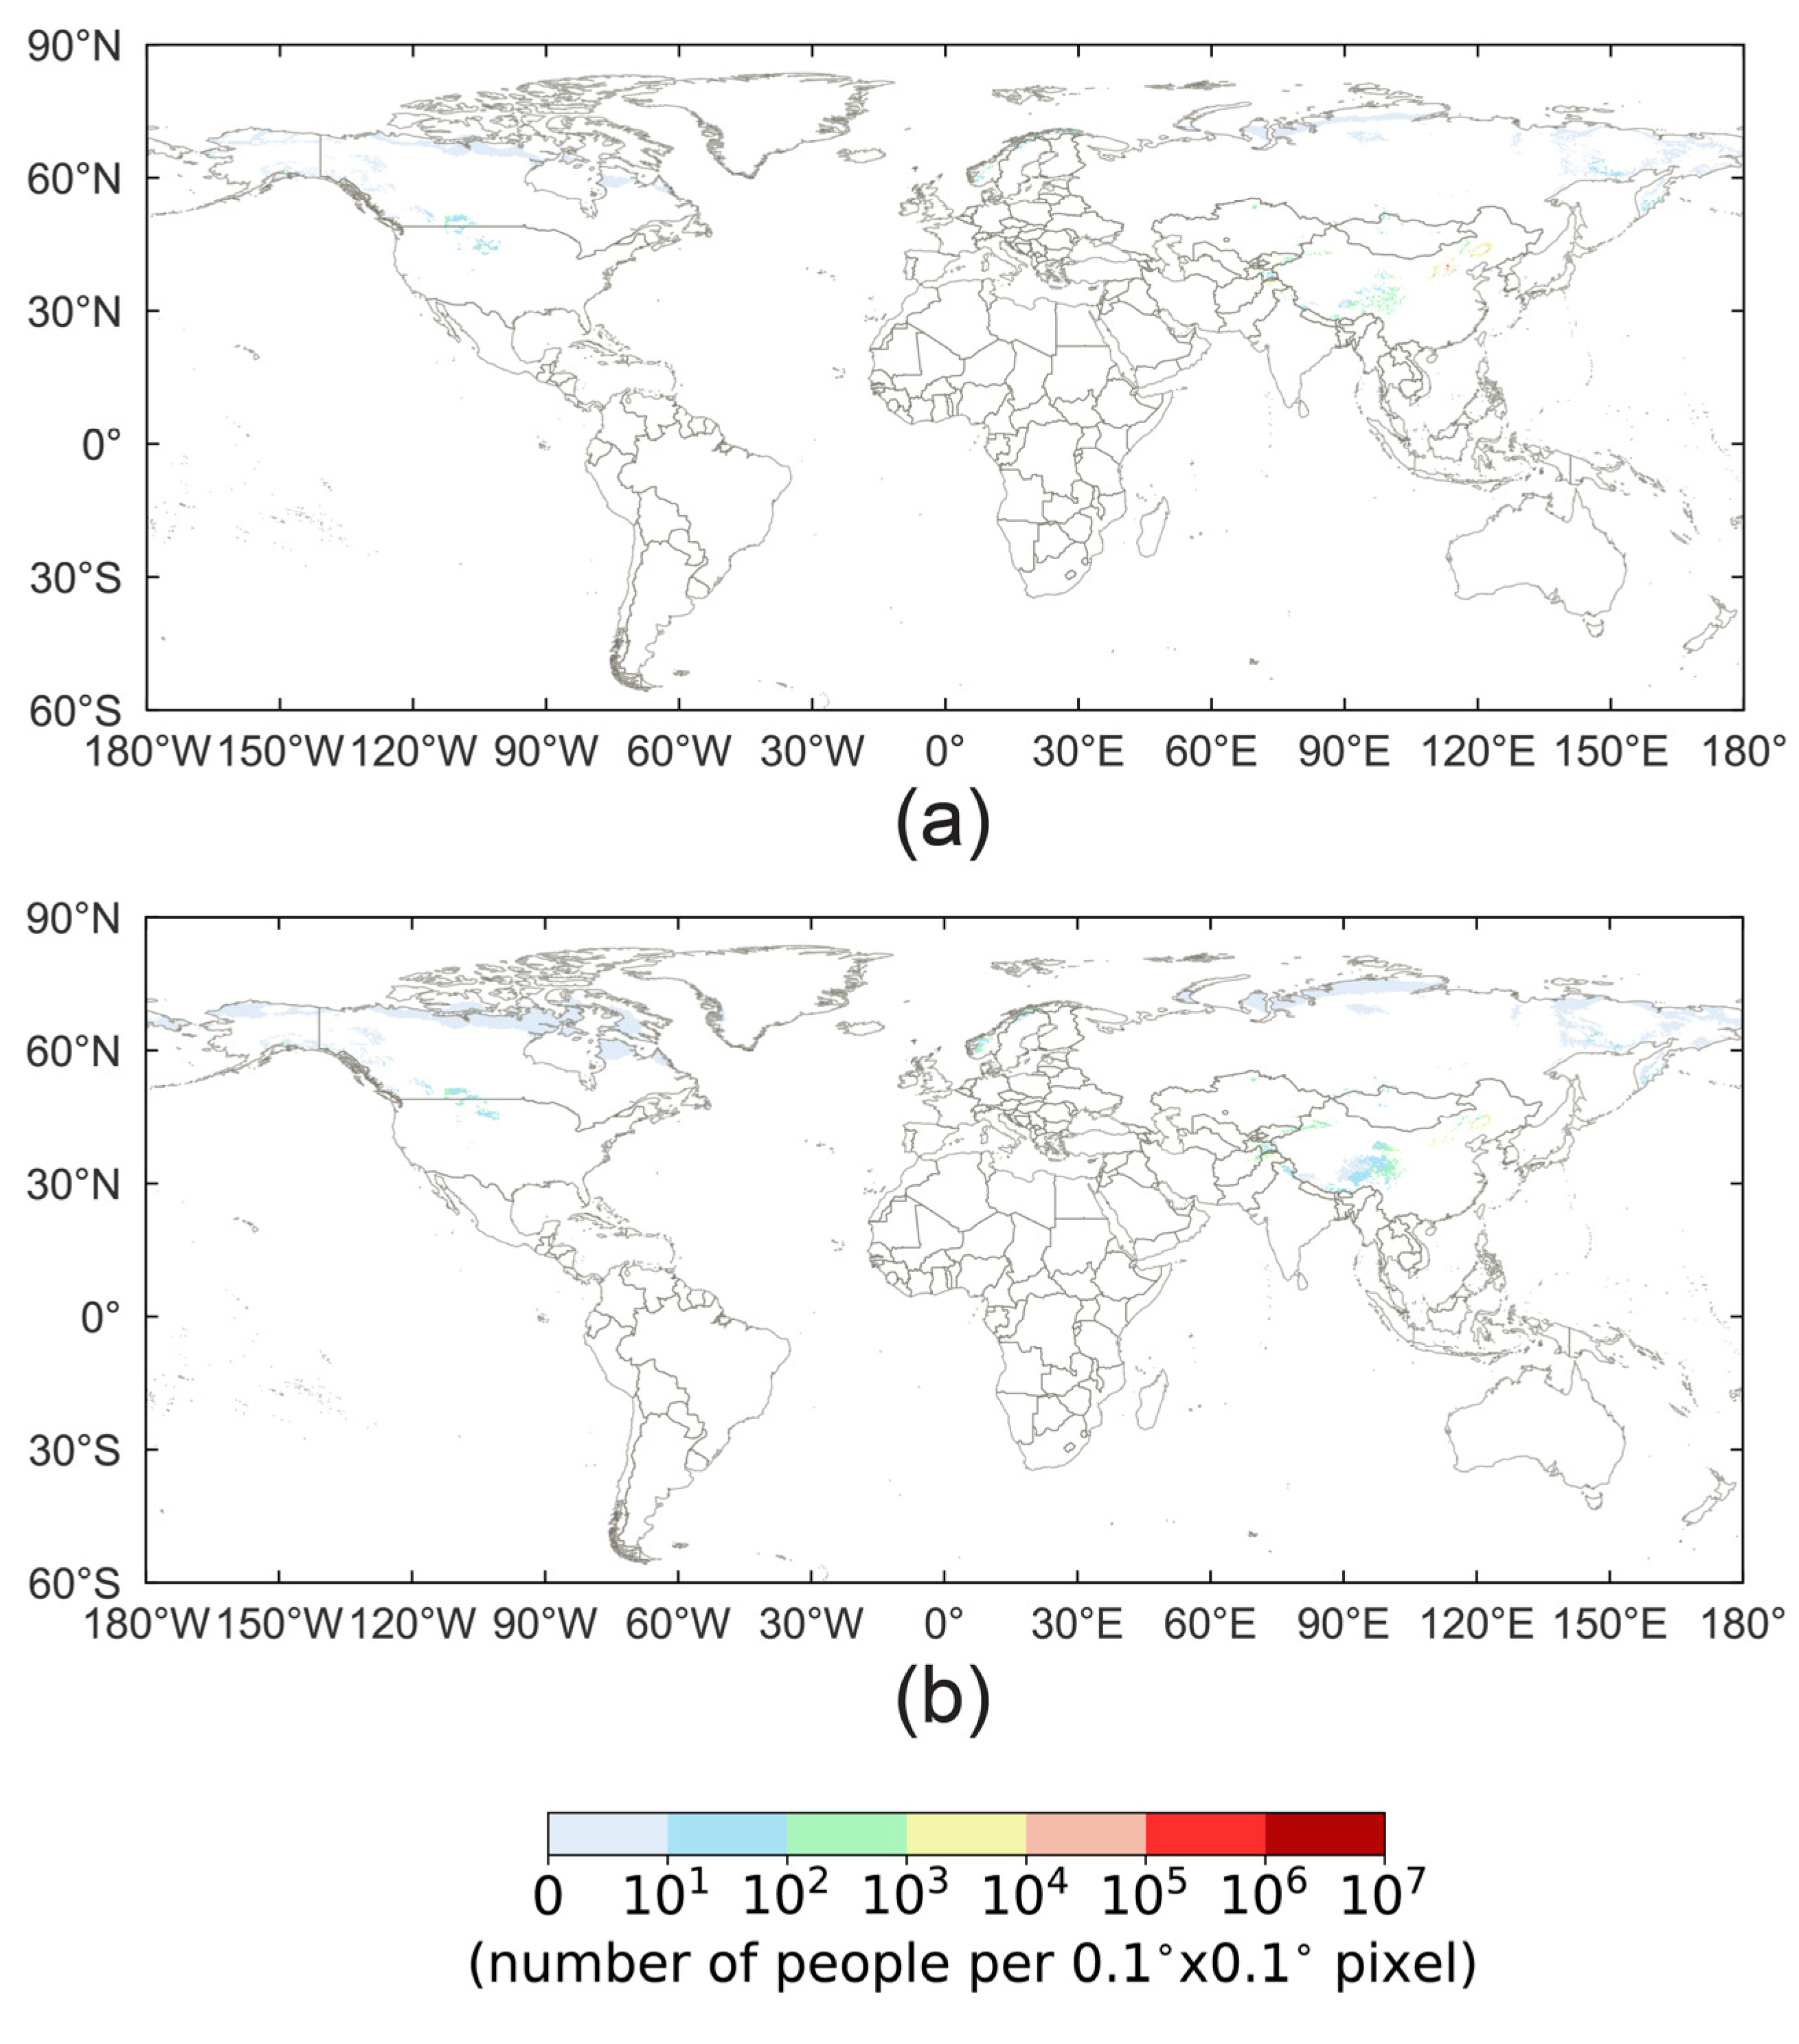
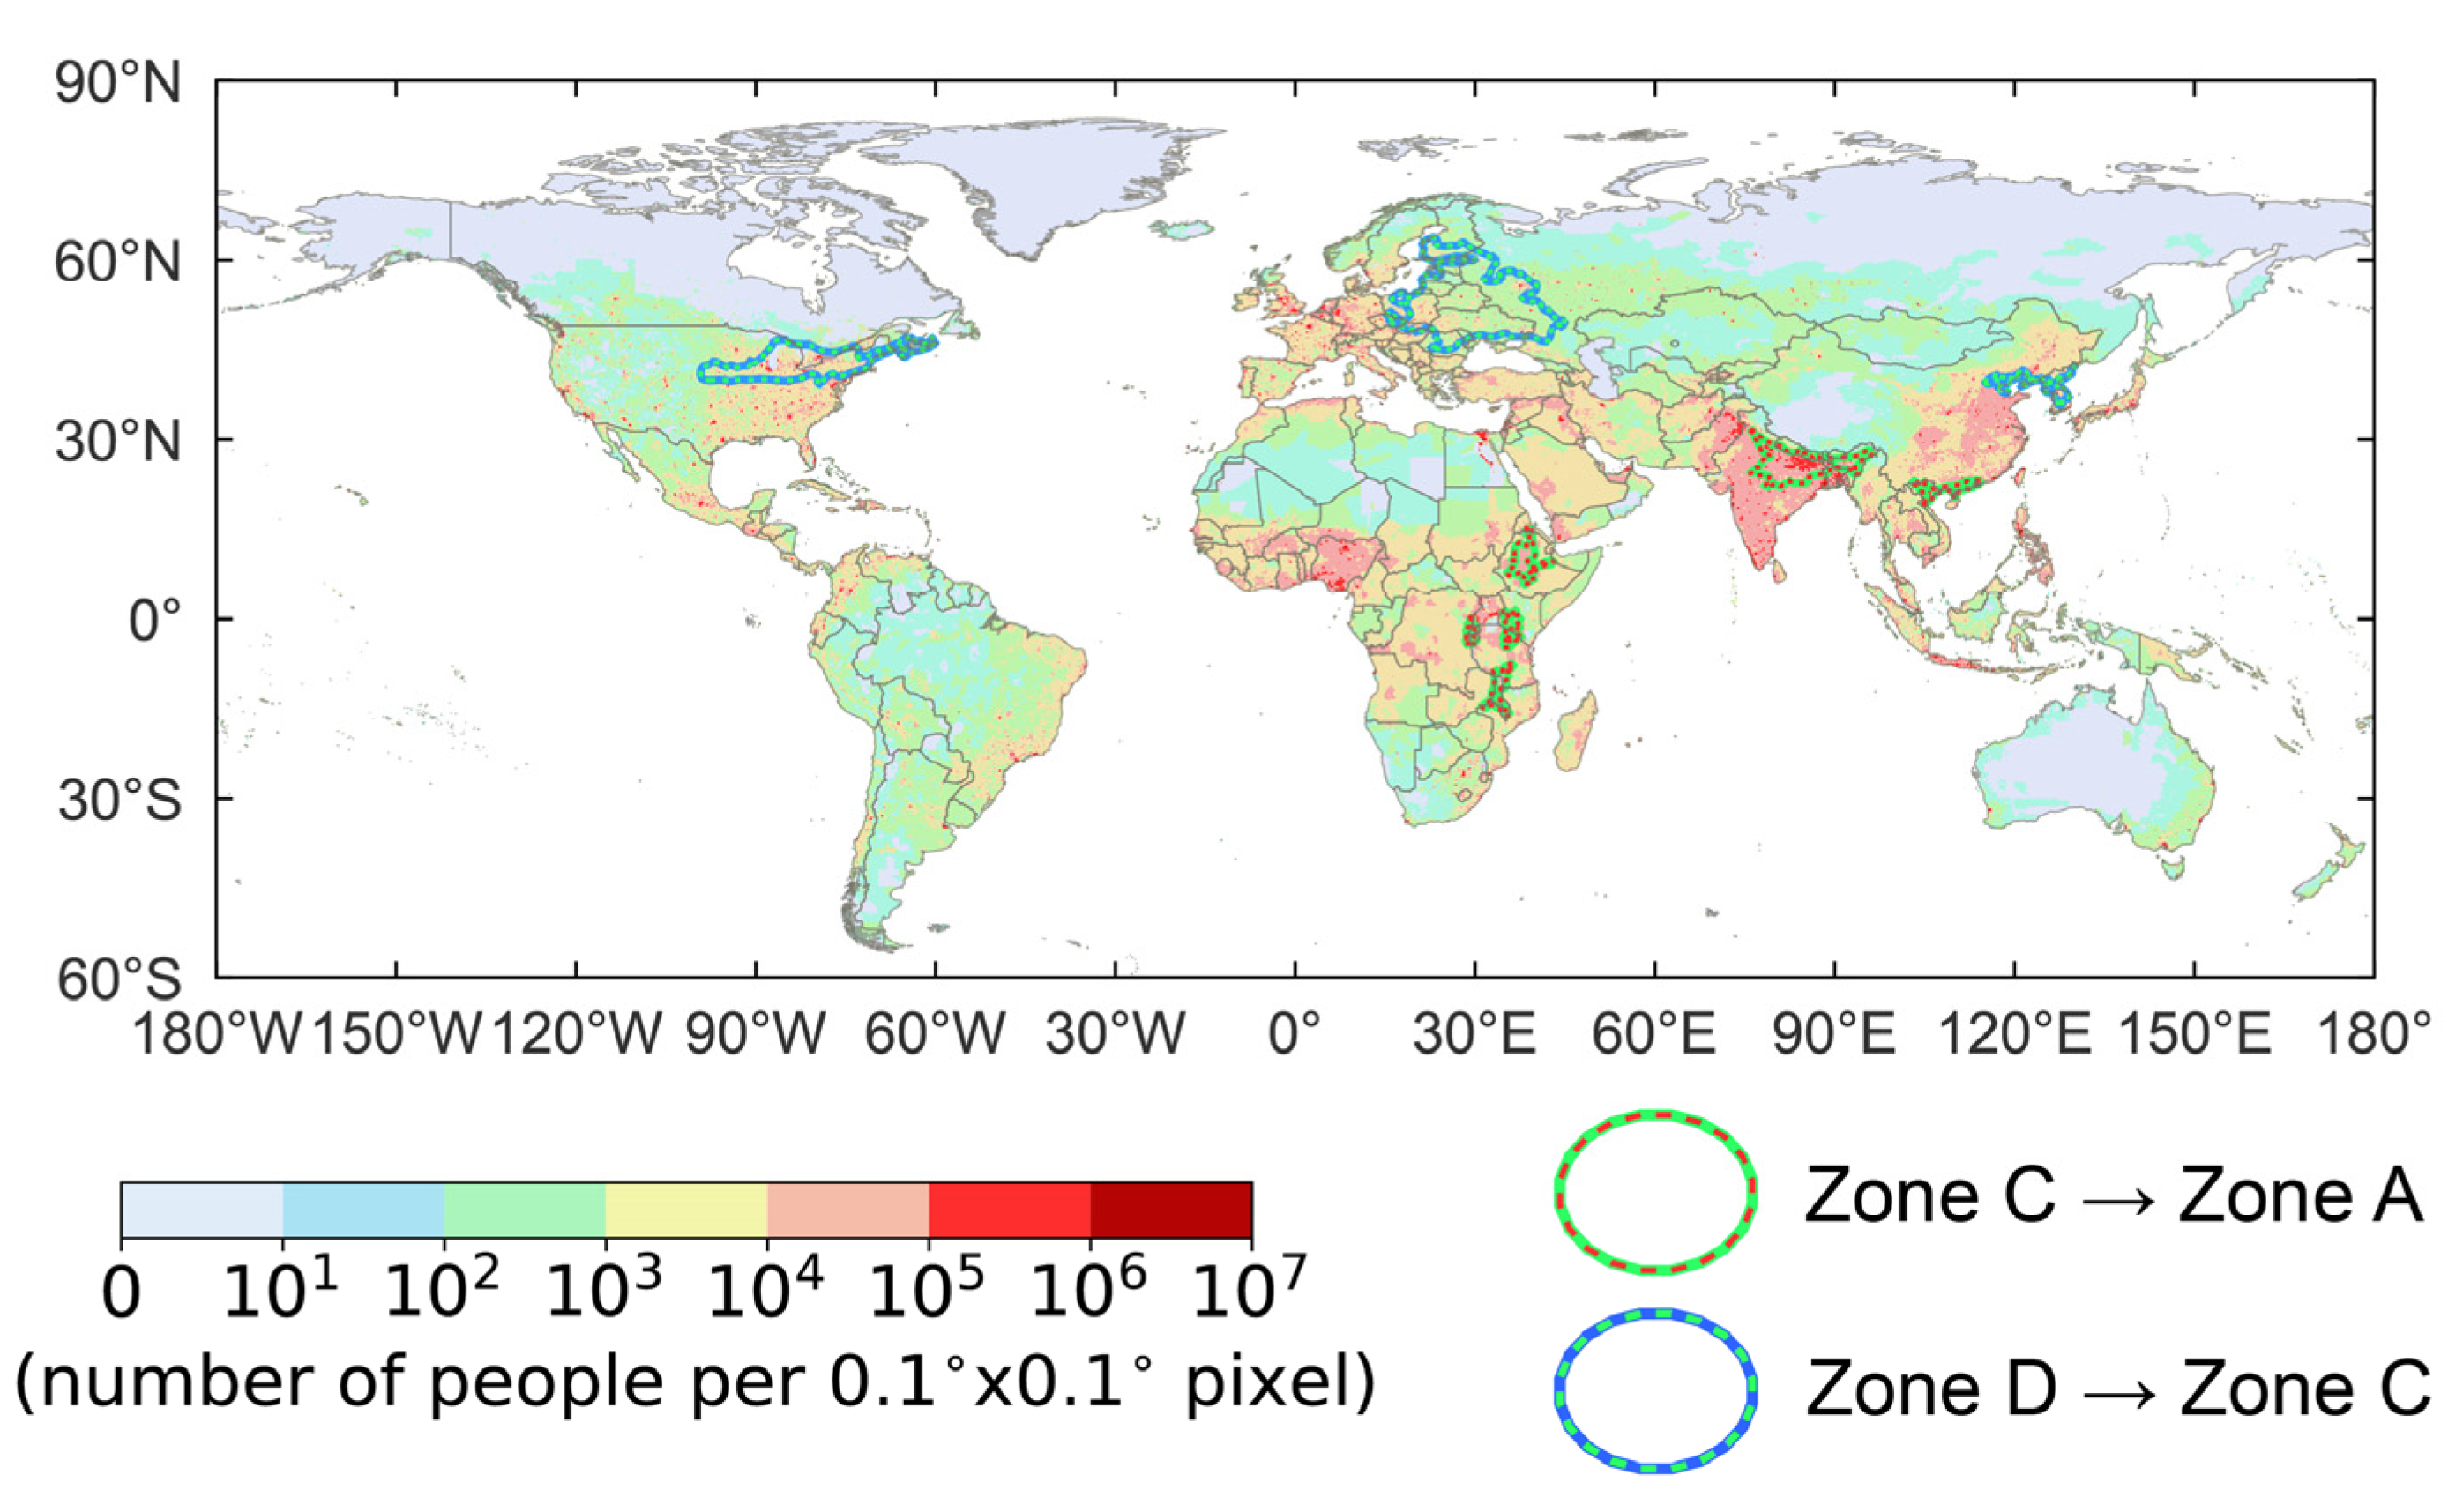
  • The largest population exposure occurs in densely populated temperate regions projected to be classified as tropical in the future. These regions include parts of northern India, South Asia, and the East African Rift Valley. A secondary hotspot occurs for populated boreal regions projected to be classified as temperate in the future. These regions include parts of the northern United States, Eastern Europe, northern China, and the Korean Peninsula.
  • Hotspots for population exposure to changing climate zones are geographically different from the hot spots for other metrics of climate change exposure. Thus, this study identifies new populations that may experience adverse impacts from climate change. It expands the number of people impacted by climate change beyond those identified by existing exposure metrics and those facing Earth System changes such as sea-level rise and permafrost loss.
  • Earth’s land surface will shift toward warmer (i.e., tropical) and drier (i.e., arid) climates. The global population will also repartition toward hotter and drier climates. This repartitioning is due to differences in the projected population growth between developing and developed countries and shifting climate zones.
  • Future research is needed into the impacts societies will face when climate zones shift. This study identifies two types of climate zone shifts that will produce large population exposures. The impacts of these shifts should be the focus of future studies. Moreover, exposure to climate zone shifts may impact future demographic changes through climate migration. Shifting climate zones can help inform the next generation of population projections.

Funding

This research received no external funding.

Data Availability Statement

Köppen–Geiger climate zone reconstructions and projections from Cui et al. (2021) [28] are available at http://glass.umd.edu/KGClim/index.html. Population reconstructions and projections from Gao (2000) [29] are available at https://sedac.ciesin.columbia.edu/data/set/popdynamics-1-km-downscaled-pop-base-year-projection-ssp-2000-2100-rev01.

Acknowledgments

The author acknowledges the discussions in the Climate Extremes Journal Club at the University of Illinois Chicago, which alerted him to the Köppen–Geiger classification system. The author also appreciates the constructive feedback and suggestions from the reviewers.

Conflicts of Interest

The author declares no conflict of interest.

Appendix A

The spatial patterns of climate zone shifts are presented in Figure A1, Figure A2, Figure A3, Figure A4 and Figure A5. Figure A5 displays all locations where the climate zone is projected to be reclassified as a new climate zone in the future. Figure A2, Figure A3, Figure A4 and Figure A5 display the locations projected to be reclassified as tropical (Figure A2), arid (Figure A3), temperate (Figure A4), and boreal (Figure A5). The color represents that location’s climate zone classification in the historical period. Since virtually no area is projected to be reclassified as polar, a similar figure is not provided for the polar zone.
Figure A1. Locations projected to be reclassified as a new climate zone at (a) mid-century under RCP4.5 and (b) late-century under RCP8.5. The color represents the classification of that location in the historical period. For example, red locations were areas classified as tropical in the historical period that are projected to be classified as a new climate zone in the future. To highlight changes, the pixels have been resampled to coarser resolution (0.1° × 0.1°). Climate zone data from Cui et al. (2021) [28].
Geographies 03 00025 g0a1
Figure A2. Locations projected to be reclassified as tropical (Zone A) at (a) mid-century under RCP4.5 and (b) late-century under RCP8.5. The color represents the classification of that location in the historical period. For example, green locations were areas classified as temperate in the historical period but projected to be reclassified as tropical. To highlight changes, the pixels have been resampled to coarser resolution (0.1° × 0.1°). Climate zone data from Cui et al. (2021) [28].
Geographies 03 00025 g0a2
Figure A3. Locations projected to be reclassified as arid (Zone B) at (a) mid-century under RCP4.5 and (b) late-century under RCP8.5. The color represents the classification of that location in the historical period. For example, green locations were areas classified as temperate in the historical period but projected to be reclassified as arid. To highlight changes, the pixels have been resampled to coarser resolution (0.1° × 0.1°). Climate zone data from Cui et al. (2021) [28].
Geographies 03 00025 g0a3
Figure A4. Locations projected to be reclassified as temperate (Zone C) at (a) mid-century under RCP4.5 and (b) late-century under RCP8.5. The color represents the classification of that location in the historical period. For example, blue locations were areas classified as boreal in the historical period but projected to be reclassified as temperate. To highlight changes, the pixels have been resampled to coarser resolution (0.1° × 0.1°). Climate zone data from Cui et al. (2021) [28].
Geographies 03 00025 g0a4
Figure A5. Locations projected to be reclassified as boreal (Zone D) at (a) mid-century under RCP4.5 and (b) late-century under RCP8.5. The color represents the classification of that location in the historical period. For example, purple locations were areas classified as polar in the historical period but projected to be reclassified as boreal. To highlight changes, the pixels have been resampled to coarser resolution (0.1° × 0.1°). Climate zone data from Cui et al. (2021) [28].
Geographies 03 00025 g0a5

Appendix B

The spatial patterns of population exposure are presented in Figure A6, Figure A7, Figure A8, Figure A9 and Figure A10. Figure A6 displays all populations living in areas where the climate zone is projected to be reclassified as a new climate zone in the future. Figure A7, Figure A8, Figure A9 and Figure A10 display populations living in areas projected to be reclassified as tropical (Figure A7), arid (Figure A8), temperate (Figure A9), and boreal (Figure A10). The color represents that location’s population density. The climate zone classification in which those people would have resided in the historical period can be determined by consulting the corresponding figure in Appendix A. Since virtually no area is projected to be reclassified as polar, a similar figure is not provided for the polar zone.
Figure A6. Populations projected to be living in areas where the climate zone is projected to shift at (a) mid-century under the SSP2-RCP4.5 scenario and (b) late-century under the SSP5-RCP8.5 scenario. The climate zone classification in the historical period for these locations is displayed in Figure A1. To highlight population exposure, the pixels have been resampled to coarser resolution (0.1° × 0.1°). Population data from Gao et al. (2020) [29].
Geographies 03 00025 g0a6
Figure A7. Populations projected to be living in areas that are reclassified as tropical (Zone A) at (a) mid-century under the SSP2-RCP4.5 scenario and (b) late-century under the SSP5-RCP8.5 scenario. The climate zone classification in the historical period for these locations is displayed in Figure A2. To highlight population exposure, the pixels have been resampled to coarser resolution (0.1° × 0.1°). Population data from Gao et al. (2020) [29].
Geographies 03 00025 g0a7
Figure A8. Populations projected to be living in areas that are reclassified as arid (Zone B) at (a) mid-century under the SSP2-RCP4.5 scenario and (b) late-century under the SSP5-RCP8.5 scenario. The climate zone classification in the historical period for these locations is displayed in Figure A3. To highlight population exposure, the pixels have been resampled to coarser resolution (0.1° × 0.1°). Population data from Gao et al. (2020) [29].
Geographies 03 00025 g0a8
Figure A9. Populations projected to be living in areas that are reclassified as temperate (Zone C) at (a) mid-century under the SSP2-RCP4.5 scenario and (b) late-century under the SSP5-RCP8.5 scenario. The climate zone classification in the historical period for these locations is displayed in Figure A4. To highlight population exposure, the pixels have been resampled to coarser resolution (0.1° × 0.1°). Population data from Gao et al. (2020) [29].
Geographies 03 00025 g0a9
Figure A10. Populations projected to be living in areas that are reclassified as boreal (Zone D) at (a) mid-century under the SSP2-RCP4.5 scenario and (b) late-century under the SSP5-RCP8.5 scenario. The climate zone classification in the historical period for these locations is displayed in Figure A5. To highlight population exposure, the pixels have been resampled to coarser resolution (0.1° × 0.1°). Population data from Gao et al. (2020) [29].
Geographies 03 00025 g0a10

Appendix C

The number of people residing within each climate zone will change as the boundaries between climate zones shift and populations grow/shrink due to demographic factors. Table A1 presents the net population changes due to both shifting climate zones and demographic factors. It also isolates the population changes due to shifting climate zone boundaries (values in paratheses). For some climate zones (e.g., tropical, arid, and boreal), shifting boundaries will reinforce changes due to demographic factors. For other zones (e.g., temperate and boreal), shifting climate zones and changes from demographic factors will work in opposite directions.
Table A1. Net Population Change within (Transfer between) Climate Zones in Millions of People.
Climate ZoneMid-CenturyLate-Century
SSP2-RCP4.5SSP5-RCP8.5SSP2-RCP4.5SSP5-RCP8.5
A2279
(691)
1871
(760)
2546
(832)
1732
(866)
B958
(51)
711
(69)
1017
(54)
625
(142)
C307
(−507)
223
(−513)
−83
(−632)
−129
(−576)
D−195
(−226)
−251
(−306)
−282
(−244)
−422
(−423)
E−14
(−9)
−18
(−9)
−17
(−9)
−22
(−9)

References

  1. Seneviratne, S.I.; Zhang, X.; Adnan, M.; Badi, W.; Dereczynski, C.; Di Luca, A.; Ghosh, S.; Iskandar, I.; Kossin, J.; Lewis, S.; et al. Weather and Climate Extreme Events in a Changing Climate. In Climate Change 2021: The Physical Science Basis. Contribution of Working Group I to the Sixth Assessment Report of the Intergovernmental Panel on Climate Change; Masson-Delmotte, V., Zhai, P., Pirani, A., Connors, S.L., Péan, C., Berger, S., Caud, N., Chen, Y., Goldfarb, L., Gomis, M.I., Eds.; Cambridge University Press: Cambridge, UK; New York, NY, USA, 2021; pp. 1513–1766. [Google Scholar] [CrossRef]
  2. Bartusek, S.; Kornhuber, K.; Ting, M. North American heatwave amplified by climate change-driven nonlinear interactions. Nat. Clim. Chang. 2022, 12, 1143–1150. [Google Scholar] [CrossRef]
  3. Heeter, K.J.; Harley, G.L.; Abatzoglou, J.T.; Anchukaitis, K.J.; Cook, E.R.; Coulthard, B.L.; Dye, L.A.; Homfeld, I.K. Unprecedented 21st century heat across the Pacific Northwest of North America. Npj Clim. Atmos. Sci. 2023, 6, 5. [Google Scholar] [CrossRef]
  4. Scholes, R.J. Climate change and ecosystem services. Wiley Interdiscip. Rev. Clim. Chang. 2016, 7, 537–550. [Google Scholar] [CrossRef]
  5. Parmesan, C.; Morecroft, M.D.; Trisurat, Y.; Adrian, R.; Anshari, G.Z.; Arneth, A.; Gao, Q.; Gonzalez, P.; Harris, R.; Price, J.; et al. Terrestrial and Freshwater Ecosystems and Their Services. In Climate Change 2022: Impacts, Adaptation and Vulnerability. Contribution of Working Group II to the Sixth Assessment Report of the Intergovernmental Panel on Climate Change; Pörtner, H.-O., Roberts, D.C., Tignor, M., Poloczanska, E.S., Mintenbeck, K., Alegría, A., Craig, M., Langsdorf, S., Löschke, S., Möller, V., Eds.; Cambridge University Press: Cambridge, UK; New York, NY, USA, 2022; pp. 197–377. [Google Scholar] [CrossRef]
  6. IPCC. 2022: Summary for Policymakers. In Climate Change 2022: Impacts, Adaptation and Vulnerability. Contribution of Working Group II to the Sixth Assessment Report of the Intergovernmental Panel on Climate Change; Pörtner, H.-O., Roberts, D.C., Tignor, M., Poloczanska, E.S., Mintenbeck, K., Alegría, A., Craig, M., Langsdorf, S., Löschke, S., Möller, V., Eds.; Cambridge University Press: Cambridge, UK; New York, NY, USA, 2022; pp. 3–33. [Google Scholar] [CrossRef]
  7. Rubel, F.; Kottek, M. Comments on: “The thermal zones of the earth” by Wladimir Köppen (1884). Meteorol. Z. 2011, 20, 361–366. [Google Scholar] [CrossRef]
  8. Chen, D.; Chen, H.W. Using the Köppen classification to quantify climate variation and change: An example for 1901–2010. Environ. Dev. 2013, 6, 69–79. [Google Scholar] [CrossRef]
  9. Sanderson, M. The classification of climates from Pythagoras to Koeppen. Bull. Am. Meteorol. Soc. 1999, 80, 669–674. [Google Scholar] [CrossRef]
  10. Cui, D.; Liang, S.; Wang, D. Observed and projected changes in global climate zones based on Köppen climate classification. Wiley Interdiscip. Rev. Clim. Chang. 2021, 12, e701. [Google Scholar] [CrossRef]
  11. de Sá Júnior, A.; de Carvalho, L.G.; Da Silva, F.F.; de Carvalho Alves, M. Application of the Köppen classification for climatic zoning in the state of Minas Gerais, Brazil. Theor. Appl. Climatol. 2012, 108, 1–7. [Google Scholar] [CrossRef]
  12. Chen, F.; Chen, S.; Huang, H.; Deng, Y.; Yang, W. Macro-analysis of climatic factors for COVID-19 pandemic based on Köppen–Geiger climate classification. Chaos Interdiscip. J. Nonlinear Sci. 2023, 33, 053104. [Google Scholar] [CrossRef] [PubMed]
  13. Boland, M.R.; Parhi, P.; Gentine, P.; Tatonetti, N.P. Climate classification is an important factor in assessing quality-of-care across hospitals. Sci. Rep. 2017, 7, 4948. [Google Scholar] [CrossRef] [Green Version]
  14. Friess, W.A.; Rakhshan, K.; Davis, M.P. A global survey of adverse energetic effects of increased wall insulation in office buildings: Degree day and climate zone indicators. Energy Effic. 2017, 10, 97–116. [Google Scholar] [CrossRef]
  15. Chan, D.; Wu, Q. Significant anthropogenic-induced changes of climate classes since 1950. Sci. Rep. 2015, 5, 13487. [Google Scholar] [CrossRef] [PubMed] [Green Version]
  16. Rohli, R.V.; Joyner, T.A.; Reynolds, S.J.; Shaw, C.; Vázquez, J.R. Globally extended Köppen–Geiger climate classification and temporal shifts in terrestrial climatic types. Phys. Geogr. 2015, 3, 142–157. [Google Scholar] [CrossRef]
  17. Beck, H.E.; Zimmermann, N.E.; McVicar, T.R.; Vergopolan, N.; Berg, A.; Wood, E.F. Present and future Köppen-Geiger climate classification maps at 1-km resolution. Sci. Data 2018, 5, 180214. [Google Scholar] [CrossRef] [Green Version]
  18. Rubel, F.; Kottek, M. Observed and projected climate shifts 1901-2100 depicted by world maps of the Köppen-Geiger climate classification. Meteorol. Z. 2010, 19, 135–141. [Google Scholar] [CrossRef] [Green Version]
  19. Hanf, F.; Körper, J.; Spangehl, T.; Cubasch, U. Shifts of climate zones in multi-model climate change experiments using the Köppen climate classification. Meteorol. Z. 2012, 21, 111–123. [Google Scholar] [CrossRef]
  20. Skalák, P.; Farda, A.; Zahradníček, P.; Trnka, M.; Hlásny, T.; Štěpánek, P. Projected shift of Köppen–Geiger zones in the central Europe: A first insight into the implications for ecosystems and the society. Int. J. Climatol. 2018, 38, 3595–3606. [Google Scholar] [CrossRef]
  21. Van Vuuren, D.P.; Edmonds, J.; Kainuma, M.; Riahi, K.; Thomson, A.; Hibbard, K.; Hurtt, G.C.; Kram, T.; Krey, V.; Lamarque, J.F.; et al. The representative concentration pathways: An overview. Clim. Chang. 2011, 109, 5–31. [Google Scholar] [CrossRef]
  22. O’Neill, B.C.; Kriegler, E.; Riahi, K.; Ebi, K.L.; Hallegatte, S.; Carter, T.R.; Mathur, R.; Van Vuuren, D.P. A new scenario framework for climate change research: The concept of shared socioeconomic pathways. Clim. Chang. 2014, 122, 387–400. [Google Scholar] [CrossRef] [Green Version]
  23. Jones, B.; Tebaldi, C.; O’Neill, B.C.; Oleson, K.; Gao, J. Avoiding population exposure to heat-related extremes: Demographic change vs climate change. Clim. Chang. 2018, 146, 423–437. [Google Scholar] [CrossRef]
  24. Chen, H.; Sun, J.; Li, H. Increased population exposure to precipitation extremes under future warmer climates. Environ. Res. Lett. 2020, 15, 034048. [Google Scholar] [CrossRef]
  25. Rohat, G.; Flacke, J.; Dosio, A.; Dao, H.; van Maarseveen, M. Projections of human exposure to dangerous heat in African cities under multiple socioeconomic and climate scenarios. Earth’s Future 2019, 7, 528–546. [Google Scholar] [CrossRef] [Green Version]
  26. Swain, D.L.; Wing, O.E.; Bates, P.D.; Done, J.M.; Johnson, K.A.; Cameron, D.R. Increased flood exposure due to climate change and population growth in the United States. Earth’s Future 2020, 8, e2020EF001778. [Google Scholar] [CrossRef]
  27. Xie, W.; Zhou, B.; Han, Z.; Xu, Y. Substantial increase in daytime-nighttime compound heat waves and associated population exposure in China projected by the CMIP6 multimodel ensemble. Environ. Res. Lett. 2022, 17, 045007. [Google Scholar] [CrossRef]
  28. Cui, D.; Liang, S.; Wang, D.; Liu, Z. A 1 km global dataset of historical (1979–2013) and future (2020–2100) Köppen–Geiger climate classification and bioclimatic variables. Earth Syst. Sci. Data 2021, 13, 5087–5114. [Google Scholar] [CrossRef]
  29. Gao, J. Global 1-km Downscaled Population Base Year and Projection Grids Based on the Shared Socioeconomic Pathways, Revision 01; NASA Socioeconomic Data and Applications Center (SEDAC): Palisades, NY, USA, 2020. [Google Scholar] [CrossRef]
  30. Jones, B.; O’Neill, B.C. Spatially explicit global population scenarios consistent with the Shared Socioeconomic Pathways. Environ. Res. Lett. 2016, 11, 084003. [Google Scholar] [CrossRef]
  31. Feng, S.; Hu, Q.; Huang, W.; Ho, C.H.; Li, R.; Tang, Z. Projected climate regime shift under future global warming from multi-model, multi-scenario CMIP5 simulations. Glob. Planet. Chang. 2014, 112, 41–52. [Google Scholar] [CrossRef]
  32. IPCC. Summary for Policymakers. In Climate Change 2021: The Physical Science Basis. Contribution of Working Group I to the Sixth Assessment Report of the Intergovernmental Panel on Climate Change; Masson-Delmotte, V., Zhai, P., Pirani, A., Connors, S.L., Péan, C., Berger, S., Caud, N., Chen, Y., Goldfarb, L., Gomis, M.I., Eds.; Cambridge University Press: Cambridge, UK; New York, NY, USA, 2021; pp. 3–32. [Google Scholar] [CrossRef]
  33. KC, S.; Lutz, W. The human core of the shared socioeconomic pathways: Population scenarios by age, sex and level of education for all countries to 2100. Glob. Environ. Chang. 2017, 42, 181–192. [Google Scholar] [CrossRef] [Green Version]
  34. Fricko, O.; Havlik, P.; Rogelj, J.; Klimont, Z.; Gusti, M.; Johnson, N.; Kolp, P.; Strubegger, M.; Valin, H.; Amann, M.; et al. The marker quantification of the Shared Socioeconomic Pathway 2: A middle-of-the-road scenario for the 21st century. Glob. Environ. Chang. 2017, 42, 251–267. [Google Scholar] [CrossRef] [Green Version]
  35. Kriegler, E.; Bauer, N.; Popp, A.; Humpenöder, F.; Leimbach, M.; Strefler, J.; Baumstark, L.; Bodirsky, B.L.; Hilaire, J.; Klein, D.; et al. Fossil-fueled development (SSP5): An energy and resource intensive scenario for the 21st century. Glob. Environ. Chang. 2017, 42, 297–315. [Google Scholar] [CrossRef] [Green Version]
  36. Jones, B.; O’Neill, B.C.; McDaniel, L.; McGinnis, S.; Mearns, L.O.; Tebaldi, C. Future population exposure to US heat extremes. Nat. Clim. Chang. 2015, 5, 652–656. [Google Scholar] [CrossRef]
  37. Sun, S.; Shi, P.; Zhang, Q.; Wang, J.A.; Wu, J.; Chen, D. Evolution of future precipitation extremes: Viewpoint of climate change classification. Int. J. Climatol. 2022, 42, 1220–1230. [Google Scholar] [CrossRef]
  38. Lenton, T.M.; Xu, C.; Abrams, J.F.; Ghadiali, A.; Loriani, S.; Sakschewski, B.; Zimm, C.; Ebi, K.L.; Dunn, R.R.; Svenning, J.C.; et al. Quantifying the human cost of global warming. Nat. Sustain. 2023. [Google Scholar] [CrossRef]
  39. Xu, C.; Kohler, T.A.; Lenton, T.M.; Svenning, J.C.; Scheffer, M. Future of the human climate niche. Proc. Natl. Acad. Sci. USA 2020, 117, 11350–11355. [Google Scholar] [CrossRef] [PubMed]
  40. Klein, T.; Anderegg, W.R. A vast increase in heat exposure in the 21st century is driven by global warming and urban population growth. Sustain. Cities Soc. 2021, 73, 103098. [Google Scholar] [CrossRef]
  41. Tuholske, C.; Caylor, K.; Funk, C.; Verdin, A.; Sweeney, S.; Grace, K.; Peterson, P.; Evans, T. Global urban population exposure to extreme heat. Proc. Natl. Acad. Sci. USA 2021, 118, e2024792118. [Google Scholar] [CrossRef]
  42. Neumann, B.; Vafeidis, A.T.; Zimmermann, J.; Nicholls, R.J. Future coastal population growth and exposure to sea-level rise and coastal flooding-a global assessment. PLoS ONE 2015, 10, e0131375. [Google Scholar] [CrossRef] [Green Version]
  43. Ramage, J.; Jungsberg, L.; Wang, S.; Westermann, S.; Lantuit, H.; Heleniak, T. Population living on permafrost in the Arctic. Popul. Environ. 2021, 43, 22–38. [Google Scholar] [CrossRef]
  44. Rohli, R.V.; Joyner, T.A.; Reynolds, S.J.; Ballinger, T.J. Overlap of global Köppen–Geiger climates, biomes, and soil orders. Phys. Geogr. 2015, 36, 158–175. [Google Scholar] [CrossRef]
Figure 1. Köppen–Geiger climate zones for the (a) historical period and at (b,c) mid-century and (d,e) late-century. (b,d) (left column) are the projections under RCP4.5. (c,e) (right column) are the projections under RCP8.5. Climate zone data from Cui et al. (2021) [28].
Geographies 03 00025 g001
Figure 2. Number of people added to (upward bars) or removed from (downward bars) a climate zone due to climate zone shifts under the (a) SSP2-RCP4.5 scenario and (b) SSP5-RCP8.5 scenario. The color inside upward-facing bars indicates in which climate zone those people would have lived in the historical period. The color inside downward-facing bars indicates the new climate zone in which those people reside.
Geographies 03 00025 g002
Figure 3. Hotspots for population exposure to shifting climate zones by late-century under RCP8.5 overlaid on population density. To highlight population exposure, the polygons of regions of high exposure have been smoothed and the population data have been resampled to coarser resolution (0.1° × 0.1°). Population data from Gao et al. (2020) [29].
Geographies 03 00025 g003
Table 1. Percent * of Land Area in Different Climate Zones.
Historical PeriodMid-CenturyLate-Century
RCP4.5RCP8.5RCP4.5RCP8.5
A21.8723.4924.0023.8324.61
B31.2632.0332.6132.2533.54
C15.6514.8214.6114.7315.36
D24.0524.0623.7924.0122.78
E7.174.904.294.493.02
removed pixels **--0.700.700.700.70
added pixels ***--0.020.020.020.02
* The area in the five climate zones plus the area of the removed pixels equals 100%. ** Area of pixels defined in the historical period but not defined for the projections. *** Area of pixels defined for the projections but not defined in the historical period.
Table 2. Percent of Global Population Living in Different Climate Zones.
Climate ZoneHistorical PeriodMid-CenturyLate-Century
SSP2-RCP4.5SSP5-RCP8.5SSP2-RCP4.5SSP5-RCP8.5
A28.0342.2941.4845.8943.70
B16.1420.5819.6221.5720.42
C44.2131.7433.7128.0532.47
D10.684.804.603.942.86
E0.370.090.050.060.01
Unaccounted *0.570.500.530.490.54
* People living in pixels in the population dataset [29] that are not defined in the climate zone dataset [28] for both the historical period and future projections.
Disclaimer/Publisher’s Note: The statements, opinions and data contained in all publications are solely those of the individual author(s) and contributor(s) and not of MDPI and/or the editor(s). MDPI and/or the editor(s) disclaim responsibility for any injury to people or property resulting from any ideas, methods, instructions or products referred to in the content.

