Article

Assessing Rainfall Variability in Jamaica Using CHIRPS: Techniques and Measures for Persistence, Long and Short-Term Trends

by
Cheila Avalon Cullen
1,* and
Rafea Al Suhili
2
1
CREST Institute, Chemistry, Earth & Environmental Sciences Department, The Graduate Center, The City University of New York, New York, NY 10031, USA
2
Civil Engineering Department, City College of New York, The City University of New York, New York, NY 10031, USA
*
Author to whom correspondence should be addressed.
Geographies 2023, 3(2), 375-397; https://doi.org/10.3390/geographies3020020
Submission received: 4 April 2023 / Revised: 10 May 2023 / Accepted: 22 May 2023 / Published: 26 May 2023
(This article belongs to the Special Issue Advanced Technologies in Spatial Data Collection and Analysis)

Abstract

:
Jamaica, as a Small Island Developing State (SIDS), is highly vulnerable to weather extremes. As precipitation persistence is a critical factor in determining the susceptibility of an area to risks, this work assesses the spatial and temporal variations of rainfall persistence in Jamaica from 1981 to 2020, using satellite-based information. The Hurst exponent (H) and the serial correlation coefficient (SCC) are used to evaluate the long-term persistence of precipitation and the Persistence Threshold (PT) concept is introduced to provide a description of rainfall characteristics over short periods, specifically, the number of consecutive days with precipitation above or below a set threshold value. The PT method is a novel concept that expands upon the Consecutive Dry Days (CDD) and Consecutive Wet Days (CWD) methods that only consider a threshold of 1 mm. Results show notable temporal and spatial variations in persistence over the decades, with an overall increasing trend in high precipitation persistence and a decreasing trend in low precipitation persistence. Geographically, the northern mountainous area of Jamaica received the most persistent rainfall over the study period with an observed increase in extreme rainfall events. The excess rainfall of the 2001–2010 decade is remarkable in this study, coinciding with the global unprecedented climate extremes during this time. We conclude that the data used in this study is viable for understanding and modeling rainfall trends in SIDS like Jamaica, and the derived PT method is a useful tool for short-term rainfall trends, but it is just one step toward determining flood or drought risk. Further research will focus on developing drought and flood indices.

1. Introduction

The Intergovernmental Panel on Climate Change (IPCC) has cautioned that global warming and atmospheric circulation shifts are likely to cause changes in the frequency and location of extreme weather events [1], making it crucial for the scientific community to understand rainfall variability and extreme precipitation events in Small Island Developing States (SIDS). SIDS is a group of 58 small islands in the Atlantic and Indian Oceans, Caribbean, and Pacific regions highly vulnerable to extreme weather and climate events [2]. Jamaica being a SIDS is particularly vulnerable to changes in precipitation patterns due to climate change. Over the years, the island has experienced several severe storms, posing a significant threat to its infrastructure, human life, and economic development [3,4,5,6]. To better understand and identify associated risks, such as floods or droughts in Jamaica, it is crucial to consider rainfall persistence.
Rainfall persistence, the continuity of precipitation over a given time, is highly affected by differences in topography, land use, climate patterns, and atmospheric conditions, and it is a significant factor influencing the severity of the resultant risk [7,8,9]. For instance, the severity of an extreme precipitation event that could pose a flood threat depends on the high rainfall quantity and its persistence. The same applies to a low rainfall persistence that could lead to a drought. In both cases, rainfall persistence plays a significant role in determining the level of risk [10].
Mathematically, high persistence can be defined as the tendency for high values to follow high values and low values to follow low values [11]. The literature highlights the Hurst exponent (H), a measure of the long-term memory of a time series or signal, and the Serial Correlation Coefficient (SCC), a measure of the linear relationship between a time series and a lagged version of itself, as appropriate procedures to understand the persistence or trendiness of a rainfall time series [7,8,11,12,13,14,15,16,17,18,19,20,21]. Chandrasekaran et al. (2019) [7] for example, showed that the Hurst exponent is a good indicator of rainfall predictability and confirmed that higher H values indicate greater probability using real and hypothetical data. Pal et al. (2020) [20] also demonstrated that the H exponent is useful for understanding the long-term rainfall variation during the summer monsoon in northern India as no persistent forecast was possible and linear regressions over time resulted in bad fits. Additionally, Velásquez Valle et al. (2013) [21] derived the H exponent using standard wavelets for daily rainfall data for the Zacatecas State in Mexico. In this case, results demonstrated that the H exponent helps define the randomness of rainfall behavior for different climates and aids to identify climate change’s impact on local precipitation records.
Using the SCC, Yeşilırmak et al. (2016) [22] analyzed the changes in precipitation irregularity in western Turkey using daily and monthly precipitation data. Results identified that the southern part of the region is prone to floods and highlighted the need for measures to control flooding and droughts. The trend analysis showed a slight tendency toward more regular precipitation distribution throughout the year. Similarly, Xu et al. (2022) [23] examined the temporal and spatial distribution attributes of extreme precipitation in the Pearl River Basin (PRB) in China from 1960–2018. The authors explored the relationships between extreme precipitation indices (EPI), annual total precipitation, elevation, and persistence of extreme rainfall. The study found that some EPI, such as RX1day, Rx5day, SDII, and Consecutive Dry Days (CDD), had increasing trends, while others, such as R95p and R99p, had decreasing trends. Further, the EPI trends varied among seasons and regions. Investigating the relationship between rainfall and temperature, Reiter et al. (2012) [24] examined 88 meteorological stations in the Upper Danube Basin from 1960 to 2006. Results showed a recent change with significantly increasing temperature trends in summer, spring, and yearly. The precipitation trends were mixed, with some stations showing increases in winter and decreases in summer and autumn, but most time series showed no significance and low trend values.
In terms of proximity to the Caribbean, some studies have investigated the Central American region. For instance, in an analysis conducted by Casanueva et al. (2014) [25], three indices were employed to analyze the variability in extreme precipitation over Europe. (R95pTOT), which represents the number of days that precipitation exceeds the 95th percentile; Consecutive Wet Days (CWD), which refers to the number of consecutive days with rainfall over 1 mm; and CDD, which denotes the number of successive days with precipitation below 1 mm. The study found different patterns of variability for CWD and CDD in winter and summer, with north-south and east-west configurations, respectively. The study also found that the North Atlantic Oscillation was associated with opposite effects in winter and summer. Furthermore, positive correlations were found between the Atlantic Multidecadal Oscillation and R95pTOT throughout the year. The study suggests that the association between extreme precipitation indices and large-scale variables could provide new possibilities for projecting extremes in downscaling techniques [25].
In another study, Anderson et al. (2019) [26] investigated changes in the intensity and timing of midsummer drought (MSD) in Central America. The authors used a high-resolution precipitation dataset to examine the spatiotemporal intricacies of the MSD. The study found spatially variable trends in MSD temporality, rainy season precipitation, total dry days, and extreme wet events at the local scale. Moreover, a positive trend in the duration but not the magnitude of the MSD was found at the regional scale. The study suggests that a detailed spatiotemporal understanding of MSD variability and trends can provide evidence-based adaptation planning to reduce the vulnerability in the area [26].
In a study more specific to the Caribbean region, Nakaegawa et al. (2014) [27] simulated changes in annual maximum 5-day rainfall and number of consecutive dry days for Central America, Mexico, and the Caribbean using three different atmospheric global general circulation models (AGCMs) to calculate projections and uncertainty. The study found that RX5Ds and CDDs were expected to increase in most areas due to global warming, but consistent changes were limited to small areas. All three AGCMs projected that RX5Ds and CDDs would increase when averaged overland. Furthermore, Bathelemy et al. (2022) [28] evaluated the performance of five rainfall datasets in the Greater and Lesser Antilles using quantitative and qualitative statistical metrics. The rainfall estimates from rain gauge and satellite observations from the Climate Hazards Group Infrared Precipitation with Stations (CHIRPS) was recommended for water resources management research and statistical research on heavy rainfall events.
Focused on a different region, a study by Hsu et al. (2020) [29] analyzed the performance of two satellite precipitation products, CHIRPS, and Integrated Multi-satellitE Retrievals for the Global Precipitation Mission (IMERG), in representing multiple timescale precipitation variations over Taiwan. The study found that while IMERG performed slightly better than CHIRPS in most features examined, CHIRPS performed better in representing the annual cycle’s magnitude, the spatial distribution of seasonal mean precipitation, quantitative precipitation estimation of interannual variation of winter precipitation, and the occurrence frequency of non-rainy days in winter. CHIRPS was able to accurately depict the temporal variation in rainfall over Taiwan on annual, seasonal, and interannual timescales with 95% significance, demonstrating its potential use for studying multiple timescale variations in precipitation.
In another study for the Beles Basin in Ethiopia, Belay et al. (2019) [30] assessed the spatiotemporal variability of rainfall using CHIRPS data from 1981–2017. Results showed that CHIRPS slightly overestimates rainfall occurrence in lowland regions and underestimates it in highland regions. CHIRPS rainfall amount valuations were more accurate in the highland and improved with longer integration times. The authors also highlighted an increasing trend of rainfall, high variability of rainfall in certain months, and the potential of CHIRPS to aid decision-making in poorly gauged areas.
Although various studies that use satellite data, rain gauges, a combination of both, or climate models have examined extreme precipitation events globally, few have focused on SIDS like Jamaica due to the lack of data, insufficient temporal and spatial information availability, technological capacities, and human resources in these regions [2]. This study is part of a series of analyses on the application of Earth Observations (EO) in SIDS countries. Avalon-Cullen et al. (2023) being the first of the series [2], identified potential opportunities, capacity needs, and long-term benefits for the integration of EO in Jamaica to further enhance and strengthen the national DRR framework. This work follows those recommendations, builds on the success of the CHIRPS dataset in depicting temporal variations, examines its viability of use in Jamaica, and aims to identify long and short-term spatial and temporal variations in rainfall persistence in the country from 1981 to 2020. To achieve this, the study uses the Hurst and Serial Correlation Coefficient techniques and proposes a Persistence Threshold (PT) methodology. The PT approach identifies various thresholds and their corresponding high and low persistence for daily precipitation over the region. Additionally, the PT methodology is set to serve as the first step toward developing a flood/drought index in the following study.
To begin with, we provide an overview of the climatological features of Jamaica, influenced by its location in the Caribbean region. In Section 2, we provide a detailed explanation of the CHIRPS database. Section 3 outlines the Hurst and SCC approaches and presents the structure of the PT methodology. In Section 4, we analyze and contrast the findings of the three methodologies and offer a range of corresponding maps that illustrate rainfall fluctuations throughout the region.

2. Study Area and Data

2.1. Study Area

Jamaica, the third-largest island in the Greater Antilles in the Caribbean, experiences a dry-winter tropical climate characterized by a bimodal seasonal rainfall pattern. The early season (April–July) and late season (August–November) are divided by a period of minimal rainfall known as the mid-summer drought (MSD), which is present across the Intra-American Sea region [31]. The island’s interior is dominated by a series of mountain ranges, including the Blue Mountains, the longest range, with the highest peak in Jamaica, rising to 2256 m. The northeastern area of Jamaica receives the highest average rainfall of more than 400 mm, with the Blue Mountains averaging over 625 mm per year. Jamaica is also prone to tropical storms, with 11 named storms making landfall between 1988 and 2012, resulting in floods, flash floods, and landslides throughout the island [2]. These natural hazards have a significant impact on Jamaica’s population, estimated at 2.9 million people, and lead to significant GDP losses [32]. Figure 1 shows Jamaica’s location in the Caribbean.

2.2. Data—CHIRPS

The Climate Hazards Group Infrared Precipitation with Station data (CHIRPS) is a database created through a collaboration between the U.S. Geological Survey (USGS) and the University of California, Santa Barbara (UCSB) to support the United States Agency for International Development Famine Early Warning System Network (FEWS NET). This multi-source product incorporates various data sources including geostationary thermal infrared satellite observations, the Tropical Rainfall Measuring Mission’s (TRMM) 3B42 product, the Climate Hazards Group Precipitation Climatology (CHPClim), atmospheric model rainfall fields from NOAA CFS (Climate Forecast System), and precipitation observations from national or regional Meteorological Services. The database provides gridded rainfall time series at a resolution of 0.05° with daily temporal scale and quasi-global coverage from 1981 to the present [33]. The database has been used globally to determine the hydrological impacts of drought, support hydrological forecast and trend analyses, and act as a proxy for antecedent soil moisture content to help determine rainfall-triggered landslide risk in the tropics [34].
The two-part process of the CHIRPS algorithm, as described in Belay et al. (2019) [30], begins by creating rainfall estimates using local regressions between Tropical Rainfall Measuring Mission multi-satellite precipitation analysis and Infrared Precipitation cold cloud duration (CCD) values (<235 K). The resulting value is then converted into millimeters of precipitation through local regression with TRMM 3B42 precipitation values. In the second step, the temporal component of the IRP value is multiplied by the spatial component of the CHPClim values to generate an unbiased gridded estimate, called the Climate Hazards Group IR Precipitation (CHIRP). Finally, CHIRP data is blended with ground station gauge data to produce the final product, CHIRPS.
This study employs the CHIRPS dataset to examine the changes in rainfall persistence and frequency across Jamaica during various periods between 1981 and 2020. The analysis employs the Hurst exponent (H) and Serial Correlation Coefficient (SCC) methodologies to understand long-term variability and proposes a novel method that can aid in categorizing short-term high and low persistence for different daily precipitation thresholds in the study area. This technique can aid in categorizing the level of wetness and dryness associated with a given threshold and help in identifying flood or drought risks. The approach is referred to as the Persistence Threshold (PT).

3. Methods

This section outlines the methodologies used to assess the spatial and temporal variations of rainfall persistence and frequency in Jamaica using CHIRPS from 1981 to 2020. To accomplish this, we conducted a thorough analysis of the rainfall data, which included examining the maximums, minimums, averages, and trends across daily, monthly, seasonal, and decadal time frames first, using the H exponent and the SCC methods. Then, we established specific high and low thresholds to investigate the number of consecutive days with precipitation values equal to or above/below the corresponding threshold for persistent rainfall, the PT method.
Data were obtained via Google Earth Engine for 364 locations spaced at 0.05° over the island as seen in Figure 2. The information was then subdivided into four decades as follows: G1 (1981–1990), G2 (1991–2000), G3 (2001–2010), and G4 (2011–2020).
The Hurst exponent (H) is a measure of the long-term memory of a time series or signal. It is commonly used in finance, economics, geophysics, and other fields to analyze the persistence or trendiness of a time series. H is a real number between 0 and 1 that characterizes the autocorrelation structure of a time series. A value less or equal to 0.5 indicates that the time series has no memory (it is completely random) while a value greater than 0.5 suggests that the time series exhibits persistence or long-term memory, which signifies that the past values of the series have a strong influence on its future values [35].
The Hurst coefficient is calculated using the Rescaled Range method as follows:
For the daily precipitation series,
P i ,   i = 1 , 2 , , N ,
where N is the number of observations
A series of mean adjusted values, Y, is created by subtracting the expected value E,
  Y i = P i E P i   ,   i = 1 , 2 , N
Then a series of cumulative deviate Zj is generated,
Z j = i = 1 j Y i ,   i = 1 , 2 , N
Following, the range series Rk is calculated,
R k = max Z 1 , Z 2 ,   Z k min Z 1 , Z 2 ,   Z k
Then, the standard deviation series is estimated,
S k = 1 k i = 1 k ( P i P k ¯ )
After which the rescaled range series is computed,
R k S k ,   k = 1 , 2 , . N
Lastly, the Hurst coefficient is determined by the linear fitting of
E R k S k = C   k H
where E is the expectation of R k S k , and C is a constant.

3.1. Serial Correlation Coefficient (SCC)

The SCC, also known as the autocorrelation coefficient or lagged correlation coefficient, is a measure of the linear relationship between a time series and a lagged version of itself. In other words, it measures the correlation between a time series and its past values. The SCC is a useful tool for checking the independence of a time series. When a time series is entirely random, the population auto-correlation function will be zero for all lags except zero. At zero, it will be one, as all data sets are perfectly correlated with themselves. In such cases, the sample serial correlation coefficients will deviate only slightly from zero due to sampling effects [36].
The lag-k SCC can be mathematically expressed as:
  r k = i = 1 N k [ ( P i E P i P i + k E P i i = 1 N P i E P i 2  
where E P i is the expectation value of P i .
Where rk is the lag-k serial correlation coefficient that relates the precipitation value at day t to that of day t + k. Since this measure is a statistical measure, we test its significance using the well-known Anderson’s limits at 95% confidence intervals:
1.96 N , 1.96 N ,
where N is the number of observations
The daily precipitation SCC up to a 365-lag is calculated for all locations in Jamaica. However, as a measure of persistence, in this study, we consider the SCC from the number of significant sequential lags up to the first non-significant lag.

3.2. Persistence Threshold—PT

Expanding on the concepts of Consecutive Dry Days—CDD, and Consecutive Wet Days—CWD, the PT notion is introduced to describe the rainfall characteristics over finite, short periods by examining the number of consecutive days with precipitation above or below a set threshold value. These detailed thresholds, in addition to other factors, can be useful in determining whether an area is susceptible to drought or flooding.
For example, droughts can occur during a sustained period of low precipitation, resulting in devastating environmental consequences such as crop and ecological damage and water resources scarcity. The severity and duration of a drought depend on various parameters that include temperature and humidity, but also on the amount and frequency of rainfall. A key indicator of drought is the persistence of low precipitation, which can be measured by a combination of rainfall amounts and consecutive days without significant rainfall. If the quantity of rainfall falls below a specified threshold for an extended period, it can lead to a state of low persistence.
The threshold value used to measure low persistence can vary depending on the location and climate, but generally, the lower the threshold, the more consecutive days with low precipitation are required to meet the criteria for low persistence. For instance, in arid regions, a low persistence threshold may be set at a relatively low rainfall value, such as 1 mm per day, and may require several consecutive days without any significant rainfall to qualify as low persistence. Conversely, high persistence of precipitation can lead to flooding, which occurs when there is excessive rainfall over a short period, often resulting in overflowing waterways and environmental damage. The duration and severity of flooding can vary depending on the amount and intensity of precipitation, as well as the terrain and soil conditions.
For these reasons, the selection of an association of thresholds and consecutive days should be based on the objective of the application. For instance, a region with specific topography and hydrological properties would have a different flooding threshold/day relationship than any other area. Similarly, the drought threshold/day event should be determined based on the water consumption for the intended use.
Because there is no specific flood or drought application in this study, high and low threshold definitions were derived from evaluating daily rainfall patterns in the data. Since approximately 99% of the rainfall frequency over the island occurs between 1 and 50 mm, as shown in Table 1, values below 50 mm are assumed for setting low persistence thresholds, while values above 50 mm are considered for selecting high persistence thresholds.
To determine the frequency of high threshold-based rainfall persistence at each location and threshold, we estimate the number of events for L consecutive days where the precipitation is equal to or exceeds the specified threshold, N d e x c e e d s T h k , L , j as follows:
  • N d e x c e e d s T h k , L , j = L   n u m b e r   o f   e x e c u t i v e   d a y s   w h e r e   P r i , j T h k  
  • where, P r i , j is the precipitation of day i, at location j.
  • and where, i = 1…, Number of Day observations.
  • j = 1…, 364 Number of locations
  • L = 1…, Number of Days exceeding Threshold
  • T h k = Precipitation Threshold k
  • k = 1…, Number of Thresholds selected.
  • and,
α h T h k , L , j = N d e x c e e d s T h k , L , j N Y × 100
where, α h T h k , L is the yearly normalized percentage of high rain persistence for a threshold T h k with N d e x c e e d s T h k , L , j = L, at location j, and where NY is the Number of Years.
To determine the occurrence of low threshold-based rainfall persistence for each location and threshold, we employed a similar methodology. Specifically, we estimated the number of events for L consecutive days where the precipitation is equal to or less than the specified threshold, denoted as N d l e s s T h k , L , j and explained as follows:
  • N d l e s s T h k , L , j = L   n u m b e r   o f   e x e c u t i v e   d a y s   w h e r e   P r i , j T h k
  • where, P r i , j is the precipitation of day i, at location j.
  • and were, i = 1…, Number of Day observations.
  • j = 1…, 364 Number of locations
  • L = 1…, Number of Days less than Threshold
  • T h k = Precipitation Threshold k
  • k = 1…, Number of Thresholds selected.
  • and,
α l T h k , L , j = N d l e s s T h k , L , j N y × 100  
where, α l T h k , L is the yearly normalized percentage of low rain persistence for a threshold T h k with N d l e s s T h k , L , j = L, at location j.

4. Results

4.1. Average Temporal Rainfall Variability

Figure 3 shows the average of the monthly sums of rainfall variability over the four decades and Table 2 shows the t-test results after comparing the annual precipitation means between the four sub-sample groups over the 40 years. The corresponding t-test p-values are greater than 0.05, indicating that there are no significant differences in the annual means of precipitation between the four sub-samples over the entire period. Suggesting that the mean annual precipitation levels in Jamaica remained relatively stable over the 40 years under investigation.
The seasonal mean variability based on the average monthly sums shown in Figure 4 and the corresponding t-test p-values in Table 3 do not show significant differences in the mean precipitation over the region on a seasonal wet/dry basis in the area.

Extreme Temporal Rainfall Variability

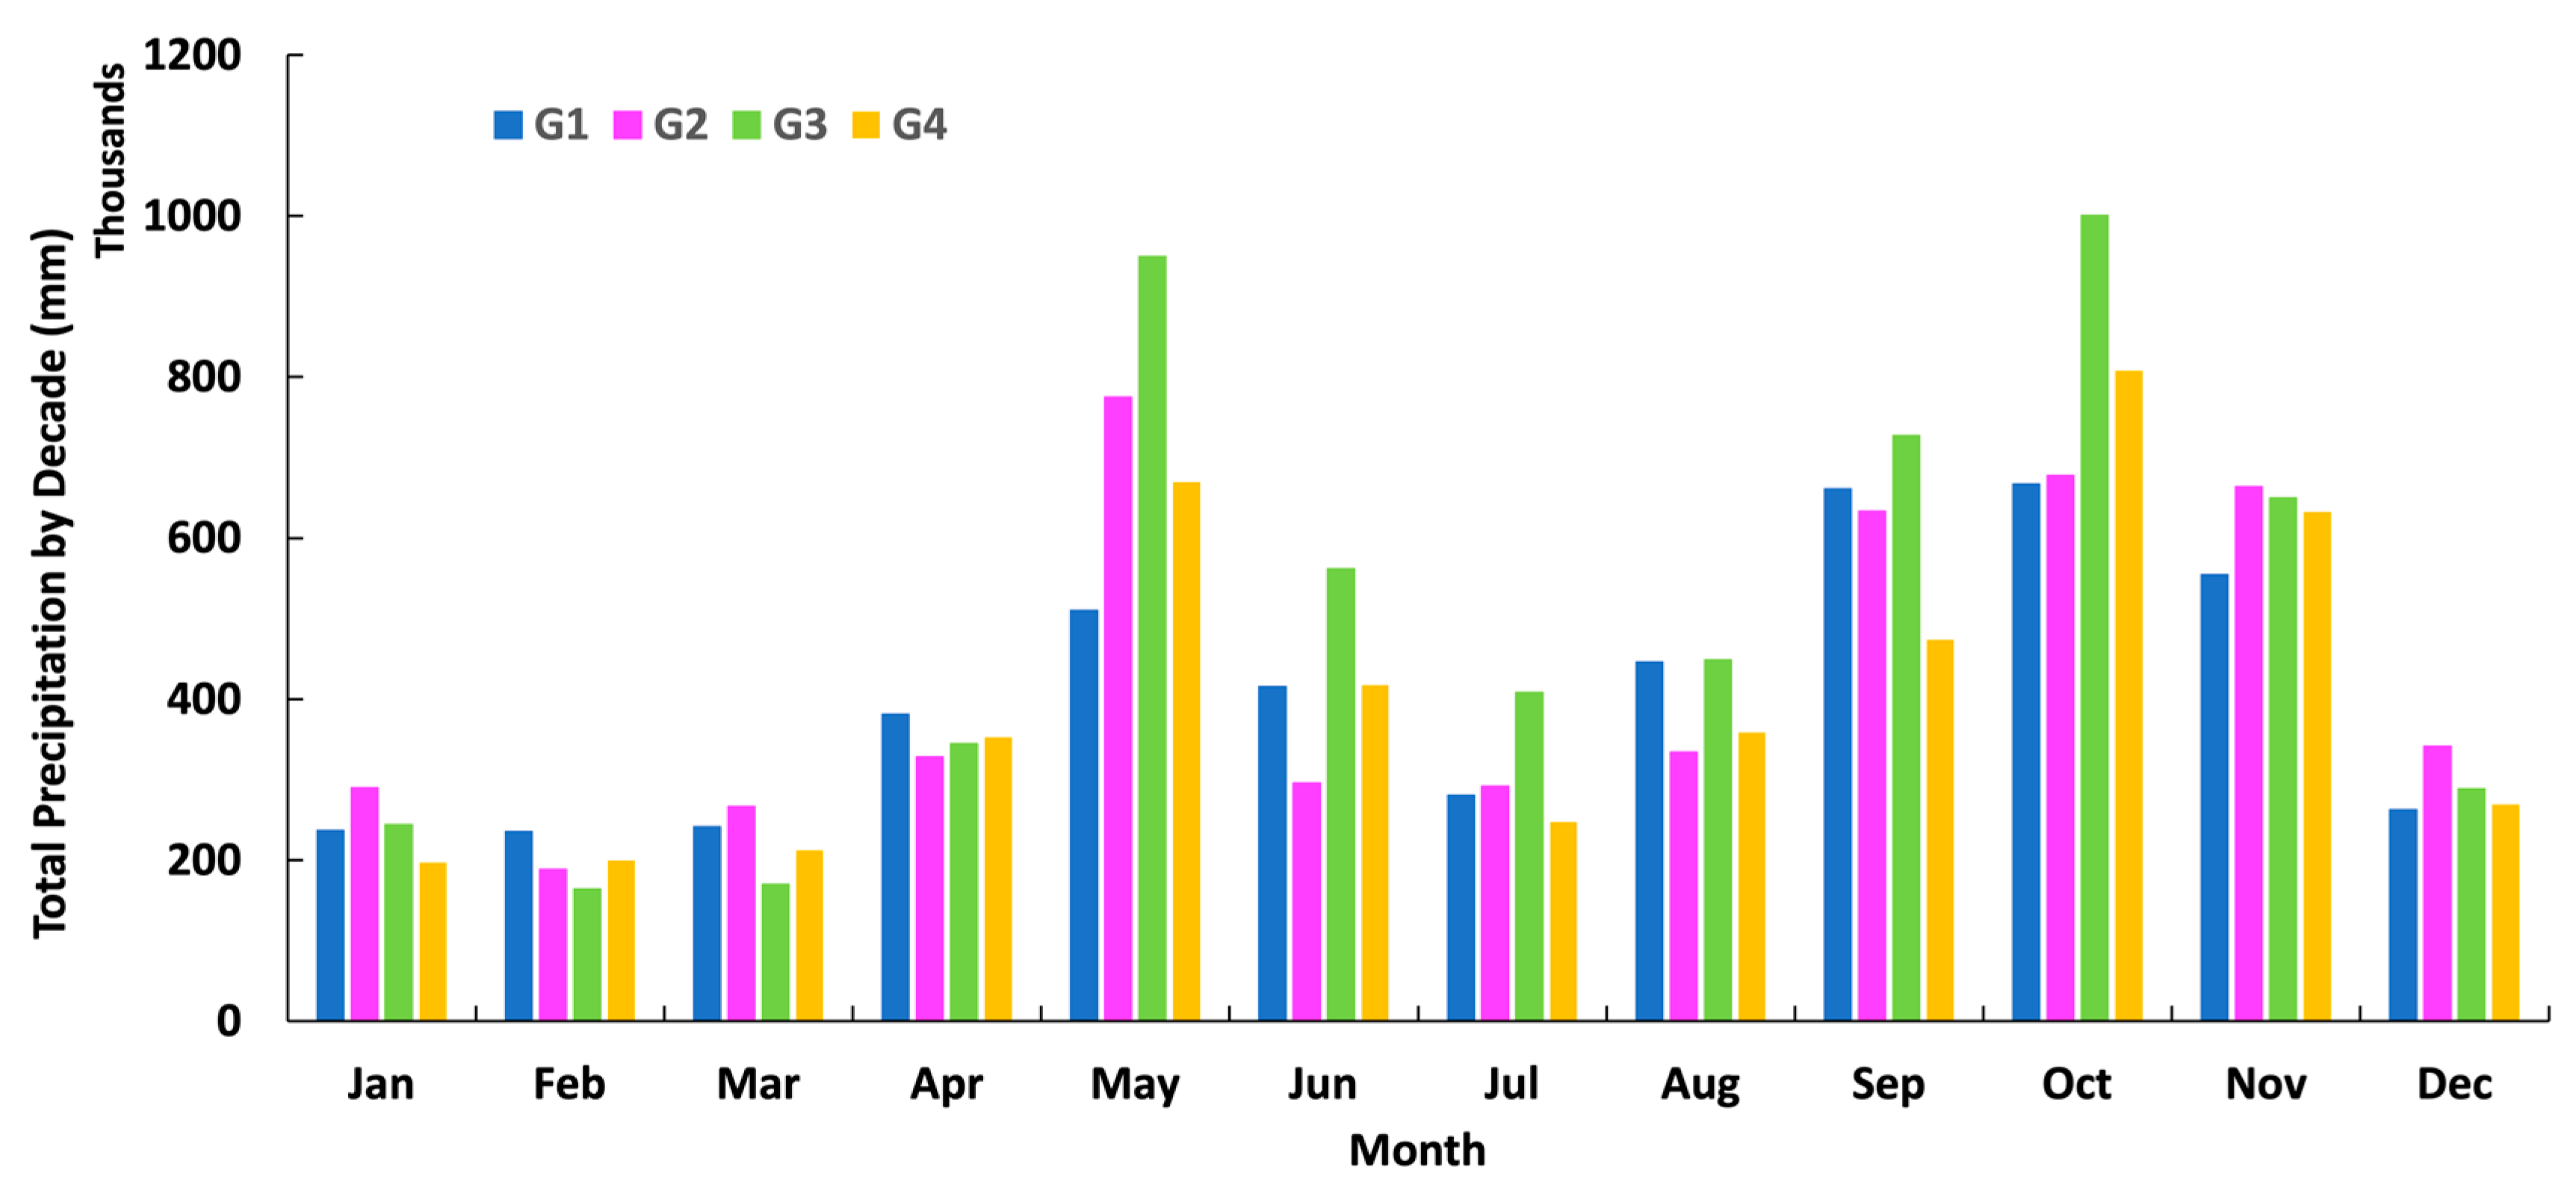
Figure 5 shows the total rainfall quantities recorded during the decades. Notably, this figure highlights that May through October in the third decade were characterized by higher rainfall over the study area. The observed difference in rainfall quantities during this decade could be attributed to various factors, including the natural variability in the North Atlantic Oscillation (NAO) or the La Niña/Southern Oscillation (ENSO) phenomenon that was prevalent during this period in the Caribbean region and the world [37]. Previous studies in the northeastern Caribbean have indicated that during the wet season, there is a 14% increase in precipitation during La Niña years compared to El Niño years [38]. Moreover, it is important to highlight that the 2001–2010 decade was the warmest since the start of modern measurements in 1850, with the world experiencing unprecedented climate extremes during this time [39]. Nonetheless, further analysis is required to establish the exact causes of this observed trend and the implications for future rainfall patterns.

4.2. Spatial Rainfall Variability

Various methods and measures can be employed to evaluate the persistence of a time series, including the Hurst exponent (H) and the serial correlation coefficient (SCC). These tools allow us to identify the degree of long-term persistence in daily precipitation and provide a valuable characterization of the dynamics of the precipitation patterns in Jamaica. However, these measures provide insight into long-term persistence without including a threshold value. In this section, we overview such measures for the long-term rainfall variability over Jamaica and introduce a novel methodology for identifying short-term persistence that is associated with a specific rainfall threshold, referred to as the Persistence Threshold (PT). To further explore rainfall variability in Jamaica, we present an overall spatial analysis of examining the long-term persistence measures mentioned above and the newly developed short-term persistence threshold measures. All measures (H, SCC, and PT) of decadal spatial frequency of occurrence are calculated using a MATLAB code and then normalized for comparison between decades using maps in ArcGIS 10.7.

4.2.1. Hurst Exponent (H)

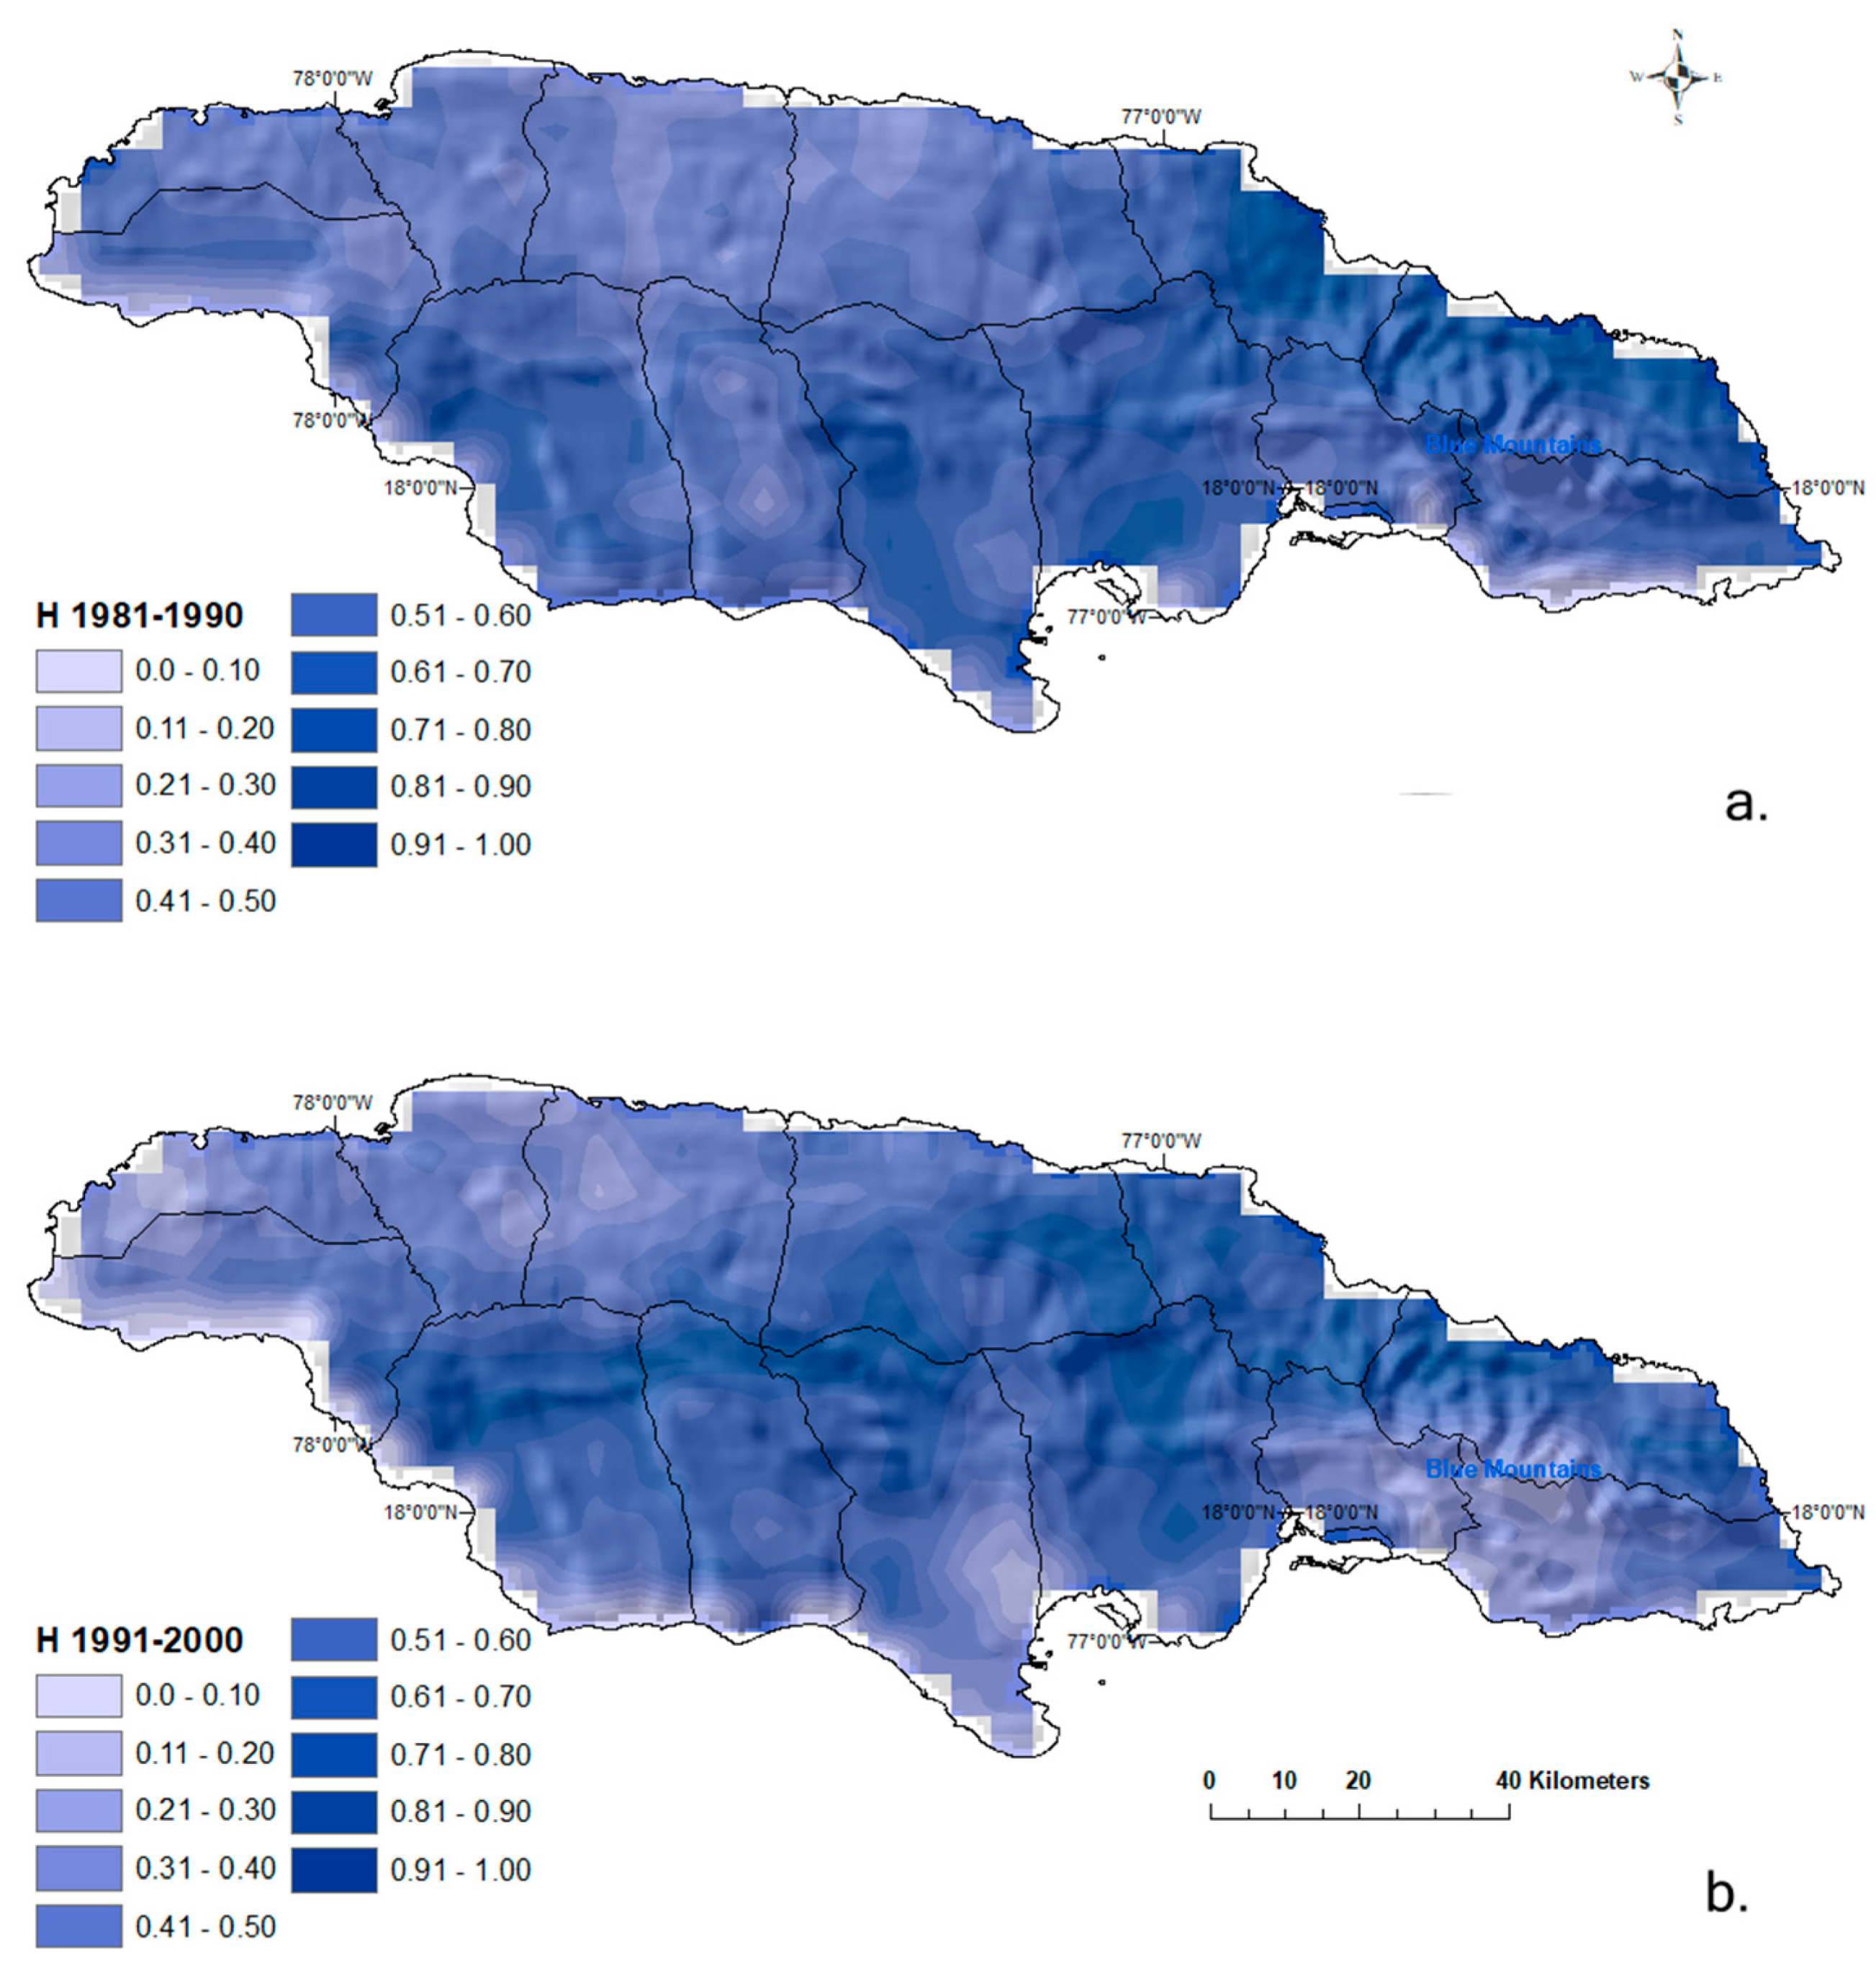
An H value of 0.5 indicates that the time series has no memory (it is completely random) while a value greater than 0.5 suggests that the time series exhibits persistence or long-term memory. This signifies that the past values of the series have a strong influence on its future values. Hmax changes throughout each decade, with values at 0.67, 0.53, 0.54, and 0.67, respectively. Figure 6a,b shows the normalized H spatial distribution for the four decades G1, G2, G3, and G4, where in G1 and G2, rainfall persistence is observed in the north and southeastern areas of Jamaica. This pattern expands towards the center of the island during the second decade G2. However, the spatial variation of precipitation persistence differs in G3, covering the entire northern and middle parts of the country and it is less prominent in the southern regions. Finally, in G4, precipitation persistence returns to a similar pattern to that of G1, and G2.
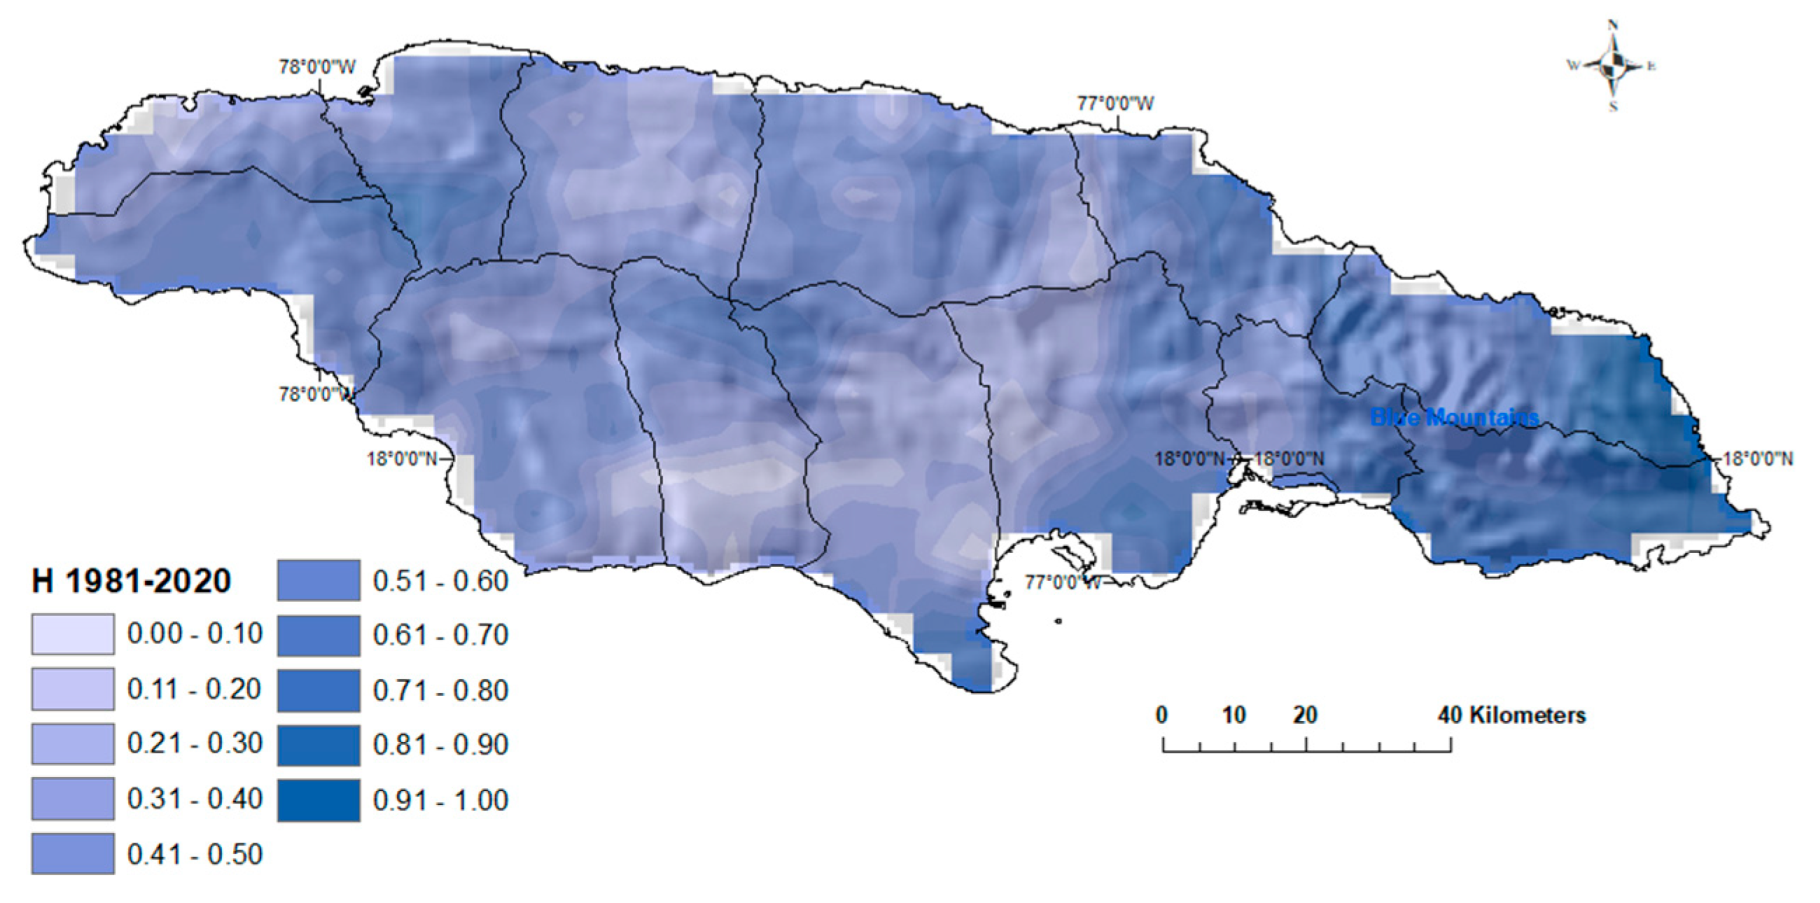
Figure 7 provides an overview of the Hurst coefficient spatial distribution over Jamaica for the entire study period. Persistent precipitation is observed primarily in the northeastern side of the country.

4.2.2. Serial Correlation Coefficient (SCC)

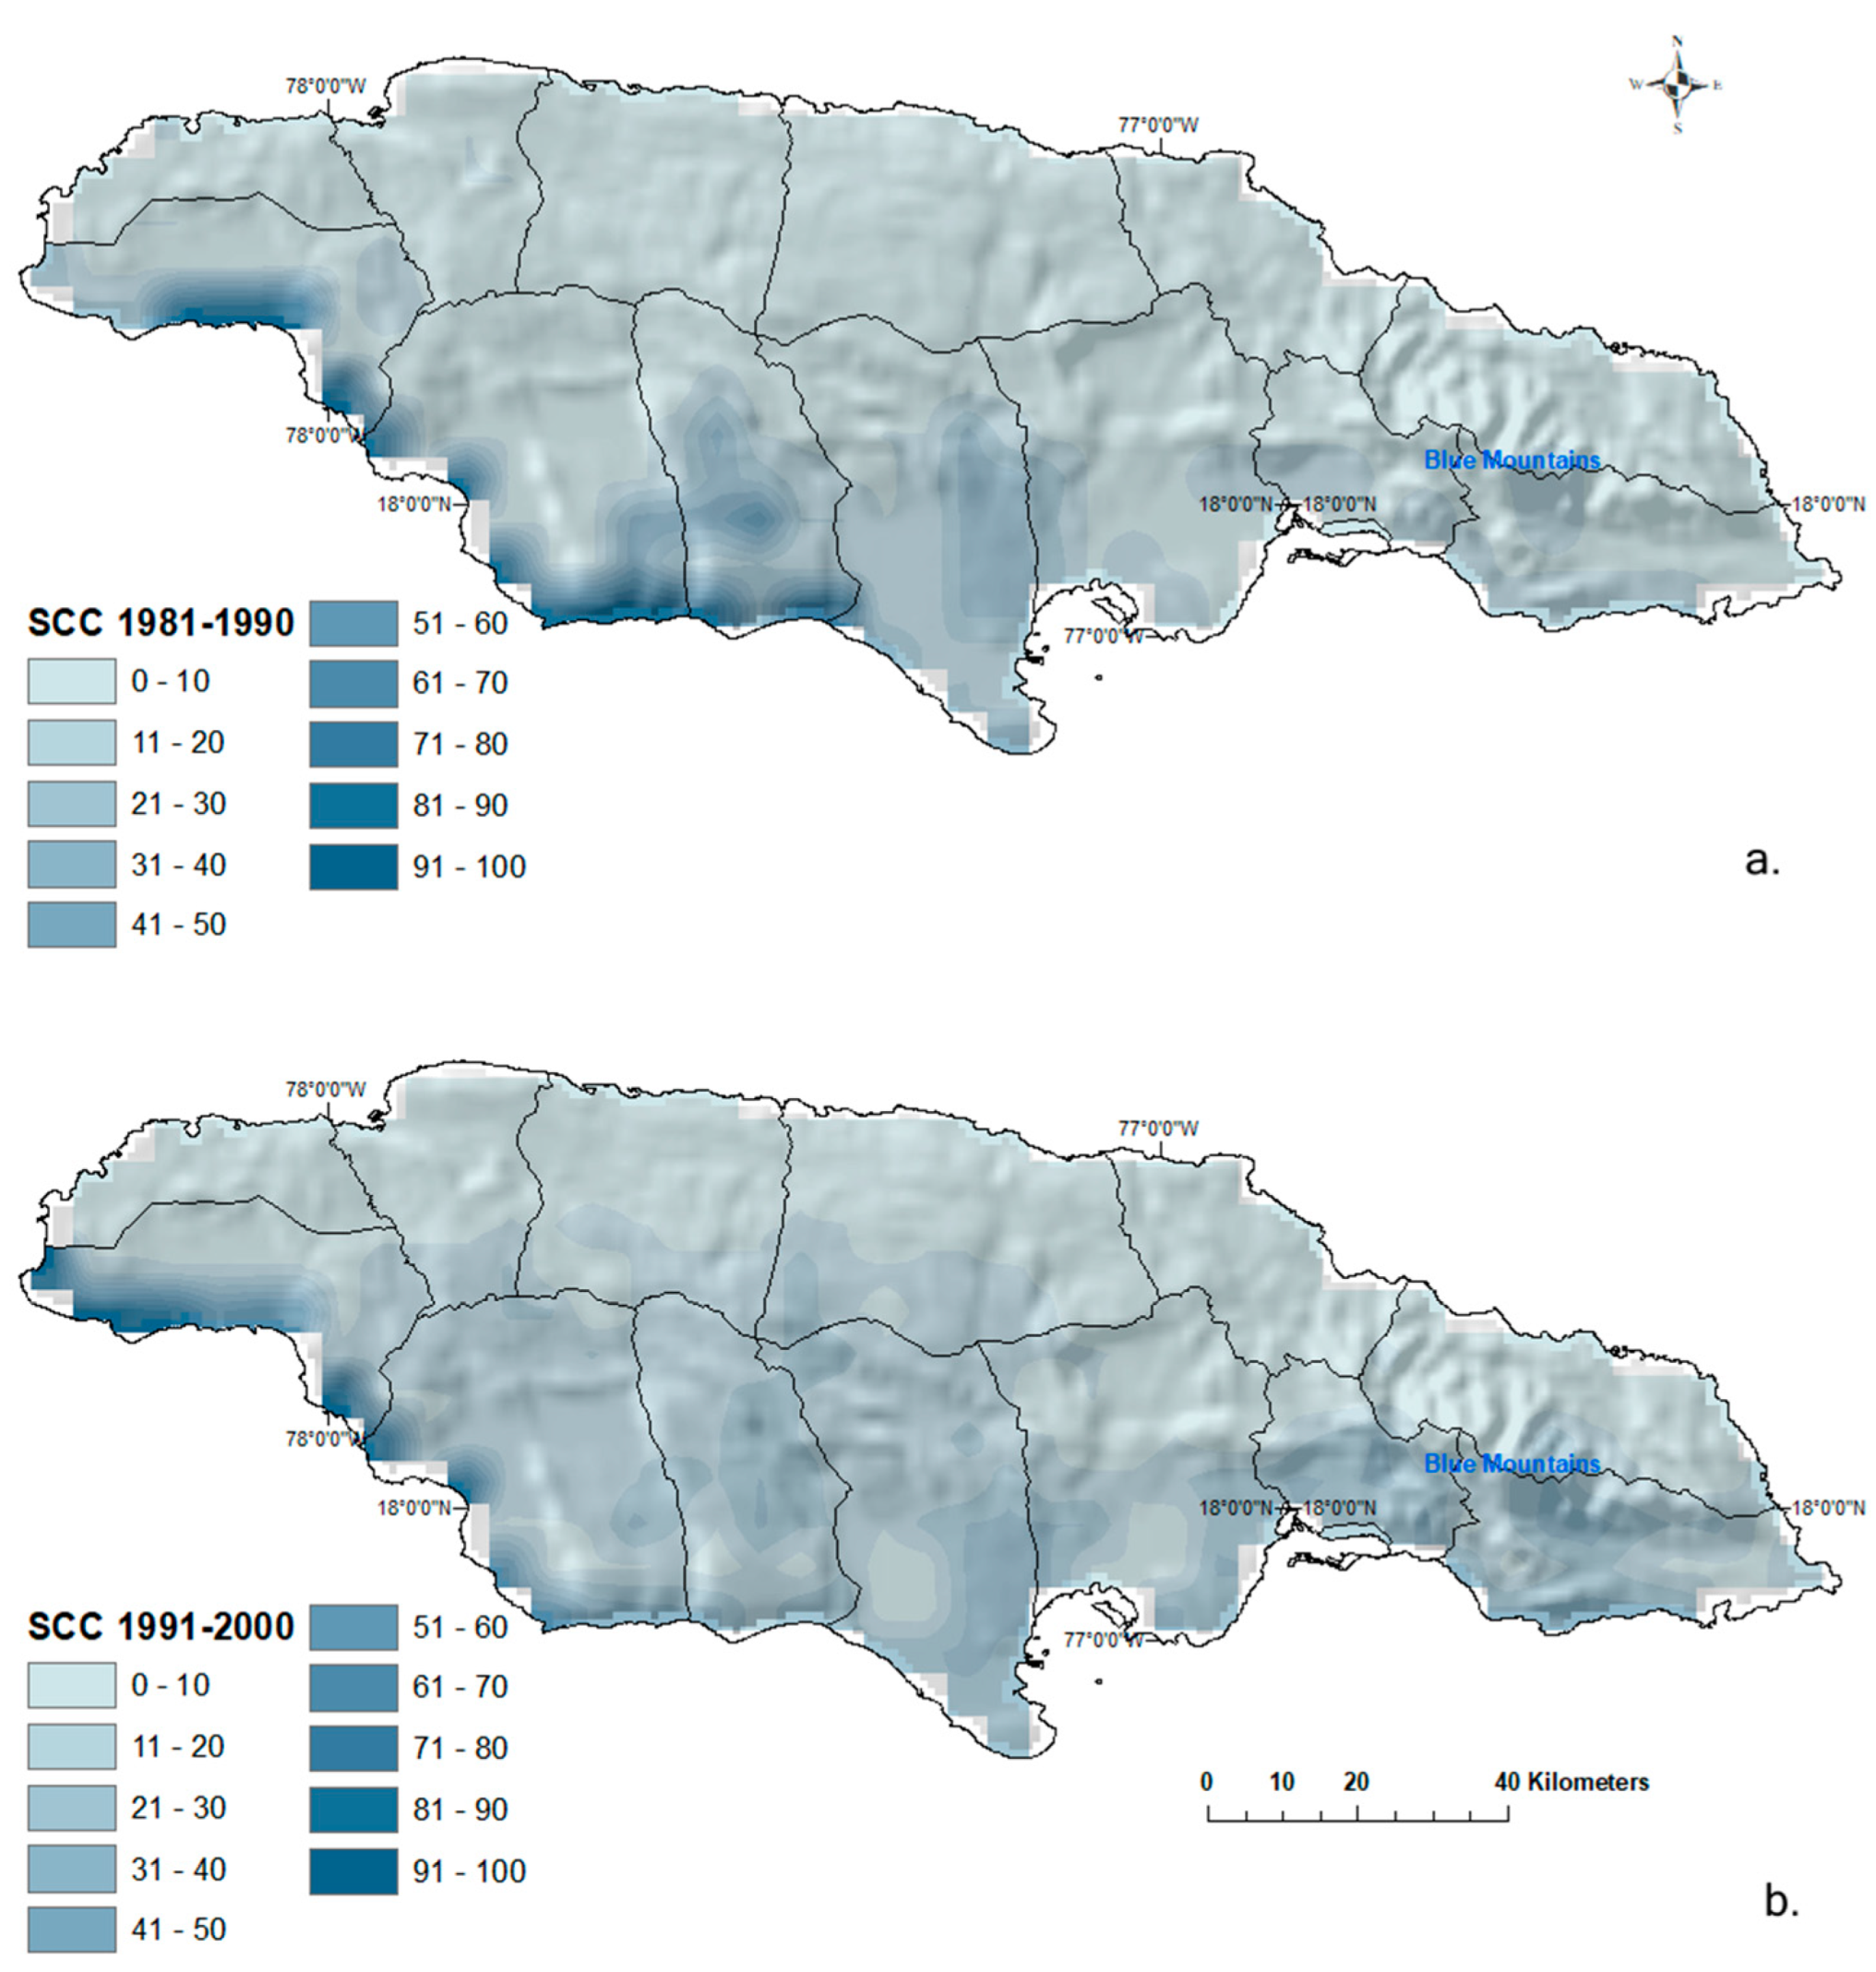
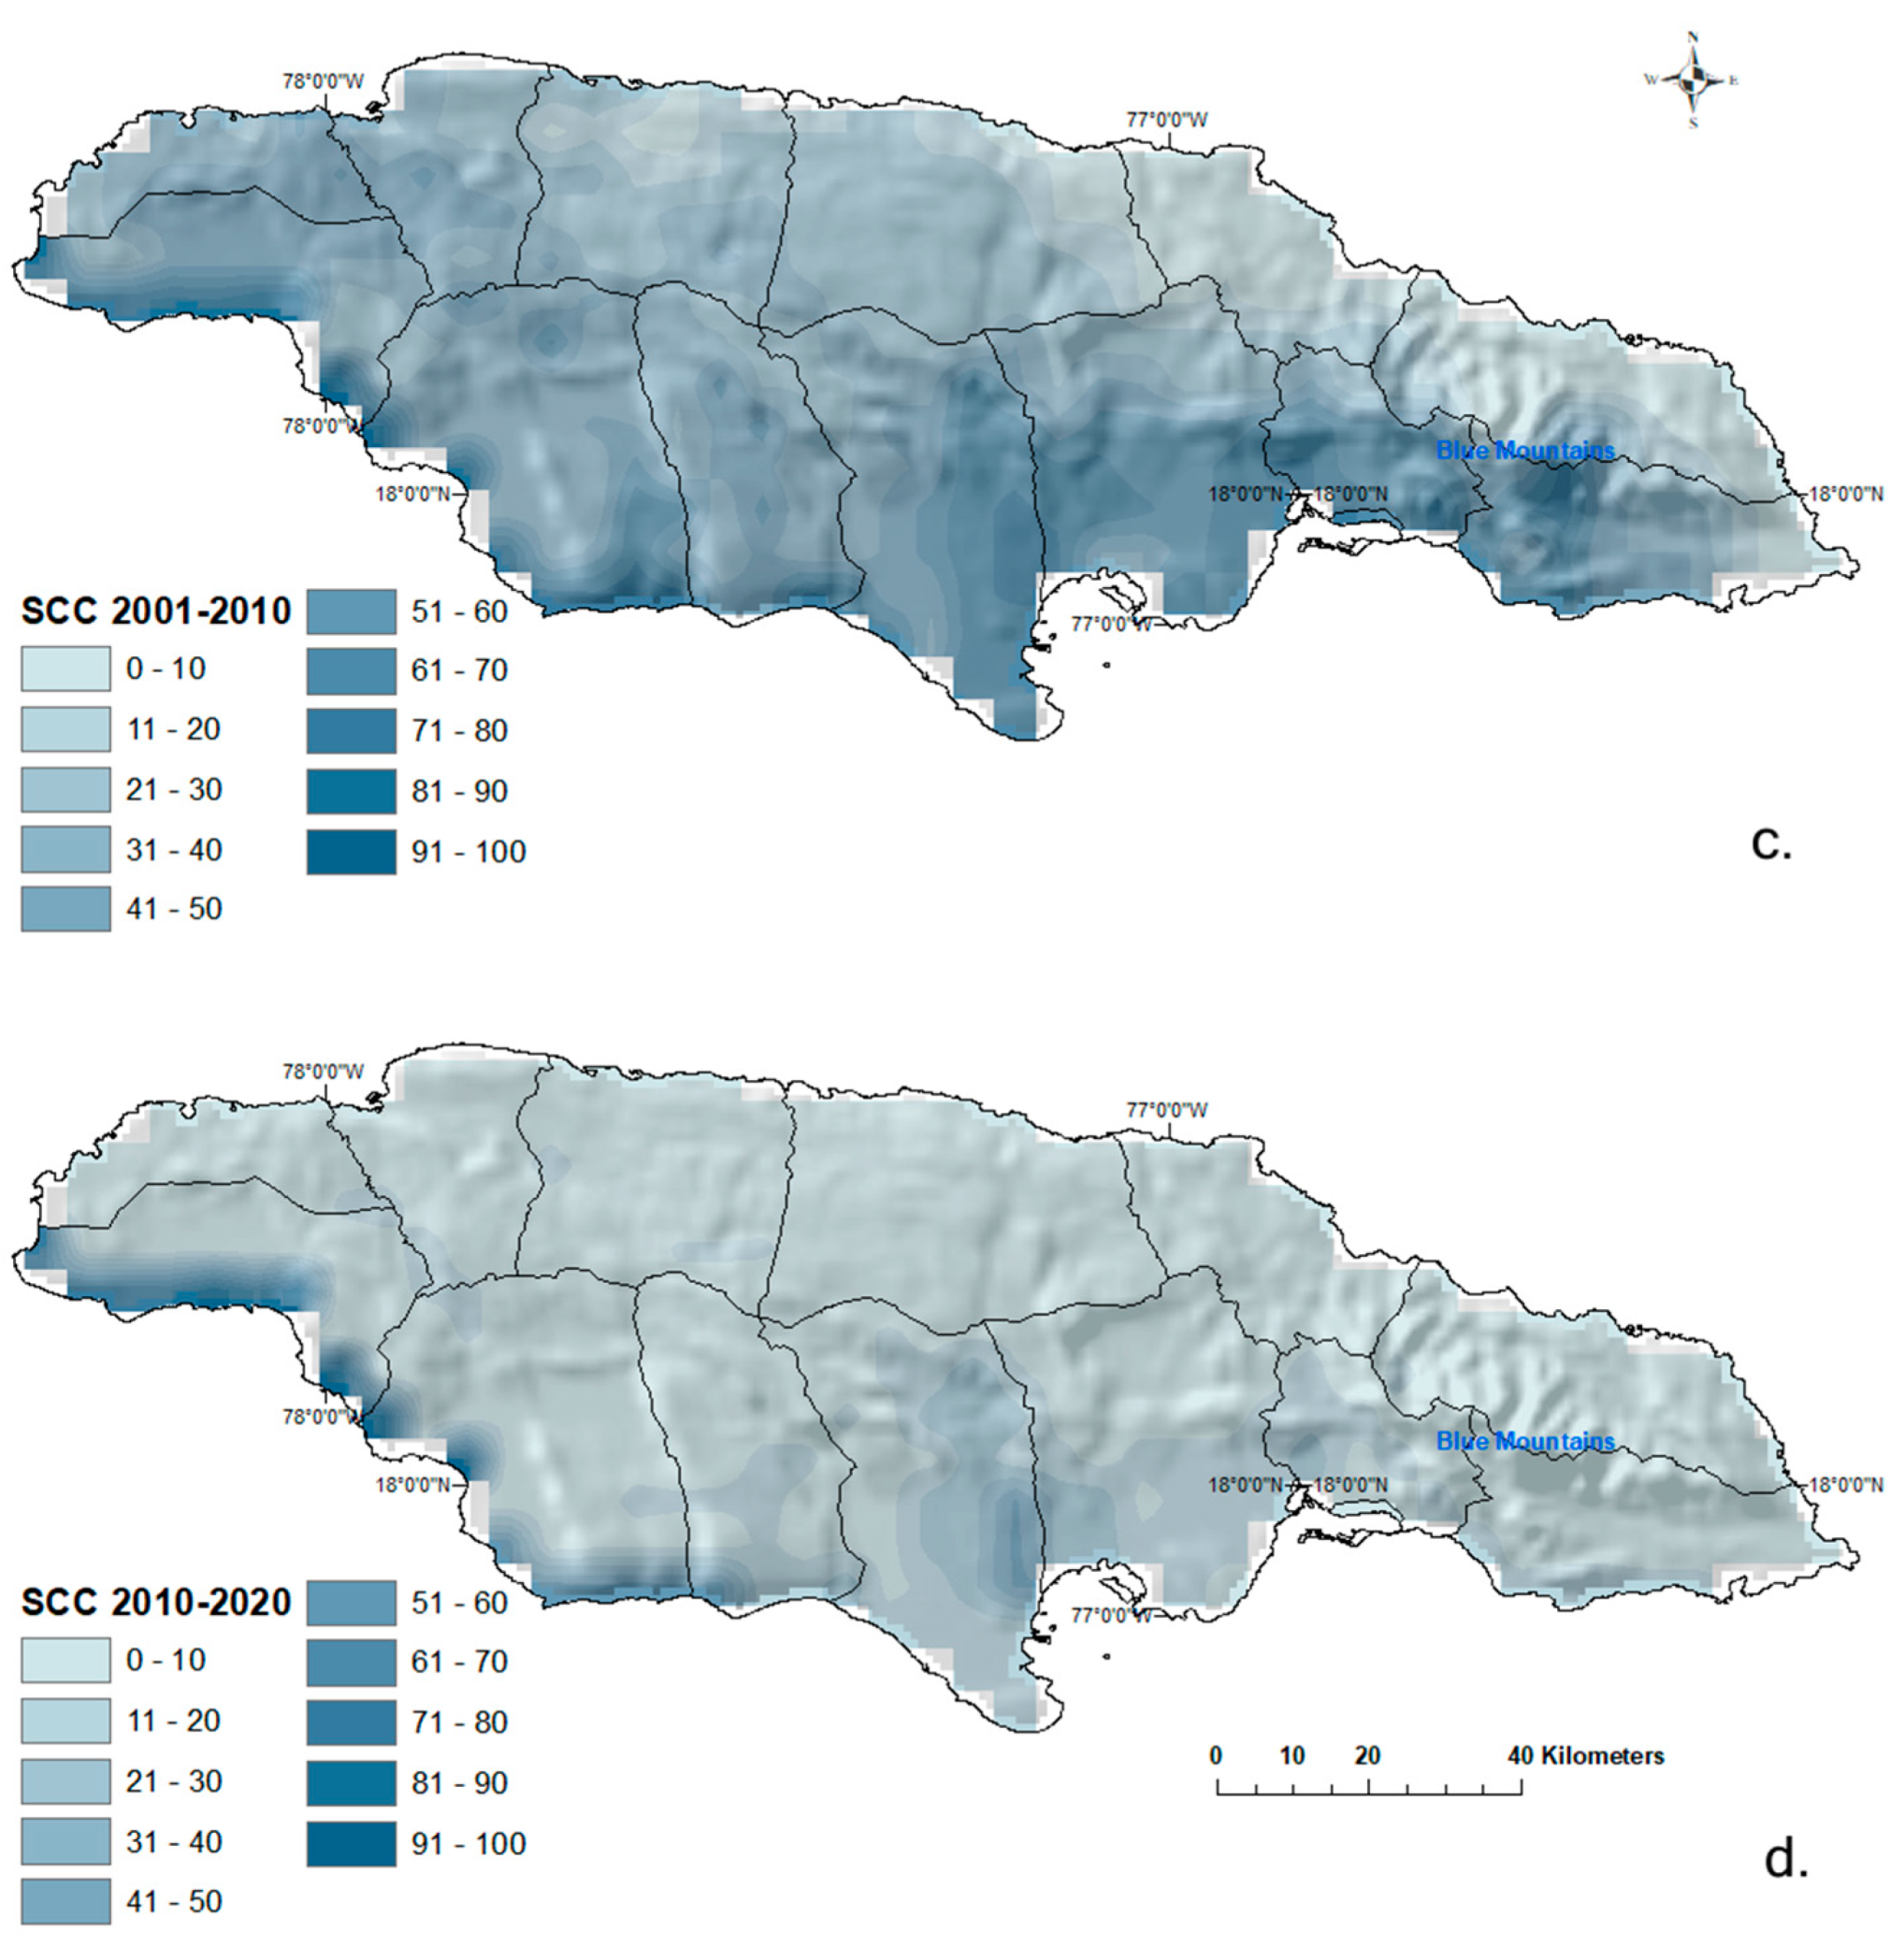
The SCC helps assess periodicity and correlation memory over time, providing insights into long-term persistence. Here, the number of significant lags starts at lag-1 and continues to the first insignificant lag, then disregards any significant lag after that. To determine significance, we consider any lag with an SCC greater than Anderson’s limits as significant. SCCmax varies across these decades, with values of 51, 58, 38, and 62, respectively. Figure 8a,b shows the normalized SCC spatial distribution of the maximum number of significant lags of the coefficient for the four decades G1, G2, G3, and G4. In the first decade (G1), high precipitation memory is observed in small areas located in the southwest and central-south regions. This is indicated by the long number of lags in the persistence of zero consecutive daily precipitation. Then, in G2, this zero-precipitation persistence is present over most of the southern area expanding toward the center of the island. This behavior is heightened in G3 but with a different spatial distribution, having the highest values in the south and gradually decreasing towards the north, covering a very large area. The spatial variation in G4 is similar to that of G1 and G2.
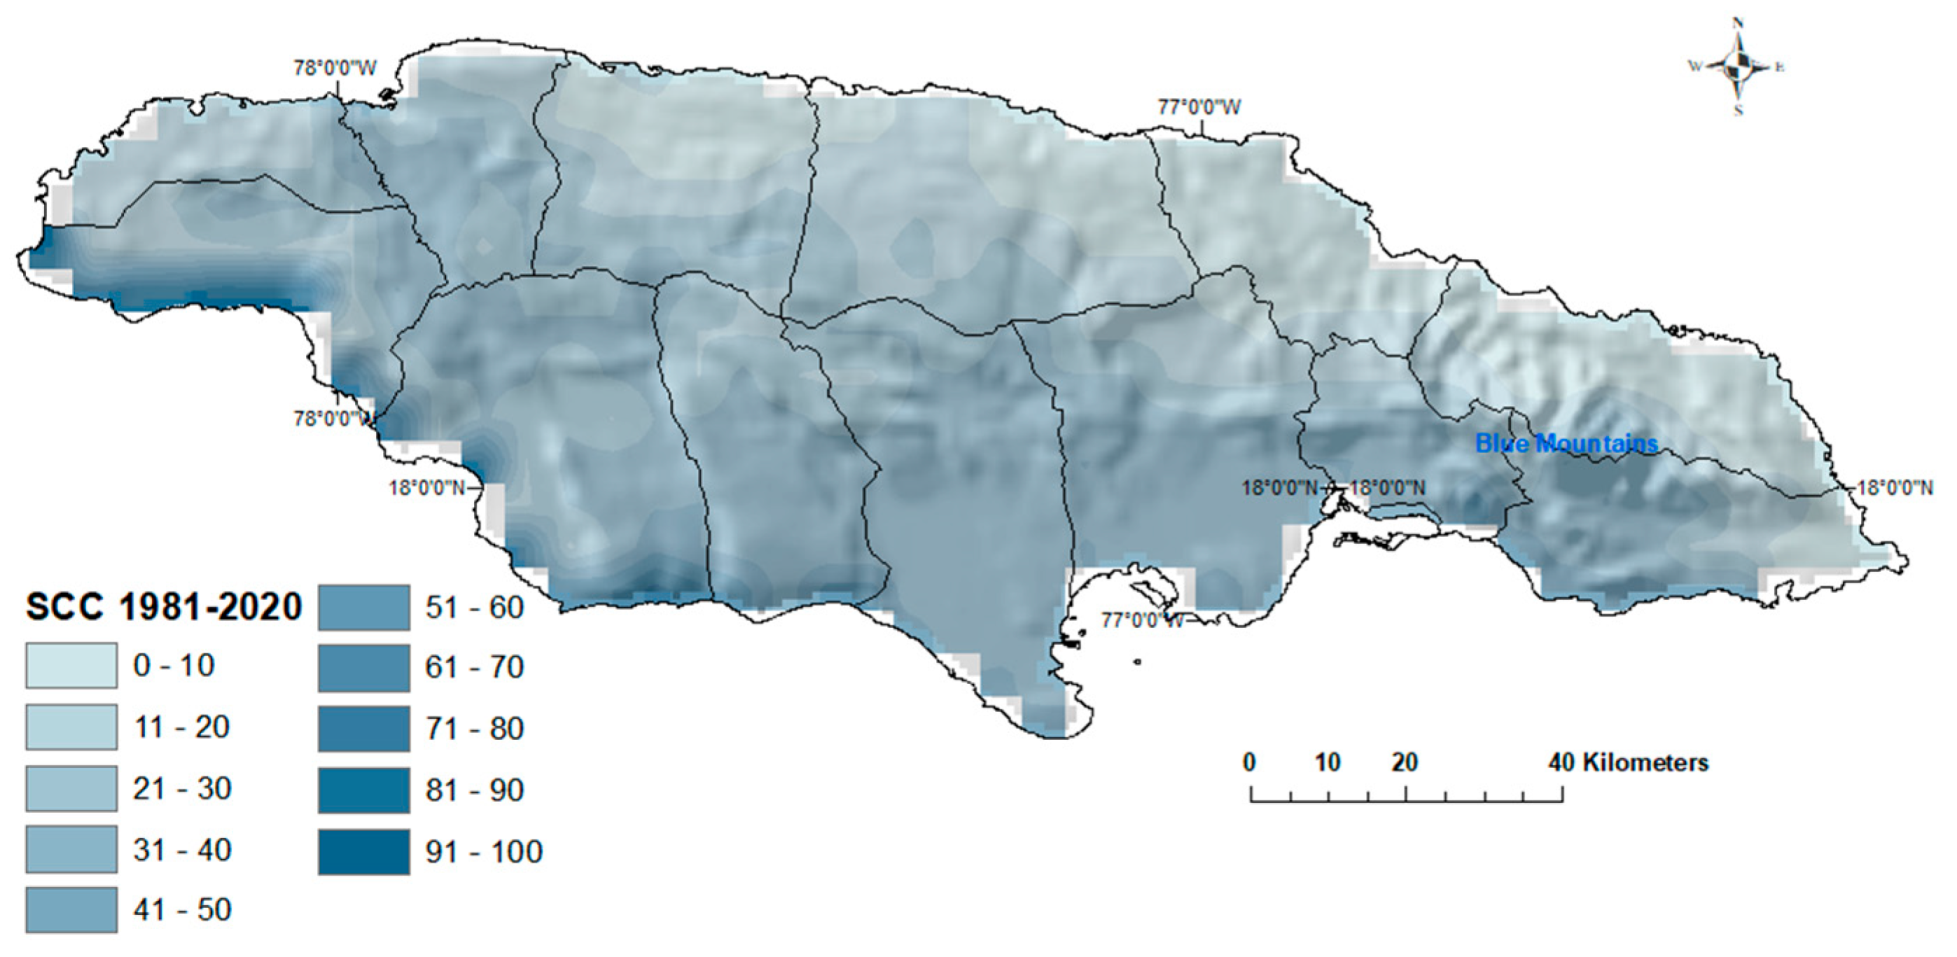
Figure 9 displays the maximum number of significant lags of the serial correlation coefficient for the entire four-decade period. A maximum value of 77 is observed in a small area in the southwest, gradually decreasing towards the north of the island. This indicates that the variation in the number of consecutive dry days (non-rainfall days) is highest in the southwest region and gradually decreases towards the northern area of the country.

4.3. Rainfall Persistence Thresholds

As described in the methodology section, the low and high rainfall thresholds presented here are chosen based on their frequency in the data. Values below 50 mm are considered low thresholds, with 1, 5, 10, 20, and 50 mm representing the rainfall amount and 30, 20, 15, 10, and 5 the consecutive days. Similarly, values above 50 mm are considered high and are represented by 50, 60, 80, 100, and 120 mm because the frequency of these values is most prominent in the data. The number of consecutive days is also selected based on the frequency of occurrence. For instance, a greater than 100 mm rainfall event only occurs as a one-day event in data; a 60 mm and 80 mm event in two straight days; and the 50 mm event in the lapse of three successive days. Table 4 provides details of the daily precipitation thresholds and the number of consecutive days used for the analysis. As described in the Methods section, the decadal spatial frequency of occurrence for each event is calculated using a MATLAB code and normalized for comparison between decades using maps in ArcGIS 10.7. Three low and high threshold maps are presented for illustration purposes in the Results and Appendix A sections.

4.3.1. Persistence Threshold High (PTH)

PTH1 3-Days ≥ 50 mm

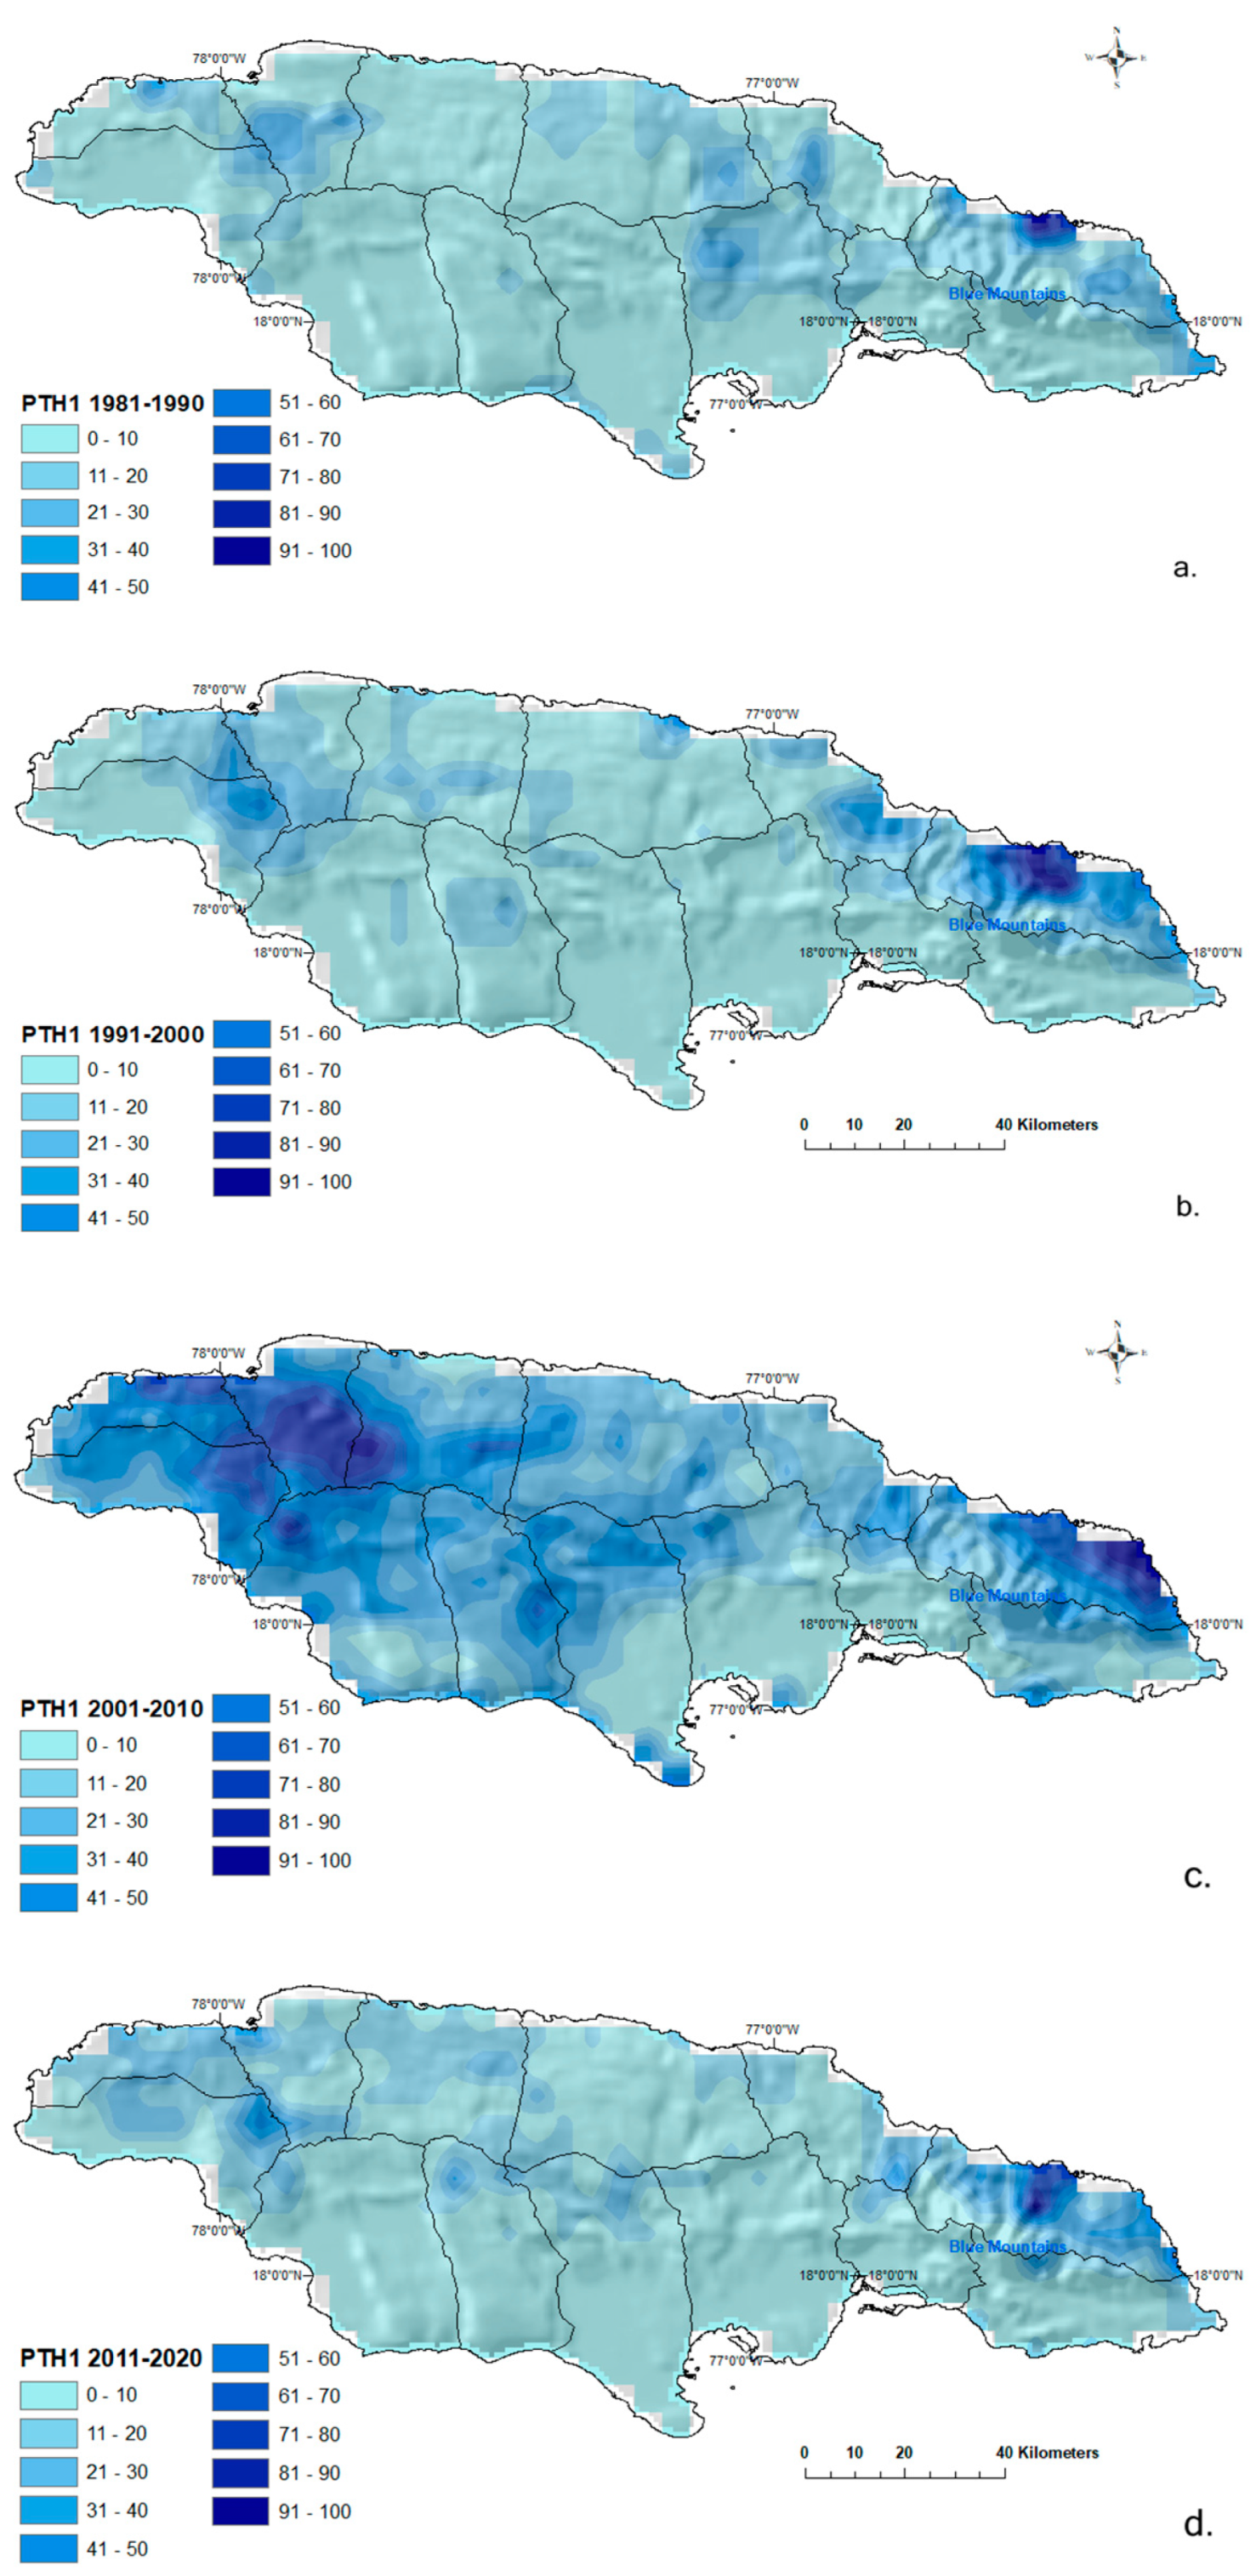
The number of occurrences of the event of 3 consecutive days of persistent rainfall greater than or equal to 50 mm over the four decades G1, G2, G3, and G4 varies for each decade with maximum values of 5, 7, 9, and 14, indicating a general increase in the persistence of this event. Figure 10a,b shows the normalized spatial variability of these events. In the first decade (G1), the occurrence range is low over most of Jamaica, moderate over the north and mid-to-east regions, and high in the mountainous areas in the northeastern region. The spatial distribution in G2 is similar to that of G1 but with increased occurrence over the northeastern mountain area. The occurrence distribution for G3 exhibits sizable changes in areas and the number of occurrences, with no dominant value covering most of Jamaica but with a noticeable shift toward the western area of the island. The spatial variation for G4 is similar to G1 and G2, with one or two occurrences (low persistence) values dominating large areas. The northeast region experiences the most significant increase in persistence over decades.

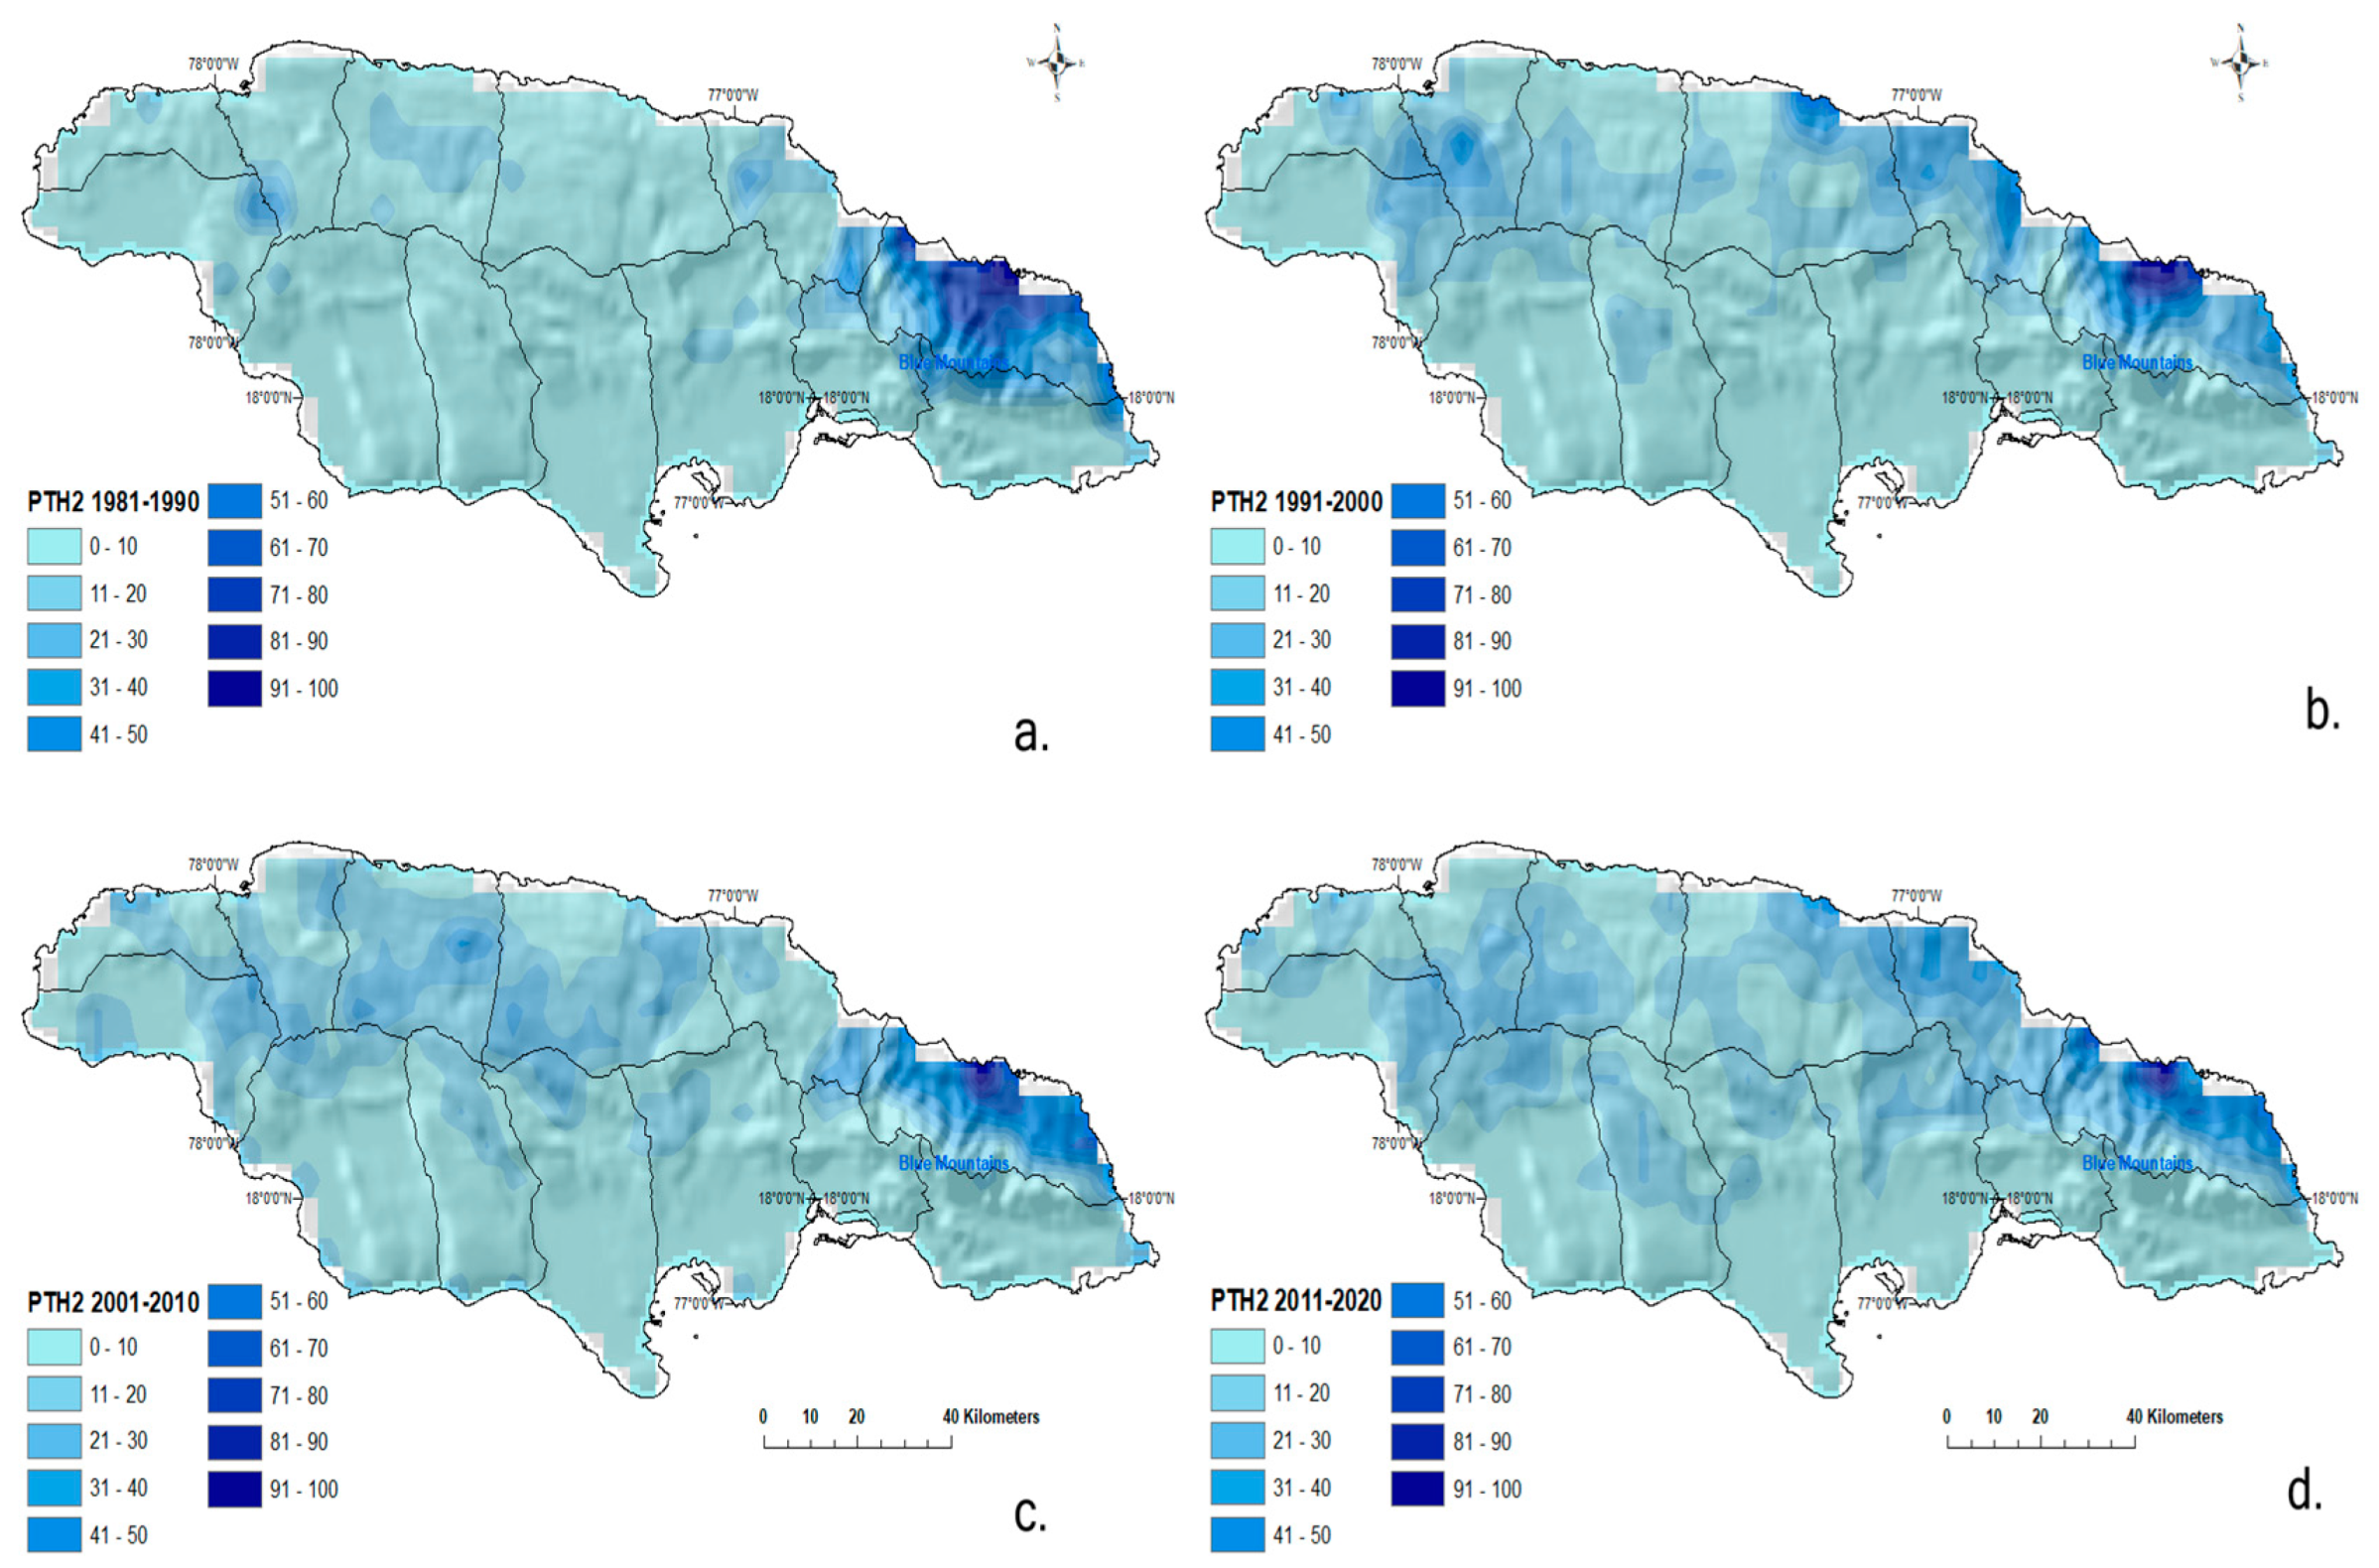
PTH2 2-Days ≥ 80 mm

Appendix A, Figure A1 shows the normalized spatial variation of the number of occurrences of the event of 2 consecutive days of persistent rainfall equal to or greater than 80 mm in Jamaica for the four decades G1, G2, G3, and G4. Each decade exhibits a different number of occurrences with maximum values of 5, 9, 14, and 14 respectively, indicating a general increase in the persistence of this event. There is a low degree of occurrence of this event over most of Jamaica and a moderate number over the mountainous area in the first decade (G1). There is a slight spatial variation in G2 with an extension of occurrence over most of the northern region of Jamaica and an increase over the northeastern mountain area. For the G3, the spatial distribution changes further with occurrences covering most of the north and mid (east-west) areas. Last, the spatial variation of persistence in G4 is similar to that of G2 covering a wider area over the northern regions of Jamaica. The northeastern mountain area shows the most significant increase in persistence over the decades.

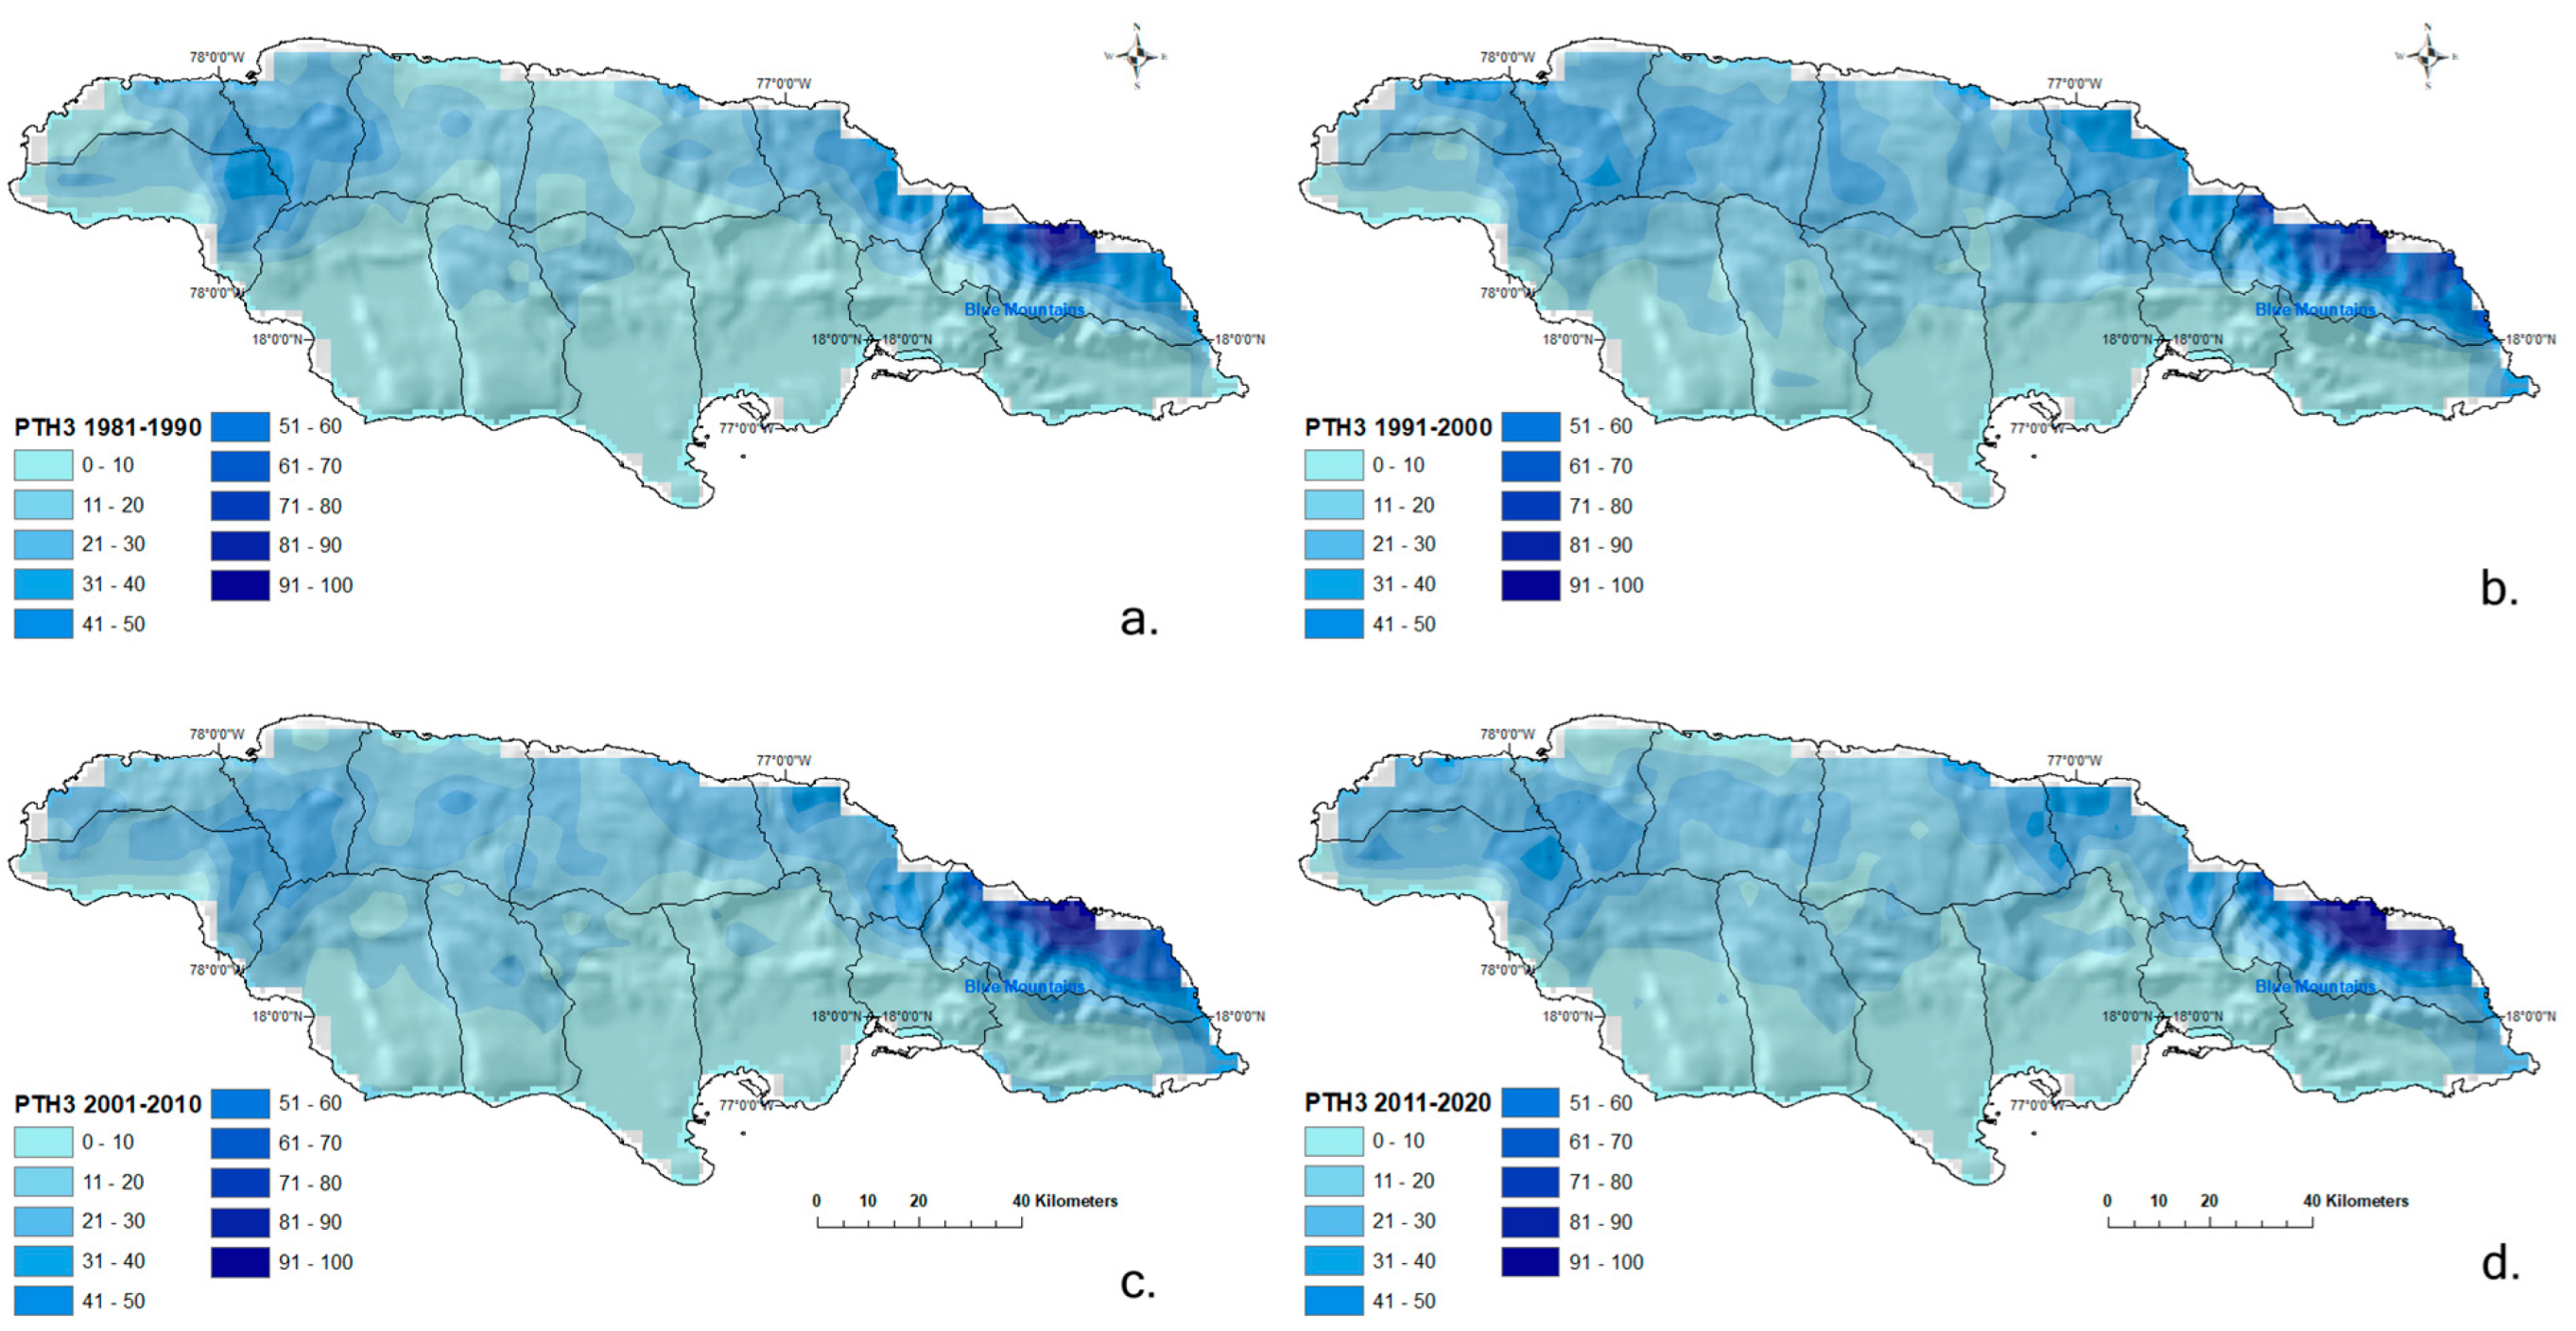
PTH3 1-Day ≥ 120 mm

Appendix A, Figure A2 shows the normalized spatial variation of the number of occurrences of the event of 1 day of persistent rainfall equal to or greater than 120 mm. Although 1-day is not a measure of continued persistence, this threshold is significant as it has the potential to cause flooding in some areas. The maximum number of occurrences of this event is almost constant for G1, G2, and G4 with 25, 25, and 27 occurrences respectively. Nevertheless, there was a significant increase in the number of occurrences of this event during G3. Like the previous PT events (and all data), this observation indicates that G3 exhibited different spatial behavior than the other three decades.
Overall, PTH1 is most frequent in the northern areas of the country, with low frequency over the southern area. PTH2 is less frequent in most of the country, except for the northeastern areas. PTH3, the flood event, is also most common in the north and with increasing occurrence on the northeastern side of the island.

4.3.2. Persistence Threshold Low

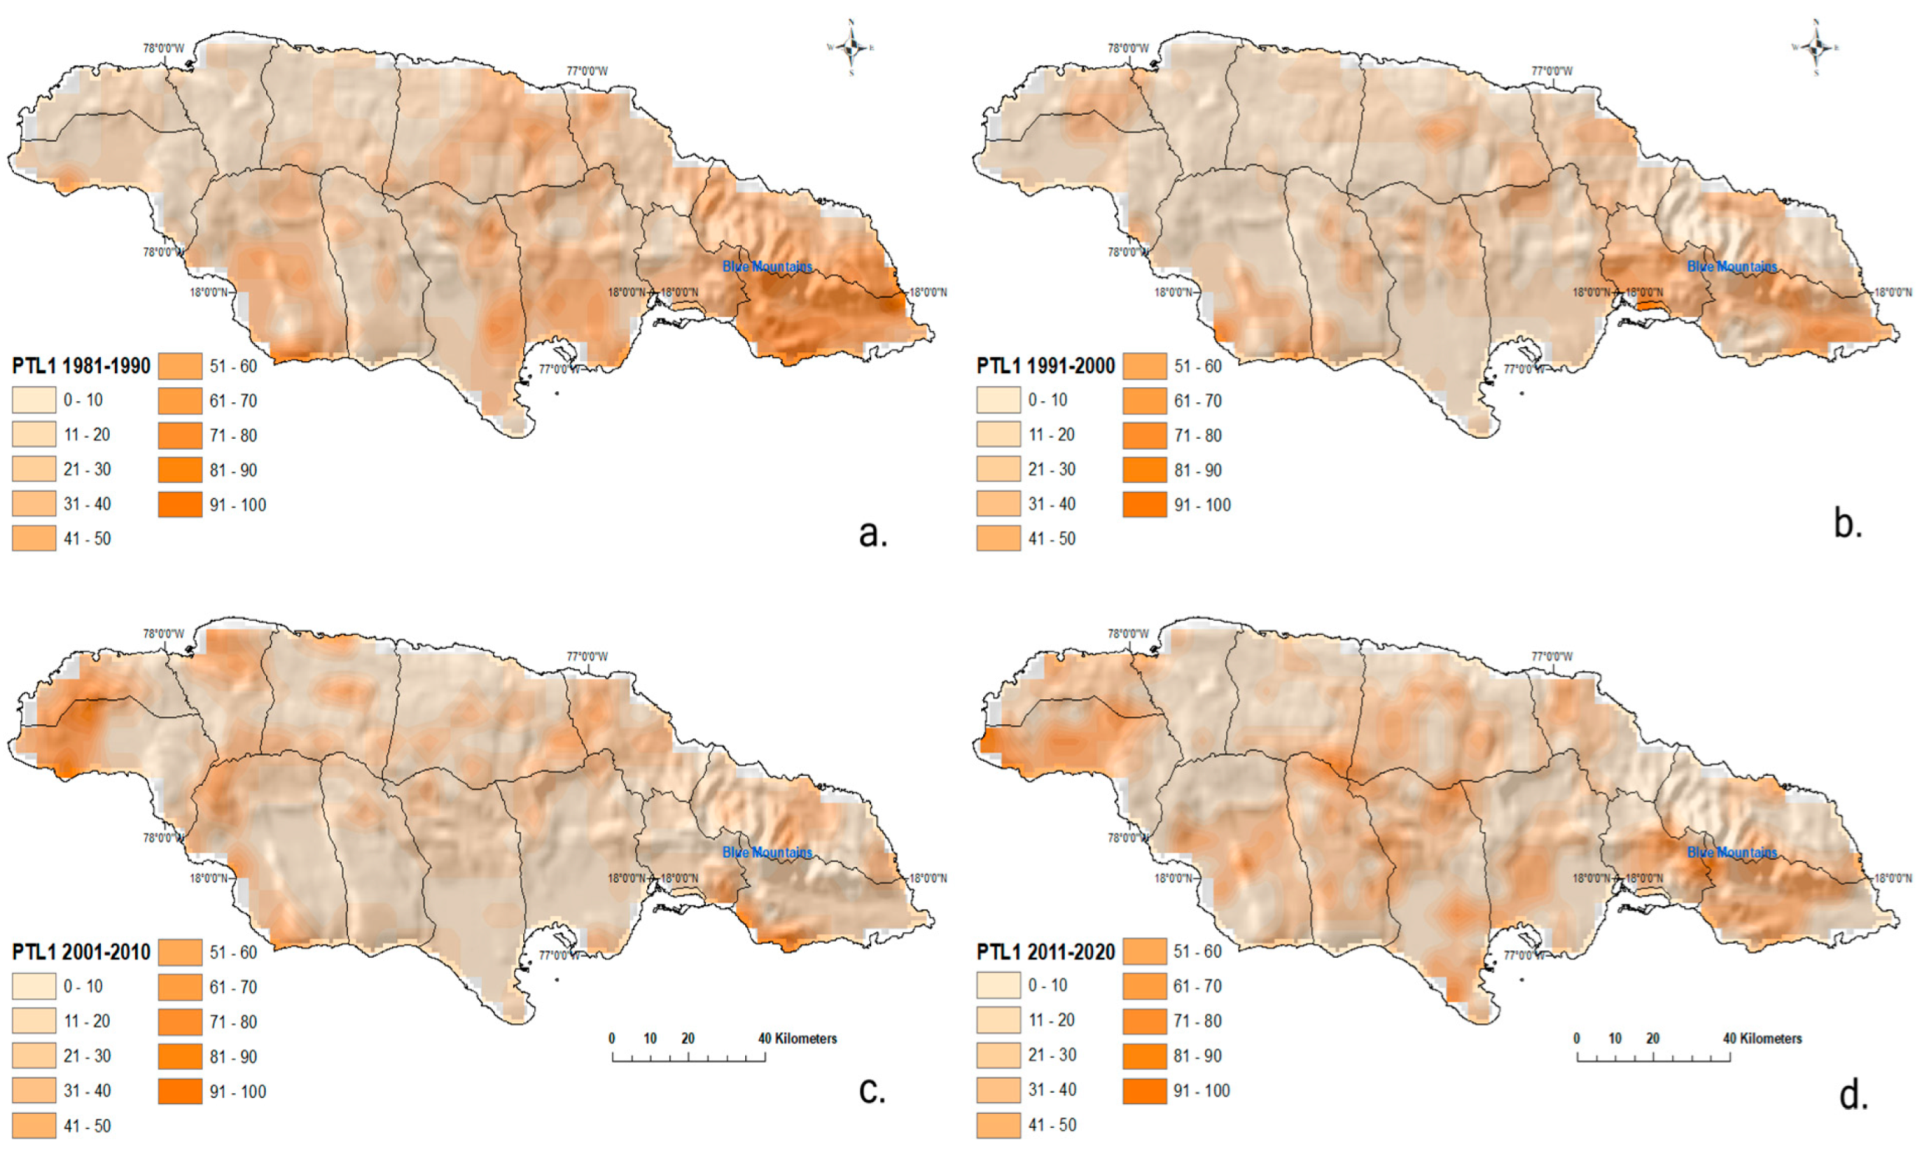
PTL 30-Days ≤ 1 mm

Figure A3 shows the spatial variation of the number of occurrences of the event of 30 days of persistent rainfall equal to or less than 1 mm for the four decades, the maximum number of event occurrences for G1, G2, G3, and G4 are 5, 11, 5, and 4 respectively, with no clear spatiotemporal trend except for the significant increase in G2. The occurrence of this event was predominantly low for the first decade in the western half of the island, with a gradual increase toward the east and the southeast. In contrast, the G2 shows an increase in the number of occurrences of this event over the entire country. G3 shows a decrease in occurrences (more rain), similar to G4, except for an increase in the western side.

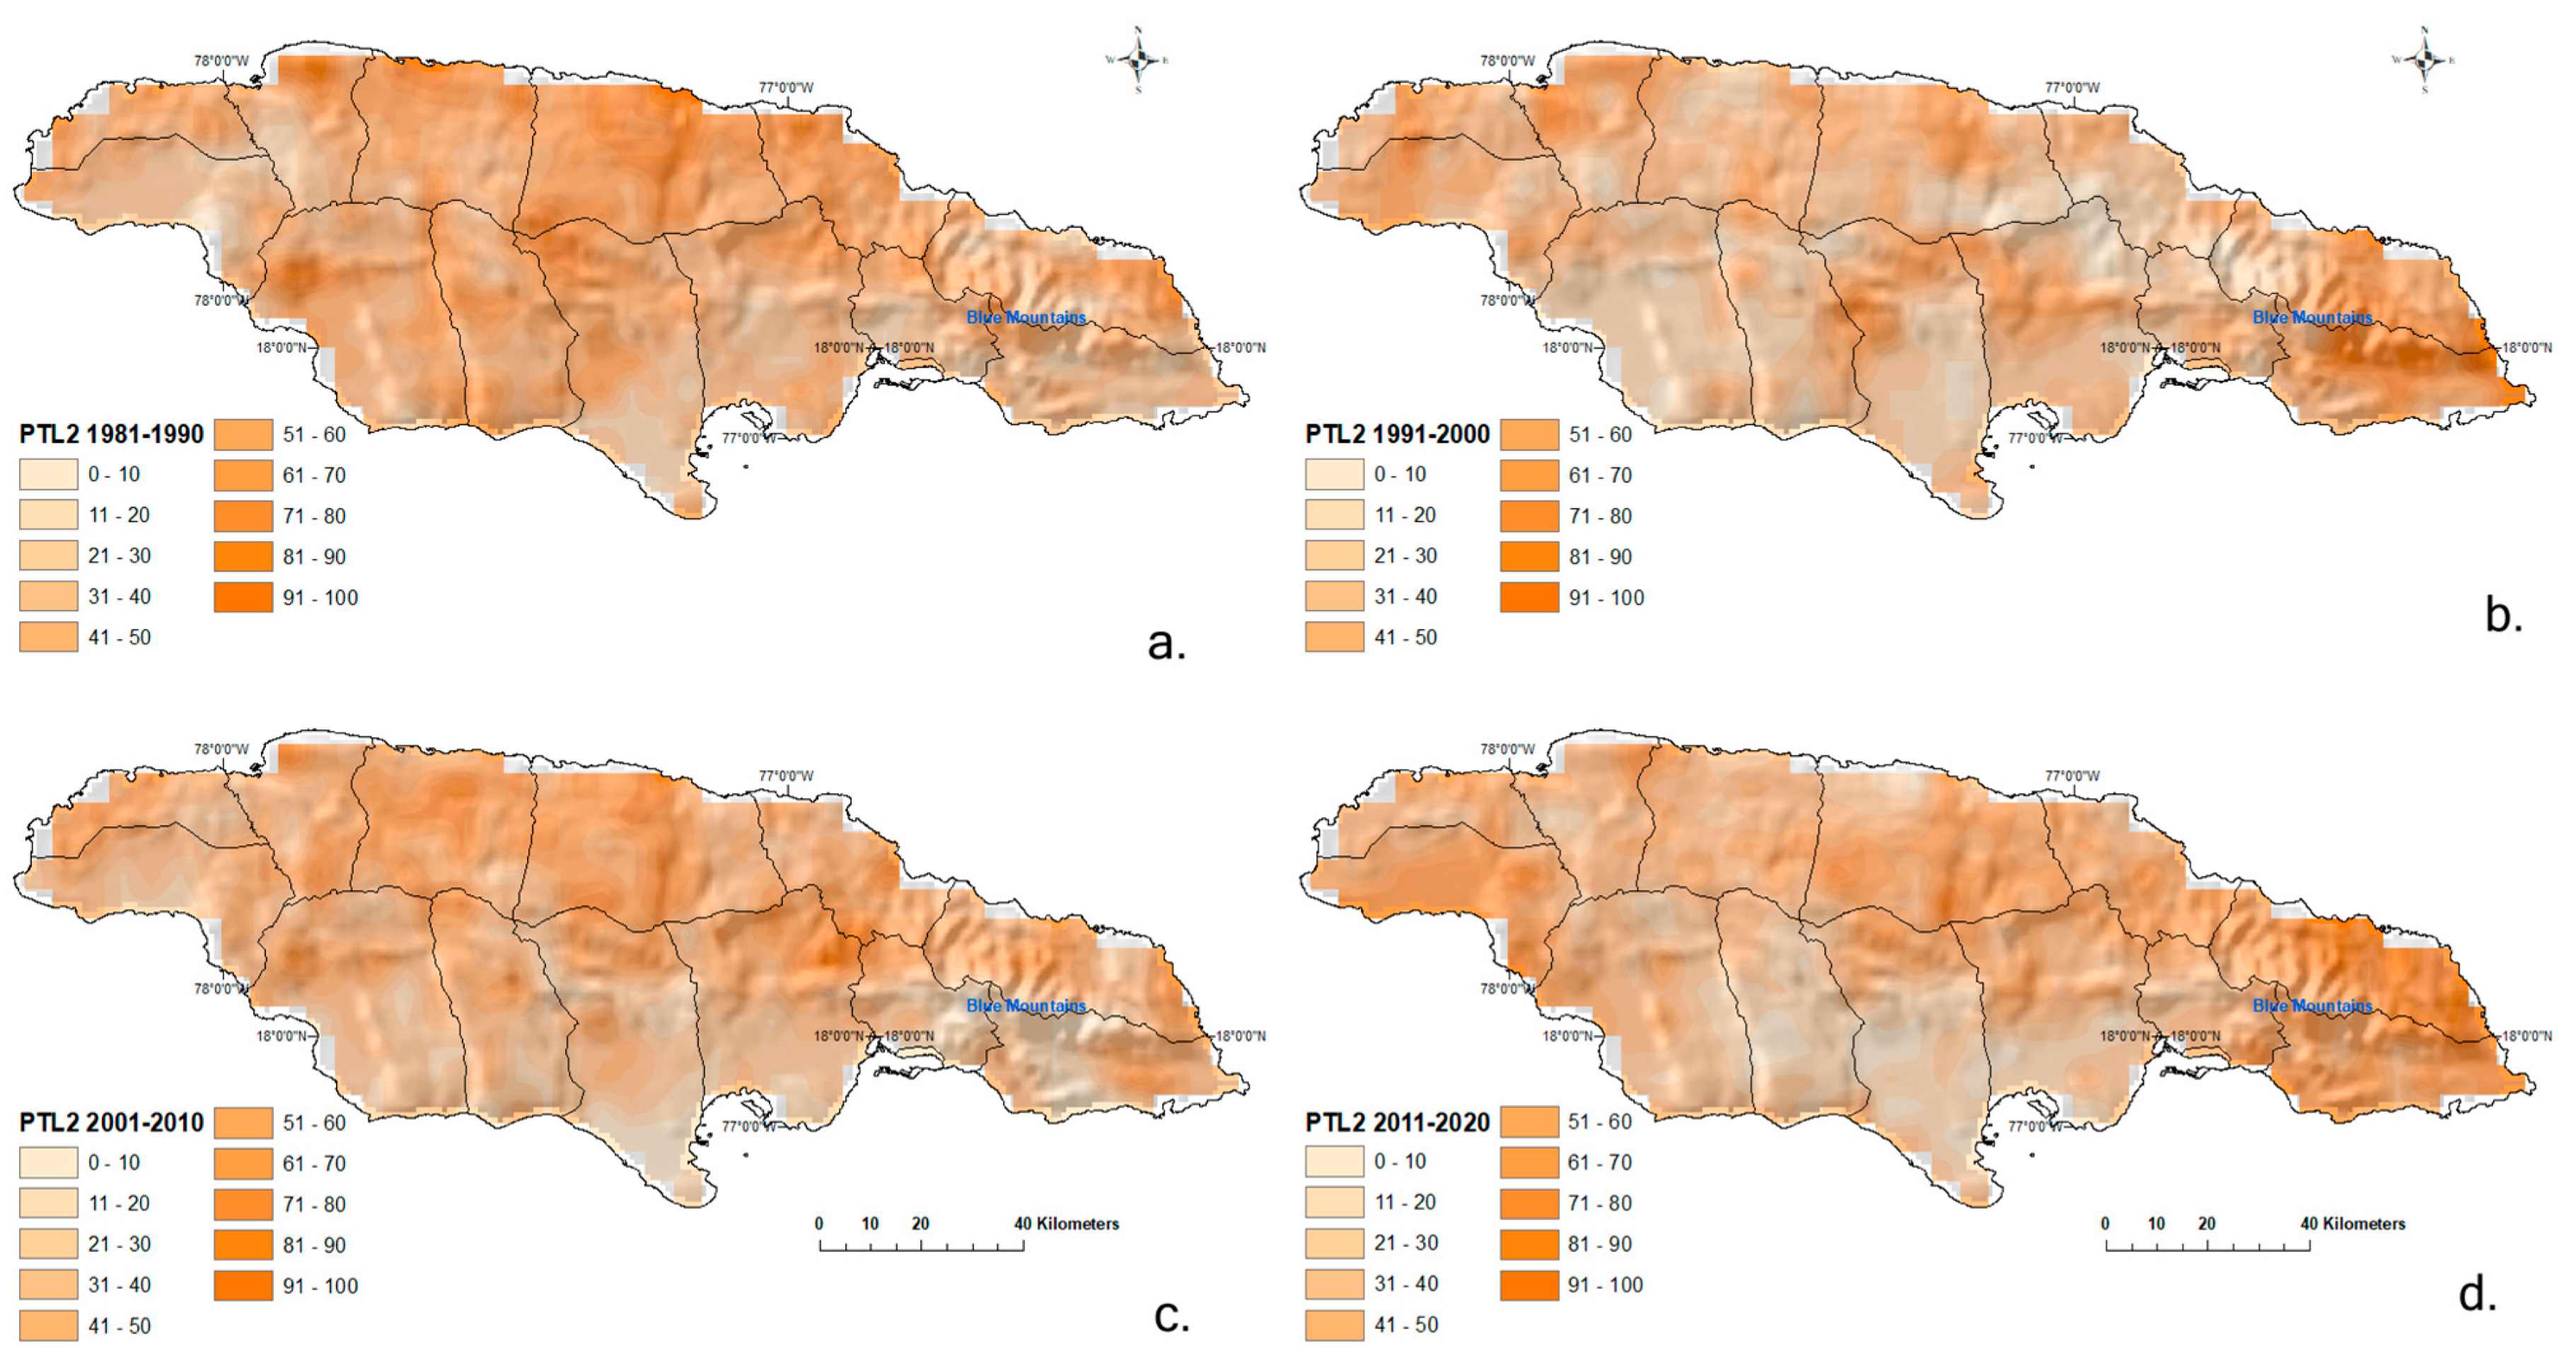
PTL 10-Days ≤ 15 mm

Figure A4 shows the maximum number of event occurrences for each decade are 11, 10, 11, and 13, respectively, indicating no clear trend in the persistence of this event. During the first decade, this event is concentrated over the northern part of the island. In contrast, in decade G2, most occurrences are found in the eastern area. During G3, the spatial variation of occurrences is similar to that of G1, while for decade G4, most occurrences are similar to G2.

PTL 5-Days ≤ 50 mm

Figure A5 shows the spatial distribution of the number of occurrences of the event of 5 consecutive days of rainfall that is less than or equal to 50 mm over Jamaica for the four decades. The maximum number of occurrences of this event is 6, 7, 7, and 3, respectively. There is no noticeable trend in the variation of this event, except for a decrease in its occurrence in the fourth decade. The northeastern part of Jamaica shows the highest occurrence of this event during G1. This is similar in G2 but with a more eastern distribution. Most of the country areas, except for these areas of higher occurrence, show low occurrences for G1, G2, and G4. However, G3 exhibits a different pattern, with a larger spatial distribution.
Overall, PTL1 is most frequent in the southeast and some areas in the west of the country. PTL2 is highly frequent over the northern half of the country. PTL3 is low frequency over most parts of the country, except for the northeastern region.

5. Discussion and Conclusions

There are various techniques and metrics to assess the persistence of a time series, such as the Hurst exponent and serial correlation coefficient. Although these methods are helpful for prediction modeling, they may not be entirely suitable for a range of applications, such as flood management, planning, and analysis of wet and dry periods.
In this document, we overview such measures for the long-term rainfall variability over Jamaica and introduce a novel methodology for identifying short-term persistence. The Persistence Threshold (PT) considers both high precipitation persistence, referring to the number of consecutive days with precipitation greater than or equal to a threshold, and low precipitation persistence, referring to the number of consecutive days with rainfall less than or equal to a threshold. Understanding these variations can provide valuable insights for decision-makers, helping them to prepare for potential impacts on agriculture, water management, and other critical sectors. To further explore rainfall variability in Jamaica, we also present an overall spatial analysis of the long-term persistence measures (H, SCC), and the newly developed short-term PT method.
Results demonstrate notable temporal and spatial variations in persistence dimensions over the study period. The long-term measures, H and SCC, indicate an overall increasing trend in high precipitation persistence and a decreasing trend in low precipitation persistence. While the newly developed short-term PT agrees with these measures, it reveals meaningful frequency variations at the regional level. For instance, three days of consecutive rain that amounts to 50 mm or more are frequent in the northeastern region. Conversely, southeastern areas could exhibit less than 1 mm of rainfall for 30 days. Furthermore, PTH1 and PTH2 demonstrate increasing maximum rainfall over the decades, and the one-day flood event, PTH3, became heightened during the third decade. Furthermore, this rainfall anomaly during the 2001–2010 decade is observed with all measures in this study (H, SCC, and PT). These findings coincide with the warmest period on record that introduced various global climate extremes. Further analysis is required to establish the exact causes of this observed trend and the implications for future rainfall patterns over Jamaica.
Geographically, the northern mountainous area of the country receives the most persistent rainfall over the study period. This can be attributed to orographic lift due to the location of the Blue Mountains and the path of the moisture-rich winds from the Caribbean Sea. However, there is an observed increase in extreme rainfall events in this area, where flood events such as PTH3 also become more prominent. This could have potential implications for cascading events such as floods and landslides. Similarly, the driest occurrences are most frequent in the southeast and some regions in the west of the country. This is particularly important because Kingston, the capital and largest city of Jamaica, Spanish Town, Portmore, and Mandeville, the second, third, and fifth largest cities respectively, are located in the southeastern-central regions of the island.
Being the second of a series of studies on the application of EO in SIDS countries, this work helps demonstrate that CHIRPS is a viable satellite precipitation product for the understanding and modeling of spatial-temporal rainfall variations in Jamaica. CHIRPS information has been available daily for the past four decades providing a significant temporal advantage over in-situ precipitation measurements that can be unreliable and are often limited in their availability. Moreover, while CHIRPS spatial resolution is 0.05°, this study demonstrates that it is reliable and useful to understand and model rainfall parameters at the regional level within SIDS like Jamaica. These findings have important implications for the use of satellite-derived precipitation data in SIDS countries. Given the unique challenges that they face, including limited resources and vulnerability to natural disasters, implementing satellite data can provide valuable insights into environmental processes and help inform decision-making strategies related to disaster risk reduction, water resource management, and agricultural planning.
It is important to highlight that while the PT method presented here is a useful tool for satellite based short-term rainfall trends, (1) it is entirely data-driven and (2), it is just one step toward determining flood or drought risk. Other parameters such as evapotranspiration, infiltration, runoff, soil moisture, and groundwater storage must also be considered to develop a comprehensive index for both. These indices can prove very useful in SIDS countries. Developing such indices will be the next step in this series of documents dedicated to the Island of Jamaica.

Author Contributions

Conceptualization, R.A.S. and C.A.C.; methodology, R.A.S.; software, R.A.S. and C.A.C.; validation, R.A.S.; formal analysis, R.A.S. and C.A.C.; investigation, C.A.C. and R.A.S.; resources, C.A.C.; data curation, C.A.C. and R.A.S.; writing—original draft preparation, C.A.C.; writing—review and editing, C.A.C. and R.A.S.; visualization, C.A.C.; project administration, C.A.C.; funding acquisition, C.A.C. All authors have read and agreed to the published version of the manuscript.

Funding

This research received no external funding.

Data Availability Statement

CHIRPS DATA can be found at: https://www.chc.ucsb.edu/data; for PTH information please contact authors.

Acknowledgments

The authors thank the academic reviewers and journal editors.

Conflicts of Interest

The authors declare no conflict of interest.

Appendix A

Figure A1. Normalized Persistence Threshold for high threshold event 2 (2-days with 80 mm of continued rainfall). (a) PTH2 (1981–1990); (b) PTH2 (1991–2000); (c) PTH2 (2001–2010); (d) PTH2 (2011–2020).
Geographies 03 00020 g0a1
Figure A2. Normalized Persistence Threshold for high threshold event 3 (1-day with 120 mm of continued rainfall). (a) PTH3 (1981–1990); (b) PTH3 (1991–2000); (c) PTH3 (2001–2010); (d) PTH3 (2011–2020).
Geographies 03 00020 g0a2
Figure A3. Normalized Persistence Threshold for low threshold event 1 (30-days with less than 1 mm of continued rainfall). (a). PTL1 (1981–1990); (b) PTL1 (1991–2000); (c) PTL1 (2001–2010); (d) PTL1 (2011–2020).
Geographies 03 00020 g0a3
Figure A4. Normalized Persistence Threshold for low threshold event 2 (10-days with less than 15 mm of continued rainfall). (a) PTL2 (1981–1990); (b) PTL2 (1991–2000); (c) PTL2 (2001–2010); (d) PTL2 (2011–2020).
Geographies 03 00020 g0a4
Figure A5. Normalized Persistence Threshold for low threshold event 3 (5-days with less than 50 mm of continued rainfall). (a) PTL3 (1981–1990); (b) PTL3 (1991–2000); (c) PTL3 (2001–2010); (d) PTL3 (2011–2020).
Geographies 03 00020 g0a5

References

  1. Biesbroek, R.; Bowen, K.; Lawrence, J. IPCC 2022 Summary Report; Jean: New York, NY, USA, 2022. [Google Scholar]
  2. Avalon-Cullen, C.; Caudill, C.; Newlands, N.K.; Enenkel, M. Big Data, Small Island: Earth Observations for Improving Flood and Landslide Risk Assessment in Jamaica. Geosciences 2023, 13, 64. [Google Scholar] [CrossRef]
  3. Bhalai, S. Landslide Susceptibility of Portland, Jamaica: Assessment and Zonation. Caribb. J. Earth Sci. 2010, 41, 14. [Google Scholar]
  4. Government of Jamaica. Climate Change Policy Framework for Jamaica Government of Jamaica. September 2015. Available online: https://www.lse.ac.uk/GranthamInstitute/wp-content/uploads/2016/05/Jamaica-Climate-Change-Policy-fwL-2015.pdf (accessed on 15 February 2022).
  5. Collalti, D.; Strobl, E. Economic damages due to extreme precipitation during tropical storms: Evidence from Jamaica. Nat. Hazards 2022, 110, 2059–2086. [Google Scholar] [CrossRef]
  6. Mandal, A.; Stephenson, T.; Campbell, J.; Taylor, M.; Watson, S.; Clarke, L.; Smith, D.; Darsan, J.; Wilson, M. An assessment of the impact of 1.5 versus 2 and 2.5 °C global temperature increase on flooding in Jamaica: A case study from the Hope watershed. Philos. Trans. R. Soc. A Math. Phys. Eng. Sci. 2022, 380, 141. [Google Scholar] [CrossRef]
  7. Chandrasekaran, S.; Poomalai, S.; Saminathan, B.; Suthanthiravel, S.; Sundaram, K.; Hakkim, F.F.A.; Sivapragasam, C.; Saravanan, P.; Balamurali, S.; Sumila, S.; et al. An investigation on the relationship between the Hurst exponent and the predictability of a rainfall time series. Meteorol. Appl. 2019, 26, 511–519. [Google Scholar] [CrossRef]
  8. Patakamuri, S.K.; Muthiah, K.; Sridhar, V. Long-Term Homogeneity, Trend, and Change-Point Analysis of Rainfall in the Arid District of Ananthapuramu, Andhra Pradesh State, India. Water 2020, 12, 211. [Google Scholar] [CrossRef]
  9. Moon, H.; Gudmundsson, L.; Guillod, B.P.; Venugopal, V.; Seneviratne, S.I. Intercomparison of daily precipitation persistence in multiple global observations and climate models. Environ. Res. Lett. 2019, 14, 105009. [Google Scholar] [CrossRef]
  10. Du, H.; Donat, M.G.; Zong, S.; Alexander, L.V.; Manzanas, R.; Kruger, A.; Choi, G.; Salinger, J.; He, H.S.; Li, M.-H.; et al. Extreme Precipitation on Consecutive Days Occurs More Often in a Warming Climate. Bull. Am. Meteorol. Soc. 2022, 103, E1130–E1145. [Google Scholar] [CrossRef]
  11. Matalas, N.C.; Sankarasubramanian, A. Effect of persistence on trend detection via regression. Water Resour. Res. 2003, 39. [Google Scholar] [CrossRef]
  12. Vogel, R.M.; Tsai, Y.; Limbrunner, J.F. The regional persistence and variability of annual streamflow in the United States. Water Resour. Res. 1998, 34, 3445–3459. [Google Scholar] [CrossRef]
  13. Hansen, P.R.; Lunde, A. Estimating the Persistence and the Autocorrelation Function of A Time Series That Is Measured with error. Econ. Theory 2013, 30, 60–93. [Google Scholar] [CrossRef]
  14. Ebisuzaki, W. A Method to Estimate the Statistical Significance of a Correlation When the Data Are Serially Correlated. J. Clim. 1997, 10, 2147–2153. [Google Scholar] [CrossRef]
  15. Khan, N.; Pour, S.H.; Shahid, S.; Ismail, T.; Ahmed, K.; Chung, E.; Nawaz, N.; Wang, X. Spatial distribution of secular trends in rainfall indices of Peninsular Malaysia in the presence of long-term persistence. Meteorol. Appl. 2019, 26, 655–670. [Google Scholar] [CrossRef]
  16. Pan, X.; Li, T.; Sun, Y.; Zhu, Z. Cause of Extreme Heavy and Persistent Rainfall over Yangtze River in Summer 2020. Adv. Atmospheric Sci. 2021, 38, 1994–2009. [Google Scholar] [CrossRef]
  17. Bharath, A.; Maddamsetty, R.; Manjunatha, M.; Reshma, T.V. Spatiotemporal Rainfall Variability and Trend Analysis of Shimsha River Basin, India. Environ. Sci. Pollut. Res. 2023, 1–20. [Google Scholar] [CrossRef]
  18. Ogunrinde, A.T.; Oguntunde, P.G.; Akinwumiju, A.S.; Fasinmirin, J.T. Analysis of recent changes in rainfall and drought indices in Nigeria, 1981–2015. Hydrol. Sci. J. 2019, 64, 1755–1768. [Google Scholar] [CrossRef]
  19. Iresh, A.D.S. Screening of Annual Rainfall Time-Series Data in Kala Oya Basin: Case Study in Sri Lanka. Eng. J. Inst. Eng. Sri Lanka 2020, 53, 69. [Google Scholar] [CrossRef]
  20. Pal, S.; Dutta, S.; Nasrin, T.; Chattopadhyay, S. Hurst exponent approach through rescaled range analysis to study the time series of summer monsoon rainfall over northeast India. Theor. Appl. Clim. 2020, 142, 581–587. [Google Scholar] [CrossRef]
  21. Valle, M.A.V.; García, G.M.; Cohen, I.S.; Oleschko, L.K.; Corral, J.A.R.; Korvin, G. Spatial Variability of the Hurst Exponent for the Daily Scale Rainfall Series in the State of Zacatecas, Mexico. J. Appl. Meteorol. Clim. 2013, 52, 2771–2780. [Google Scholar] [CrossRef]
  22. Yeşilırmak, E.; Atatanır, L. Spatiotemporal variability of precipitation concentration in western Turkey. Nat. Hazards 2015, 81, 687–704. [Google Scholar] [CrossRef]
  23. Xu, F.; Zhou, Y.; Zhao, L. Spatial and temporal variability in extreme precipitation in the Pearl River Basin, China from 1960 to 2018. Int. J. Clim. 2022, 42, 797–816. [Google Scholar] [CrossRef]
  24. Reiter, A.; Weidinger, R.; Mauser, W. Recent Climate Change at the Upper Danube—A temporal and spatial analysis of temperature and precipitation time series. Clim. Change 2011, 111, 665–696. [Google Scholar] [CrossRef]
  25. Casanueva, A.; Rodríguez-Puebla, C.; Frías, M.D.; González-Reviriego, N. Variability of extreme precipitation over Europe and its relationships with teleconnection patterns. Hydrol. Earth Syst. Sci. 2014, 18, 709–725. [Google Scholar] [CrossRef]
  26. Anderson, T.G.; Anchukaitis, K.J.; Pons, D.; Taylor, M. Multiscale trends and precipitation extremes in the Central American Midsummer Drought. Environ. Res. Lett. 2019, 14, 124016. [Google Scholar] [CrossRef]
  27. Nakaegawa, T.; Kitoh, A.; Murakami, H.; Kusunoki, S. Annual maximum 5-day rainfall total and maximum number of consecutive dry days over Central America and the Caribbean in the late twenty-first century projected by an atmospheric general circulation model with three different horizontal resolutions. Theor. Appl. Clim. 2014, 116, 155–168. [Google Scholar] [CrossRef]
  28. Bathelemy, R.; Brigode, P.; Boisson, D.; Tric, E. Rainfall in the Greater and Lesser Antilles: Performance of five gridded datasets on a daily timescale. J. Hydrol. Reg. Stud. 2022, 43, 101201. [Google Scholar] [CrossRef]
  29. Hsu, J.; Huang, W.-R.; Liu, P.-Y.; Li, X. Validation of CHIRPS Precipitation Estimates over Taiwan at Multiple Timescales. Remote Sens. 2021, 13, 254. [Google Scholar] [CrossRef]
  30. Belay, A.S.; Fenta, A.A.; Yenehun, A.; Nigate, F.; Tilahun, S.A.; Moges, M.M.; Dessie, M.; Adgo, E.; Nyssen, J.; Chen, M.; et al. Evaluation and Application of Multi-Source Satellite Rainfall Product CHIRPS to Assess Spatio-Temporal Rainfall Variability on Data-Sparse Western Margins of Ethiopian Highlands. Remote Sens. 2019, 11, 2688. [Google Scholar] [CrossRef]
  31. Stephenson, T.S.; Vincent, L.A.; Allen, T.L.; Van Meerbeeck, C.J.; McLean, N.; Peterson, T.C.; Taylor, M.A.; Aaron-Morrison, A.P.; Auguste, T.; Bernard, D.; et al. Changes in extreme temperature and precipitation in the Caribbean region, 1961–2010. Int. J. Climatol. 2014, 34, 2957–2971. [Google Scholar] [CrossRef]
  32. Population Reference Bureau. 2022 World Population Datasheet. September 2022. Available online: https://2022-wpds.prb.org/download-files/ (accessed on 20 September 2022).
  33. Funk, C.; Peterson, P.; Landsfeld, M.; Pedreros, D.; Verdin, J.; Shukla, S.; Husak, G.; Rowland, J.; Harrison, L.; Hoell, A.; et al. The climate hazards infrared precipitation with stations—A new environmental record for monitoring extremes. Sci. Data 2015, 2, 150066. [Google Scholar] [CrossRef]
  34. Cullen, C.A.; Al Suhili, R.; Aristizabal, E. A Landslide Numerical Factor Derived from CHIRPS for Shallow Rainfall Triggered Landslides in Colombia. Remote Sens. 2022, 14, 2239. [Google Scholar] [CrossRef]
  35. Lewinson. Introduction to the Hurst Exponent—With Code in Python. 2021. Available online: https://towardsdatascience.com/introduction-to-the-hurst-exponent-with-code-in-python-4da0414ca52e (accessed on 14 March 2023).
  36. Brockwell, J.P.; Davis, A.R. Introduction to Time Series and Forecasting, 2nd ed.; Springer: Cham, Switzerland, 2002. [Google Scholar]
  37. National Oceanic and Atmospheric Administration. ENSO Effects Across the Northeastern Caribbean. National Weather Service. 2023. Available online: https://www.weather.gov/sju/climo_enso (accessed on 22 March 2023).
  38. Curtis, S.; Gamble, D. MJO, NAO, ENSO, and Mid-Summer Rainfall in the Caribbean. US Climate Variability and Predictability Program. 2021. Available online: https://usclivar.org/2015-iasclip-abstract/mjo-nao-enso-and-mid-summer-rainfall-caribbean (accessed on 22 March 2023).
  39. World Meteorological Organization. The Global Climate 2001–2010: A Decade of Climate Extremes: Summary Report. 2013. Available online: https://reliefweb.int/report/world/global-climate-2001-2010-decade-climate-extremes-summary-report (accessed on 22 March 2023).
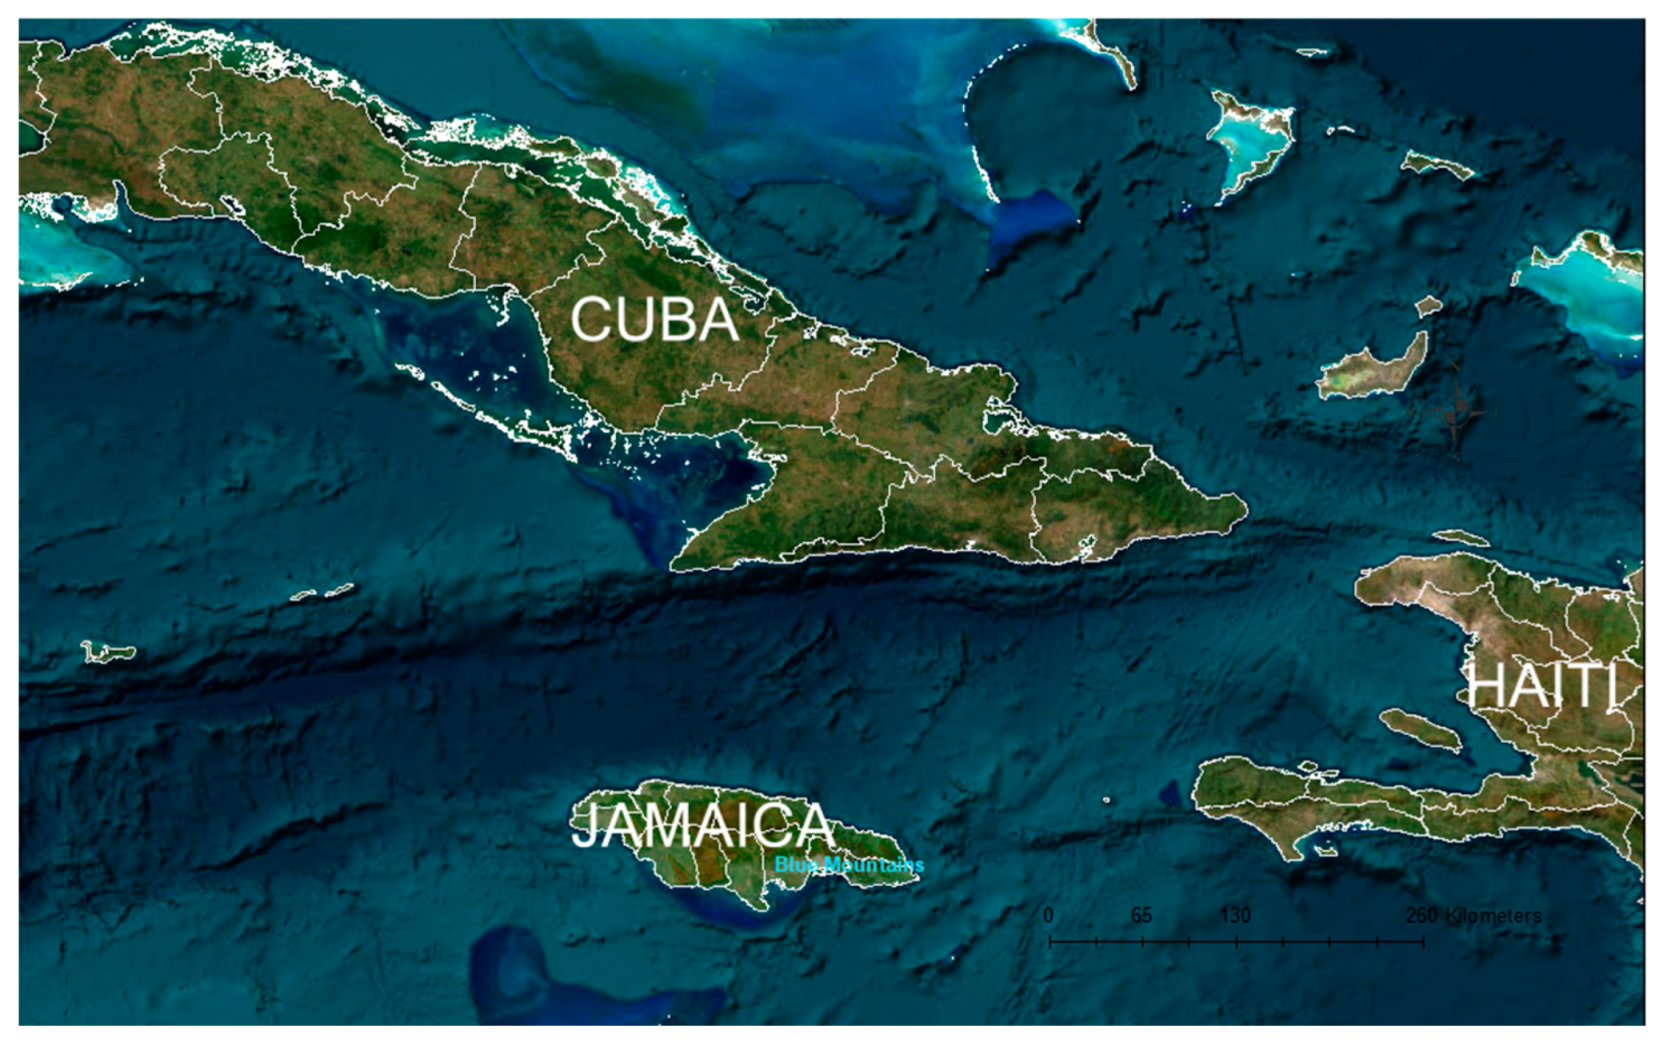
Figure 1. Jamaica in the Caribbean Region.
Geographies 03 00020 g001
Figure 2. CHIRPS resolution grid at 0.05° over Jamaica.
Geographies 03 00020 g002
Figure 3. Average Monthly Rainfall for all decades G1 (1981–1990), G2 (1991–2000), G3 (2001–2010), G4 (2011–2020).
Geographies 03 00020 g003
Figure 4. Seasonal Monthly Rainfall Sum Average Over Decades.
Geographies 03 00020 g004
Figure 5. Monthly Total Precipitation (mm) variability over the four decades in Jamaica.
Geographies 03 00020 g005
Figure 6. Normalized Hurst Exponent spatial distribution over the four decades of the study period (a) H (1981–1990); (b) H (1991–2000); (c) H (2001–2010); (d) H (2011–2020).
Geographies 03 00020 g006aGeographies 03 00020 g006b
Figure 7. Normalized H (1981–2020).
Geographies 03 00020 g007
Figure 8. Normalized Serial Correlation Coefficient (SCC) spatial distribution over the four decades of the study period (a) SCC (1981–1990); (b) SCC (1991–2000); (c) SCC (2001–2010); (d) SCC (2011–2020).
Geographies 03 00020 g008aGeographies 03 00020 g008b
Figure 9. Normalized SCC (1981–2020).
Geographies 03 00020 g009
Figure 10. Persistence Threshold for high threshold event 1 (3-days with 50 mm of continued rainfall). (a) PTH1 (1981–1990); (b) PTH1 (1991–2000); (c) PTH1 (2001–2010); (d) PTH1 (2011–2020).
Geographies 03 00020 g010
Table 1. Number of event occurrences for twelve precipitation intervals. Interval lower and upper limits are selected to cover the full range of precipitation data over Jamaica for the whole dataset (1981–2020).
RangeG1G2G3G4All PeriodAll Period %
0–501,317,8221,314,3591,307,0311,316,7675,255,97998.9
50–100899511,69317,591948447,7630.9
100–150169419923303195689450.2
150–20036759968551521660
200–250612212051636500
250–300185787522140
300–3503223814770
350–4003101412390
400–4501651130
450–500035080
500–550010010
550–600010010
Table 2. Change on annual precipitation means over Jamaica for decadal groups (1981–2020).
Groupst-Test for Meansp-Value
G1-G2−0.3830.711
G1-G3−1.9820.072
G1-G40.2070.841
G2-G3−1.4650.177
G2-G40.4560.659
G3-G42.2210.053
Table 3. Seasonal wet/dry t-test for mean precipitation (1981–2020)—Dry (December, January, February, March), Early Wet Season—EWS (April, May, June, July), Late Wet Season LWS (August, September, October, November).
GroupsEWSp-ValueDry p-ValueLWSp-Value
G1–G2−0.570.61−0.030.980.140.90
G1–G3−1.880.161.590.21−3.110.05
G1–G4−0.640.571.850.16−0.270.80
G2–G3−2.100.132.430.09−1.020.38
G2–G40.300.781.740.18−0.400.72
G3–G45.120.06−0.690.541.070.36
Table 4. Selected daily precipitation thresholds and corresponding consecutive days (1981–2020).
PersistenceThreshold mm, Consecutive Days
low(1,30), (5,20), (10,15), (20,10), (50,5)
high(50,3), (60,2), (80,2), (100,1), (120,1)
Disclaimer/Publisher’s Note: The statements, opinions and data contained in all publications are solely those of the individual author(s) and contributor(s) and not of MDPI and/or the editor(s). MDPI and/or the editor(s) disclaim responsibility for any injury to people or property resulting from any ideas, methods, instructions or products referred to in the content.