Article

Land Suitability Evaluation of Tea (Camellia sinensis L.) Plantation in Kallar Watershed of Nilgiri Bioreserve, India

1
Department of Geography, School of Earth Science, Bharathidasan University, Tiruchirappalli 620024, Tamil Nadu, India
2
Department of Geography and Geoinformatics, Bangalore University, Bengaluru 560056, Karnataka, India
*
Author to whom correspondence should be addressed.
Geographies 2022, 2(4), 701-723; https://doi.org/10.3390/geographies2040043
Submission received: 20 May 2022 / Revised: 5 November 2022 / Accepted: 9 November 2022 / Published: 11 November 2022
(This article belongs to the Special Issue A GIS Spatial Analysis Model for Land Use Change (Volume II))

Abstract

:
Nilgiri tea is a vital perennial beverage variety and is in high demand in global markets due to its quality and medicinal value. In recent years, the cultivation of tea plantations has decreased due to the extreme climate and prolonged practice of tea cultivation in the same area, decreasing its taste and quality. In this scenario, land suitability analysis is the best approach to evaluate the bio-physiochemical and ecological parameters of tea plantations. The present study aims to identify and delineate appropriate land best suited for the cultivation of tea within the Kallar watershed using the geographic information system (GIS) and multi-criteria evaluation (MCE) techniques. This study utilises various suitability criteria, such as soil (texture, hydrogen ion concentration, electrical conductivity, depth, base saturation, and drainability), climate (rainfall and temperature), topography (relief and slope), land use, and the normalised difference vegetation index (NDVI), to evaluate the suitability of the land for growing tea plantations based on the Food and Agricultural Organization (FAO) guidelines for rainfed agriculture. The resultant layers were classified into five suitability classes, including high (S1), moderate (S2), and marginal (S3) classes, which occupied 16.7%, 7.08%, and 16.3% of the land, whereas the currently and permanently not suitable (N1 and N2) classes covered about 18.52% and 29.06% of the total geographic area. This study provides sufficient insights to decision-makers and farmers to support them in making more practical and scientific decisions regarding the cultivation of tea plantations that will result in the increased production of quality tea, and prevent and protect human life from harmful diseases.

Graphical Abstract

1. Introduction

Tea (Camellia sinensis L.) “Chai” is the most valuable perennial beverage crop worldwide, especially in India. Tea is obtained from the cured leaves, leaf buds, and internodes of Camellia sinensis, which has a pleasant and unique smell and is among the 82 species of the genus Camellia [1]. Camellia sinensis is the most important evergreen dormant shrub variety, which plays a vital role both commercially and taxonomically [1,2]. The Scottish Bruce brothers were the pioneers in establishing the tea industry in India for cultivating tea in the northeastern state of Assam. After Assam, tea cultivation practices spread to other parts of India that had the same prevailing conditions as Assam, such as in Darjeeling and Nilgiri. Unlike Assam, the other parts of India where tea is cultivated do not produce high yields. India is the largest producer of tea in the world, but due to the low yield, quality, and lack of suitable sites, India ranks second in tea cultivation, next to China [3]. Tea is a beverage drink and a meditational plant, predominantly including black and green tea. Black tea is more extensively consumed than green tea worldwide [3]. Hence, India is the largest cultivator and producer of black tea, and it is necessary to focus on black tea in terms of its quality, taste, and therapeutic value. Black tea consists of polyphenolic compounds that can protect cells and tissues from oxidative stress by scavenging free radicals [4,5]. Several studies have shown the effects of the components of black tea in reducing the risk of cancer, heart disease, and type 2 diabetes by encouraging weight loss, lowering cholesterol, and promoting mental alertness of the human body [6,7,8,9]. It also appears to have antimicrobial properties [10]. Black tea components also possess anti-allergic, anti-viral, anti-inflammatory, and anti-carcinogenic properties [11,12]. Nilgiris, present in Tamil Nadu, is well known for its cultivation and production of black tea, named after Nilgiris or the Blue Mountain. According to the Tea Research Association of India, due to the non-use of suitable land for the production of black tea in the regions of Nilgiris and its environs, there has been a decrease in the production of black tea to meet regional and global needs.
To meet the growing global population’s needs and the basic regional requirement, precise land-use planning is essential for sustainable development and the identification of potentially suitable land for growing particular types of crops, which will help the future generation manage their own needs [13]. An essential requirement of agricultural land-use planning is to conduct land evaluation for potential land suitability, which is a prerequisite for the ideal utilisation of existing land resources [14]. Land evaluation is the systematic assessment of potential land parcels in an area to identify the most suitable land for various purposes [15]. Land suitability analysis is a method of analysing the suitability of specific areas of land for a defined type of use, such as urban, forest, agriculture, solid waste disposal, etc., and their level of suitability [16,17,18,19]. Both land suitability evaluation and agricultural land-use planning are significant in providing the basic information for correct decision-making and also enabling decision-makers to develop crop-management systems [20,21,22]. It also offers sufficient information for identifying suitable land for various crops. To identify the land suitability for various crops, the process of land suitability evaluation is carried out according to the suitability classification of the Food and Agricultural Organization [23,24,25,26], in which the land suitability rankings are given, ranging from highly suitable to not suitable, based on the degree of land suitability for the cultivation of a particular crop [27]. The main components in evaluating land suitability for various crops are the prevailing soil, climate, available water resources, structural landscape, environmental factors, and native biophysical conditions [28]. Integrated GIS and remote sensing are critical in assessing specific areas, both at global and local levels [29]. They help to map and visualise suitable agricultural land’s spatial and temporal distribution [30,31]. Land suitability analysis methods, such as Boolean overlay and modelling for land suitability analysis, have a shortage of distinct mechanisms in integrating the decision-maker’s first choice into geographic information system (GIS) processes, which can be fixed by integrating the GIS and multi-criteria evaluation (MCE) methods [32,33].
Multi-criteria decision-making (MCDM) or multi-criteria evaluation (MCE) have been introduced to advance spatial decision-making when a set of substitutes needs to be assessed based on differing and inadequate criteria. MCE is an effective tool for multi-criteria decision-making issues [34,35,36], intending to examine a variety of options in light of multiple criteria and multiple objectives [37,38]. Among the various MCDM methods, the analytical hierarchy process (AHP) [39,40] is a well-known multi-criteria technique that has been fused into GIS-based suitability procedures to obtain the required weightings for different criteria [41,42]. Owing to its ability to integrate a large amount of non-homogenous data, GIS-based AHP has gained much attention and reputation in solving problems that occur spatially, as obtaining the required weights, even for a large number of criteria, is comparatively direct [43,44,45]. Chandio [46] carried out a land suitability analysis for hillside development in the region to create a theoretical outline of land evaluation using the multi-criteria decision analysis (MCDA) approach.
A land suitability evaluation model based on FAO land classification for crops was implemented, in which the physical, environmental, and economic evaluation of land suitability for five crops was carried out by applying the Boolean classification method [47]. A new multi-criteria evaluation method was examined by Jafari [48] using a spatial analytical hierarchy method to identify suitable rangeland areas. Many researchers around the world have assessed land suitability for tea plantations using remote sensing, GIS, and MCE approaches. Li et al. [49] utilised GIS and a modified land ecological suitability evaluation model to evaluate the potential land suitability for tea cultivation in South China. An evaluation of tea cultivation suitability and its driving forces through AHP and geo-detection in a case study of Yingde in China was conducted by Chen [50]. An assessment of potential land suitability for tea in Sri Lanka using a GIS-based multi-criteria approach was conducted by Sadeeka [51]. Gahlod et al. [52] evaluated tea, cardamom, and rubber cultivation in Kerala using soil physiochemical and environmental parameters.
Eventually, information collected from the Tea Research Association, as well as from estate management, indicated a decline in yield, which was most likely due to the old age of plantations and their inability to compete with other tea-production areas [53]. The economic lifespan of tea plantations is 40–50 years (long-term cropping pattern). Older plantations show a decreased yield, whereas young tea plantations have been associated with higher productivity in most tea-growing areas [53]. In the Kallar watershed, most of the tea plantation areas are much older, and they were created during the British sovereign period based on traditional cultivation practices. Recent tea cultivation areas are situated at very high to moderate altitudes without proper scientific investigation. Nowadays, some tea estates have been converted into real estate, resorts, and other endeavours due to the lower yield and poor quality of tea. In this situation, it is essential to find the most suitable site and favourable conditions for tea plantations.
The land evaluation approach, crop suitability, crop requirements, and methodologies have been understood through literature reviews and previous studies. Earlier studies utilised limited numbers of biophysical and climatic parameters for the suitability evaluation of tea plantations. The present study attempted to incorporate the various parameters under four major indicators, such as climatic, topographic, soil, and environmental indicators. Additionally, the criterion weight and ranks were assigned through a multi-criteria evaluation approach. The integration of multi-thematic indicators with the AHP technique will be an ideal method to evaluate the suitability of land for tea plantations. In India, very few studies have adopted this perspective; they mainly focused on tea production and manufacturing, labour employability, and socio-economic benefits [54]. More specifically, the present study area has not been the subject of any other previous studies from this facet. This pioneering study focuses on land suitability evaluation through MCDM techniques in the Kallar watershed. Therefore, it is a very challenging task to select parameters, assign weights, and validate them; with these limitations, the present work was conducted. The core objective of this research was to identify and delineate the land that could be suitable for the cultivation of tea plantations in the Kallar watershed using MCE, remote sensing, and GIS techniques; to select the most influential criteria among the four major indicators for the evaluation of tea plantation land suitability; and to demarcate the potentially suitable areas for tea plantations within the forest area, which will help to protect and halt encroachment in the forest zone.

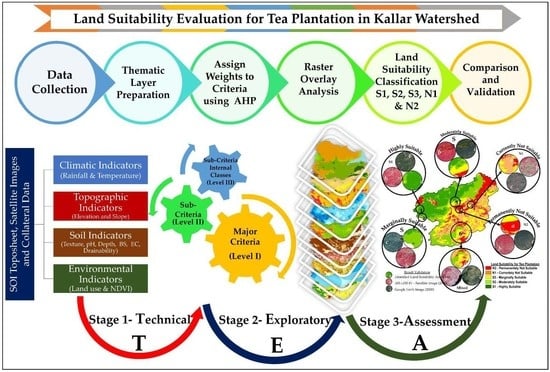
2. Materials and Methods

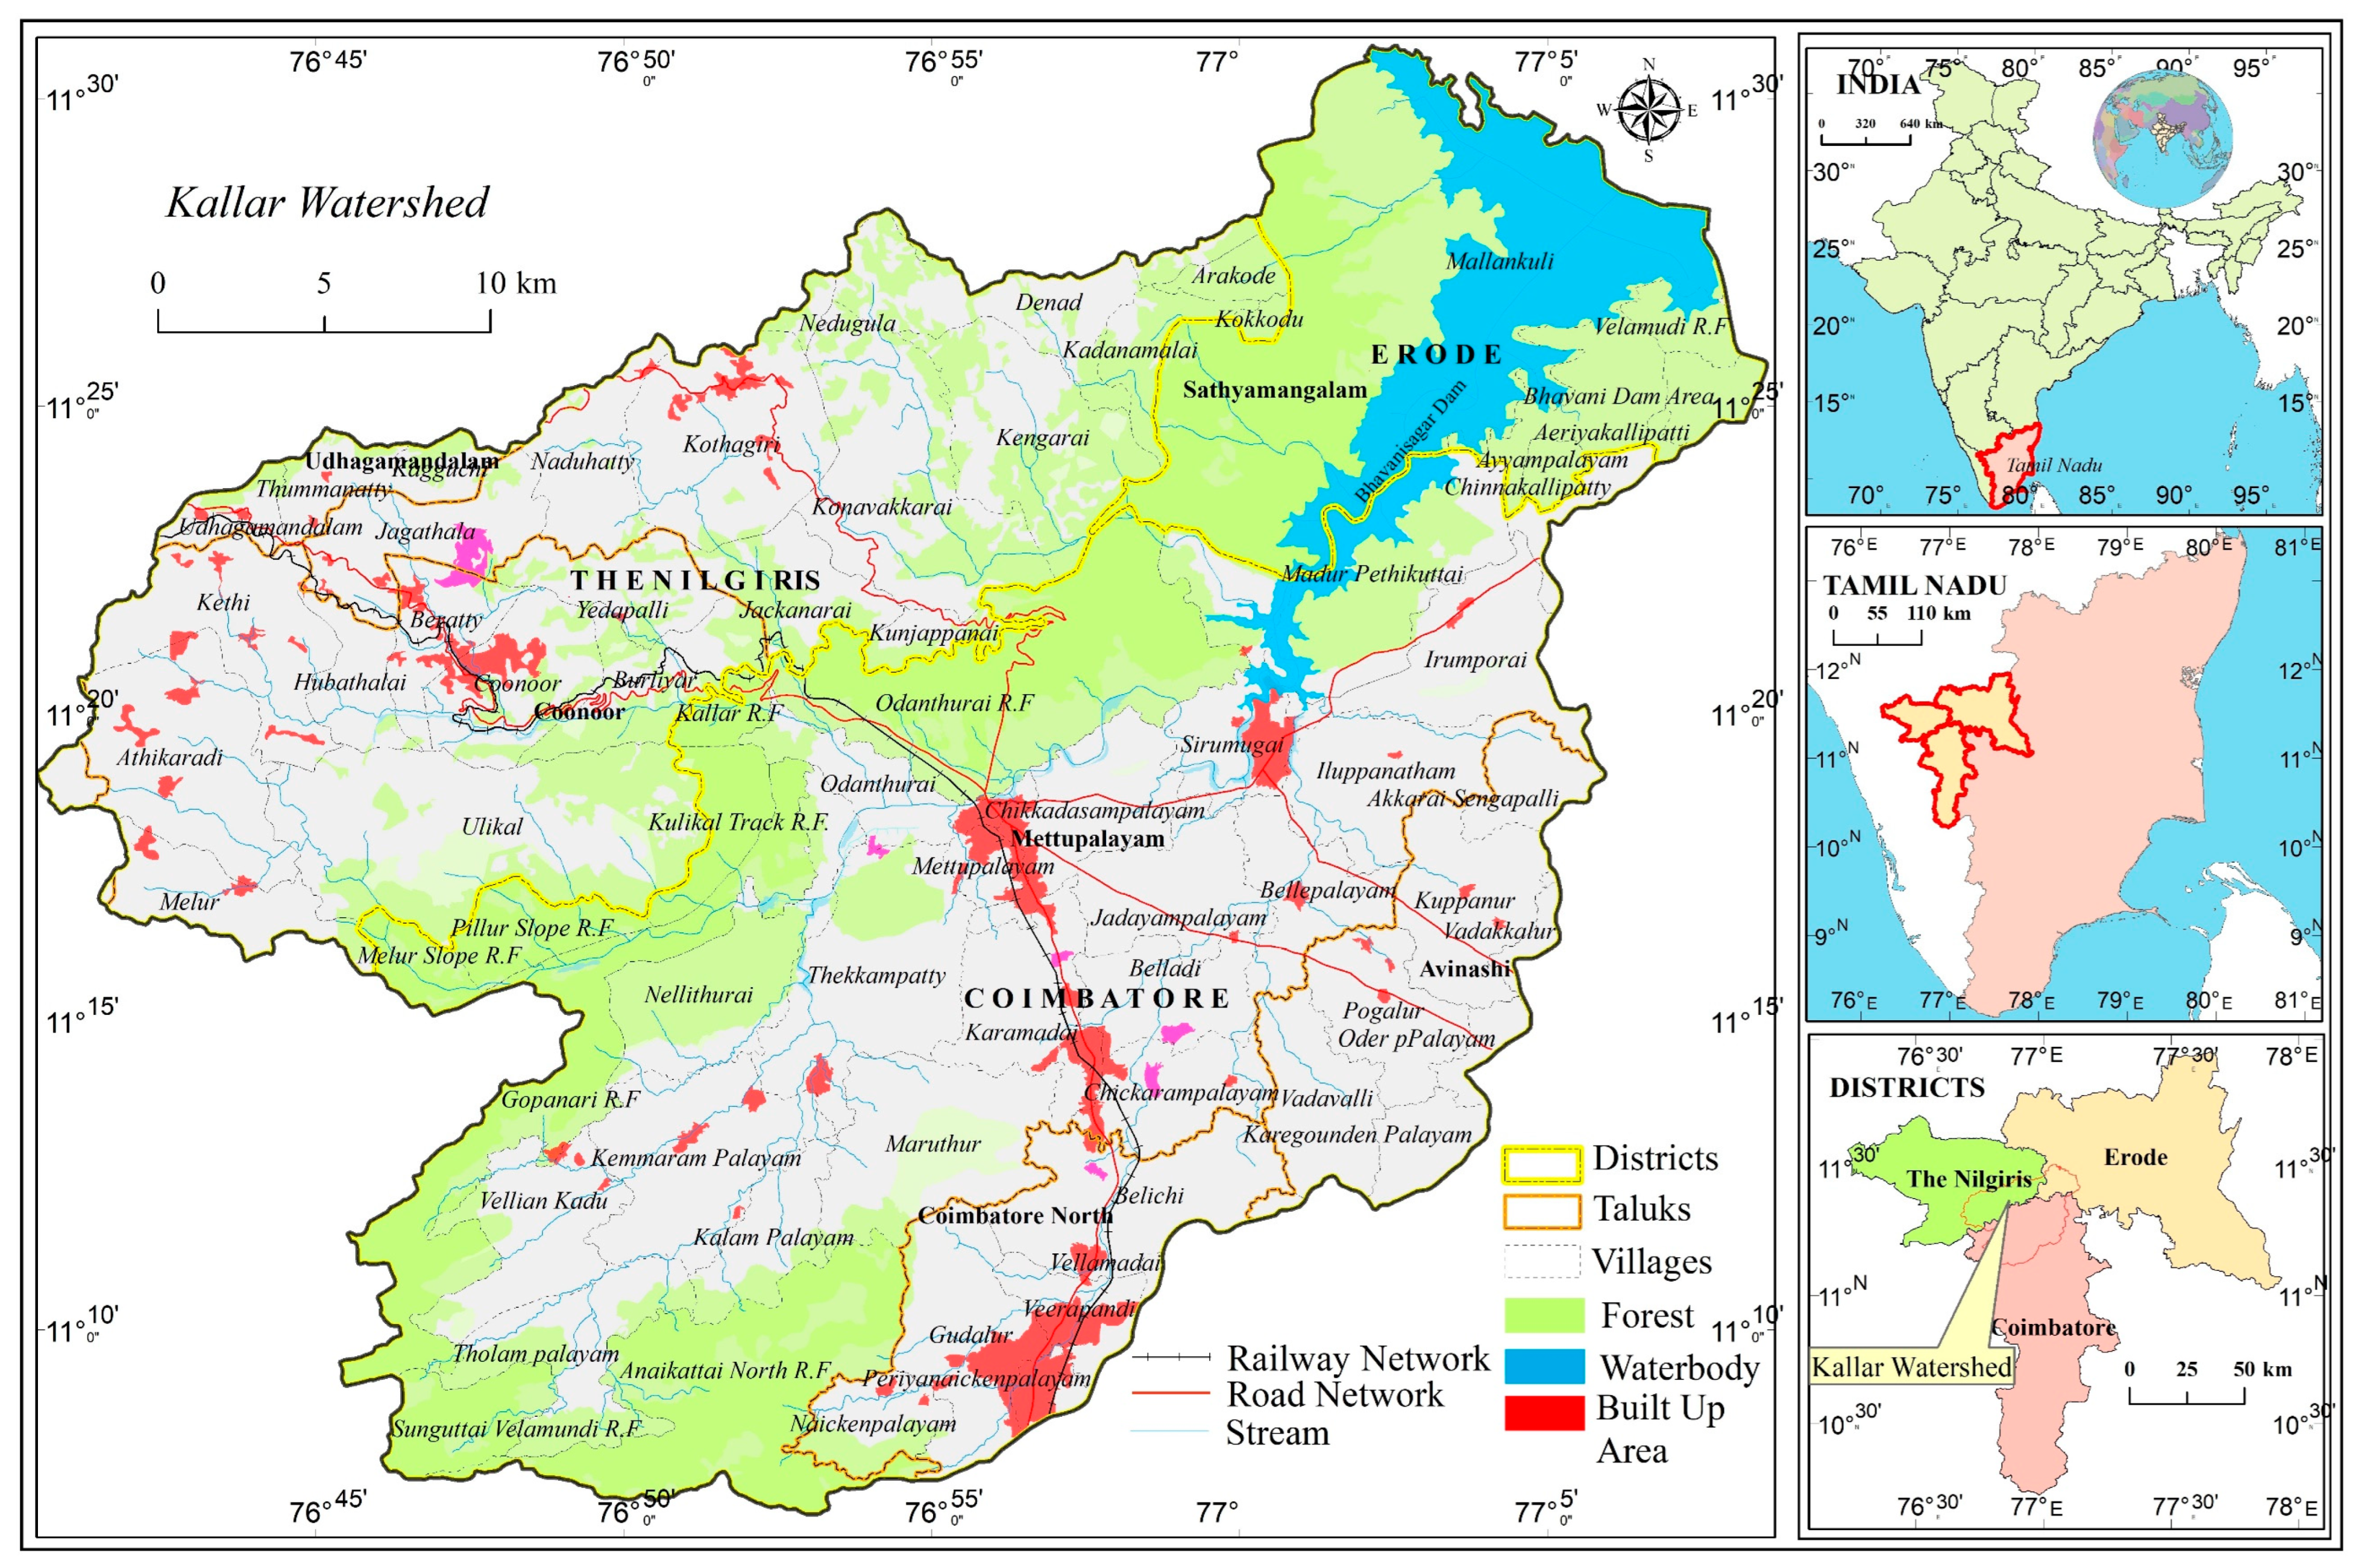
2.1. Regional Setting

The Kallar watershed is situated in the eastern part of the Western Ghats, stretching from west to east. It is part of the Nilgiri Bioreserve in Tamil Nadu and it covers an area of around 1286 km2. It is located between 11°17′0″ and 11°31′0″ N latitude and 76°39′0″ and 77°8′45″ E longitude. The administrative units of the Kallar watershed comprise three districts, namely Nilgiris, Coimbatore, and Erode; six taluks (Coonoor, Kothagiri, Udhagamandalam, Mettupalayam, Coimbatore North, and Sathyamangalam); and 89 revenue villages (Figure 1). The maximum and minimum elevations in the watershed are about 177 m and 2615 m above mean sea level (MSL). About 50% of the area consists of mountains enclosed by diverse plant groups that form numerous types of forest and other agricultural activities, specifically tea, coffee plantations, orchards, and vegetables, which are normally cultivated in the upper and lower areas. The average daily temperature of the watershed is 20.15 °C to 30 °C and the average rainfall is about >1400 mm. The winter is relatively cool in the study area. The maximum rainfall is received during the months of October and November. The Kallar Streams flow from southwest to northeast and connect to the Bhavani River, which finally joins at Bhavanisagar Dam. It was built in the northeastern part of the watershed and primarily serves as a source of irrigation and hydroelectric power generation. The study area is covered by clay soil, loam soil, and rock outcrops on steep to narrow sloping landforms. Geomorphologically, the watershed is characterised by steep structural hills, denudational hills, narrow gorges, and intermountain valleys. Geologically, charnockite and fissile hornblende–biotite gneiss covers a major portion of the study area.

2.2. Datasets and Methods

The following datasets were used to find suitable land for tea plantations in this study. For base map preparation, the following Survey of India (SOI) toposheets were utilised: 58 A/11, 15, 16, and 58 E/3, 4 at a scale of 1:50,000. ASTER DEM data, with a spatial resolution of 30 m, were used to extract the topographic features, such as slope and relief. Climate data from the Indian Meteorological Department (IMD), Chennai, during a period of 30 years (1982–2012) were used. Soil-related parameters were collected from Tamil Nadu Agricultural University, Coimbatore. Land-use and NDVI data were generated from a Landsat 8 OLI image (February 2012) with a spatial resolution of 30 m and the Bhuvan portal (2011–2012). Furthermore, IRS LISS IV (2015), with a spatial resolution of 5.8 m, was used to generate current the land use for validation with suitability classes. The land-use map was manually digitised based on a hybrid method (using SOI Toposheet, existing land-use maps, Google Earth Imageries, and LISS IV satellite images). The classified land-use vector map was prepared at the 1:10,000 scale. It was converted at 30 m resolution raster image from the same vector layer for further processing. The accuracy of the classified land use was around 99% (Kappa coefficient), as manual classification compares with existing sources and ground-truthing, which results in higher accuracy, but is time-consuming. After extraction, all of the suitability parameters were maintained with a spatial resolution of 30 m (cell size) for overlay analysis. To achieve the designed objectives, a weighted overlay methodology was applied in this study by integrating all of the thematic layers. The detailed weights and calculation methods are described in separate Section 2.3. Each generated thematic raster layer was reclassified into five classes based on the suitability conditions. Finally, to generate the overall land suitability for tea plantations, raster overlay analysis was performed using the raster calculator in the ArcGIS environment.

2.3. Multi-Criteria Evaluation

Decision-makers use multi-criteria analysis to reach a conclusion when multiple criteria or multiple factors are given. Since 1980, the integration of GIS with multi-criteria decision-making has helped in solving problems spatially with the aid of a spatial decision-support system, which involves the application of multi-criteria analysis in the spatial context where the real-world solutions to spatial problems are provided with spatial dimensions [55,56]. Multi-criteria decision-making and GIS have advanced the use of map overlays of various criteria in land-use suitability analysis [57,58,59]. The popularly used AHP method of MCE was used for land suitability analysis, as Saaty [39,60] stated, to compare and provide weights for various criteria and sub-criteria. To perform AHP, a pair-wise comparison matrix (PWCM) was used to rate each factor against every other factor to determine its importance on a scale from 1 to 9 (Table 1). When a factor is compared with itself, the value of unity is given, so the diagonal elements of PWCM are assigned the value of unity. Only the values of the lower half of the triangle need to be filled in, as the upper part of the matrix is given the same values as the lower half of the triangle because the matrix is symmetrical [14].
When performing pairwise comparisons, some inconsistencies may typically arise. The AHP incorporates an effective technique for checking the consistency of the evaluations made by decision-makers. In the AHP, the pair-wise comparisons in a decision matrix are considered to be satisfactorily consistent if the equivalent consistency ratio (CR) is less than 10% [61,62]. The consistency index (CI) is estimated by multiplying the judgement matrix by the approximated eigenvector to calculate the CR. Each component of the resulting matrix is then divided by the corresponding approximated eigenvector. This produces an approximation of the maximum eigenvalue (λmax). Then, the CI value is calculated by the following formula: CI = λ max n / n 1 . Finally, the CR is obtained by dividing the CI value by the random consistency index (RCI) generated by Saaty [39].
This study utilised four major indicators and twelve criteria for land evaluation based on earlier studies, the National Bureau of Soil Survey & Land Use Planning (NBSS & LUP) guidelines, and expert suggestions. Climatic indicators [49,50,63,64], topographic indicators [23,24,25,51], and soil indicators [51,52,65] were chosen. The environmental indicators were selected by our observation of other crop suitability studies. According to the opinions of experts and agronomists, the MCE approach of spatial AHP for tea plantations was followed to assign suitability criteria and sub-criteria weights based on their influences on suitable tea cultivation. Each criterion (Level II) internal class was considered a sub-criterion (Level III) in the present AHP process.
In many studies [57,66,67], the criterion internal classes were ranked randomly on scales of 1 to 5, 1–10, and 0–100; this shows bias in the ranking method. To avoid such cases, this work attempted to weight the sub-criteria (Level III) to achieve a better result. The scores were assigned for each class from the Satty scale. The overall calculation process is expressed in the following Equations (1)–(4).
Climatic   indicator :   w _ 1 × w _ 11 × w _ 11 j   j = 1 ,   2 ,   3 ,   ,   n . ;
Topographic   indicator :   w _ 2 × w _ 21 × w _ 21 j   j = 1 ,   2 ,   3 ,   ,   n . ;
Soil   indicator :   w _ 3 × w _ 31 × w _ 31 j   j = 1 ,   2 ,   3 ,   ,   n . ;
Environmental   indicator :   w _ 4 × w _ 41 × w _ 41 j   j = 1 ,   2 ,   3 ,   ,   n . ;
where, w_1, w_2, w_3, and w_4 indicate the major criteria (Level I: climate, topography, soil, and environment); w_11, w_21, w_31, and w_41 denote the sub-criteria (Level II: rainfall, relief, soil texture, and land use); w_11j, w_21j, w_31j, and w_41j designate the sub-criteria internal classes (Level III: <1000 cm, <500 m, clay, and barren rock); and j is the incremental variable that depends on the sub-criteria internal classes.
This method was applied in the present land suitability evaluation because, in most cases, the sub-criteria internal classes play a major role in deciding the suitability condition. However, after assigning the weights to all of the major criteria (Level I-4), sub-criteria (Level II-12), and sub-criteria internal classes (Level III-61) and multiplying the weights using Equations (1)–(4), the final normalised weights of the individual classes were calculated. In this process, the overall product score (normalised weight) is 1.

2.4. Crop Suitability Criteria and Land Suitability for Tea Plantation

Effective parameters in land suitability for tea plantations are as follows, and their importance is mentioned briefly. The suitability criteria, i.e., climate (rainfall and temperature), topography (relief and slope), soil (texture, pH, Ec, depth, base saturation, and drainage) land use, and NDVI (Figure 2) were evaluated based on agronomists’ expert opinions and the FAO rainfed agriculture guidelines. Each criterion’s suitability classes were scored based on NBSS & LUP 2006 (Table 2). The selected crop requirement factors were classified into climatic regime, oxygen availability to roots, nutrient availability, rooting conditions, and soil toxicity, which determine the suitability of land for tea plantations (NBSS and LUP guidelines). The climatic regime includes the mean temperature and annual average rainfall. Soil drainability helps in understanding the oxygen availability to roots. The availability of soil nutrients is measured based on the soil texture, pH, and base saturation. The adequate soil depth indicates the rooting condition of an area. Soil electrical conductivity expresses the soil toxicity (salinity).
Climatic conditions affect the growth of tea plants, reducing their quality and yield. For the climatic indicator, rainfall and temperature were selected. The annual average rainfall of the study area is between <700 and >1800 mm (Figure 2a), and it has been classified from a low-rainfall zone to a high-rainfall zone. In Figure 2b, the mean temperature range varies from <15 °C to >28 °C. It was classified further into five classes, namely <15 (2.8%), 15–17 (7.5%), 17–26 (59.4%), 26–28 (26.9%), and >28 °C (3.3%). The growth of tea plants is associated with topographical conditions, such as the relief and slope. The present study area has a relief range between 177 and 2500 m, and the slope class ranges from nearly level (<1) to very steep slope (>33°) (Figure 2c, d). The relief layer was classified into six classes, including <500 (57.4%), 500–800 (10.6%), 800–1100 (5.6%), 1100–1500 (5.9%), 1500–1800 (9.7%), and 1800–2500 (10.9%).
The physicochemical characteristics of soil play a vital role in the rooting condition of tea plantations and the availability of nutrient supply. Texture is one of the essential parameters of soil, as most of its physical characteristics depend upon the texture class. Seven texture classes are available in the study area, including clay (c), clay loam (cl), loam (l), loamy sand (ls), sandy clay (sc), sandy clay loam (scl), and sandy loam (sl) (Figure 2e). The soil pH value in the study region ranges from 5.5 to 8.6, i.e., strongly acidic to moderately alkaline (Figure 2f and Table 2), which is most suitable for tea plantations. The preferable pH range of soil for tea plants is 4.5 to 5.0, falling under very strongly acidic to strongly acidic. The soil depth is significant, as it reflects the depth to which the roots of a plant can readily penetrate to reach water and nutrients for plant growth and production. The present study area consists of four soil depth classes, i.e., very poor (shallow depth: <50 cm), poor (moderately deep: 50–100 cm), moderate (deep depth: 100–150 cm), and good (very deep depth > 150 cm), which are shown in Figure 2g. The base saturation in the study area ranges from 30 to 50 per cent (Figure 2h). The higher the value of exchangeable base cations, the more that acidity can be resolved in a short time. Thus, soil with a high cation-exchange capacity takes a longer time to acidify than soil with a low cation-exchange capacity. In general, salt-affected soils arise in arid and semi-arid areas with a high evaporation rate. Such soils affect plant growth in different ways. In the present study area, soils are slightly to strongly saline, as the EC values ranged from 0.1 to 1.7 dS m−1 (Figure 2i). Five soil drainability classes were covered in the study area: well-drained, moderately well-drained, excessively drained, imperfectly drained, and poorly drained (Figure 2j). Well-drained soil classes mostly prevailed in the hilly regions.
Land use depicts the current status of an area that can be utilised for natural and socio-economic activities. The study area consists of nine land use classes: barren rock (1.1%), built-up (4.6%), cropland (12.1%), current fallow (12%), forest (36.2%), mining (0.2%), tea and other (banana, coconut, and areca nut) plantations (17.1%), wasteland (11.2%), and water body (5.3%). The area is mostly covered with forest and plantation (tea) land (Figure 2k). The normalised difference vegetation index is an index of plant greenness or photosynthetic activity. The present study area consists of NDVI values ranging from <0.2 to 0.6 (Figure 2l). The weights were derived from the analytical hierarchy process, and all of the layers were overlaid using the ArcGIS raster calculator to prepare a land suitability map for tea plantations.

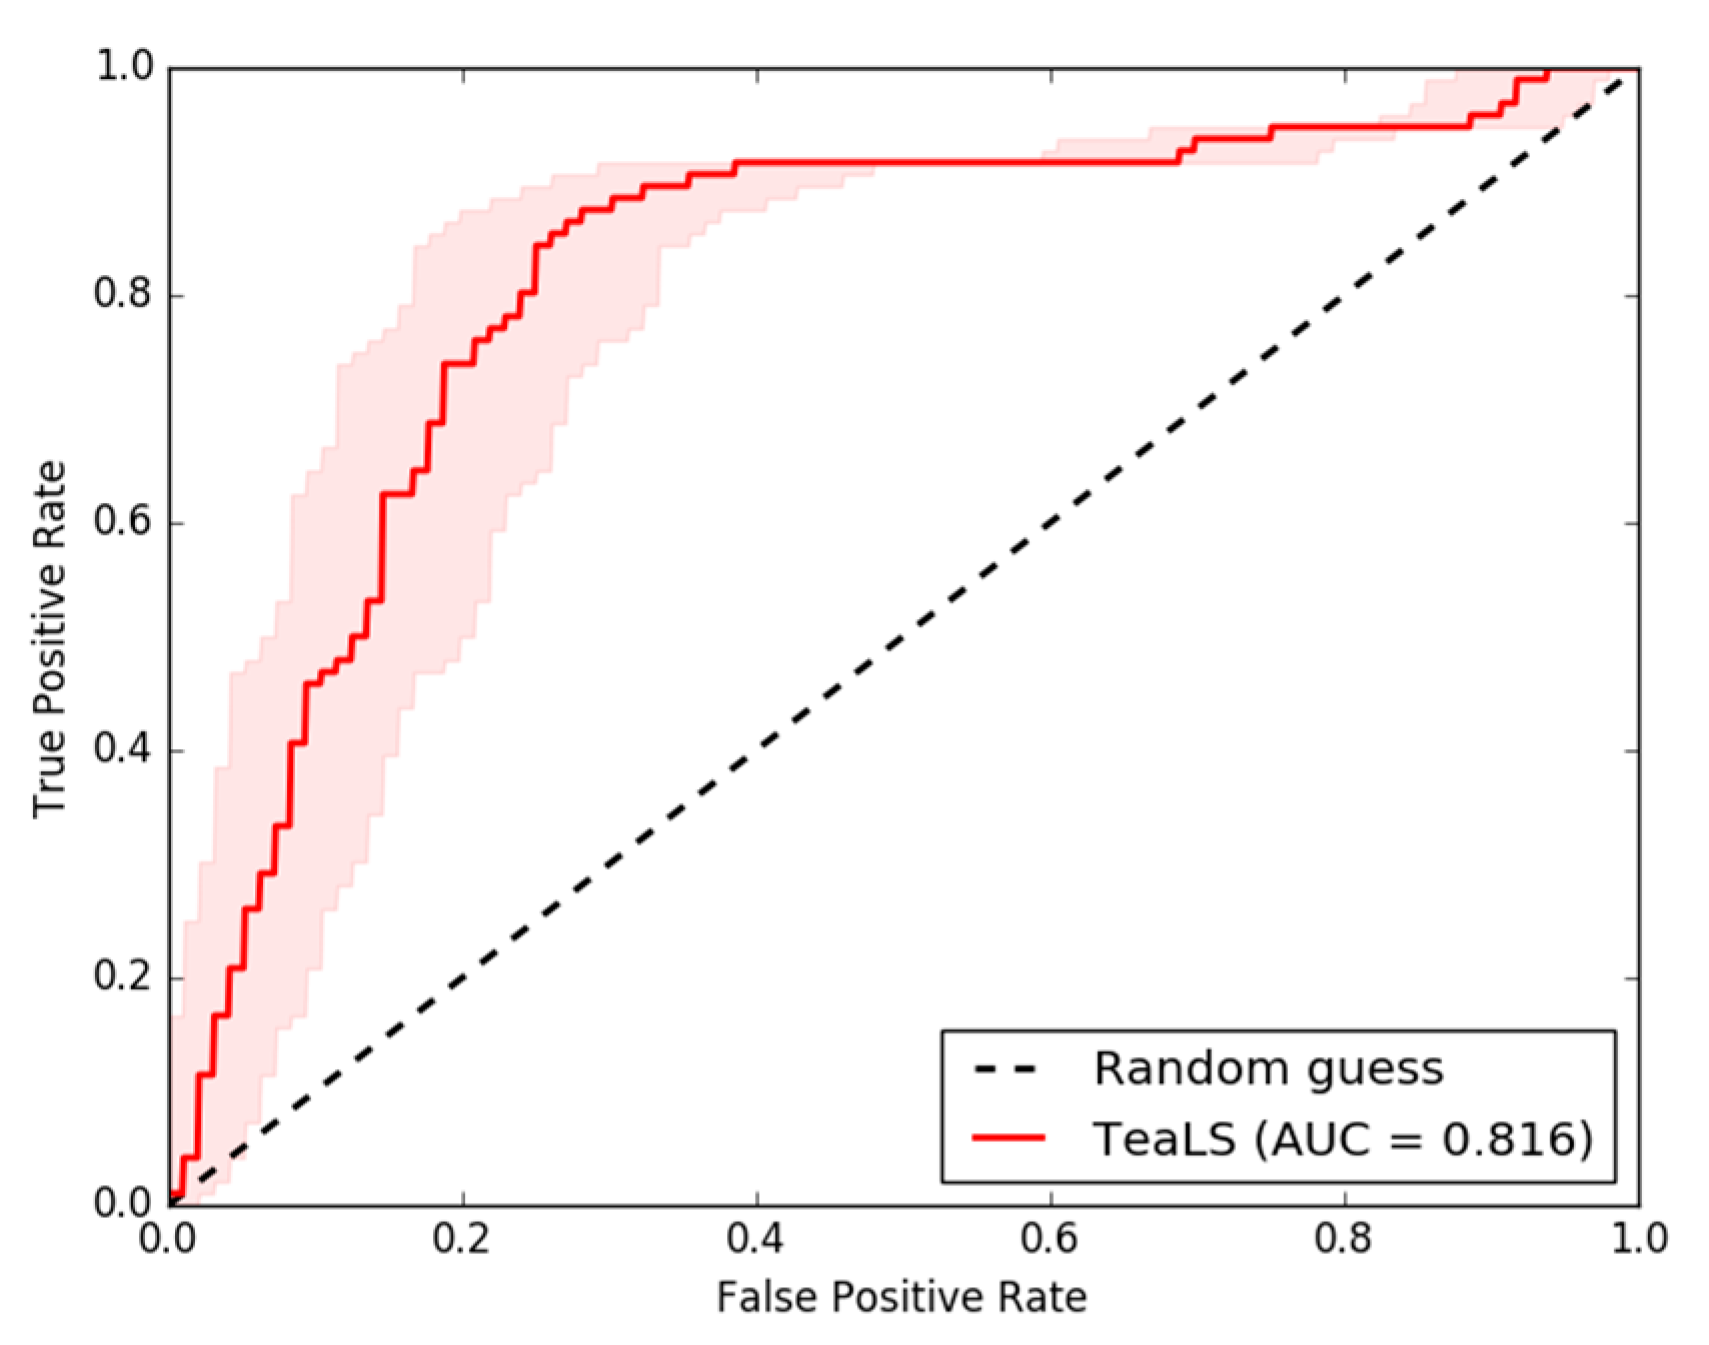
2.5. Validation Method of Generated Results

The validation method applied in this study focused on whether tea plantations were already in practice or cultivated in the Kallar watershed. Various methods were used to measure the degree of possibility (accuracy). (1) Subjective comparison: to ensure that the generated land suitability class corresponded to the field’s current condition [51]. The existing tea growing area was extracted from the land-use map (digitised from the IRS LISS IV satellite imagery with a spatial resolution of 5.8 m). The geometry intersection tool was used to perform this comparison. (2) Performance classification: the receiver operating characteristics (ROC) curve and area under the ROC curve (AUC) helped to understand the performance of a classification model at all classification thresholds. This curve plot consisted of two parameters, i.e., the true positive rate (TPR) and false positive rate (FPR). This can be expressed in Equations (5) and (6), as follows:
TPR = TP TP + FN
  FPR = FP FP + TN
where TP is the true positive, TN is the true negative, FP is the false positive, and FN is the false negative.
To plot the ROC curve, two variables were selected, i.e., existing tea plantation location points (from the land-use map and the Google Earth image) as true positive (Y-axis) and modelled land suitability class (TeaLS) as false positive (X-axis). The ArcSDE tool in the ArcGIS environment was used to construct the ROC plot. The degrees of measures (test quality) based on the AUC scores were as follows: 0.9–1.0 (excellent), 0.8–0.9 (very good), 0.7–0.8 (good), 0.6–0.7 (satisfactory), and 0.5–0.6 (unsatisfactory) [69].

3. Results

3.1. MCE-Based Spatial AHP in Land Suitability Analysis for Tea

The MCE approach in the spatial AHP was used to evaluate the tea plantation suitability criteria and sub-criteria, and weights were assigned based on the influences of individual criteria on the suitability of sites for tea plantations. In this study, there were four major criteria, including the climatic indicator (W1), topographic indicator (W2), soil indicator (W3), and environmental indicator (W4). The soil parameters and climatic parameters are more important when identifying a suitable location for a tea plantation and were allotted the highest weights of W3 = 0.581 and W1 = 0.219, respectively. The topographic and environmental parameters were the supporting factors for evaluating the suitability class; they were assigned the lowest weights of W2 = 0.139 and W4 = 0.061, respectively. The overall consistency index was 0.075, and the consistency ratio was 0.084 (Table 3) for the major criteria. It was an acceptable value because the ratio was <1.
The major criteria were further classified into two levels and weights were assigned to the individual factors; 12 sub-criterion weights were calculated, including rainfall (W11 = 0.677) and temperature (W12 = 0.333) as climatic factors (Table 4). The topographic indicators, with the sub-criteria of relief (W21 = 0.750) and slope (W22 = 0.250), are shown in Table 5. Soil texture (W31 = 0.315), pH (W32 = 0.208), depth (W33 = 0.176), base saturation (W34 = 0.116), Ec (W35 = 0.072), and soil drainability (W36 = 0.114) were the soil sub-criteria (Table 6). The land use/land cover (W41 = 0.667) and NDVI (W42 = 0.333) were environmental indicators (Table 7). Similarly, individual internal classes of each sub-criterion were also assigned weights and the overall weight for each class was calculated (Table 8).

3.2. Evaluation of Land Suitability Criteria for Tea Plantations

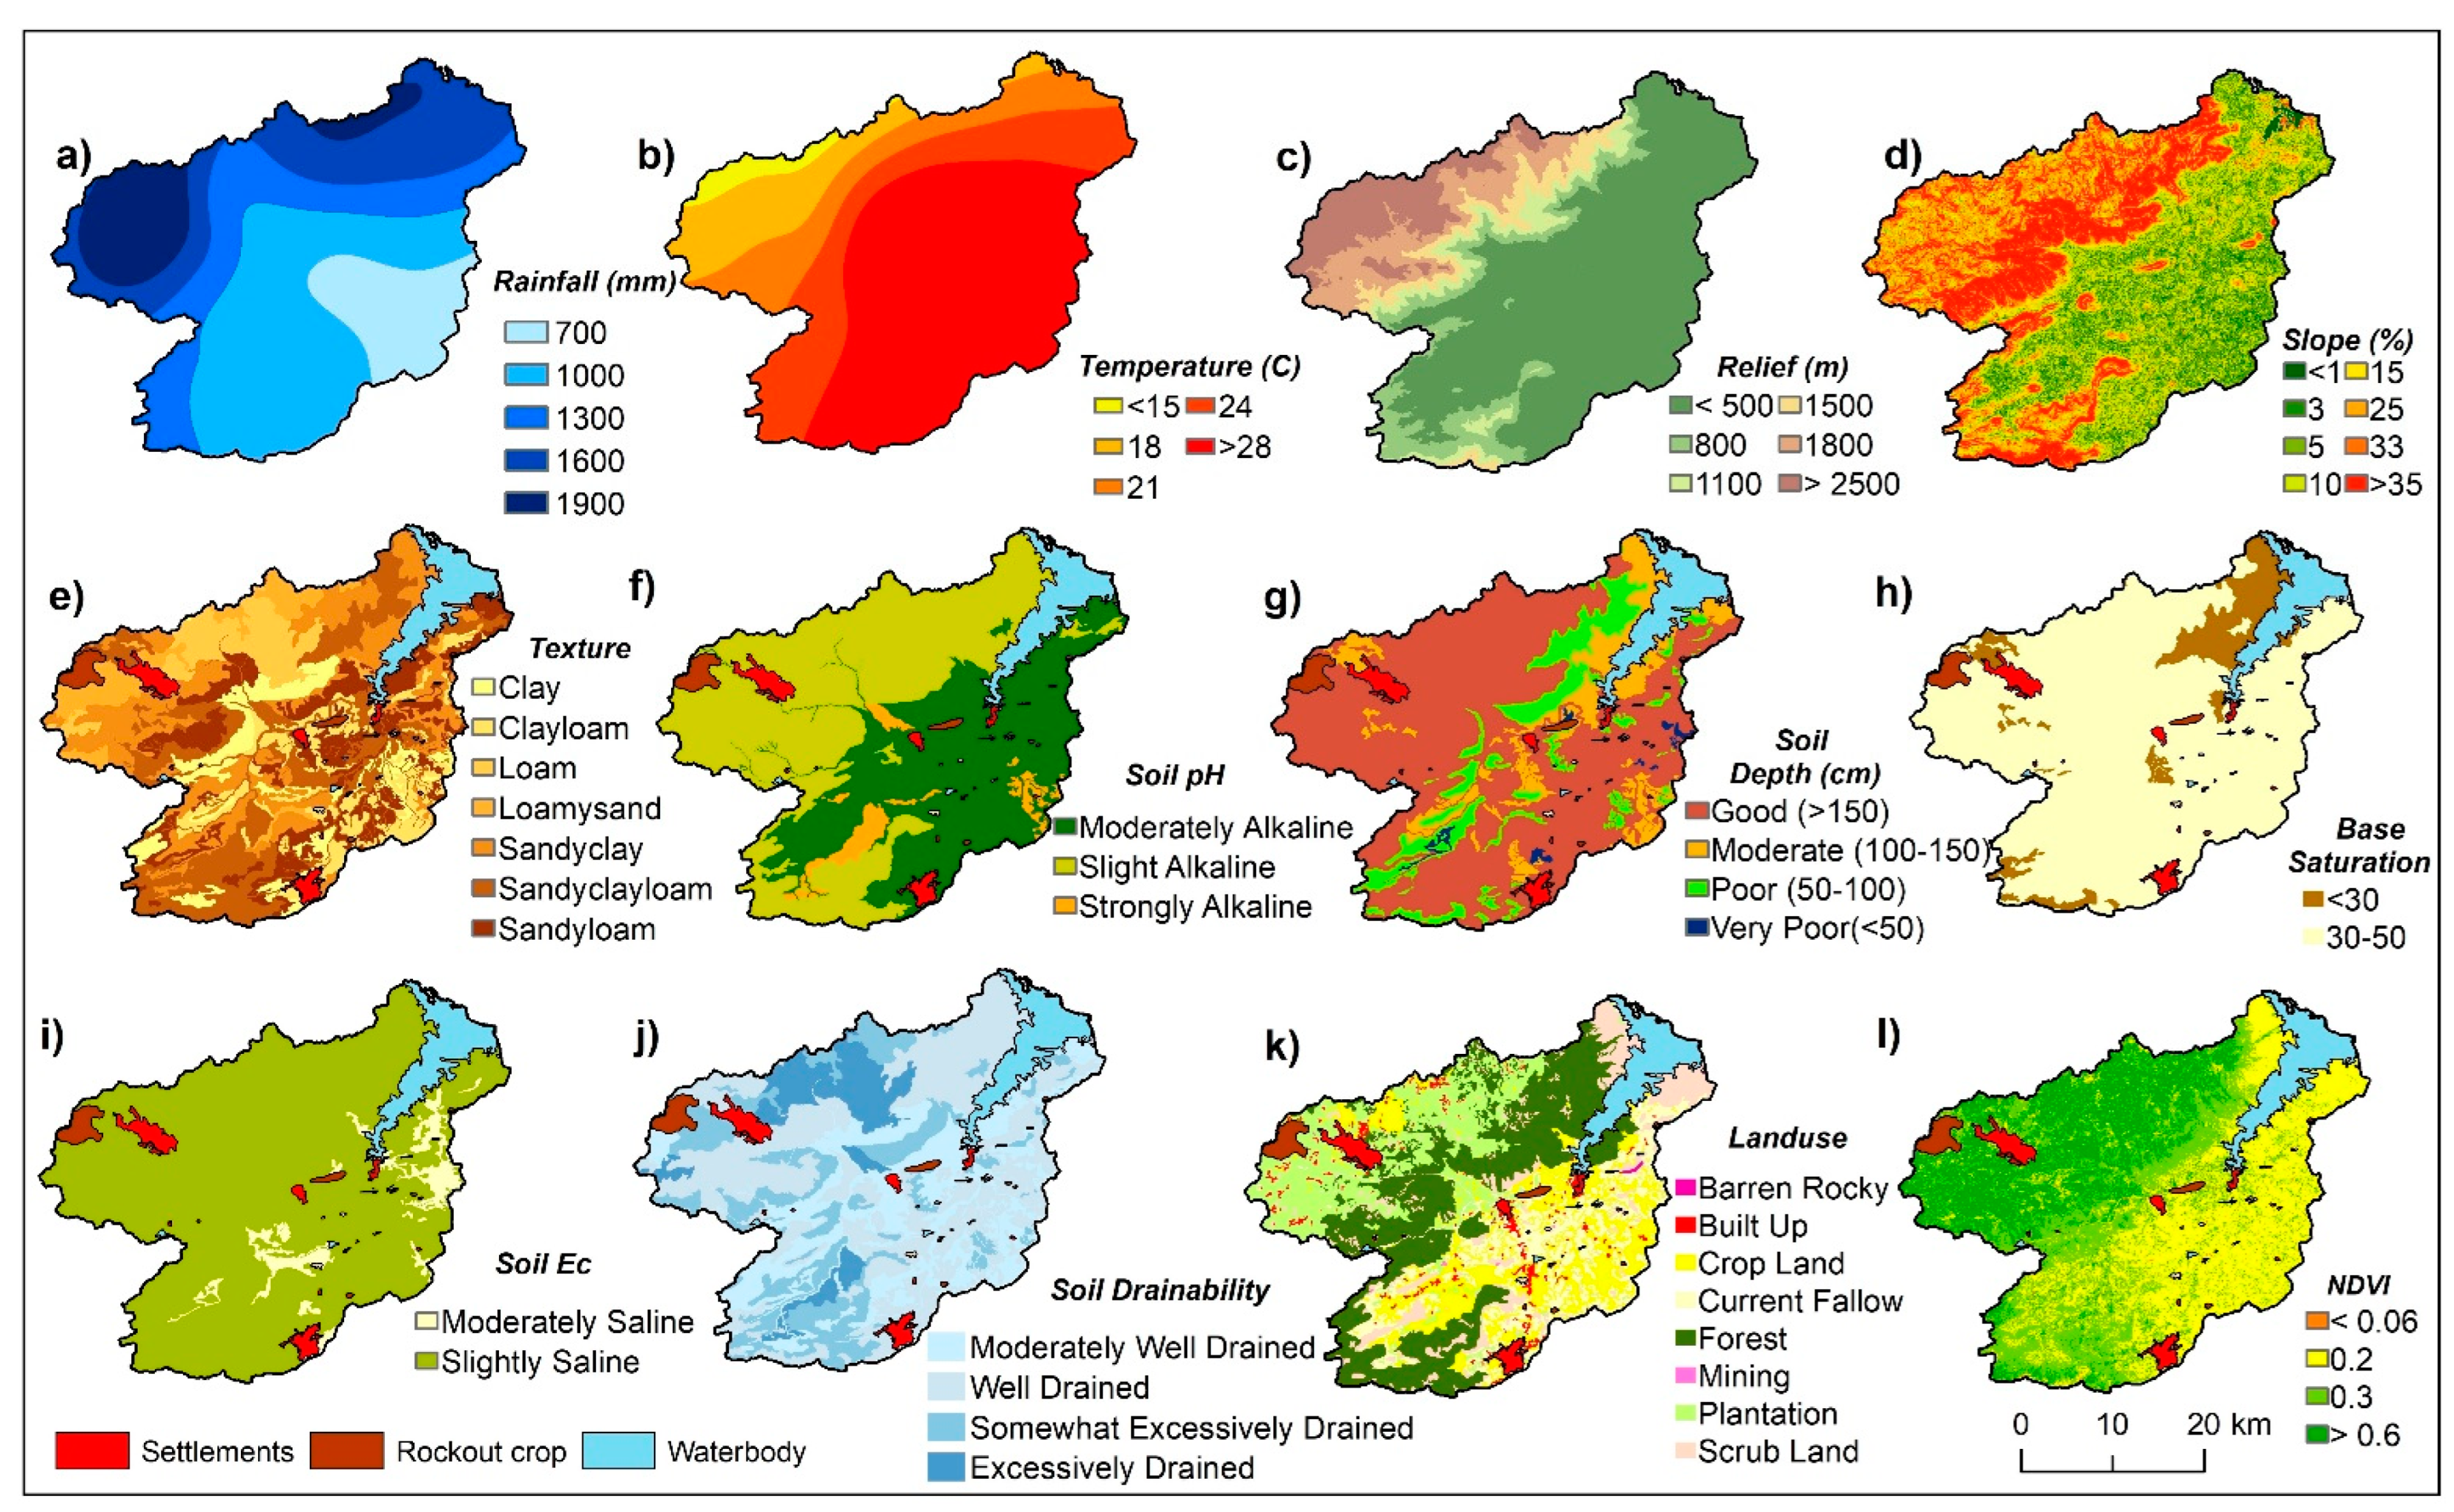
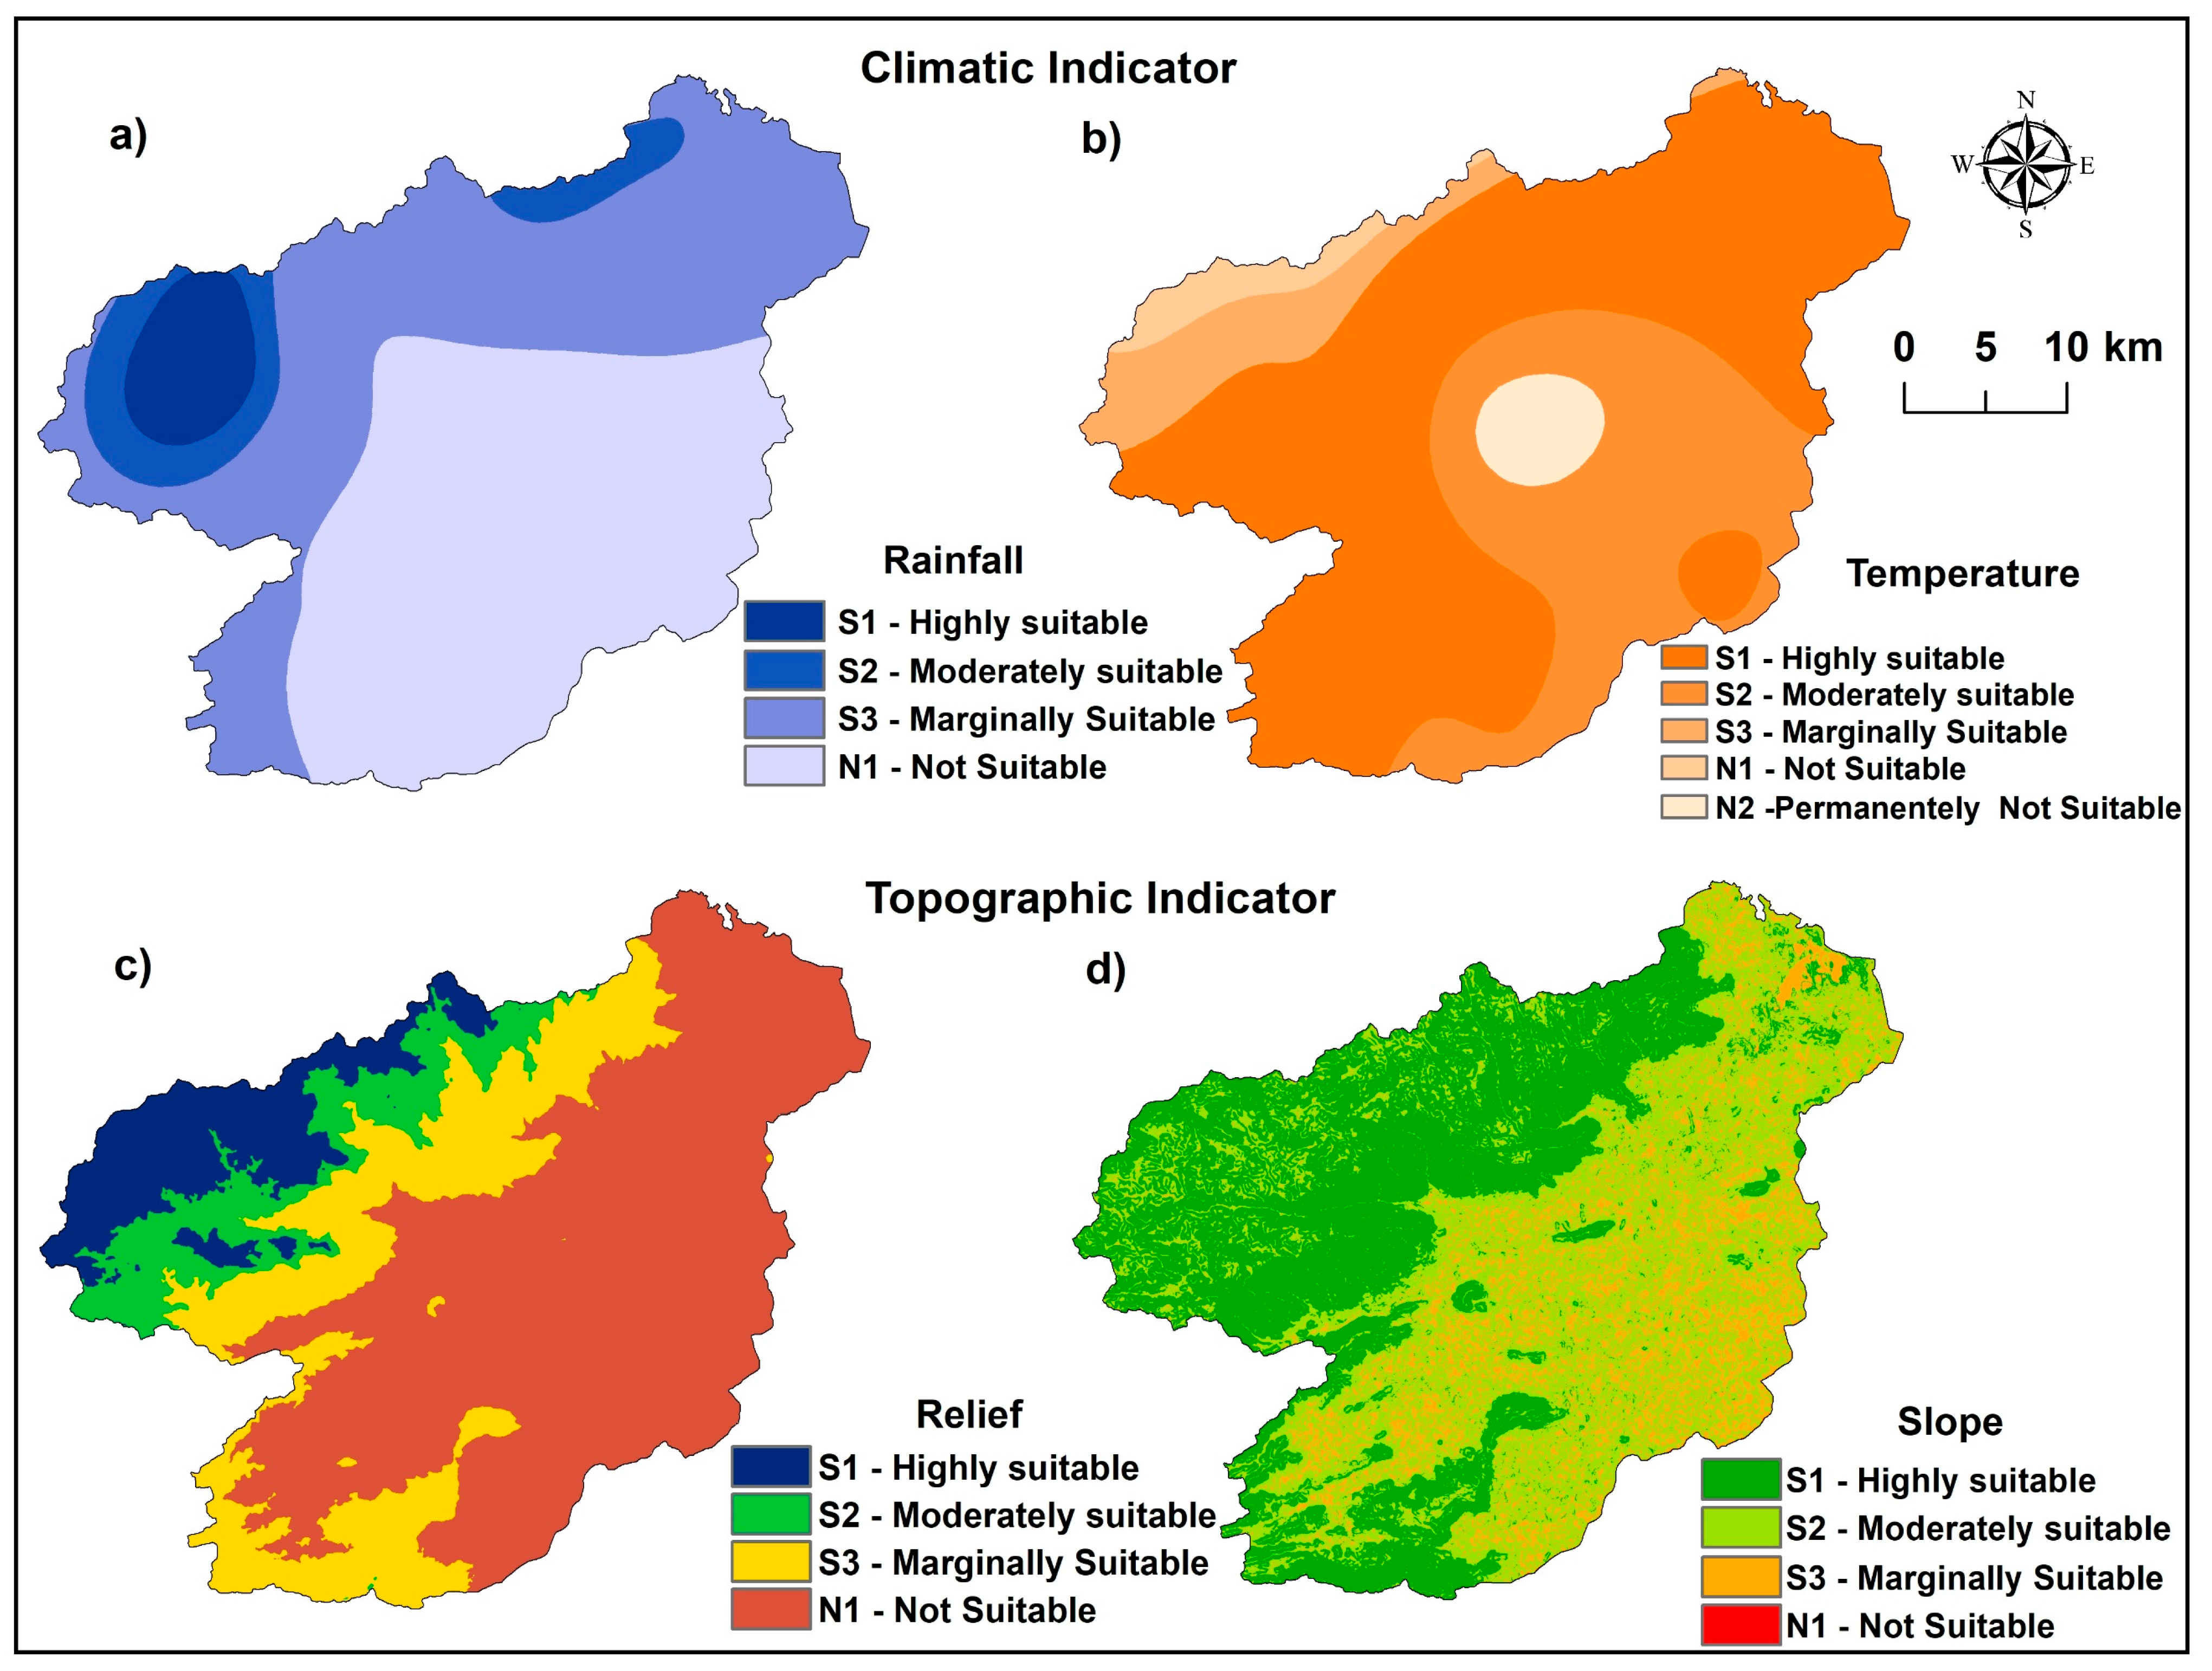
3.2.1. Climatic Indicators (Precipitation and Temperature)

Among the climatic factors, rainfall was given more importance and assigned the highest weight, as it was most suitable for tea growth. The rainfall of the study area was between <700 and >1800 mm, and was classified into four suitability classes, namely <1000 (N), 1000–1600 (S3), 1600–1800 (S2), and >1800 mm (S1); these classes covered areas of 46.8%, 41.0%, 7.1%, and 5.1%, respectively. The range of >1800 mm was allotted the highest weight within the rainfall class. The ideal temperature range for a tea plantation is 18–25 °C, and the average monthly temperature of 21.1–28.8 °C is optimal; temperature decreases below 14.9 °C and increases above 29.4 °C are likely to cause damage to tea plants. The temperature was classified into five classes, namely <15 (2.8%), 15–17 (7.5%), 17–26 (59.4%), 26–28 (26.9%), and >28 °C (3.3%), and the range of 17–26 °C was favourable for tea growth and production; the coverage areas of these classes are given in percentages. The temperature range between 17 and 26 °C was assigned the highest weight within the temperature classes. The highly suitable (S1) class covered 59.4% of the total geographic area, moderately suitable (S2) covered 26.9%, marginally suitable (S3) covered 10.31%, and not suitable (S3) covered 3.3%. The rainfall and temperature suitability classes’ spatial distribution and weights are presented in Figure 3a,b and Table 8.

3.2.2. Topographic Indicator (Relief and Slope)

The best yields were achieved at an altitude of 1500–2400 m, which was allotted a higher weight. Figure 3c,d shows that, overall, class S1 occupied 20.6% of the area, followed by S2 (11.4%), S3 (10.6%), and the not suitable class (57.4%). The slope ranges were classified into four suitability classes for tea plantations; highly suitable S1 (15–35°) covered 41.6% of the geographic area and attained the highest weight. The moderate and marginal classes covered an area of 44.3%, and 14.1% of the area was not suitable for tea plantations. Altogether, relief and slope played a similar role in the tea cultivation process; it was clearly shown that high altitudes with steep to moderate slopes were the most suitable topographical conditions for tea plantations.

3.2.3. Soil Indicators (pH, Depth, BS, EC, Drainability)

Six soil-related physiochemical parameters were selected: texture, pH (in 1:2.5), depth (in cm), base saturation (in %), electrical conductivity (in ds/m), and drainability. Their suitability class weights and their spatial distributions (Figure 4 a–f) are discussed in the following section. The most influential soil textures were the clay loam and loam categories in this region, which were assigned the overall highest normalised scores within the soil texture classes (Table 8). About 31.9% of the area was highly suitable, followed by moderately suitable (23.2%) and marginally suitable (35.8%) (Figure 4a). The preferable pH range of soil for the growth of tea is 4.5 to 5.5, falling under very strongly acidic to strongly acidic, which was allotted a higher weight. The area coverage with suitability classes of S1, S2, and S3 was 48.7, 38.8%, and 3.6%, respectively (Figure 4b). The current tea plantation area was under a suitable pH range in the study region’s upper part (Coonoor and Kothagiri areas).
For the cultivation of tea plants, very deep (>150 cm) soil was favourable and was assigned the highest weight (Table 8) among all other soil depth classes. In total, 61% of the area belonged to the highly suitable soil depth category (>150 cm) and 25.2% of the area was shared by the moderate and marginal suitability classes (50–150 cm) (Figure 4c). There was no highly suitable class of base saturation in this study area; 80% of the area was marginally suitable and 10% of the area was moderately suitable (Figure 4d) for tea plantations. Figure 4e shows the spatial distribution of the suitability classes of electrical conductivity, and their weights are given in (Table 8). The highly suitable (S1) class (non-saline to slight saline) covered 85% of the total geographic area, and 5.5% belonged to the moderately suitable class (S2). Well-drained areas were highly suitable for tea plantations and secured the highest weight, occupying an area of 16.4%. Moderately and marginally suitable classes shared areas of 25% and 37.5%, respectively (Figure 4f). In terms of soil indicators, 8.9% of the area was under settlements and waterbodies. The overall soil parameters and their characteristics are favourable to tea plantations in the Kallar watershed.

3.2.4. Environmental Indicators (Land Use and NDVI)

Figure 5a depicts the land use-based suitability classes for tea plantations in the Kallar watershed. Around 19.3% of the area belonged to the highly suitable (S1) class. The majority of this area practices tea cultivation. Tea plantations are spread in the northern part of the study area due to the suitable climatic conditions. The overall highest normalised score was given to plantations within the land use class (Table 8). About 32.1% of the area was moderately suitable (S2) and 10.3% was marginally suitable (S3). The not suitable (N) category accounted for 38.5% of the total geographic area covered by forest, settlements, mining, and waterbodies. The forest area was given the third priority weight, and all other classes were given much lower weights, which were unsuitable for tea cultivation or settlements. The current tea plantation area and fallow lands were highly important for increasing tea cultivation.
The NDVI values from 0.4 to 0.6 were scored with the highest normalised weight (Table 8) and were highly suitable (27.2%). The moderately and marginally suitable areas (Figure 5b) covered 33.0% and 38.5% of the study area, respectively. There was dense vegetation in the upper part of the watershed, and some portions were already engaged in tea cultivation.

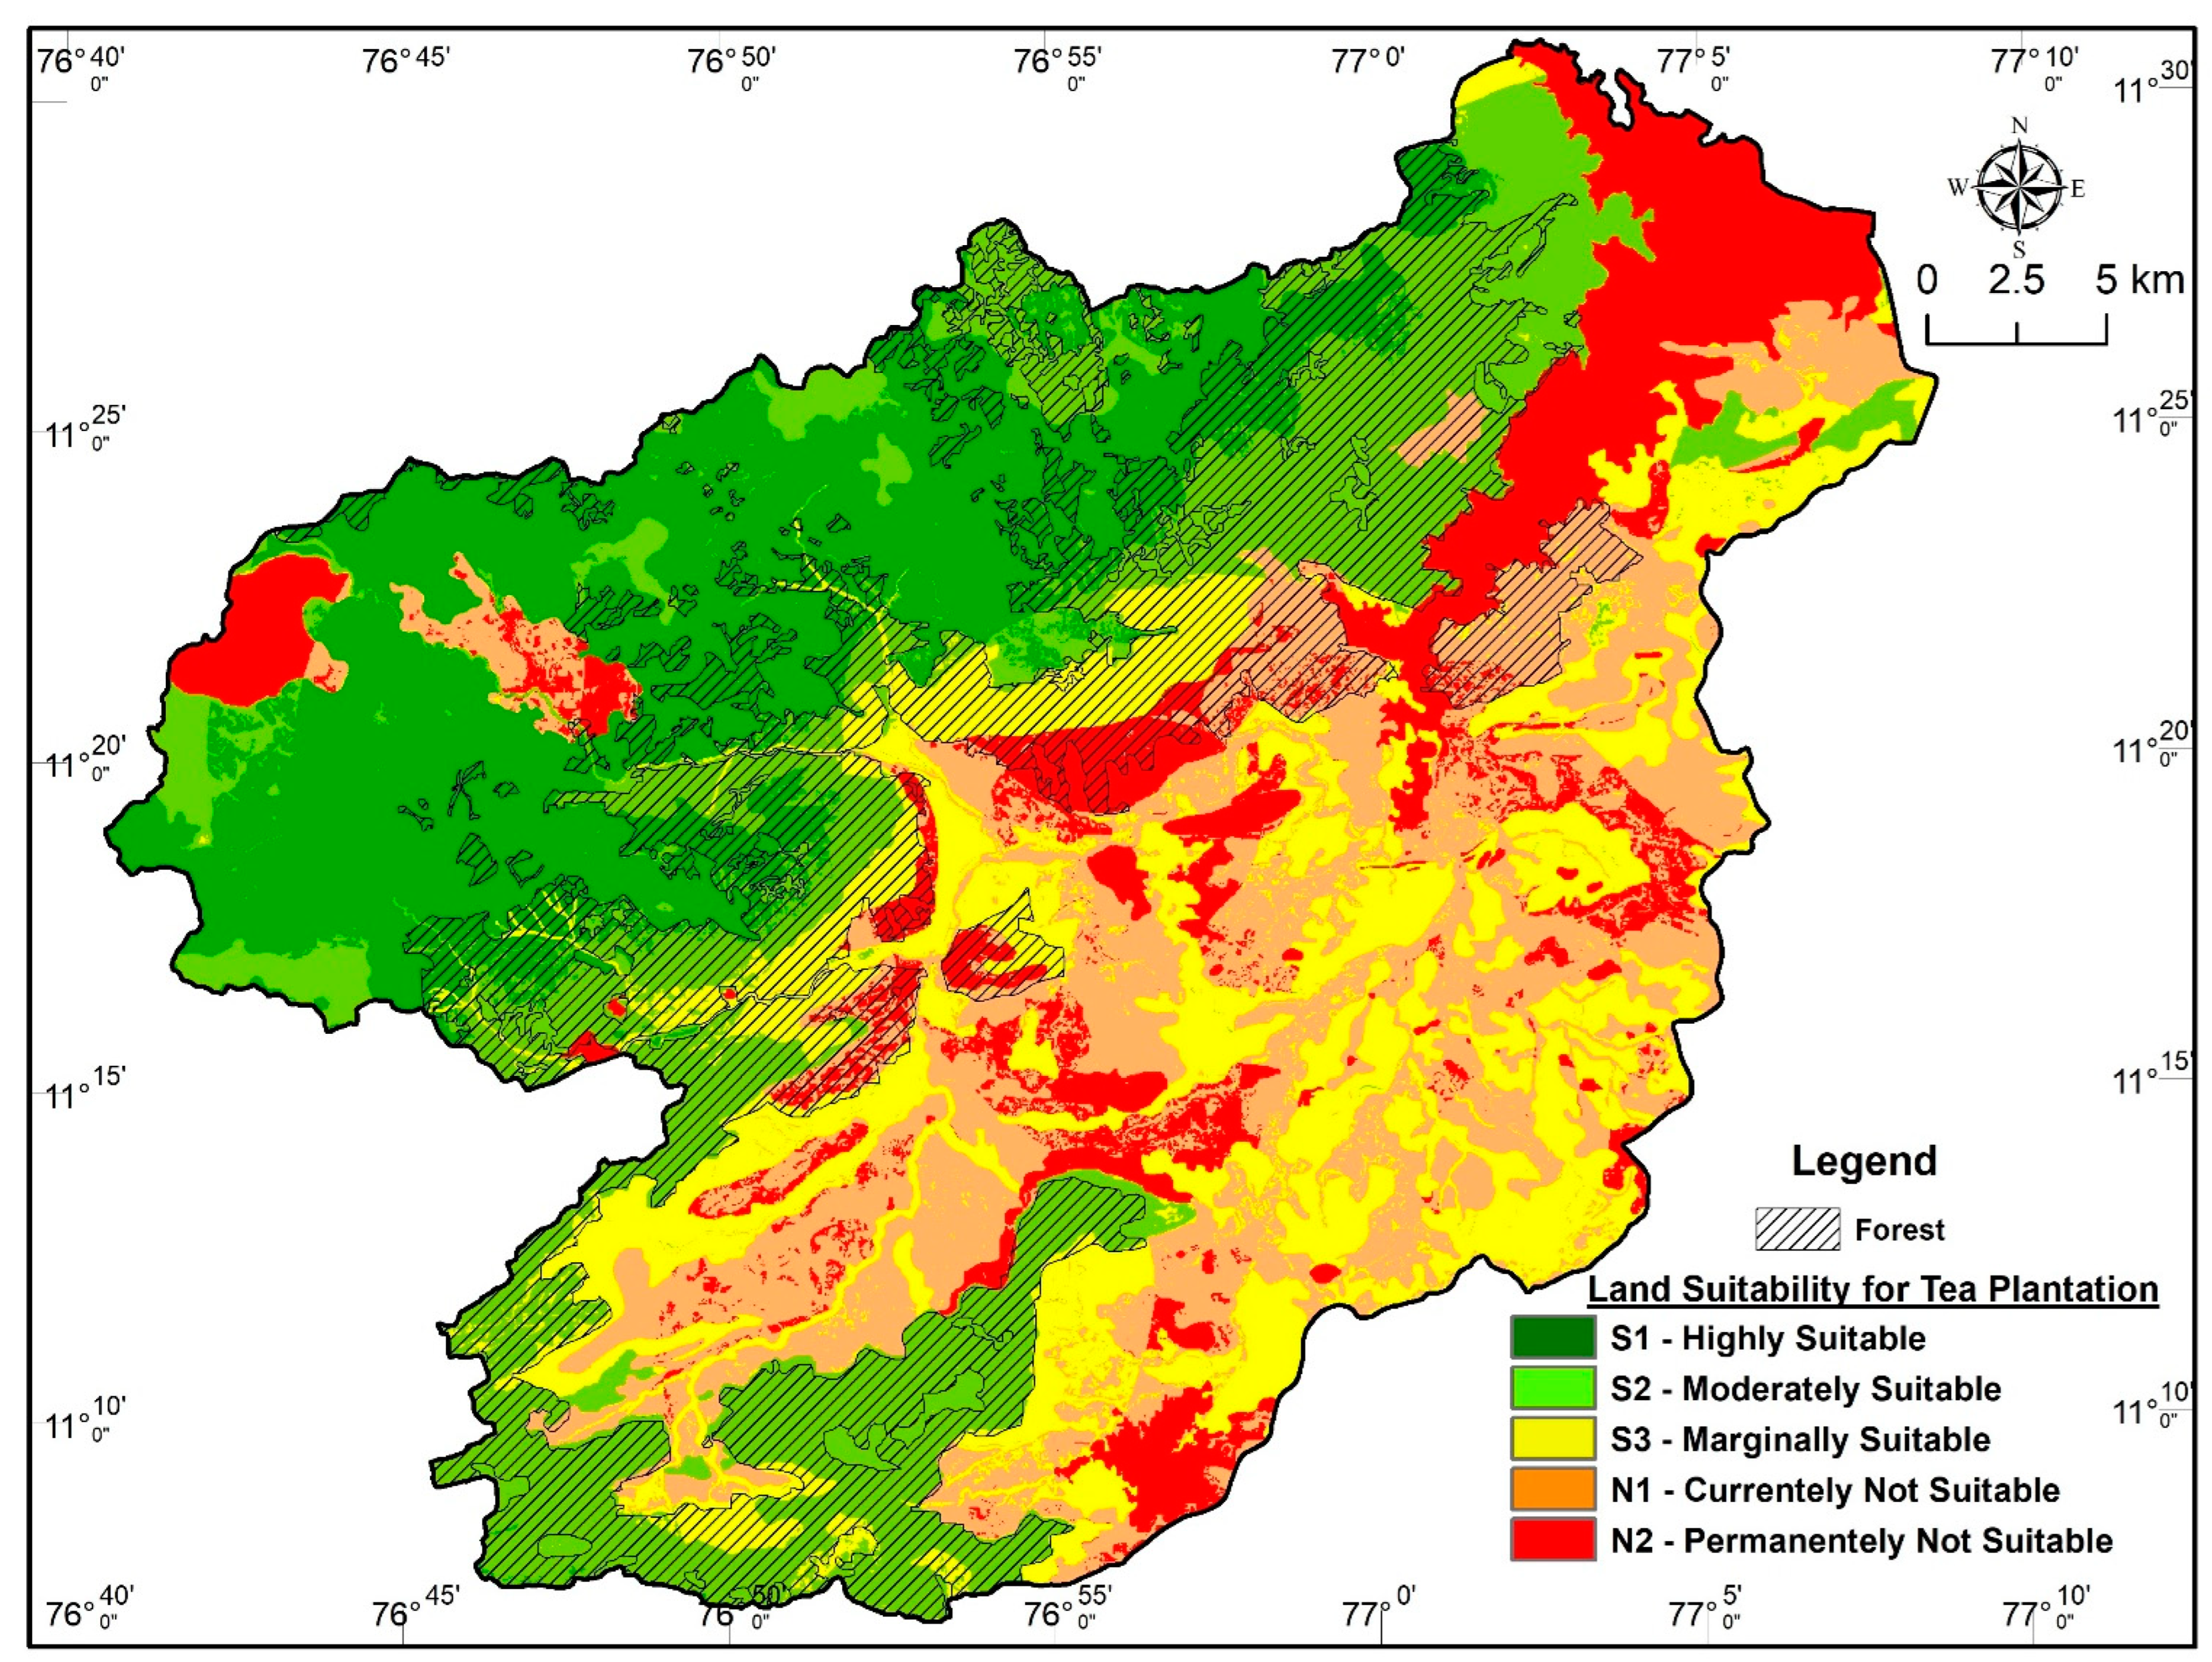
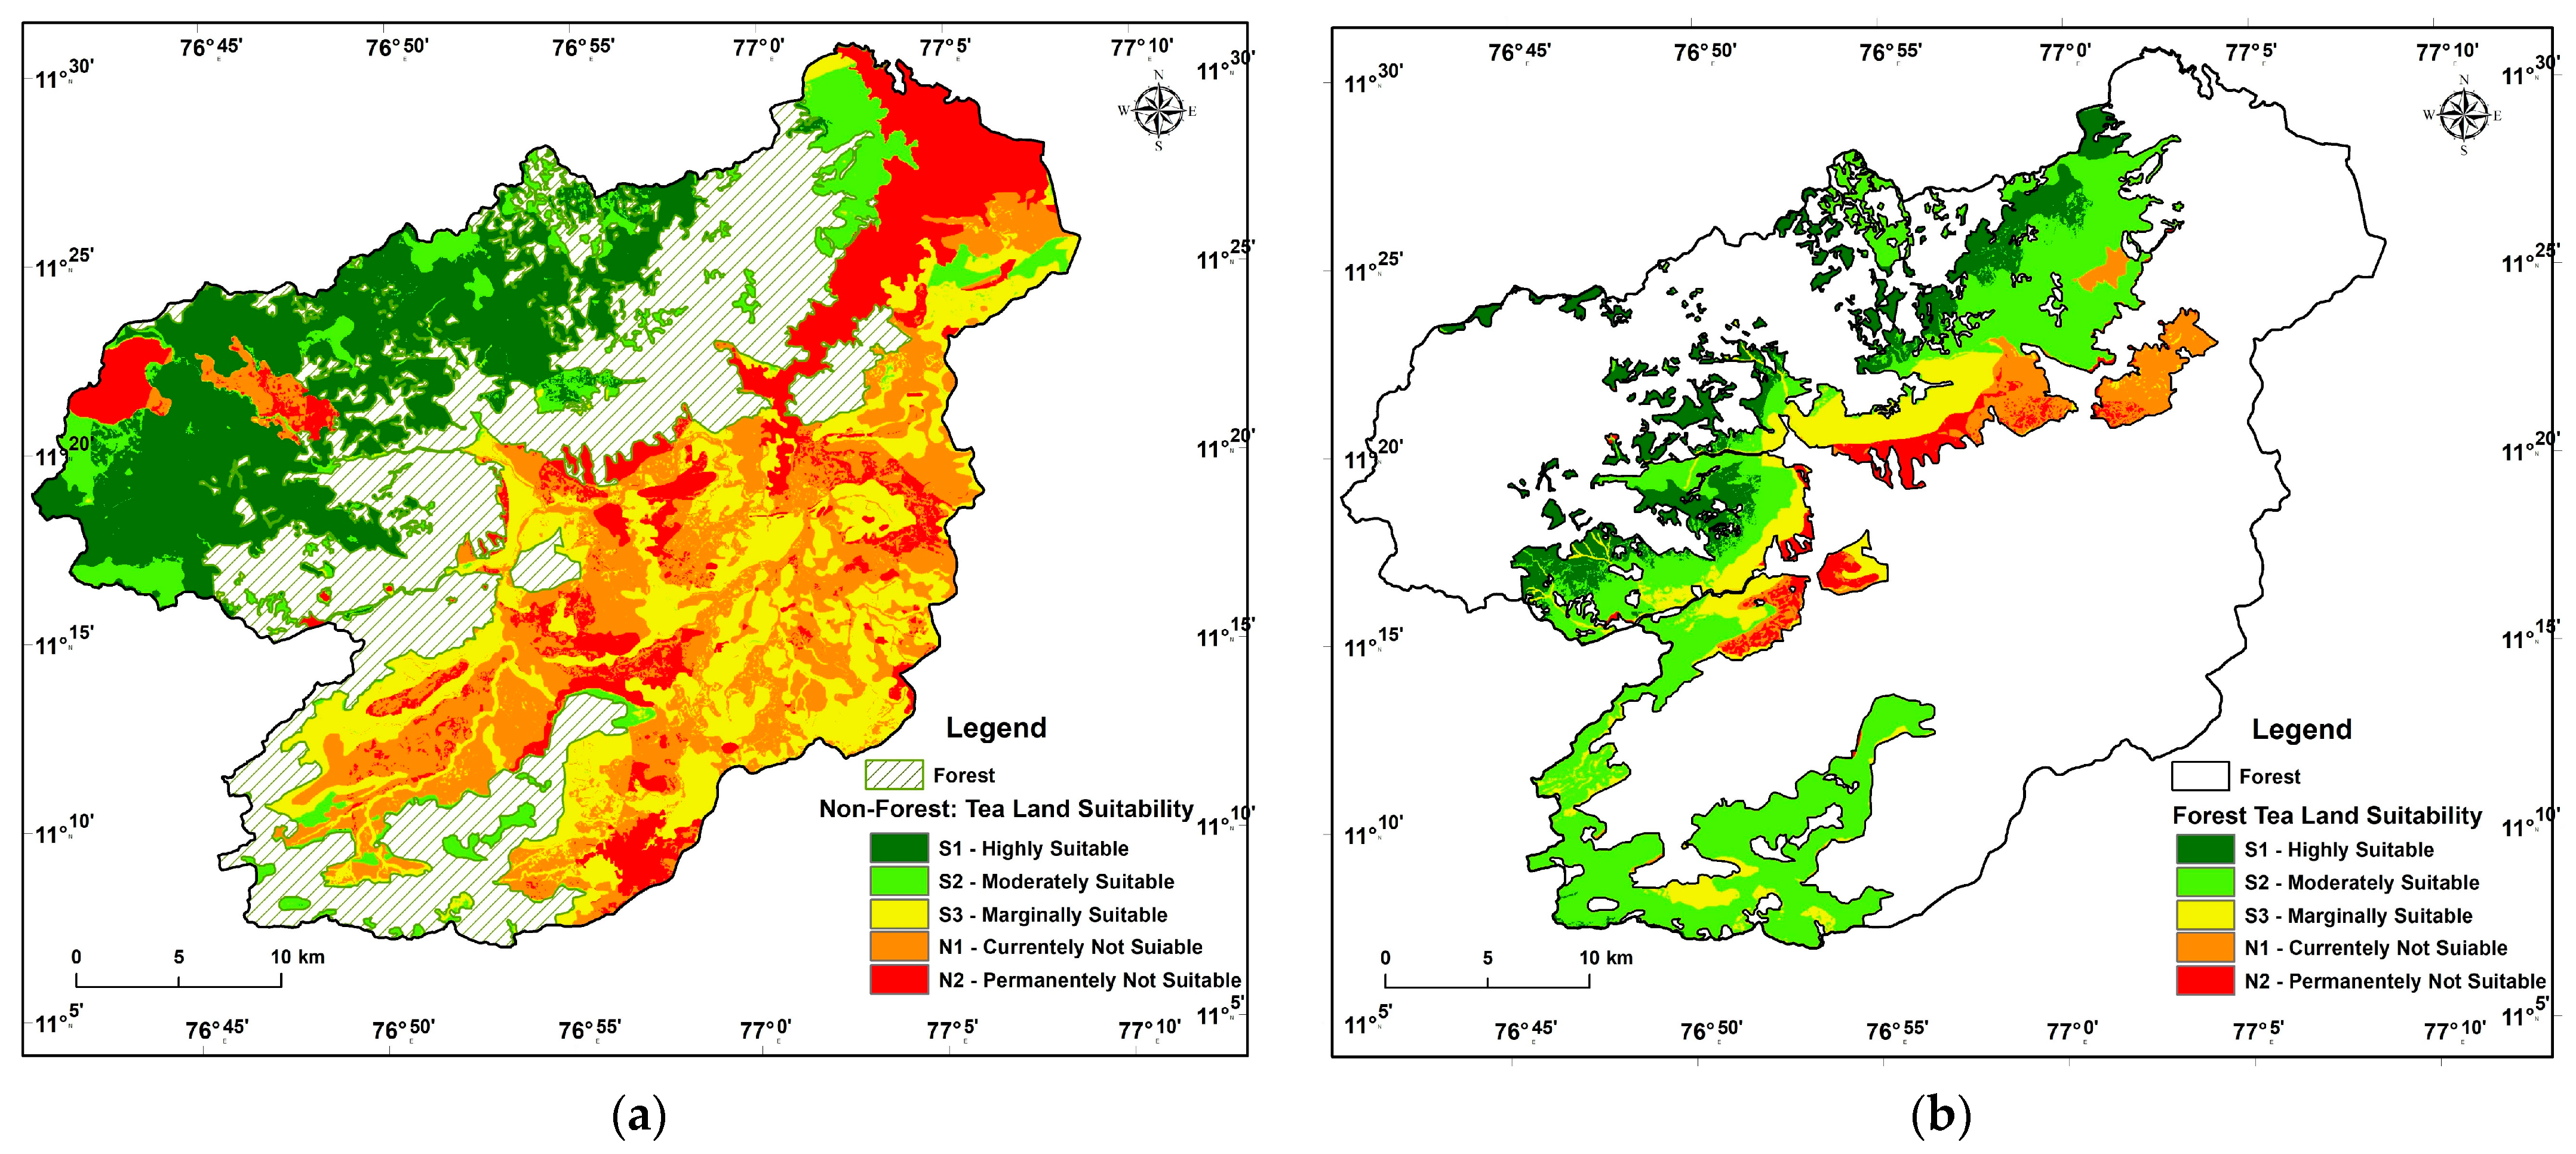
3.3. Land Suitability for Tea Plantations

The final land suitability for the tea plantation map was categorised into five suitability classes, namely highly suitable (S1), moderately suitable (S2), marginally suitable (S3), currently not suitable (N1), and permanently not suitable (N2). The classified map (Figure 6) shows that 16.76% (215.40 km2) of the investigated area was highly suitable (S1), 7.08% (91.01 km2) was moderately suitable (S2) and 16.30% (209.46 km2) was marginally suitable (S3). In total, 18.52% (237.99 km2) was currently not suitable (N1), 157.57% (157.57 km2) was permanently not suitable (N2), and 29.06% (373.45 km2) was under forest cover (Table 9). Further, land suitability classes of tea plantations within forest cover areas were also demarcated and classified. Around 18.9% (70.40 km2) of the area was highly suitable, followed by moderately suitable, marginally suitable, currently not suitable (N1), and permanently not suitable (N2), covering areas of 52.9% (197.60 km2), 14.3% (53.57 km2), 8.3% (31.05 km2), and 5.6% (20.83 km2) respectively.
Furthermore, a comparative assessment was carried out between the generated land suitability classes and land use (Table 10). The error matrix shows how much area by land use belonged to each suitability class. Within the high-suitability (S1) class, 61.5% of the area is covered by plantations, while another 24.6% is covered by forest, followed by the cropland, wasteland, and settlement categories, occupying areas of 7.2%, 3.9%, and 2.2%, respectively. In the moderate-suitability (S2) class, 9.4% of the area is covered by plantations and 68.5% is covered by forest land. About 16.2% of the area is wasteland and 5% is cropland and settlements. Likewise, in the marginally suitable class (S3), plantation covers 6.8%, forest covers 20.5%, cropland covers 26.6%, and current fallow covers 32.4% of the area. Cropland (40.5%) dominates the non-suitable class (N1), followed by current fallow land (26.2%) and existing plantations (5.9%). The permanently not suitable class (N2) predominately consists of cropland (13.2%), current fallow (12.6%), and forest (11.7%). About 10.6%, 9.4%, and 6.4% of the area are covered by wastelands, settlements, and plantations. Tea and other plantations altogether covered 17.1% of the total geographic area, of which 12% (156.5 km2) belonged to tea plantations. Table 10 clearly shows that the generated land suitability classes for tea plantations, i.e., highly suitable (S1—176 km2) and moderately suitable (S2—27.1 km2) areas, highly corresponded to the existing tea*growing areas. It is understood that other plantation areas were also suitable for tea plantations in the study area with some limitations (elevation, temperature, and soil).
Figure 7 shows the ROC plot and the trend between TRP (sensitivity) as an existing tea plantation point and FPR (specificity) as tea plantation land suitability. The curve appeared closer to the top-left corner, indicating a better classifier, and the AUC score indicates the very good test quality between the selected components.

4. Discussion

In evaluating land suitability for tea plantations or other crops, the selection of influencing factors is crucial [48,49,50,51,52,53]. In the earlier studies on the evaluation of land suitability for tea plantations, a few selected physical and climatic factors were used to assess the suitability classes [49,51,70]. Although, the present study focused on multiple indicators and sub-indicators, they were used to assess the land suitability classes for tea cultivation, providing a more reliable area for tea plantations. At the same time, the assessment of crop suitability was conducted to determine the weights of each criterion affecting land suitability. The AHP-based MCE method has been widely used for weighting criteria in crop/land suitability evaluation and site suitability assessment [30,32,33,42]. The present study upgraded the existing weighting, as it assigned weights to each level, such as major criteria (level I), sub-criteria (level II), and sub-criteria internal classes (level III). This is a unique approach to assigning weights/rankings to each criterion in this study.
Climate is a crucial factor affecting the distribution, growth, and yield of many crops [71]. Zhao [66] stated that bioclimatic variables are the crucial factors that determine the distribution of tea cultivation. Tea plantations are suitable mainly in regions with a warm and moist climate, moderate to high rainfall (over evaporation), and those regions that maintain an equal temperature throughout the greater part of the season [72]. They require annual rainfall of 1500 to 2000 mm, which should be well-distributed throughout the year. It is also important to note that prolonged dry spells and low temperatures affect the development of the leaves of tea plants. Earlier research also suggested that rainfall and temperature are essential climatic indicators for evaluating tea plantations [50,51,68,73]. The temperature intensely affects reproductive growth and photosynthesis, and has a crucial impact on the yield and quality of tea [54,74,75]. The minimum and maximum temperatures for tea plant growth are 17.5 °C and 26.5 °C [52]. This study afforded climatic factors more importance for cultivating tea plantations.
Topographical indicators are the third-most-significant factor affecting tea plantation distribution [73]. Most tea plants are grown at a wide range of higher to medium altitudes. Although high-grown teas manifest a more desirable taste, they reach certain levels where it is very cold for the plant to grow [68]. Table 8 shows the highest weights for the relief factor (0.750) among the topographic indicators. Sadeeka et.al [51] considered the slope ranges of 15–25° and >5–7° to be very highly and highly suitable for tea cultivation, respectively. In this study, slope ranges of 15–35° and 10–15° were given more importance based on the other influential factors, such as soil depth, texture, and land use. The slope of a region greatly influences the drainage system, and poor drainage conditions lead to a decline in the tea yield [76]. In this study, 50.5% of the area was highly suitable for tea cultivation. Gentle slope and flat land were considered as not suitable for tea growth, which would increase the waterlogging condition [9].
Domroe [77] stated that various types of soil with varying physical, chemical, and biological properties determine the land suitability for tea plantations. Soil properties affect soil nutrient availability, plant growth, and microbial activity. Soil pH is the most important factor, and the required value for the growth of tea is in the range of 4.5–5.5 [51,52,65]. However, in the present study, the range of 4.5–5.0 was considered as highly suitable based on the NBSS & LUP guidelines. Soil texture and pH are the important soil physicochemical parameters that determine suitability for tea cultivation. In general, an acidic soil pH is highly suitable for tea plantations. The base saturation is closely related to the cation-exchange capacity [78], which is the fraction of exchangeable cations that are base cations (Ca, Mg, K, and Na). Drainability refers to the ability of the soil and the substrata to respond to subsurface drainage [25]. The water movement in the soil is based on soil texture and permeability. Sandy or coarse-grained soil has relatively rapid permeability and good drainability, which are optimal for tea growth. Around 55.2% of the area was highly to moderately suitable.
Land use and NDVI depict the current state of land use practices and the vegetation condition. Tea plantations and forest-covered areas were the predominant land use and vegetation classes. Hence, the study area had a wide range of reserve forest and forest cover, which divided the watershed into two parts. These reserve forest areas were also considered in this analysis; many factors were suitable for growing tea plantations within forest areas, especially in the fringe zones of forest areas. The highly and moderately suitable classes (S1 and S2) were dominantly located in the west to northeastern portions because these areas receive a high amount of annual rainfall and have an adequate temperature. Additionally, the Kallar watershed is situated at an altitude above 1500 m with a very steep to steep slope gradient and loam and loamy clay soil; therefore, it has good drainability conditions, which are more suitable for tea plantations. The marginally suitable class (S3) appeared in the south–central to southeast areas, located in the foothills and low-lying areas. These areas experienced low to moderate rainfall (800 mm), high temperatures (>20 °C), and gentle to nearly level slopes. The clayey soil texture has poor drainability and has less effective soil depth (50–100 cm). These conditions are not very favourable for tea plantations. The soil is somehow suitable in this area of concern, but the climatic and topographic conditions are not favourable. Hence, these areas are most suitable for other types of plantations, such as banana, coconut, and areca nut, and crops, such as sugarcane, turmeric, ginger, and vegetables.
The maps (Figure 8a,b) depict the land suitability for tea plantations in the non-forest area and within the forest area. Most of the upper part of the forest regions is highly suitable; these areas are suitable for tea plantations and suitable for other types of plantations, such as coconut, areca nut, banana, vegetables, and eucalyptus trees. As these forest regions are rich in biodiversity by nature, these areas are needed to enrich the biodiversity and protect flora and fauna, especially in sola forests [79]. Hence, the forest region is unsuitable for implementing such plantations or any other human activities.
Furthermore, a comparative assessment was performed to check the modelled land suitability; Table 10 shows the assessment between the suitability class and land use and vice-versa. Table 10 shows that about 17.1% of the total geographic area was occupied by plantations within the high- to marginal-suitability classes, whereas 2.1% of the area was under the not-suitable class. The existing tea-grown areas and derived suitability classes were significantly and positively related. The study indicates that other classes must be considered for future tea plantations within the high- to moderate-suitability area, except for the plantation and forest areas. Generally, wasteland and current fallow land in the high-altitude areas must be focused on and promoted for the purpose of practising tea cultivation. Further, it can be clearly understood that cropland and settlement areas were converted from tea plantations within the high-suitability area. Therefore, no other transformation would be possible and the land-use type would continue to be the same.
To verify the accuracy and significance of the generated land suitability for tea plantations, it was validated with the current tea-growing areas. Two methods were employed to validate the results: (a) visual interpretation and (b) performance classification (ROC curve). Figure 9 depicts the validation of each suitability class using current satellite image LISS-IV data and Google Earth imagery. The high-suitability (S1) class exactly represented the tea plantations that were visible on the Google Earth images (Figure 9(1)). Likewise, the moderately suitable class (S2) was observed for a tea plantation along with a mixed plantation (Figure 9(2)), and the marginally suitable class (S3) was observed in the mixed forest region (Figure 9(3)). The not-suitable class (N1) fell on agricultural land and permanently not suitable (N2) land fell on the rocky outcrop and barren land areas (Figure 9(5) and Table 10). Figure 7 shows that the ROC plot’s true positive and false-positive rates had an AUC score of 0.81, which means the degree of modelled land suitability class and test quality were very good. Overall, the study shows that the area is highly favourable for tea plantations, suggesting that land is suitable for cultivation in non-forest areas. In general, the cultivation of tea plantations in a complex environment has both positive and negative impacts; hence, owing to the demand and economic development, such activities are essential. Additionally, natural reserves should be protected without hindering the present state of the environment.

5. Conclusions

The present study was conducted to evaluate the land suitability for tea plantations in the Kallar watershed of the Nilgiri Bioreserve, Tamil Nadu, using multi-criteria evaluation (MCE) through spatial analytical hierarchy process (AHP) and GIS techniques. Climate, topography, soil, and environmental indicators were used to assess the suitability of the land for tea plantations. The weights of each criterion and sub-criterion were assigned through AHP for suitability evaluation and a suitability map was generated. The highly suitable (S1), moderately suitable (S2), and marginally suitable classes covered areas of 16.7%, 7.08% and 16.3%, respectively. The suitability classes were compared with present land use and performance classifications to validate the suitability. The validation of this study secured an AUC score of 0.816, meaning that the land suitability classification was more valid (test quality was very good). Particularly, highly suitable areas fell under the Coonoor and Kothagri Taluks because of the regions’ climate, topography, soil, and environmental conditions, which are highly favourable for the cultivation of tea plantations. Hence, the cultivation of tea plantations in a new area (suitable land) is needed to conduct further evaluation before initiating such cultivation activity, especially in forests and surrounding areas. This research will assist farmers and estate owners in supporting tea cultivation and increasing their yield massively by providing high-quality tea to compete in the global market and prevent harmful diseases due to its curative properties. Additionally, it will help to restore and retain the natural environment in the Nilgiri Bioreserve.

Author Contributions

Conceptualisation, S.A.R.; methodology, S.A.R.; validation, S.A.R.; writing—original draft preparation, S.A.R.; writing—review and editing, S.A.R.; supervision S.A. All authors have read and agreed to the published version of the manuscript.

Funding

This research received no external funding.

Data Availability Statement

Not applicable.

Acknowledgments

We would like to acknowledge the Department of Geography, Bharathidasan University, and UGC—Basic Science Research Fellowship scheme—for aiding me in carrying out my research work. S.A.R. thanks the editors and anonymous reviewers for their valuable comments and suggestions. I express my sincere thanks to Nitheshnirmal and faculties of the Department of Geography, Bharathidasan University, for their support and valuable suggestions.

Conflicts of Interest

The authors declare no conflict of interest.

References

  1. Banerjee, B. Botanical classification of tea. In Tea: Cultivation to Consumption; Willson, K.C., Clifford, M.N., Eds.; Chapman and Hall: London, UK, 1992; pp. 25–51. [Google Scholar]
  2. Sealy, J. Species of Camellia in cultivation. J. R. Hortic. Soc. 1937, 62, 352–369. [Google Scholar]
  3. Baruah, D. The Tea Industry of Assam: Origin and Development; EBH Publishers: Guwahati, India, 2007. [Google Scholar]
  4. Pandey, K.B.; Rizvi, S.I. Plant polyphenols as dietary antioxidants in human health and disease. Oxidative Med. Cell. Longev. 2009, 2, 270–278. [Google Scholar] [CrossRef] [PubMed] [Green Version]
  5. Sen, G.; Bera, B. Mini Review-Black Tea as a part of daily diet: A boon for healthy living. Int. J. Tea Sci. 2013, 9, 51–59. [Google Scholar]
  6. Chung, F.L.; Schwartz, J.; Herzog, C.R.; Yang, Y.M. Tea and cancer prevention: Studies in animals and humans. J. Nutr. 2003, 13, 3268–3274. [Google Scholar] [CrossRef] [PubMed] [Green Version]
  7. Mackenzie, T.; Leary, L.; Brooks, W.B. The effect of an extract of green and black tea on glucose control in adults with type 2 diabetes mellitus: Double-blind randomised study. Metabolism 2007, 56, 1340–1344. [Google Scholar] [CrossRef]
  8. Morshedi, A.; Rahmatabadi, D.H.M. Chronic consumption of Kombucha and Black Tea prevents weight loss in diabetic rats. Iran. J. Diabetes Obes. 2010, 2, 23–26. [Google Scholar]
  9. Deka, A.; Vita, J.A. Tea and cardiovascular disease. Pharmacol. Res. 2011, 54, 136–145. [Google Scholar] [CrossRef] [Green Version]
  10. Almajano, M.P.; Carbo, R.; Jiménez, J.A.L.; Gordon, M.H. Antioxidant and antimicrobial activities of tea infusions. Food Chem. 2008, 108, 55–63. [Google Scholar] [CrossRef]
  11. Crouvezier, S.; Powell, B.; Keir, D.; Yaqoob, P. The effects of phenolic components of tea on the production of pro- and anti-inflammatory cytokines by human leukocytes in vitro. Cytokine 2011, 13, 280–286. [Google Scholar] [CrossRef]
  12. Shukla, Y.; Taneja, P. Anticarcinogenic effect of black tea on pulmonary tumors in Swiss albino mice. Cancer Lett. 2002, 176, 137–141. [Google Scholar] [CrossRef]
  13. Feizizadeh, B.; Blaschke, T. Land suitability analysis for Tabriz County, Iran: A multi-criteria evaluation approach using GIS. J. Environ. Plan. Manag. 2012, 1, 1–23. [Google Scholar] [CrossRef]
  14. Kihoro, J.; Bosco, N.J.; Murage, H. Suitability analysis for rice growing sites using a multi-criteria evaluation and GIS approach in great Mwea region, Kenya. SpringerPlus 2013, 2, 265. [Google Scholar] [CrossRef] [PubMed] [Green Version]
  15. Abdel Rahman, M.A.E.; Hegde, R.; Natarajan, A. Assessment of land suitability and capability by integrating remote sensing and GIS for agriculture in Chamarajanagar district, Karnataka, India. Egypt. J. Remote Sens. Space Sci. 2016, 19, 125–141. [Google Scholar] [CrossRef]
  16. Al-Shalabi, M.A.; Mansor, S.B.; Ahmed, N.B.; Shiriff, R. GIS Based Multicriteria Approaches to Housing site suitability assessment. In Proceedings of the XXIII FIG Congress, Munich, Germany, 8–13 October 2006. [Google Scholar]
  17. Bandyopadhyay, S.; Jaiswal, R.; Hegde, V.; Jayaraman, V. Assessment of land suitability potentials for agriculture using a remote sensing and GIS based approach. Int. J. Remote Sens. 2009, 30, 879–895. [Google Scholar] [CrossRef]
  18. Bhagat, R.; Singh, S.; Sood, C.; Rana, R.; Kalia, V.; Pradhan, S.; Immerzeel, W.; Shrestha, B. Land suitability analysis for cereal production in Himachal Pradesh (India) using Geographical Information System. J. Indian Soc. Remote Sens. 2009, 37, 233. [Google Scholar] [CrossRef]
  19. Akıncı, H.; Özalp, A.Y.; Turgut, B. Agricultural land use suitability analysis using GIS and AHP technique. Comput. Electron. Agric. 2013, 97, 71–82. [Google Scholar] [CrossRef]
  20. Chuong, H.V. Multicriteria Land Suitability Evaluation for Crops Using GIS at Community Level in Central Vietnam with case study in Thuy Bang-Thua Thien Hue province. In Proceedings of the International Symposium on Geo-Informatics for Spatial Infrastructure Development in Earth and Allied Sciences, Hanoi, Vietnam, 9–11 December 2008. [Google Scholar]
  21. Rahaman, S.A.; Aruchamy, S. GIS-based land suitability analysis for potato (Solanumtuberosum L) cultivation in Kallar Watershed, Bhavani Basin, Tamil Nadu. Sustain. Dev. Nat. Resour. 2018, 1, 3–17. [Google Scholar]
  22. Halder, J.C. Land suitability assessment for crop cultivation by using remote sensing and GIS. J. Geogr. Geol. 2013, 5, 65–74. [Google Scholar] [CrossRef]
  23. FAO. A Framework for Land Evaluation; Food and Agriculture Organization of the United Nations, Soils Bulletin 32; FAO: Rome, Italy, 1976. [Google Scholar]
  24. FAO. The State of Food and Agriculture; Food and Agriculture Organization of the United Nations, Agriculture series No. 9; FAO: Rome, Italy, 1978. [Google Scholar]
  25. FAO. Guidelines: Land Evaluation for Rainfed Agriculture; Food and Agriculture Organization of the United Nations, Soils Bulletin 52; FAO: Rome, Italy, 1983. [Google Scholar]
  26. FAO. Land Evaluation towards a Revised Framework; Food and Agriculture Organization of the United Nations; FAO: Rome, Italy, 2007. [Google Scholar]
  27. Bagherzadeh, A.; Daneshvar, M.R. Physical land suitability evaluation for specific cereal crops using GIS at Mashhad Plain, Northeast of Iran. Front. Agric. China 2011, 5, 504–513. [Google Scholar] [CrossRef]
  28. Zabel, F.; Putzenlechner, B.; Mauser, W. Global Agricultural Land Resources—A High Resolution Suitability Evaluation and Its Perspectives until 2100 under Climate Change Conditions. PLoS ONE 2014, 9, e107522. [Google Scholar] [CrossRef] [Green Version]
  29. Singha, C.; Swain, K.C. Land suitability evaluation criteria for agricultural crop selection: A review. Agric. Rev. 2016, 37, 125–132. [Google Scholar] [CrossRef] [Green Version]
  30. Raghunath, M. Application of remote sensing and GIS in urban land suitability modeling at parcel level using multi-criteria decision analysis. Indian Institute of Remote Sensing National Remote Sensing Agency Dept. of Space, Govt. of India: Debra Dun, India, 2006; unpublished work. [Google Scholar]
  31. Roy, D.; Dwivedi, D.; Vijayan, D. (Eds.) Remote Sensing Applications; National Remote Sensing Centre: Hyderabad, India, 2010.
  32. Raza, S.M.H.; Mahmood, S.A.; Khan, A.A. Delineation of Potential Sites for Rice Cultivation Through Multi-Criteria Evaluation (MCE) Using Remote Sensing and GIS. Int. J. Plant Prod. 2018, 12, 1–11. [Google Scholar] [CrossRef] [Green Version]
  33. Mustafa, A.A.; Singh, M.; Sahoo, R.N.; Ahmed, N.; Khanna, M.; Sarangi, A.; Mishra, A.K. Land suitability analysis for different crops: A multi criteria decision making approach using remote sensing and GIS. Researcher 2011, 3, 61–84. [Google Scholar]
  34. Saaty, T.L. A scaling method for priorities in hierarchical structures. J. Math. Psychol. 1977, 15, 231–281. [Google Scholar] [CrossRef]
  35. Diamond, J.; Wright, J. Design of an Integrated Spatial Information System for Multi objective Land-Use Planning. Environ. Plan. City Anal. City Sci. 1988, 15, 205–214. [Google Scholar] [CrossRef]
  36. Carver, S. Integrating Multi-Criteria Evaluation with Geographical Information Systems. Int. J. Geogr. Inf. Syst. 1991, 5, 321–339. [Google Scholar] [CrossRef] [Green Version]
  37. Eastman, J. Multi-criteria evaluation and GIS. Geogr. Inf. Syst. 1995, 1, 493–502. [Google Scholar]
  38. Malczewski, J. GIS-based multi-criteria analysis: A survey of the literature. Int. J. Geogr. Inf. Sci. 2006, 20, 703–726. [Google Scholar] [CrossRef]
  39. Saaty, T.L. An exposition on the AHP in reply to the paper’ remarks on the analytic hierarchy process. Manag. Sci. 1990, 36, 259–268. [Google Scholar] [CrossRef]
  40. Saaty, T.L.; Vargas, L.G. Models, Methods, Concepts and Applications of the Analytic Hierarchy Process; Kluwer Academic Publishers: Norwell, Australia, 2001. [Google Scholar] [CrossRef]
  41. Cengiz, T.; Akbulak, C. Application of analytical hierarchy process and geographic information systems in land-use suitability evaluation: A case study of Dümrek village (Çanakkale, Turkey). Int. J. Sustain. Dev. World Ecol. 2009, 16, 286–294. [Google Scholar] [CrossRef]
  42. Rahaman, S.A.; Aruchamy, S.; Jegankumar, R. Geospatial Approach on Landslide Hazard Zonation Mapping Using Multicriteria Decision Analysis: A Study on Coonoor and Ooty, Part of Kallar Watershed, The Nilgiris, Tamil Nadu. Int. Arch. Photogramm. Remote Sens. Spat. Inf. Sci. 2014, XL–8, 1417–1422. [Google Scholar] [CrossRef] [Green Version]
  43. Feizizadeh, B.; Blaschke, T. Landslide Risk Assessment Based on GIS Multi-Criteria Evaluation: A Case Study in Bostan-Abad County, Iran. J. Earth Sci. Eng. 2011, 1, 66–71. [Google Scholar]
  44. Feizizadeh, B.; Roodposhti, M.S.; Jankowski, P.; Blaschke, T. A GIS-based extended fuzzy multi-criteria evaluation for landslide susceptibility mapping. Comput. Geosci. 2014, 73, 208–221. [Google Scholar] [CrossRef] [PubMed] [Green Version]
  45. Teshome, A.; Halefom, A. Potential land suitability identification for surface irrigation: In case of Gumara watershed, Blue Nile basin, Ethiopia. Model. Earth Syst. Environ. 2020, 6, 929–942. [Google Scholar] [CrossRef]
  46. Chandio, I.A.; Matori, A.B. Land Suitability Analysis Using Geographic Information System (GIS) for Hillside Development: A case study of Penang Island. In Proceedings of the International Conference on Environmental and Computer Science, Singapore, 16–18 September 2011; IACSIT Press: Chengdu, China, 2011; p. 19. [Google Scholar]
  47. Kalogirou, S. Expert systems and GIS: An application of land suitability evaluation. Comput. Environ. Urban Syst. 2002, 26, 89–112. [Google Scholar] [CrossRef]
  48. Jafari, S.; Zaredar, N. Land Suitability Analysis using Multi Attribute Decision Making Approach. Int. J. Environ. Sci. Dev. 2010, 1, 441–445. [Google Scholar] [CrossRef]
  49. Li, B.; Zhang, F.; Zhang, L.W.; Huang, J.F.; Jin, Z.F.; Gupta, D.K. Comprehensive suitability evaluation of tea crops using GIS and a modified land ecological suitability evaluation model. Pedosphere 2012, 22, 122–130. [Google Scholar] [CrossRef]
  50. Chen, P.; Li, C.; Chen, S.; Li, Z.; Zhang, H.; Zhao, C. Tea Cultivation Suitability Evaluation and Driving Force Analysis Based on AHP and Geodetector Results: A Case Study of Yingde in Guangdong, China. Remote Sens. 2022, 14, 2412. [Google Scholar] [CrossRef]
  51. Jayasinghe, S.L.; Kumar, L.; Sandamali, J. Assessment of Potential Land Suitability for Tea (Camellia sinensis (L.) O. Kuntze) in Sri Lanka Using a GIS-Based Multi-Criteria Approach. Agriculture 2019, 9, 148. [Google Scholar] [CrossRef] [Green Version]
  52. Gahlod, N.S.; Binjola, S.; Ravi, R.; Arya, V.S. Land-site suitability evaluation for tea, cardamom and rubber using Geo-spatial technology in Wayanad district, Kerala. J. Appl. Nat. Sci. 2017, 9, 1440–1447. [Google Scholar] [CrossRef] [Green Version]
  53. Kamau, D.M.; Spiertz, J.H.J.; Oenema, O. Carbon and nutrient stocks of tea plantations differing in age, genotype and plant population density. Plant Soil 2008, 307, 29. [Google Scholar] [CrossRef] [Green Version]
  54. Gunathilaka, R.P.D.; Smart, J.C.R.; Fleming, C.M.; Syezlin, H. The impact of climate change on labour demand in the plantation sector: The case of tea production in Sri Lanka. Aust. J. Agric. Resour. Econ. 2018, 62, 480–500. [Google Scholar] [CrossRef]
  55. Chakhar, S.; Mousseau, V. Multicriteria Decision Making, Spatial. In Encyclopedia of GIS; Springer: Boston, MA, USA, 2008. [Google Scholar]
  56. Chakhar, S.; Mousseau, V. Multicriteria Decision Making, Spatial. In Encyclopedia of GIS; Springer: Boston, MA, USA, 2015. [Google Scholar]
  57. Jiang, H.; Eastman, J.R. Application of fuzzy measures in multi-criteria evaluation in GIS. Int. J. Geogr. Inf. 2000, 14, 173–184. [Google Scholar] [CrossRef]
  58. Zhu, X.; Dale, A.P. Java AHP: A web-based decision analysis tool for natural resource and environmental management. Environ. Model. Softw. 2001, 16, 251–262. [Google Scholar] [CrossRef]
  59. Jacek, M.; Rinner, C. Multicriteria Decision Analysis in Geographic Information Science; Springer: New York, NY, USA, 2015. [Google Scholar]
  60. Saaty, T.L. Decision making with the analytic hierarchy process. Int. J. Serv. Sci. 2008, 1, 83–98. [Google Scholar] [CrossRef] [Green Version]
  61. Saaty, T.L. The Analytic Hierarchy Process; McGraw Hill International: New York, NY, USA, 1980. [Google Scholar]
  62. Triantaphyllou, E.; Mann, S.H. Using the Analytic Hierarchy Process for Decision Making in Engineering Applications: Some Challenges. Int. J. Ind. Eng. Appl. Pract. 1995, 2, 35–44. [Google Scholar]
  63. Jayathilaka, P.M.S.; Soni, P.; Perret, S.R.; Jayasuriya, H.P.W.; Salokhe, V.M. Spatial assessment of climate change effects on crop suitability for major plantation crops in Sri Lanka. Reg. Environ. Change 2012, 12, 55–68. [Google Scholar] [CrossRef]
  64. Bhagat, R.; Baruah, R.D.; Safique, S. Climate and tea (Camellia sinensis (L.) O. Kuntze (20110) production with special reference to North Eastern India: A review. J. Environ. Res. Dev. 2010, 4, 1017–1028. [Google Scholar]
  65. Jinadasa, L.; Dimantha, S. Land Suitability Evaluation and Land Use Study of the Matara District; Agrarian Research and Training Institute: Colombo, Sri Lanka, 1981. [Google Scholar]
  66. Kenzong, B.; Bitondo, D.; Tamfuh, P.A.; Kameni, G.S.K.; Vounang, J.G.; Enang, R.K.; Temgoua, E.; Bitom, D. Land Suitability Assessment for Maize (Zea mays L.) Production using Integrated DEMATEL-ANP Model and GIS in the Foumbot Agricultural Basin (Cameroon Western Highlands). J. Agron. Agric. Sci. 2022, 5, 30. [Google Scholar]
  67. Das, A.C.; Noguchi, R.; Ahamed, T. Integrating an Expert System, GIS, and Satellite Remote Sensing to Evaluate Land Suitability for Sustainable Tea Production in Bangladesh. Remote Sens. 2020, 12, 4136. [Google Scholar] [CrossRef]
  68. Naidu, L.G.K.; Ramamurthy, V.; Challa, O.; Hegde, R.; Krishnan, P. Manual Soil-Site Suitability Criteria for Major Crops; NBSS Pub.; NBSS & LUP: Nagpur, India, 2006; Volume 118. [Google Scholar]
  69. Zhao, Y.; Zhao, M.; Zhang, L.; Wang, C.; Xu, Y. Predicting Possible Distribution of Tea (Camellia sinensis L.) under Climate Change Scenarios Using MaxEnt Model in China. Agriculture 2021, 11, 1122. [Google Scholar] [CrossRef]
  70. Chanhda, H.; Wu, C.F.; Ye, Y.M.; Ayumi, Y. GIS based land suitability assessment along Laos-China border. J. For. Res. 2010, 21, 343–349. [Google Scholar] [CrossRef]
  71. Bellard, C.; Bertelsmeier, C.; Leadley, P.; Thuiller, W.; Courchamp, F. Impacts of climate change on the future of biodiversity. Ecol. Lett. 2012, 15, 365–377. [Google Scholar] [CrossRef] [PubMed] [Green Version]
  72. Eden, T. Studies in the Yield of Tea. I. The Experimental Errors of Field Experiments with Tea. J. Agric. Sci. 1931, 21, 547–573. [Google Scholar] [CrossRef]
  73. Amarathunga, S.; Panabokka, C.R.; Pathiranage, S.; Amarasinghe, I. Land Suitability Classification and mapping of Tea Lands in Ratnapura District. Sri Lanka. J. Tea Sci. 2008, 73, 1–10. [Google Scholar]
  74. Yi, Y.J.; Cheng, X.; Yang, Z.F.; Zhang, S.H. Maxent modeling for predicting the potential distribution of endangered medicinal plant (H. riparia Lour) in Yunnan, China. Ecol. Eng. 2016, 92, 260–269. [Google Scholar] [CrossRef]
  75. Lou, W.; Sun, S.; Wu, L.; Ke, S. Effects of climate change on the economic output of the Longjing-43 tea tree, 1972–2013. Int. J. Biometeorol. 2014, 59, 593–603. [Google Scholar] [CrossRef]
  76. Khormali, F.; Ayoubi, S.; Foomani, F.K.; Fatemi, A. Tea yield and Soil properties as affected by slope position and aspect in Lahijan area. Iran. Int. J. Plant Prod. 2007, 1, 99–111. [Google Scholar]
  77. Domroes, M. Monsoon and land use in Sri Lanka. GeoJournal 1979, 3, 179–192. [Google Scholar] [CrossRef]
  78. Turner, R.C.; Clark, J.S. Lime potential in acid clay and soil suspensions. Trans. Comm. II IV Int. Soc. Soil Sci. 1966, 208–215. [Google Scholar]
  79. Rahaman, S.A.; Venkatesh, R. Application of remote sensing and google earth engine for monitoring environmental degradation in the Nilgiri biosphere reserve and its ecosystem of Western Ghats, India. Int. Arch. Photo. Remote Sens. Spatial Inf. Sci. 2020, XLIII–B3, 933–940. [Google Scholar] [CrossRef]
Figure 1. Location—physical and cultural setting of the study area.
Geographies 02 00043 g001
Figure 2. Suitability thematic layers for tea plantations: (a) rainfall, (b) temperature, (c) relief, (d) slope, (e) texture, (f) soil pH, (g) soil depth, (h) base saturation, (i) soil EC, (j) soil drainage, (k) land use, (l) NDVI.
Geographies 02 00043 g002
Figure 3. Suitability classes of the climatic indicators (a) rainfall and (b) temperature, and topographic indicators (c) relief and (d) slope.
Geographies 02 00043 g003
Figure 4. Suitability classes of soil indicators: (a) soil texture, (b) soil pH, (c) soil depth, (d) base saturation, (e) soil EC, and (f) soil drainage.
Geographies 02 00043 g004
Figure 5. Suitability classes of environmental indicators: (a) land use and (b) NDVI.
Geographies 02 00043 g005
Figure 6. Land suitability for tea plantations.
Geographies 02 00043 g006
Figure 7. ROC plot and AUC score of land suitability for tea plantations.
Geographies 02 00043 g007
Figure 8. Land suitability for tea plantations under (a) non-forest areas and (b) forest areas.
Geographies 02 00043 g008
Figure 9. Comparative validation. (a) Resultant suitability layer, (b) LISS 4 satellite image, and (c) Google Earth image. Each circle depicts the comparative suitability classes, 1: highly suitable (S1), 2: moderately suitable (S2), 3: marginally suitable (S3), 4: currently not suitable (N1), 5: permanently not suitable (N2), and 6: Mixed suitability classes.
Geographies 02 00043 g009
Table 1. Saaty rating scales for criterion weights and ranks [39].
ScalesDegree of PreferencesDescriptions
1EquallyTwo activities contribute equally to the objective.
3ModeratelyExperience and judgment slightly to moderately favour one activity over another.
5StronglyExperience and judgment strongly or essentially favour one activity over another.
7Very stronglyAn activity is strongly favoured over another and its dominance is demonstrated in practice.
9ExtremelyThe evidence of favouring one activity over another is of the highest degree possible of an affirmation.
2, 4, 6, 8Intermediate valuesUsed to represent compromises between the preferences with weights of 1, 3, 5, 7, and 9.
Table 2. Soil site suitability criteria (crop requirements) for tea cultivation.
Soil Site CharacteristicsRating
Major CharacteristicsFactorsUnitHighly Suitable (S1)Moderately Suitable (S2)Marginally Suitable (S3)Not Suitable (N)
Climatic regimeMean temperature in the growing season°C18–2526–28, 15–1729–30, 13–14>30, <13
Total rainfallmm1800–20001600–18001000–1600<1000
Land qualityLand characteristics
Oxygen availability to rootsSoil drainageClassWell-drainedMod. to imperfectlyPoorly-
Nutrient availabilityTextureClasssci, I, cl, sl. silc, sicl, sicc(ss), Is, s-
pHRatio 1:2.54.5–5.05.1–6.0, 4.4–4.06.1–6.5, <4.0>6.5
BS%<3030–50<50-
Rooting conditionsEffective soil depthcm>150100–15050–100<50
Soil toxicitySalinity (EC saturation ex)dS/mNon-saline<1.01.0–2.0-
Source: NBSS & LUP 2006 [68].
Table 3. Pair-wise comparison matrix of criteria.
Level I CriteriaClimaticTopographicSoilEnvironmentalEigenvector
Climatic121/340.219
Topographic1/211/740.139
Soil37160.581
Environmental1/4¼1/610.061
λmax = 4.2259CI = 0.075CR = 0.084 1
Table 4. Pair-wise comparison matrix of the sub-criteria for climate.
Sub-Criteria—ClimateTemperatureRainfallEigenvector
Temperature1½0.333
Rainfall210.667
λmax = 2.000CI = 0.00CR = 0.001
Table 5. Pair-wise comparison matrix of the sub-criteria for topography.
Sub-Criteria—TopographyReliefSlopeEigenvector
Relief130.750
Slope1/310.250
λmax = 2.000CI = 0.00CR = 0.001
Table 6. Pair-wise comparison matrix of the sub-criteria for soil.
Sub-Criteria—SoilSoil pHSoil TextureSoil DepthSoil BSSoil EcSoil DrainageEigenvector
Soil pH11/323220.208
Soil texture3123320.315
Soil depth1/21/212230.176
Soil BS1/31/31/21220.116
Soil Ec1/21/31/21/211/30.072
Soil drainage1/21/21/31/2310.114
λmax = 6.4957CI = 0.099CR = 0.080 1
Table 7. Pair-wise comparison matrix of sub-criteria for environment.
Sub-Criteria—EnvironmentLULCNDVIEigenvector
LULC120.667
NDVI1/210.333
λmax = 2.000CI = 0.00CR = 0.001
Table 8. Criteria and sub-criteria weights.
Level ILevel IILevel IIIArea in Sq.kmWeightOverall Weight
Climatic indicator
W1 = 0.219
Rainfall
W11 = 0.677
  • <1000
  • 1000–1600
  • 1600–1800
  • >1800
602.97
527.56
91.49
66.18
W111
W112
W113
W114
0.096
0.161
0.277
0.466
0.014
0.024
0.041
0.069
Temperature
W12 = 0.333
  • <15    S3
  • 15–17   S3
  • 17–26   S1
  • 26–28   S2
  • 28      N1
36.19
96.97
765.35
346.88
42.82
W121
W122
W123
W124
W125
0.099
0.149
0.434
0.233
0.084
0.007
0.011
0.031
0.017
0.006
Topographic indicator
W2 = 0.139
Relief
W21 = 0.750
  • 500
  • 500–800
  • 800–1100
  • 1100–1500
  • 1500–1800
  • 1800–2500
739.21
136.44
71.78
75.70
124.49
140.55
W211
W212
W213
W214
W215
W216
0.048
0.066
0.095
0.152
0.235
0.404
0.005
0.007
0.010
0.016
0.024
0.042
Slope
W22 = 0.250
  • 1–3
  • 3–5
  • 5–10
  • 10–15
  • 15–35
172.74
181.37
252.87
109.19
510.69
W221
W222
W223
W224
W225
0.062
0.099
0.161
0.262
0.416
0.002
0.003
0.006
0.009
0.014
Soil indicator
W3= 0.581
Soil texture
W31 = 0.315
  • Clay
  • Clay loam
  • Loam
  • Loamy sand
  • Sandy clay
  • Sandy clay loam
  • Sandy loam
  • Settlement/waterbody
103.40
114.82
96.24
84.58
273.96
299.43
200.85
114.17
W311
W312
W313
W314
W315
W316
W317
W318
0.067
0.281
0.198
0.057
0.089
0.104
0.174
0.030
0.012
0.052
0.036
0.010
0.016
0.019
0.032
0.006
Soil pH
W32 = 0.208
  • Slight alkaline
  • Moderately alkaline
  • Strongly alkaline
  • Settlement/waterbody
627.20
499.74
46.35
114.17
W321
W322
W323
W324
0.619
0.198
0.123
0.059
0.075
0.024
0.015
0.007
Soil depth
W33 = 0.176
  • <50
  • 50–100
  • 100–150
  • >150
  • Settlement/waterbody
837.88
153.79
170.24
11.37
114.17
W331
W332
W333
W334
W335
0.096
0.157
0.269
0.423
0.056
0.010
0.016
0.027
0.043
0.006
Soil base saturation
W34 = 0.116
  • 30–50
  • >50
  • Settlement/waterbody
132.32
1041.57
114.29
W341
W342
W343
0.575
0.366
0.059
0.039
0.025
0.004
Soil Ec
W35 = 0.072
  • Slightly saline
  • Moderately saline
  • Settlement/waterbody
1102.02
71.26
114.17
W351
W352
W353
0.575
0.366
0.059
0.024
0.015
0.002
Soil drainability
W36 = 0.114
  • Well-drained
  • Mod. to imperfectly drained
  • Poorly drained
  • Ex-poorly drained
  • Settlement/waterbody
211.03
321.69
484.98
156.21
114.29
W361
W362
W363
W364
W365
0.489
0.309
0.104
0.056
0.042
0.032
0.020
0.007
0.004
0.003
Environmental indicator
W4 = 0.061
Land use/land cover
W41 = 0.667
  • Barren and rocky
  • Built-up
  • Cropland
  • Current fallow
  • Forest
  • Mining
  • Plantation
  • Wasteland
  • Waterbody
1.38
44.85
231.69
181.22
374.65
1.00
248.92
130.80
73.58
W411
W412
W413
W414
W415
W416
W417
W418
W419
0.022
0.028
0.249
0.139
0.077
0.042
0.339
0.054
0.049
0.001
0.001
0.010
0.006
0.003
0.002
0.014
0.002
0.002
NDVI
W42 = 0.333
  • No vegetation
  • Moderately shallow
  • Shallow
  • Very shallow
16.46
495.88
425.10
350.76
W421
W422
W423
W424
0.057
0.122
0.263
0.558
0.001
0.002
0.005
0.011
Total1285.89 1
Table 9. Land suitability index and classes for tea plantations.
Suitability IndexSuitability ClassArea in Sq. kmArea in %Limitation
0.00–0.165Highly suitable (S1)215.4016.76Land has no significant limitations to sustained application
0.165–0.194Moderately suitable (S2)91.017.08Land has moderate limitations, which is closer to forest regions, and needs a best/practice method.
0.194–0.240Marginally suitable (S3)209.4616.30Marginal limitations are present in these land areas, which affect sustained application (e.g., terrain and slope are not very favourable)
0.240–0.293Currently not suitable (N1)237.9918.52Land has many limitations because the climatic and topographic conditions are not suited for tea plantations
0.293–0.401Permanently not suitable (N2)157.5712.26Settlements, waterbodies, and barren rock
Forest373.4529.06(Restricted/protected area)
Total1285.89100
Table 10. Area comparison between land suitability classes (tea) and land use in 2015.
Land Use/Suitability ClassBarren RockyBuilt-UpCroplandCurrent FallowForestMiningTea and Other PlantationWastelandWaterbodyTotal
Highly suitable (S1)0.06.320.50.670.40.0176.011.30.7286.0
Moderately suitable (S2)0.04.87.81.9197.40.027.146.72.6288.4
Marginally suitable (S3)0.26.870.085.153.80.517.825.82.9262.8
Currently Not suitable (N1)0.810.2109.470.631.30.015.927.83.9269.9
Permanently Not suitable (N2)0.416.723.622.520.80.611.418.963.3178.0
Total area (in sq. km)1.444.7231.3180.8373.81.0248.2130.573.51286
Note: The bold values indicate the suitable (Blue) and non-suitable (Red) areas for tea plantations from the existing land use classes.
Publisher’s Note: MDPI stays neutral with regard to jurisdictional claims in published maps and institutional affiliations.

