Abstract
Spatial scale in modeling is one of the most important aspects of any kind of assessment. This study utilized previously studied assessments of geodiversity through a qualitative–quantitative methodology for geosite recognition. Our methodology was developed based on geodiversity as a complex description of all elements of abiotic nature and processes, influencing it. Based on this definition, geodiversity can be divided into main elements: geology and geomorphology, creating a core of abiotic nature; and additional elements including hydrology, climate, and human influences. We include this description of geodiversity here to emphasize the data which were used in the assessment. The methodology was based on an evaluation system, subject to improvements informed by previous research, and map-based models showing the area of spreading of calculated elements. Except for additional changes in the assessment, this article primarily addresses the problem of scale, by comparing two different methods of scale in the research: grid and non-grid. Grid types of assessment are considered a widely useable method, requiring definitions of areas of research with a potential variety of polygons, and calculating elements inside the cell and applying values to each cell. In contrast, non-grid assessment utilizes the natural borders of all elements (e.g., map view pattern of geological formations), and including them in calculations. The union of layers from different elements creates shapes which highlight regions with the highest values. Hence, the goal of this article is to demonstrate differences between grid and non-grid assessments of geodiversity in Western Samoa. In our results, we compare the methods and emphasize specific tasks most suitable for each method.
1. Introduction
Assessment of the values of abiotic nature is a widely pursued goal worldwide to provide an objectively determined spatial distribution of such elements [1,2,3,4,5,6,7]. Many researchers are concentrating on understanding and describing geodiversity of the environment, because this knowledge underlies biodiversity and humanity’s connection to the Earth itself. Biodiversity is underlain by an abiotic foundation. This foundation is continuously evolving and shaped by human societies towards their convenience and needs. Meanwhile, humanity uses abiotic nature as it does flora and fauna, but with a higher rate of alteration and through the provision of needs. This significance of geodiversity for humanity has been accurately described by Grey who questions “Geodiversity and geoconservation: what, why, and how?” [8], stating unliving nature is not just a location providing needs for survival (economic and functional values), but also providing a range of “supernatural” (non-material) values such as cultural and aesthetic benefits. This demonstrates the significance of geodiversity for understanding the evolution of the environment.
The latest research in this topic shows that geodiversity includes a range of elements such as: geology, geomorphology, climate, hydrology, human and biological footprints, and tectonic processes. In addition, soils, as an element of abiotic nature, are also considered as transit zones where geodiversity adjoins biodiversity [9]. Geological and geomorphological elements should be viewed as two main parameters underlying geodiversity as foundational elements of the abiotic environment. Other elements are the results of weathering and/or erosion processes or altered rock material [4,10]. Even though hydrology is considered a process, it should be studied as another main parameter of geodiversity. However, this assessment of geodiversity concentrates on geosite recognition for the utilization of its role within the geosystem services (e.g., geotourism) rather than providing a complete geodiversity model. The methodology utilizes two core parameters, geology (quality) and geomorphology (form), which can be evaluated to identify the most valuable locations.
A geosite is defined as a location with significant information preserved within associated geological formations [4]. The identification of such locations is a key goal of qualitative–quantitative geodiversity assessments, because areas of research contain many different types of information, which may be mostly unreadable from the surface during observation. To find these places of significance, accurate observational research of the defined area must be undertaken on all levels, beginning with the literature, and mapping observations with direct on-site field observations of potential sites. However, significant technological innovations and developments can assist the assessment. For example, digital mapping provides tools to collect and calculate all available spatial data and highlight locations requiring further observation and research, reducing the areas of field observation to some specific places. Gathering and analyzing these data can thus demonstrate the significance of a site within the context of Earth’s history, and inform plans to preserve and manage sites in order to spread knowledge of geodiversity and provide opportunities for communities to engage with the geological stories of their land [11,12]. In conclusion, in assessments of geodiversity, digital technology can be utilized to define, assess, and subsequently manage potential geosites in a more objective, efficient, and faster way.
The type of assessment of geodiversity is a significant consideration when utilizing GIS (geographical information systems), because digital calculations require data, being highly dependent on the methodology and aim of research. A qualitative–quantitative method of geodiversity assessment [4,10,13], requiring a relatively low amount of information, utilizing a standard geological map and SRTM (Shuttle Reader Topography Mission) model [14], can be used to highlight the most significant places of research. However, its accuracy depends on the quality of the data and evaluation system. Utilizing this methodology and data from previous research on Western Samoa (Southwest Pacific) [4], this assessment further applies improvements in evaluation systems, and demonstrates an issue with previous grid scaling systems in comparison with a non-grid methodology [2,3,7].
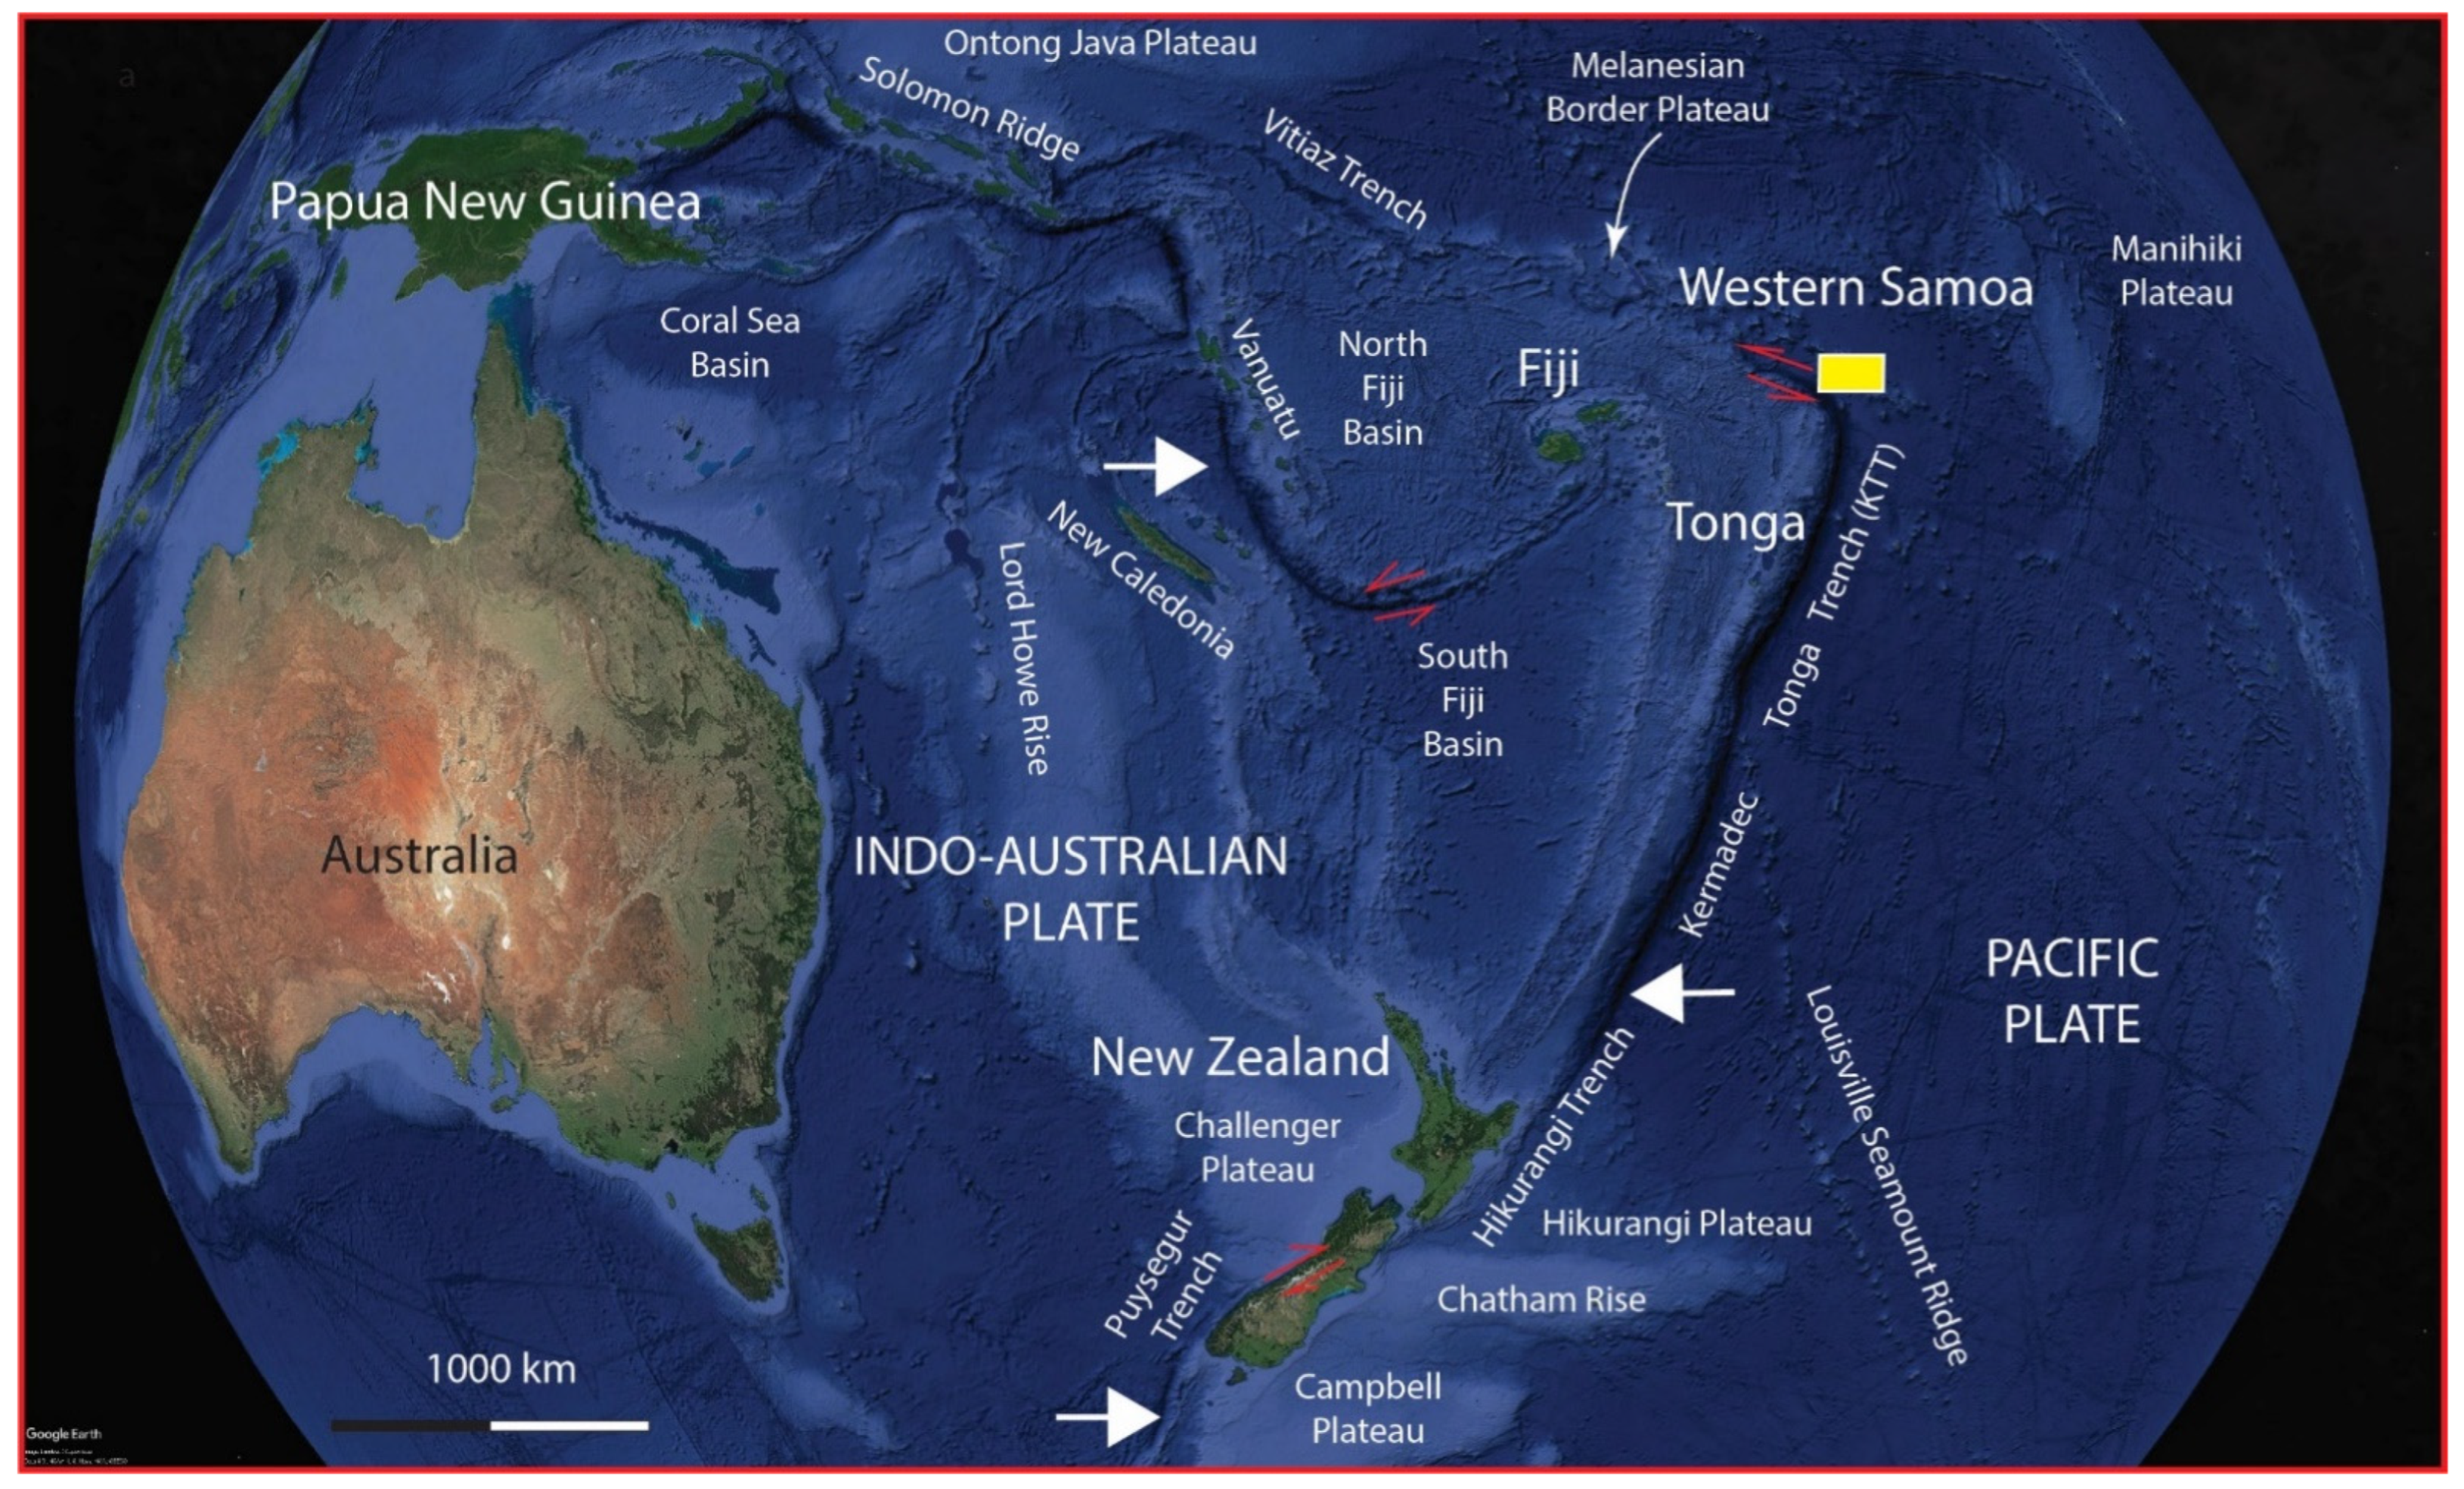
Scaling is one of the main issues in any kind of assessment [15]. This article demonstrates qualitative–quantitative assessments, aiming to highlight the most valuable geosites on Western Samoa. Hence, the places of interest must be as accurate as possible, where a non-grid methodology can be utilized. Unlike a grid method, this does not divide the area of research on similar cell regions (rectangles or hexagons), but create more natural shapes based on elements and their value-input in modeling. Non-grid methodology utilizes the sum of values of two main elements of geodiversity (geology and geomorphology), which together creates a global value of studied region, but can also be improved with local elements (specific sites with cultural, archeological, volcanological, and/or other values). The accuracy of assessment using this scaling method depends only on the quality of data; grid deviation of the territory is not required. We chose Western Samoa, located in the Southwest Pacific (Figure 1) as a suitable region for comparisons of grid and non-grid types of assessments of geodiversity, as well as providing opportunities to build on previous research on this territory.

Figure 1.
Overview of the geotectonic situation in the Southwest Pacific and Western Samoa using Google Earth Pro satellite imagery. The study area of Western Samoa is highlighted by a yellow rectangle. Relative tectonic plate movements are marked by arrows. White arrows show the subducting plate move direction. Double opposing red arrows refer to transform plate boundaries, e.g., major strike slip fault systems such as the Alpine Fault in New Zealand. Major geotectonic elements, continents, and islands are named.
Qualitative–quantitative assessment of geodiversity is an important methodology for highlighting abiotic aspects of sites with the potential for demonstrating information and processes relating to Earth’s evolution. However, the scale of assessment is one of the most significant parameters, directly influencing the accuracy of results Therefore, we consider this an important area for further research; here, we demonstrate contrasting accuracy and the utility of grid and non-grid methods of scaling.
2. Materials and Methods
2.1. Aim
The main goal of our research was to study two different scale systems for qualitative–quantitative assessments of geodiversity, which include common grid type of calculation and non-grid. Then, we compared these methods, demonstrating differences in their accuracy, and highlighted benefits and drawbacks especially for searching geosites. Finally, we show that evaluation systems of geodiversity can be improved to provide more accurate results.
2.2. Sample
Two islands of Western Samoa were studied in our earlier research of assessment of geodiversity [4]. Savaii and Upolu Islands are in the northeast sector relative to the Tonga trench in the Southwest Pacific. Islands have been formed by six periods of basaltic volcanism occurring from the Pliocene through to recent history, resulting in a group of shield volcanoes [16,17]. The volcanoes feature only one rock type represented by basalt from different periods, as shown on the geological map of Western Samoa [17] (Figure 2). The first is the Fagaloa lithostratigraphy unit (Pliocene to Mid-Pliocene) occasionally visible on the surface of the Island. Fagaloa volcanism created the landscape formed by shield volcanoes featuring gradual slopes rising from the sea floor to an estimated height 1800 m above sea level. This rock formation has been highly eroded, resulting in steep valleys and volcaniclastic debris aprons. The Salani Unit, located in the eastern part of Savai’i Island, and south-eastern and central parts of Upolu, can be observed mostly infilling the pattern of previously created valleys. Next, the Mulifanua event occurred during the last glacial period and is represented in the western and central parts of Savai’i, and the north-western area of the Upolu Island. After glaciation, the Lefaga unit was formed by small-volume volcanism, producing sporadic eruptive products in the south-western part of Savai’i Island. Subsequently, eruptive products of more recent volcanism have formed the Aopo lithostratigraphy unit. The final volcanic phase is represented by the Puapua rocks formed in the Middle to Late Holocene. These rocks can only be observed on Upolu Island in a small area in the south, whereas they cover the central to south, and eastern part of Savai’i Island. Additionally, the Holocene alluvium was formed in the western part of Upolu Island. The Vini Tuff, formed in the Last Interglacial period, can be seen in well-preserved tuff cones such as Apolima and Nu’utele islands, and in the western and eastern parts of Upolu Island. The information of Western Samoa is provided with its simple geological map which has been georeferenced with QGIS software (version 3.16 Hanover) and polygonised (Figure 2), whereas the elevation model (Figure 3) is based on Shuttle Radar Topography Mission (SRTM) 1 Arc-Second Global with a resolution of 30 m per pixel. This information shows that result of the assessment was not very accurate, although it was good enough for this type of assessment.
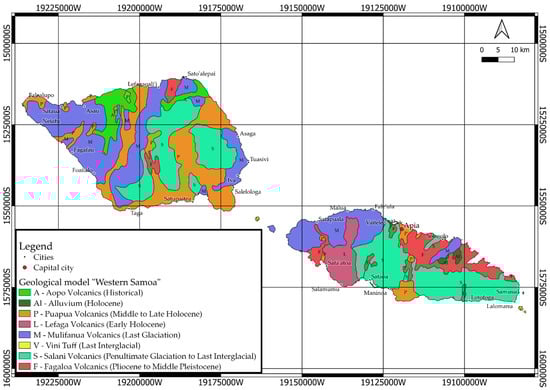
Figure 2.
Geological model of Western Samoa. Based on geological map of Western Samoa [17]. Letters on the map are the first letter of geological units’ names. Map coordinate system: American Samoa 1962 UTM Zone 2S (in QGIS code: ESRI:102116).
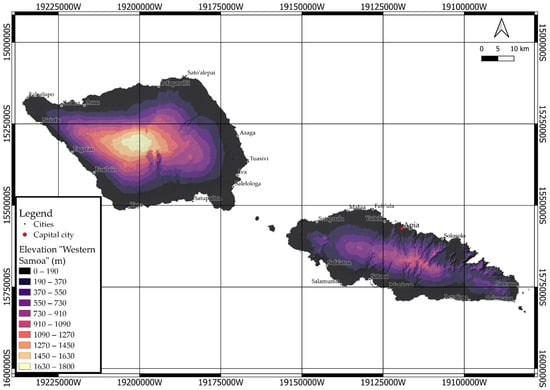
Figure 3.
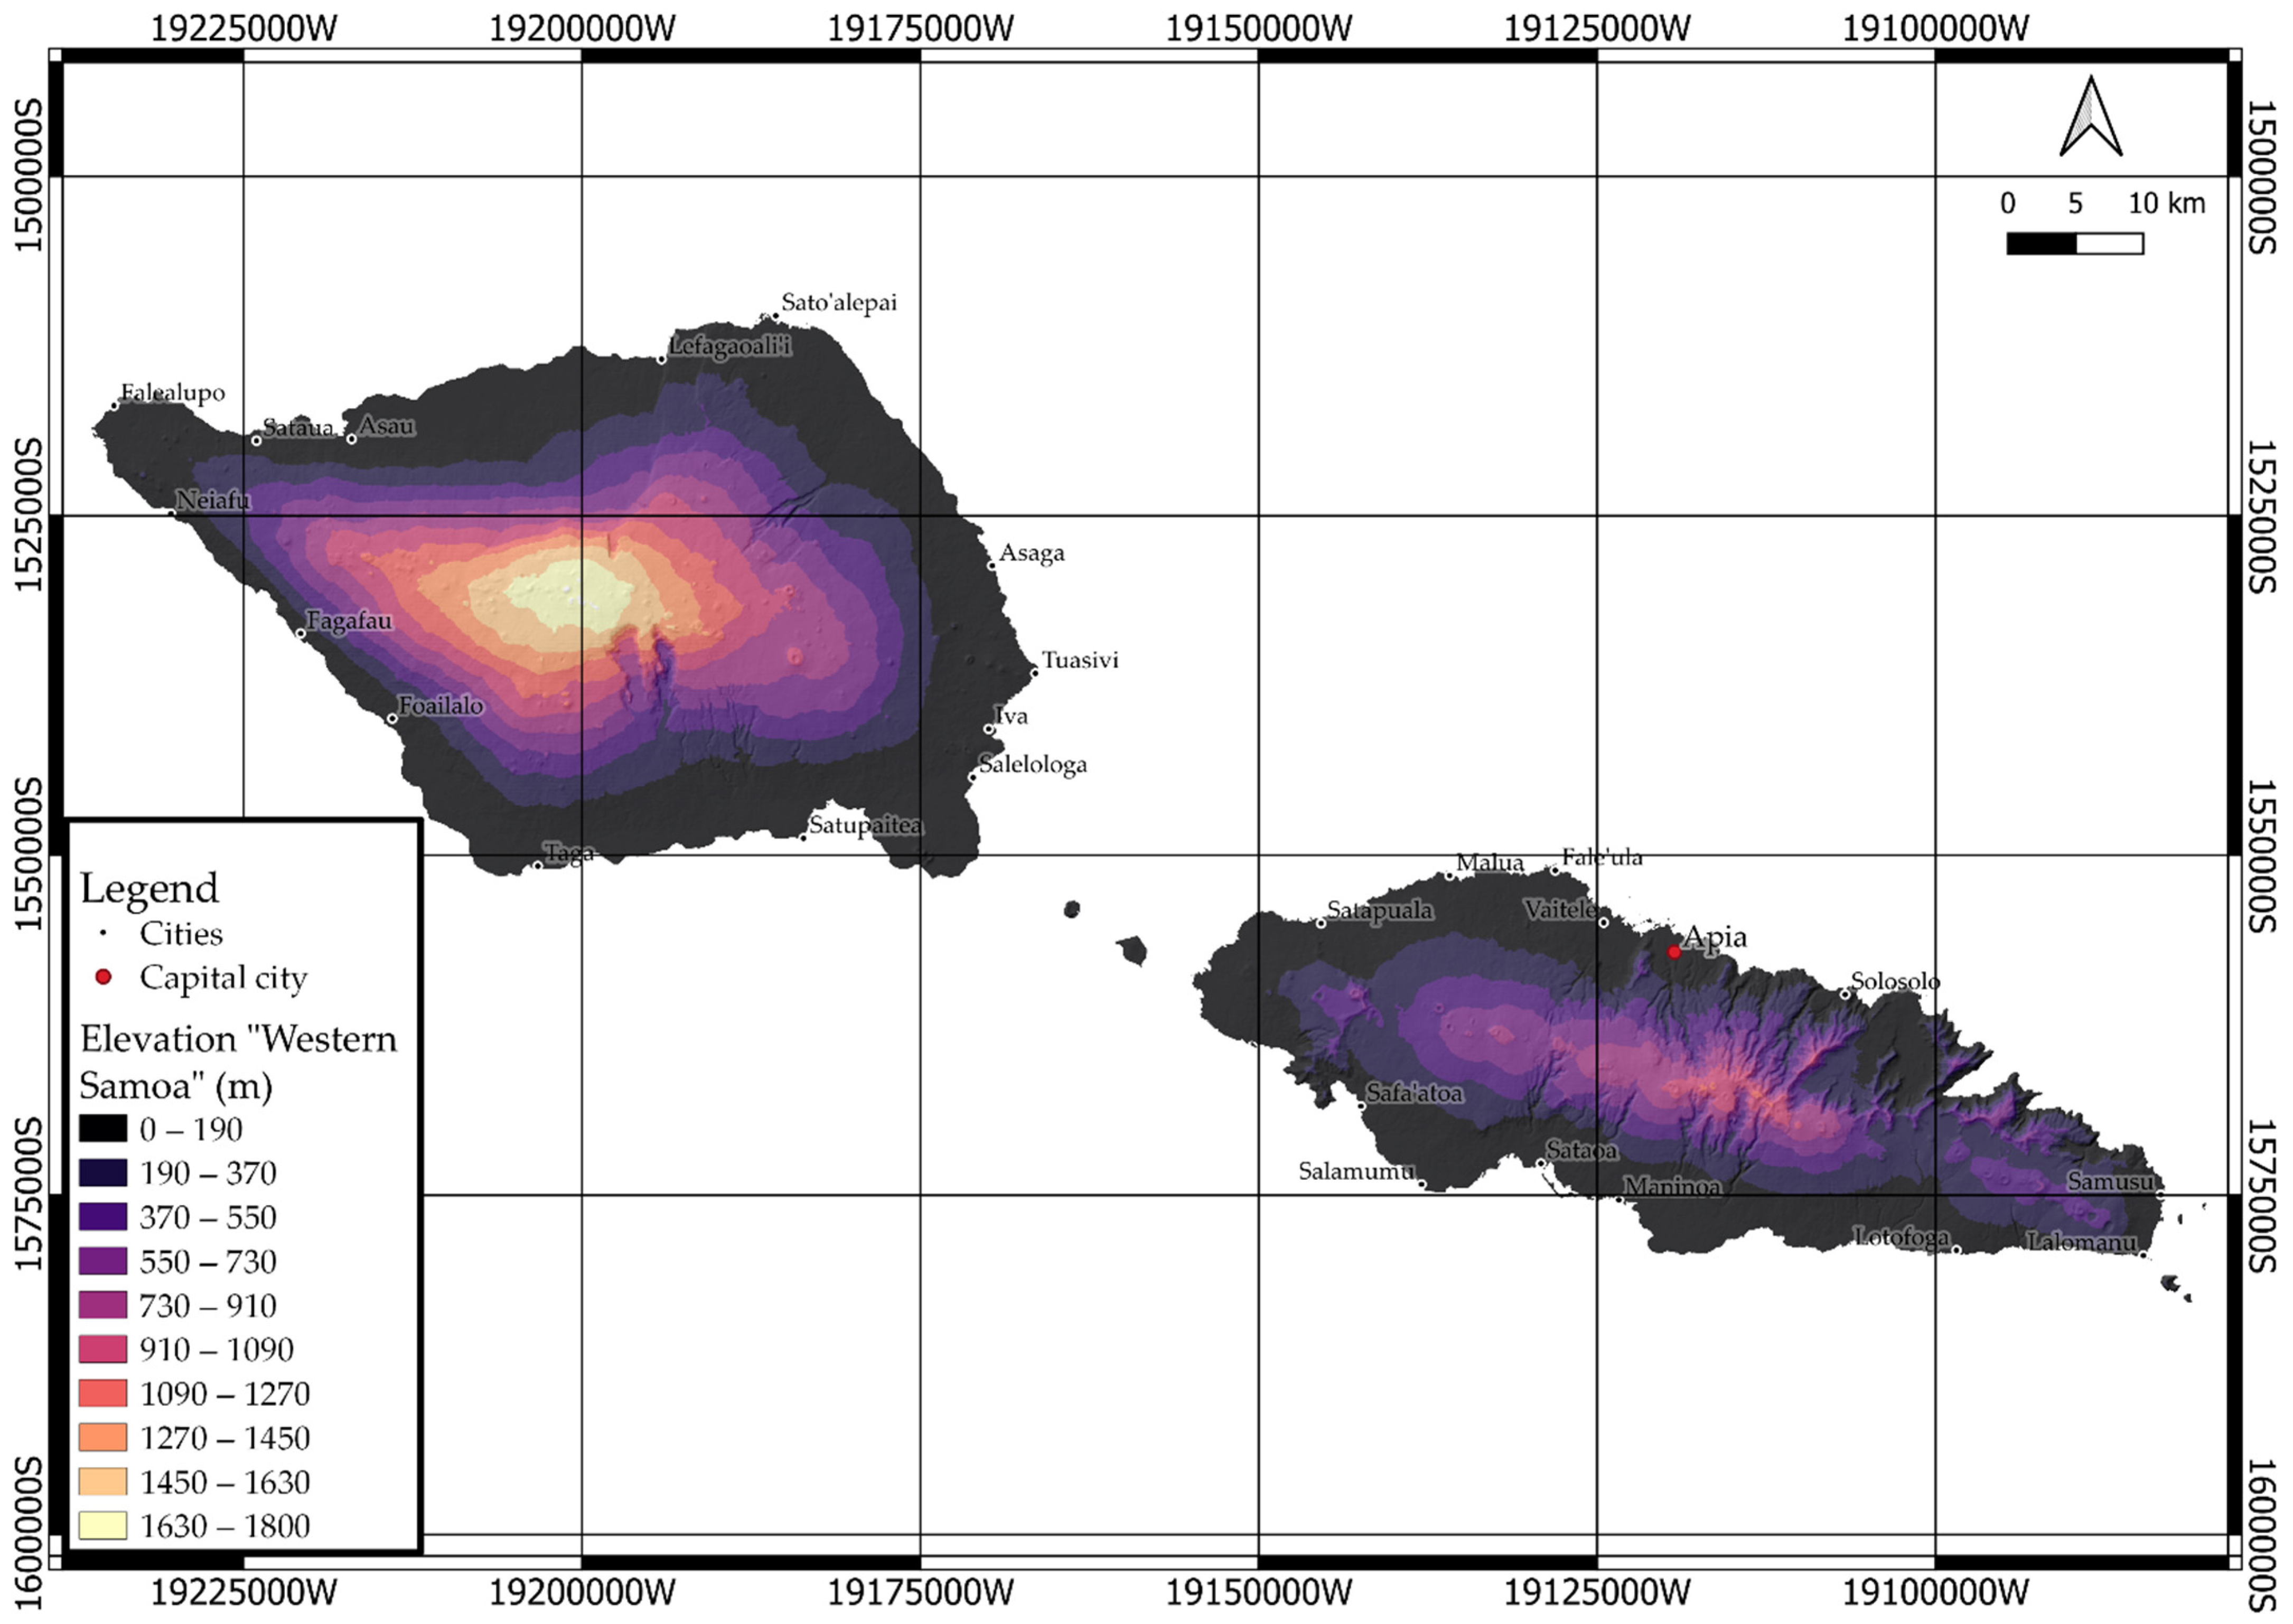
Elevation model of Western Samoa based on SRTM 1 Arc-Second Global data available for Western Samoa. Map coordinate system: American Samoa 1962 UTM Zone 2S (in QGIS code: ESRI:102116).
2.3. Methodology
Qualitative–quantitative methodologies have been described in previous articles on geodiversity assessments of the northern part of the Coromandel Peninsula [10] and the Western Samoa Islands [4]. This method requires basic territorial information (quantitative part) represented by geological maps and DEMs (digital elevation models). Then, evaluation systems (qualitative part) provide a rate for geological and geomorphological elements. This type of assessment was utilized as the most efficient way to create a model of geodiversity values for the purpose of geosite recognition (not full geodiversity description); however, we acknowledge the potential for further refinement of the method and resulting model. Data relating to the main elements (geology and geomorphology) can be calculated using a variety of GIS (Geographical Information Systems) software; however, for our research we utilized QGIS (3.16 “Hannover”) (https://qgis.org/en/site/forusers/download.html (accessed on 9 March 2022)), with its plugin “SRTM-Downloader” (https://plugins.qgis.org/plugins/SRTM-Downloader/version/3.1.16/ (accessed on 15 March 2022)). We consider this software ideal because it is free, user-friendly, readily accessible to a wide range of users, and contains all the tools we consider necessary for qualitative–quantitative assessments of geodiversity.
2.4. Evaluation System
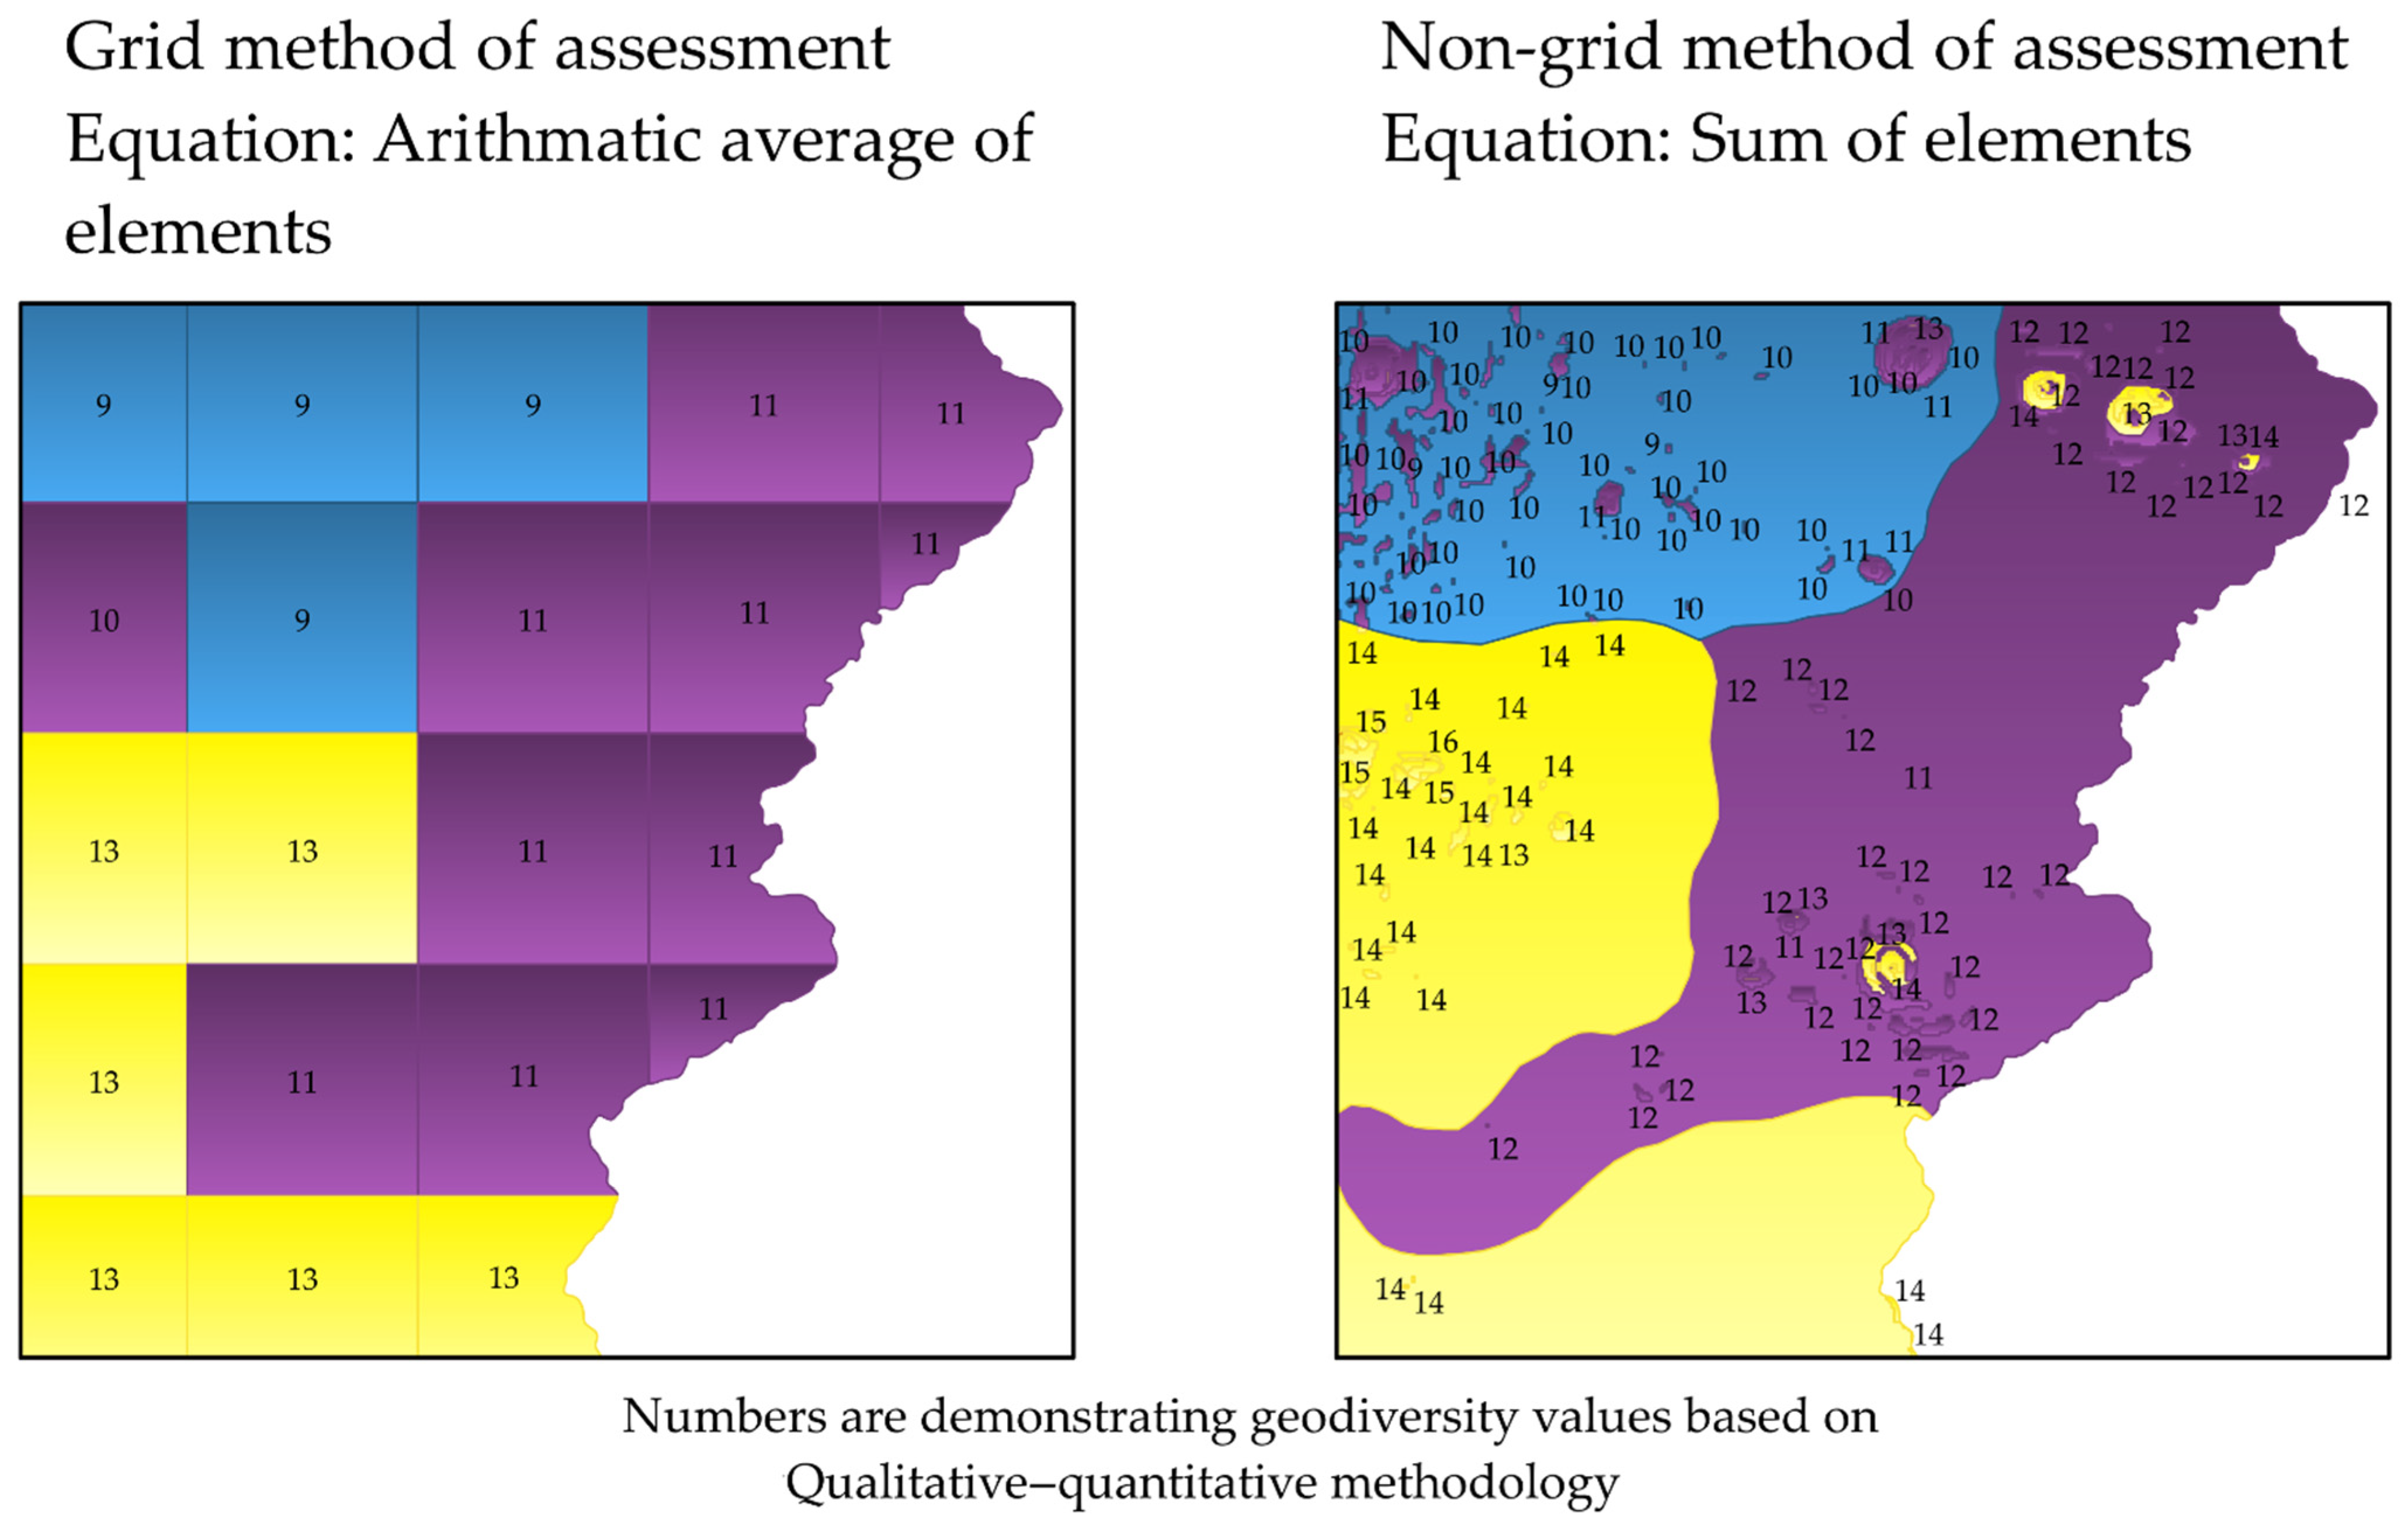
Our equation for assessments of geodiversity can be applied to the grid method of assessment, which calculates the arithmetic average of all elements presented in each region. In contrast, non-grid assessments utilize the standard sum of all elements’ values in the location chosen inside the regions of research.
The development of an evaluation system was introduced in the assessment to provide a qualitative part of the assessment and show the diversity between different types of geological and geomorphological formations presented on the territory of research. The first system was based on 5 points, from 1, the lowest, to 5, the highest part for the elements. However, our system was increased to 7 points plus rare for convenience and accuracy in assessments of geology (described in subsequent sections).
2.4.1. Evaluation System for Geomorphological Element
Geomorphological elements are based on elevation models (Figure 3), which contain information about the altitude of the surface in a specific coordinate system. Based on this information, GIS software can provide numbers of different models utilizing the information from DEM such as elevation model itself, slope angle, slope aspect, plan, and profile curvatures; then, more complex morphological models such as raggedness and roughness, topographic position index (TPI), landform, geomorphon; and hydrological models such as watershed, channels, Strahler orders and others. From all these methods, we decided to concentrate on more basic and simpler parameter, the Slope angle, which is a core feature of most geomorphological assessments. This model can show basic differences in this research area, and has already been used for general geological and topographical mapping; a steeper slope will likely contain exposed outcrops suitable for assessment and further observation. Therefore, landscape steepness can be indirectly associated with the evolution of the surface. Subsequently, any kind of formation undergoes the “Geographical cycle” [18,19,20], where the formation is influenced by processes of erosion and/or weathering, which reduce the slope angle and bring the surface to a state of equilibrium (closer to sea level), represented by the end point of a horizontal flat surface. Moreover, younger rock formations can be exposed by tectonic activities, which can uplift the surface and create a new formation with higher slope angle compared with the previous formation. Hence, geomorphological elements have been evaluated using slope steepness from 0 to 90 degrees, utilizing some data of previous researchers, where this parameter has been used for studying soil science, geology, and weathering [21]. The evaluation of geomorphology in old and new systems is still very similar because places of 45 degrees and higher are important for considerations of possible geosites. In the old system, geosites had a value of 3–5 points, whereas in the new system, they had values of 5–7 points (Table 1). Meanwhile, other geomorphological models can be utilized for qualitative–quantitative assessments of geodiversity, but each of them has their own purpose and became more complex and problematic for their accurate evaluation to especially “assign” their link to geodiversity values. To consider them valuable for this assessment, they must be studied more precisely to understand their association with any geological evaluation system, or at least their support in geosite recognition, which must have direct dependence on the abiotic environment of the region (more information in Section 4).

Table 1.
The value of geodiversity for Western Samoa.
2.4.2. Evaluation System for Geological Element
The evaluation system for geological value is more important than other elements of geodiversity because its formation is the main way the environment receives new material for the refreshment of the surface through volcanic–tectonic processes. Hence, the evaluation for this assessment is that older rock types must yield higher value than younger, and volcanic rocks must be more valuable than sediments because they have stronger link to the primary rock-forming processes. The older formations are remnants of past events inscribed in the rock as different types of environmental changes. Meanwhile, volcanic rock types show formations which emerged directly from the deep interior of the Earth, which are useful for helping geologists determine information about the hidden processes happening in the inner part of the Earth, whereas sedimentary and metamorphic rocks are already the result of processes which have “changed” the primary Earth material, providing additional information about the processes happening within or on the Earth’s crust and on the surface. Thus, sedimentary and metamorphic rocks lose pure information about the core, primary rock forming processes. However, this kind of evaluation does not strictly demonstrate the objective approach for geological evaluation, which is becoming a drawback to make the system globally accessible.
This issue turns the assessment to concentrate on the relative rarity of all rock types found on the Earth’s surface. These values have been evaluated and applied to the assessment (Table 2) [22]: Sedimentary Cenozoic are the most common formations (33%), then Sedimentary Mesozoic (18%), followed by Sedimentary Paleozoic (13%), next Precambrian Metamorphic (15%). Together, volcanic rocks comprise 16% of the Earth’s crust, and they are further divided between extrusive (8%) and intrusive (9%). Intrusive Precambrian (6%) formations have a lower value than Extrusive Cenozoic (4%) and Mesozoic (2%) rocks. Additionally, Sedimentary Precambrian, Extrusive rocks of the Paleozoic and Precambrian ages, and Metamorphic and Intrusive formations from the Cenozoic, Mesozoic, and Precambrian periods are each found on 1% of the Earth’s surface.
Table 2.
Percentage of rock types exposed on Earth’s surface as a function of geological age [22].
The relatively objective information about rock rareness has been used in evaluation systems because it can be easily applied for any part of the world. In previous research, we used a 5-point system, which presented problems in mixing different rock types under the same values (such as all extrusive and intrusive rocks—5 points; rare rock types were not included in the assessment). After its improvements, the contemporary 7-point evaluation system became more accurate because every point contained only one specific rock type and its age, except for the rarest rock types, which have been separated from the system because their existence on the Earth surface is less than 1%, which makes them more valuable, and are thus assigned a “symbolical” value of 8. Based on this evaluation system, the whole territory of Western Samoa (except for small spots of alluvial Holocene formations) is represented by Cenozoic volcanism, which we assigned a 6-point value for geological elements.
2.4.3. Evaluation System for Volcanological Element
The assessment of Western Samoa was selected specifically as a challenge for the qualitative–quantitative types of assessment of geodiversity. This assessment concentrated on the recognition of specific places (geosites) throughout the territory of research, where Western Samoa is viewed as a shield volcano with a gradual and relatively gentle sloping landmass mostly composed of effusive eruptive products (less than 45 degrees slope) with one type of rock represented by Holocene basaltic lava flows, which were assigned a value of 6 for all of the islands. Hence, the standard assessments based on global parameters of geological rareness and slope steepness would have produced a relatively uniform result throughout the islands, covered in one or two colors on a geodiversity map. This result is unsuitable for proper geosite recognition in a scale normally expected for geotourism or geoconservation (e.g., few kilometers across regions). To solve this issue, the volcanological heritage of Western Samoa was treated with more emphasize and entered into the assessment. The volcanic heritage of Western Samoa was evaluated in a 7-point system (Table 1) with eruptive centers as additional points. The table of volcanic heritage shows the local scale for the island, where the youngest rocks, the Aopo volcanics, received the highest value of 7 points. Values for all other volcanic formations decreased with age, i.e., Puapua—6, Lefaga—5, Mulifanua—4, Vini Tuff—3, Salani—2, and Fagaloa—1. This evaluation is based more on the expert (i.e., geologist) view. Moreover, eruptive centers subject to previous research have been included in our assessment as an additional point. In previous research, the 5-point evaluation system was used as mentioned before for geology and geomorphology. However, the pattern of evaluation for volcano heritage is still the same. Hence, in this assessment, global geological and geomorphological values with additional parameters were used to create an overview of general geodiversity with a focus on local volcanological heritage, which is most important for the Western Samoa Islands. Additional values of volcanological heritage have been specifically tailored for the Samoa Island and cannot be used for other territories.
2.5. Grid and Non-Grid Scaling Methods
Grid methodology is a common type of assessment of geodiversity from the qualitative perspective. However, qualitative assessments require large amounts of data, which can be used together to identify places with the highest rate of different rock types, forming a spectacular surface. Moreover, this type of assessment also includes data on hydrology, soils, rate of degradation, etc. Meanwhile, qualitative–quantitative methods were developed with an orientation toward highlighting geosites in a more simplistic way. In the first assessment, square grids with a scale of 2.5 km each side were applied for calculation [4]. This scale was used for assessment because it is arguably half of the distance of unobscured human visibility [23,24]. Moreover, this scale is appropriate for assessment because it aligns with the general scale of topographical and geological mapping and is well supported by field observations made in our previous research in Coromandel Peninsula, New Zealand [10], where observers from the central point of the region can see the morphology of neighboring regions without visual improvement tools and/or surface obstacles. For calculation, QGIS software contains the “Grid” tool, which divides the area into sections. Then, the “Zonal statistic” tool was applied to calculate the territory of research with arithmetic average equation. However, after calculation, the researchers obtained a result (Figure 4) with large territories for field observation, and still had to cover a distance of 6.25 km2 to find the concrete geosites.
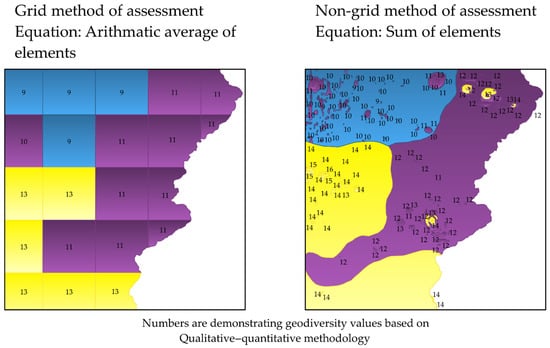
Figure 4.
Demonstration of results of two methods of scaling using the grid system with an arithmetic average equation and non-grid with the sum of input elements’ values.
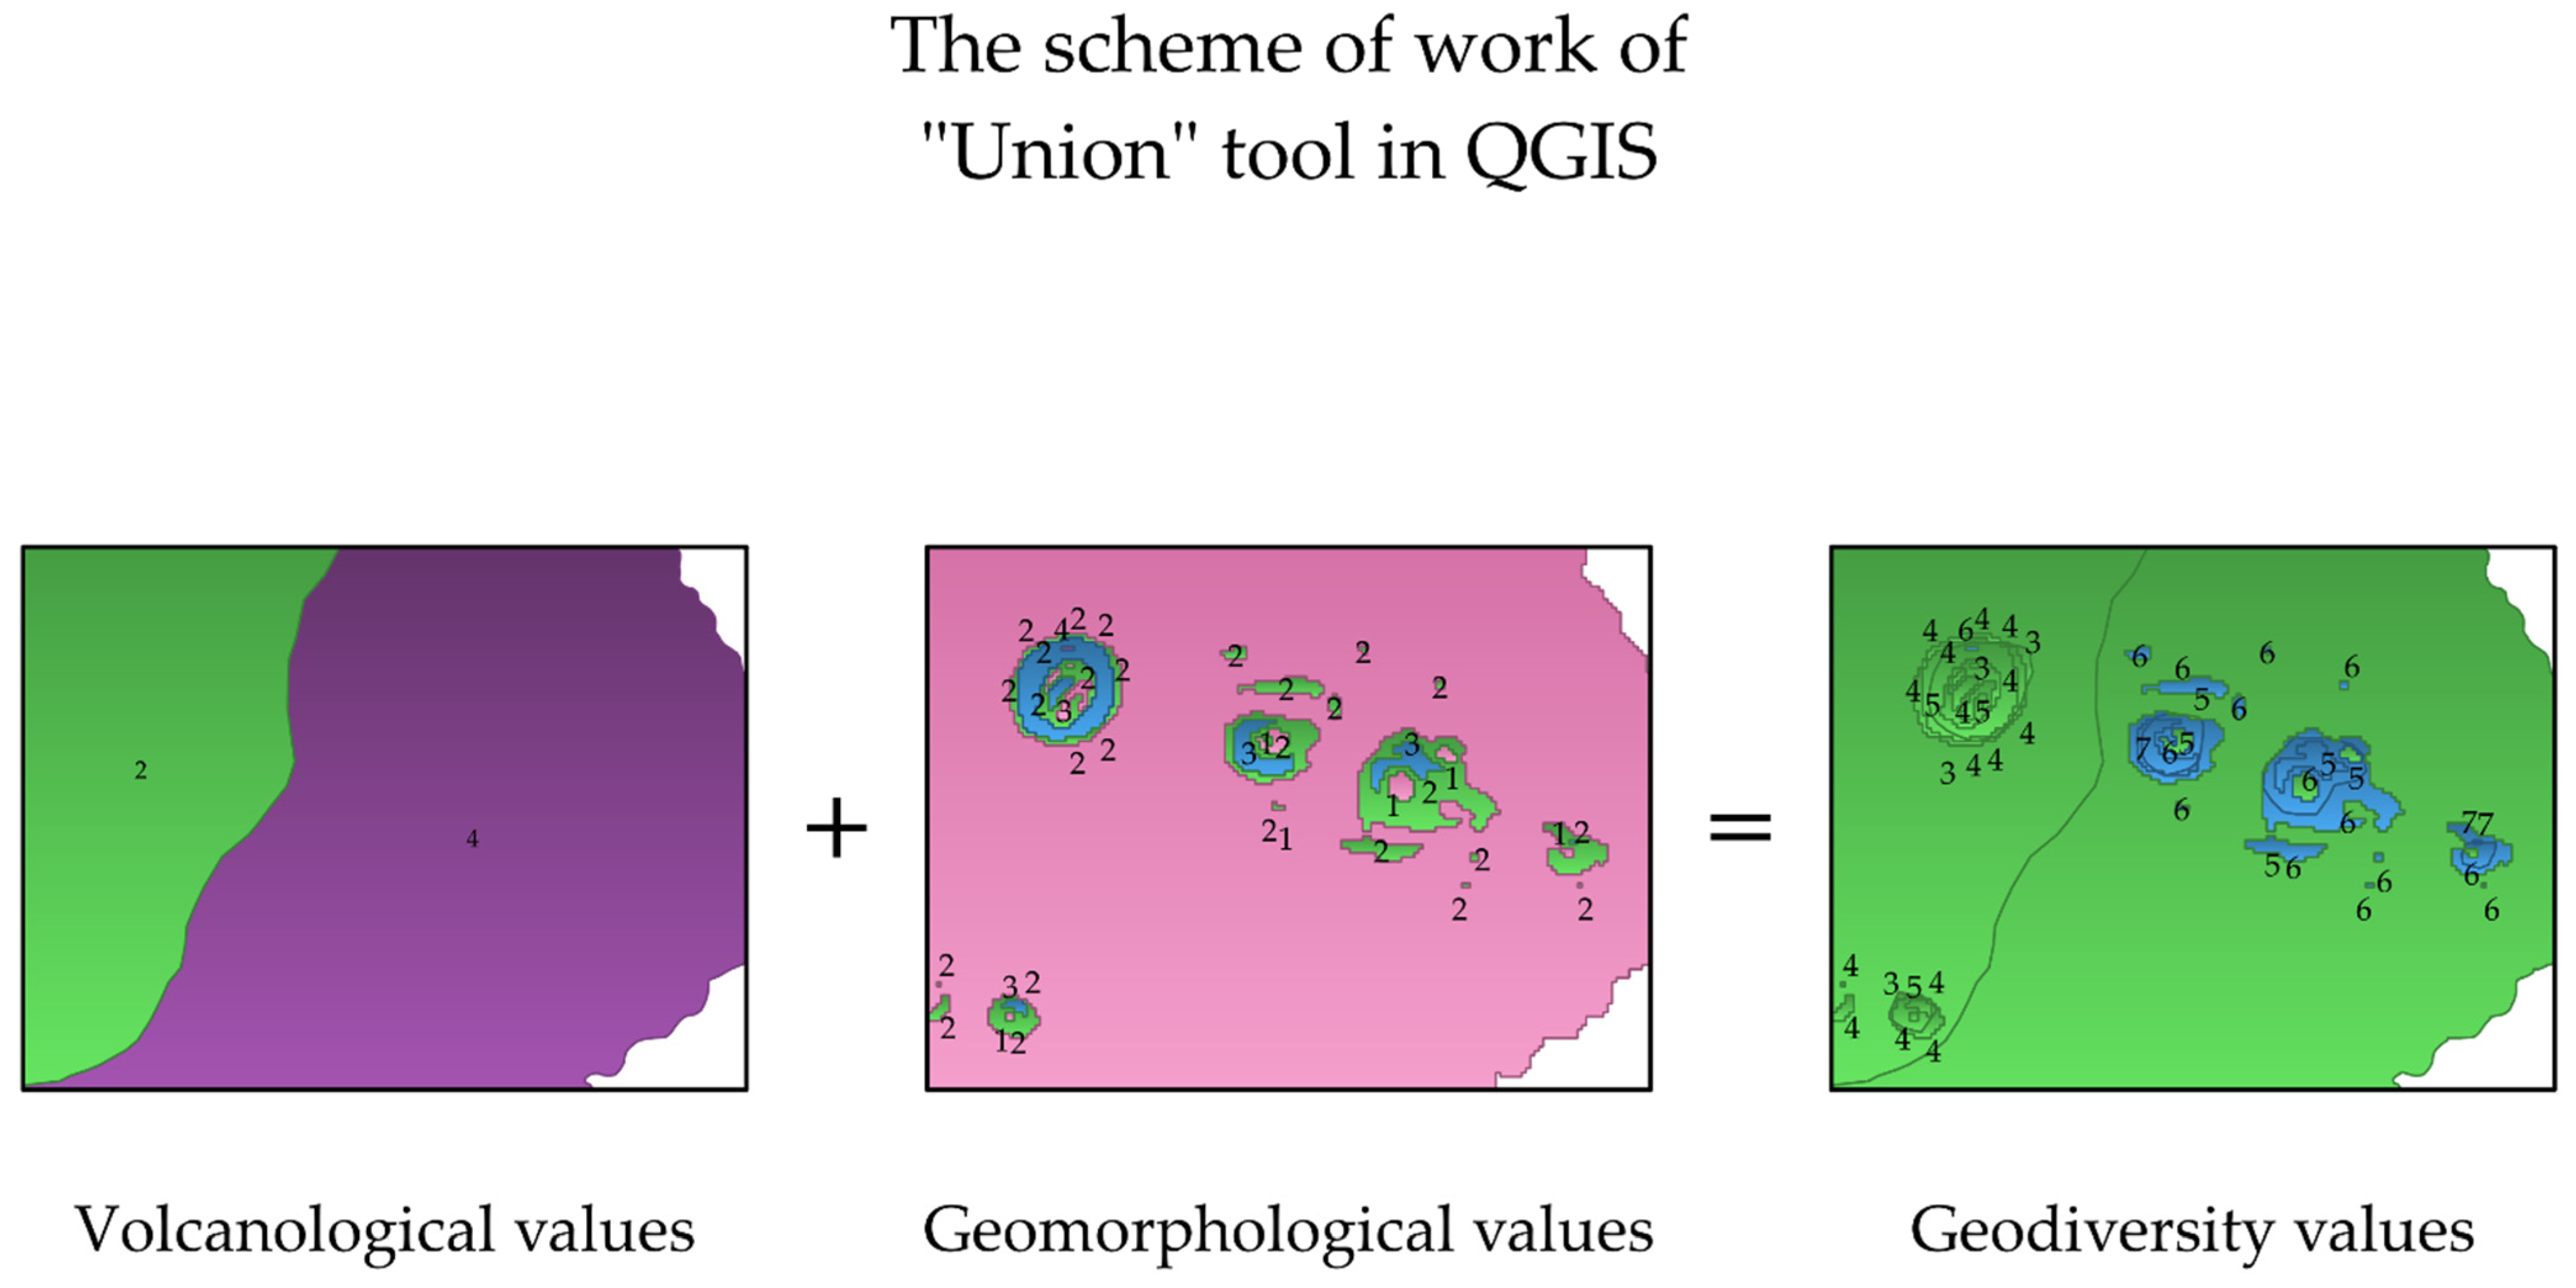
The geodiversity assessment based on grid methodology have on big drawback as it shows very large territory of observation, which must be covered to determine the locations of possible geosites. Hence, non-grid scales of assessment have been utilized with the “Union” tool (QGIS tool) (Figure 5), where geological and geomorphological models are divided by overlapping and creating sections with different shapes and values from all input elements. The description of the Union tool states that “this algorithm checks overlaps between features within the Input layer and creates separate features for overlapping and non-overlapping parts. The area of overlap will create as many identical overlapping features as there are features that participate in that overlap.” (https://docs.qgis.org/3.16/en/docs/user_manual/processing_algs/qgis/vectoroverlay.html (accessed on 12 March 2022)). In this way, the results of calculations from all elements were totaled, providing the final mark specifically for each region (Figure 4). This method provides a much better result for geosite recognition because it shows some small specific features on the surface which should be observed in the field as possible locations of interest. For example, vents are good places for volcanological studies, and this system can highlight them specifically because they can be easily extracted from DEM. However, the accuracy of this assessment strongly depended on the quality of input data and evaluation systems.
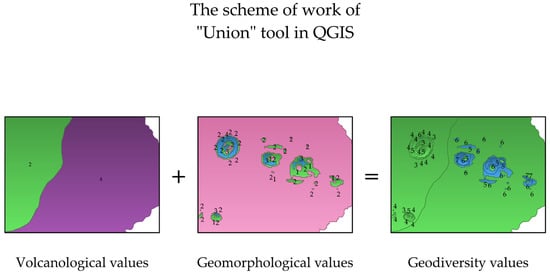
Figure 5.
Demonstration of the “Union” tool in QGIS. Geomorphological and geological values highlight the same locations, but with different values according to their elements. After applying the “Union” algorithm, geodiversity values show how models with different values have been overlain, creating a new model calculated with average values.
3. Results
The results of our assessment of geodiversity were the sum of all defined elements in Western Samoa, valued on a scale from 1 to 7 points for each element and 1 point assigned for eruptive centers. The calculation was applied to the same model, contrasting two different methodologies: grid and non-grid. The grid method (Figure 6) utilized cells with a size of 2.5 km per side, an appropriate distance for further observation of chosen sites, because this scale is acceptable for justification on the field. In contrast, the non-grid (Figure 7) methodology utilized borders of assessed elements as areas of deviation from some shapes, where each shape contained information from all layers (geomorphological, geological, volcanic heritage, and eruptive centers). To compare the methods, two models were created, with a sum of evaluated points (Table 1) (7 for each element, and 1 for eruptive centers), which were then divided into six categories with their point values ranging from 0 to 22. Additionally, all categories contained their area of spreading.

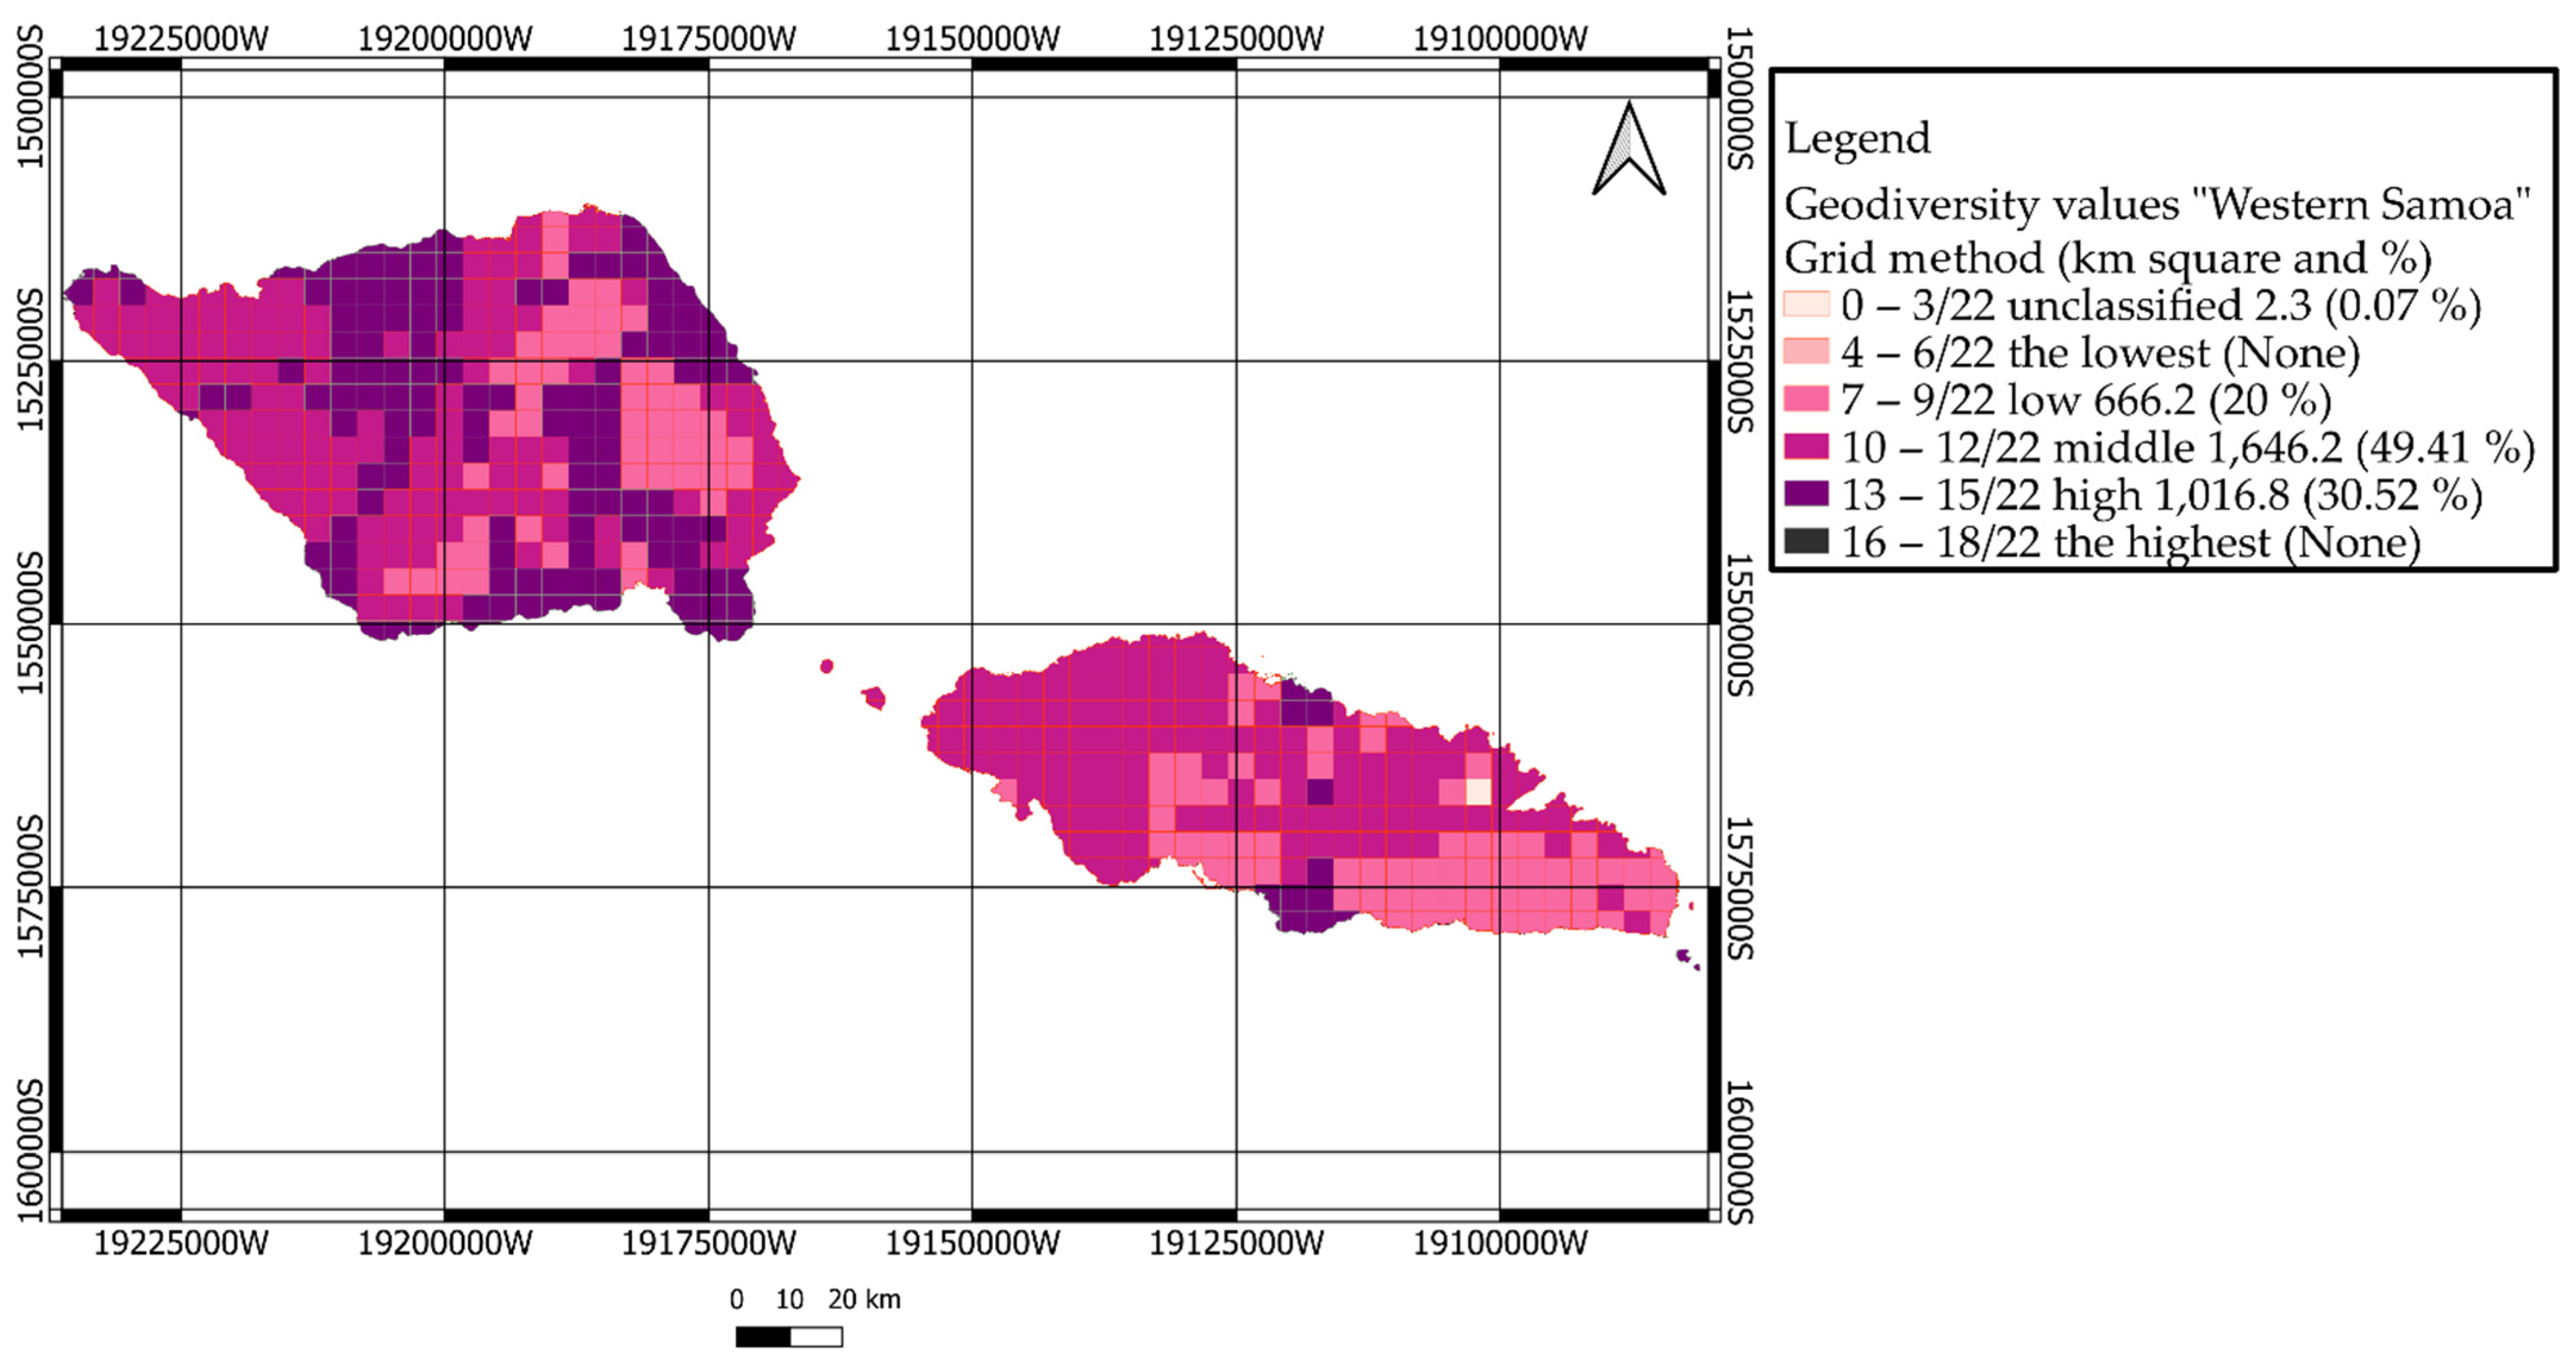
Figure 6.
Grid model of geodiversity values for “Western Samoa”. Based on a geological map of Western Samoa [17] and an SRTM model. Map coordinate system: American Samoa 1962 UTM Zone 2S (in QGIS code: ESRI:102116).

Figure 7.
Non-grid model of geodiversity values off “Western Samoa”. Based on a geological map of Western Samoa [17] and an SRTM model. Map coordinate system: American Samoa 1962 UTM Zone 2S (in QGIS code: ESRI:102116).
3.1. Geodiversity Results Based on Grid Scaling Methods
The grid model (Figure 6) is presented for the whole area of research, except the ocean, and contained 586 cells, dividing the whole territory into regions containing cells with the same sum of arithmetic averages of all elements. In our results, 0–3/22 points were unclassified, because these geodiversity values are very low to be considered for further assessment; moreover, this was only 0.07% of the whole research territory. This area of the northeastern part of Upolu Island mainly contains alluvial sediments, which are also classified as the most common type of rock present on the Earth’s surface. Thus, 4–6/22 is still considered a relatively low value for geodiversity, with no areas of this value present on our model. Salani volcanism represented 20% of our research territory with a value of 7–9/22, in the central–western part of Savai’i Island and mostly in the southeastern part of Upolu Island. The middle value of geodiversity, 10–12/22, mostly represented Mulifanua and Lefaga volcanics, and less so Salani and Fagaloa volcanics. These areas were considered to contain important additional information justifying further observation. Their area of spread was the largest (nearly 50%), mostly occurring in the western part of Savai’i Island and some areas closer to the east coast. On Upolu Island, they are situated in the western and central parts of the island. Finally, 13–15/22 was the highest value for geodiversity occurring in our study area. These were the areas that should be subject to further observation and assessment as potential geosites for Western Samoa. Areas with the highest values covered 30.52% of our total study area. These high-value areas were mostly found in the central, northern, and eastern regions of Savai’i Island, closer to coastal areas, and on Upolu in an area from the north to the south in the central part of the island. These areas were mostly formed by Puapua and Aopo volcanics. The places with the absolute highest values for geodiversity (16–18/22 and 19–22/22) were found in this model. Therefore, our grid method of assessment provided an area of 1016.8 km2 with protentional geosites, which should be observed for further assessment and inventory.
3.2. Geodiversity Results Based on Non-Grid Scaling Methods
Using the non-grid methodology, we obtained slightly different results compared with the grid model. The non-grid model (Figure 7) was based on areas with the same range of value points as the grid-based version; however, for scale we used a natural shape border, which resulted in 23,453 discreet regions. The regions were based on summarizing layers of geodiversity elements adapted specifically for the Western Samoa region. Layers and their associated range of points were geology (1–7 points); geomorphology (1–7 points); volcanic heritage (1–7 points); and eruptive centers (+1 point). Hence, the highest absolute value was 22, which was not present in this territory. In this model, the unclassified value range 0–3/22 (0.08%) was defined as a larger area compared with the grid model and is formed by alluvium (Holocene) in the northwestern part of Upolu Island, which we consider unnecessary for further research in a geoheritage context. The value 4–6/22 did not occur in the grid model, and in this non-grid model it was not considered influential because it occurred only in a small area (0.02%) contiguous with the lower unclassified values. Areas with the next value 7–9/22 of geodiversity (still considered low) are slightly higher in this model (20.3%) compared with the grid model. Both models include the same locations and rock formations in these areas, but some sites contain higher values influenced by geomorphology and eruptive centers. The middle value (10–12/22 points) of geodiversity is the most common range for Western Samoa for both models, but a slightly smaller area of spread (47.53%) on this non-grid model. The smaller area is described by more an accurate scale of regions with same value, especially in the western part of Upolu Island, where some locations with higher values are present, because of the presence of eruptive centers. The high value 13–15/22 is larger in area (31.64%) in this non-grid model, and mostly includes the same locations as the grid model. This value also appears more specifically throughout the territory of Western Samoa in areas of middle value with eruptive centers and/or steeper slopes. These areas, together with regions with the highest present value of geodiversity (16–18/22), should be marked for further research, observations, and assessment. The highest range had a small area of spread (0.42%) and was mostly concentrated locally on areas with a high value occurring closer to eruptive centers and featuring steeper slopes. The absence of these areas in the grid model is notable.
4. Discussion
4.1. Grid and Non-Grid Methods of Scaling for Geodiversity Assessments
The main goal of our research was a comparison of two different scales applied to methods for assessments of geodiversity of Western Samoa. We observed slight differences in accuracy, but the overall locations and area of spread were similar. We considered the non-grid model to be better able to highlight locations with potential for classification as geosites. These locations often exhibited eruptive centers demonstrating geological and geomorphological processes. Additionally, they highlight an area most likely to feature surface outcrops of representative rock types which can be further described through detailed field observations. In contrast, we consider the grid assessment method to be more suitable for estimating the geodiversity of large territorial areas, rather than islands. Grid assessments can easily define larger areas (e.g., multiple cell size) to be considered for future geoconservation initiatives and potential geopark establishments. In contrast, non-grid assessments are more suited to estimating geodiversity values in small areas, with the goal of highlighting of potential geosites. Grid models can be used prior to non-grid models, especially in large territories, to identify optimum places for future studies. However, the drawback can be in the loss of some small geological objects such as vents that are hidden inside a grid cell, which are unlikely to have enough influence on the final mark of the grid.
4.2. Alternative Geomorphological Models and Their Issues for Geodiversity Assessments
Based on our research to date, we note the need for refinements in assessing the geomorphological factors in our overall assessment of geodiversity. Geodiversity estimates should be driven by geological, volcanological, and hydrological elements as a proxy for potential geodiversity values in the geomorphological context. Currently, we suggest using slope degree as the main factor informing assigned values, but also considering geomorphon, topographical position index (TPI), roughness, curvatures, slope aspect, and raggedness as parameters sensitive to surface complexities. However, these parameters are still hard to evaluate because they do not show a direct association with geological formations, which makes them hard to include in assessments. Moreover, most of them are based on slope steepness and some additional parameters of calculation for specific purpose. For example, TPI utilizing slope angle and elevation dividing slopes on different parts and creating number of landforms such as valleys and ranges, which looks very good on a map but currently not showing any important information, which can lead us to see locations with possible geosites. In the current state, they are unlikely be used for qualitative–quantitative assessments of geodiversity. Naturally, this geomorphological layer of assessment is necessary for areas with no volcanism; however, we note that it can also be applied as an additional layer when assessing the value of geological and volcanological heritage, and other elements of geodiversity. Therefore, values assigned to geological elements can be considered import for distinguishing individual geosites compared with others, and this can be further emphasized by considering geomorphological elements.
4.3. Issues with the Territory of Western Samoa
Western Samoa Islands were chosen for this assessment as a challenge. This territory contains low value from a geomorphological perspective, and high value from a geological perspective, but this is evenly spread throughout the whole region, giving everything the same importance. Moreover, geological, and tectonic information of the islands is limited because it shows young volcanism without specific structural elements, but with a high number of vents diagonally spread throughout the islands of Western Samoa [25,26,27]. As a result, the assessment of Western Samoa with additional values of volcanic heritage specifically tailored to this territory shows that its geodiversity has fallen in value and is considered to be average. Even though Savaii Island has a large territory, which marks it as high value, it is unsuitable for study, because it is better to concentrate on the large number of small spots with the highest values. These locations are mostly concentrated on places with eruptive centers. Additionally, coastal areas must be considered as a good location, especially cliff sites. As a result, these conditions, with a relatively pure geodiversity, tropical climate, and a small human population are perfect for a high distribution of tropical forests, creating high biodiversity of the region [28,29,30,31,32,33]. Hydrology, one of the elements of geodiversity, was not included in this assessment because its evaluation remains unsolved; there are some possible ways of assessing the weathering power, accumulating alluvial sediments, and/or type of water (stream, lake, marshland, etc.). Additionally, hydrological information of Western Samoa is also limited, similarly to the geological data. However, from DEMs, the territory probably supports a large number of small streams with a short fluvial network, especially in the central part of Savaii Island and central–northern part of Upolu. Here, waterfalls are one of the most important hydrological features which can be included into assessments because they carry high geotouristic values, but they cannot be extracted directly from DEMs or other model, only input into assessments after observation or extracted from topographical maps. Meanwhile, in Western Samoa, waterfalls are commonly linked to the places of geological boundary (e.g., lava flow contacts), which decreases their importance for qualitative–quantitative type of assessment. In conclusion, Western Samoa is a place with opportunity to study geoeducation from a geodiversity perspective, but information is still limited and further observations are required.
4.4. Aims for Future Research
The non-grid type of assessment with four elements of geodiversity and subject to a 7-point evaluation system is currently is our most developed qualitative–quantitative methodology. However, further research is proposed that would provide a more holistic overview by including elements such as archeological sites and soils. Additionally, biological factors and the human footprint must be considered in any overall assessment of geodiversity, enabling a comparison of geodiversity and biodiversity to inform and direct further research on omnidiversity [34].
5. Conclusions
Both the grid and non-grid scaling methods presented in our study of geodiversity assessment methods display similar results on a global perspective. However, at a local scale, the non-grid methodology displays more complete and spatially refined results, providing exact locations with specific values based on the evaluation system. Hence, on a global perspective and/or for large territories, grid systems work well enough, whereas non-grid systems are more applicable for local scales. It is better to recommend grid systems for the assessment of geoparks, whereas non-grid systems should be used highlight specifical geosites.
To date, improvements in assessments of geodiversity demonstrate a need for further development of associated concepts. Results from our evaluation system demonstrate the high volcanic heritage value of eruptive centers as well as their influence on geodiversity values overall, applicable at a highly localized scale of assessment. Other values should be subject to the same studies and assessments as volcanic heritage, where geology and geomorphology situate the geodiversity in a global context, and additional elements such as archeology, cultural history, hydrology, and soils should be included and calculated for the local perspective and uniqueness, and to provide a more holistic overview of geoheritage.
Author Contributions
Conceptualization, V.Z. and K.N.; methodology, V.Z.; validation, V.Z; formal analysis, V.Z.; investigation, V.Z.; resources, K.N.; writing—original draft preparation, V.Z.; writing—review and editing, K.N.; visualization, V.Z.; supervision, K.N. All authors have read and agreed to the published version of the manuscript.
Funding
This research was funded by Massey University Post-graduate Research Scholarship granted to V.Z.
Data Availability Statement
Not applicable.
Acknowledgments
This research was part of V.Z.’s PhD research on the Coromandel Peninsula funded by the Massey University PhD Scholarship. Thanks to Ilmars Gravis (The Geoconservation Trust Aotearoa Pacific) for suggested improvements to the manuscript.
Conflicts of Interest
The authors declare no conflict of interest.
References
- da Silva, M.L.N.; do Nascimento, M.A.L.; Mansur, K.L. Quantitative assessments of geodiversity in the area of the Seridó Geopark Project, Northeast Brazil: Grid and centroid analysis. Geoheritage 2019, 11, 1177–1186. [Google Scholar] [CrossRef]
- Dias, M.C.S.S.; Domingos, J.O.; dos Santos Costa, S.S.; do Nascimento, M.A.L.; da Silva, M.L.N.; Granjeiro, L.P.; de Lima Miranda, R.F. Geodiversity Index Map of Rio Grande do Norte State, Northeast Brazil: Cartography and Quantitative Assessment. Geoheritage 2021, 13, 1–15. [Google Scholar] [CrossRef]
- Pereira, D.I.; Pereira, P.; Brilha, J.; Santos, L. Geodiversity assessment of Paraná State (Brazil): An innovative approach. Environ. Manag. 2013, 52, 541–552. [Google Scholar] [CrossRef] [PubMed] [Green Version]
- Zakharovskyi, V.; Németh, K. Qualitative-Quantitative Assessment of Geodiversity of Western Samoa (SW Pacific) to Identify Places of Interest for Further Geoconservation, Geoeducation, and Geotourism Development. Geographies 2021, 1, 362–380. [Google Scholar] [CrossRef]
- Silva, J.P.; Pereira, D.I.; Aguiar, A.M.; Rodrigues, C. Geodiversity assessment of the Xingu drainage basin. J. Maps 2013, 9, 254–262. [Google Scholar] [CrossRef] [Green Version]
- Serrano, E.; Ruiz-Flaño, P.; Arroyo, P. Geodiversity assessment in a rural landscape: Tiermes-Caracena area (Soria, Spain). Mem. Descr. Della Carta Geoligica D’italia 2009, 87, 173–180. [Google Scholar]
- Pál, M.; Albert, G. Refinement Proposals for Geodiversity Assessment—A Case Study in the Bakony–Balaton UNESCO Global Geopark, Hungary. ISPRS Int. J. Geo-Inf. 2021, 10, 566. [Google Scholar] [CrossRef]
- Gray, M. Geodiversity and Geoconservation: What, Why, and How? Georg. Wright Forum 2005, 22, 4–12. [Google Scholar]
- Zakharovskyi, V.; Nemeth, K.; Gravis, I.; Twemlow, C. Geoheritage and Geodiversity Assessment Framework for Practical Application to Geoconservation of the Coromandel Peninsula, New Zealand. Geoconserv. Res. 2022, 5, 59–88. [Google Scholar] [CrossRef]
- Zakharovskyi, V.; Németh, K. Quantitative-Qualitative Method for Quick Assessment of Geodiversity. Land 2021, 10, 946. [Google Scholar] [CrossRef]
- Brocx, M.; Semeniuk, V. Geoheritage and geoconservation-history, definition, scope and scale. J. R. Soc. West. Aust. 2007, 90, 53–87. [Google Scholar]
- Cengiz, C.; Şahin, Ş.; Cengiz, B.; Başkır, M.B.; Keçecioğlu Dağlı, P. Evaluation of the Visitor Understanding of Coastal Geotourism and Geoheritage Potential Based on Sustainable Regional Development in Western Black Sea Region, Turkey. Sustainability 2021, 13, 11812. [Google Scholar] [CrossRef]
- Zwoliński, Z.; Najwer, A.; Giardino, M. Methods for assessing geodiversity. In Geoheritage; Elsevier: Amsterdam, The Netherlands, 2018; pp. 27–52. [Google Scholar]
- Eros, U. USGS EROS Archive—Digital Elevation—Shuttle Radar Topography Mission (SRTM) 1 Arc-Second Global; USA Geological survey: Reston, VA, USA, 2015. [Google Scholar] [CrossRef]
- Serrano, E.; Ruiz-Flaño, P. Geodiversity: A theoretical and applied concept. Geogr. Helv. 2007, 62, 140–147. [Google Scholar] [CrossRef]
- McDougall, I. Age of volcanism and its migration in the Samoa Islands. Geol. Mag. 2010, 147, 705–717. [Google Scholar] [CrossRef]
- Kear, D. Geological notes on western Samoa. N. Z. J. Geol. Geophys. 1967, 10, 1446–1451. [Google Scholar] [CrossRef] [Green Version]
- Davis, W.M. The geomorphic cycle. Geomorphic J. 1899, 14, 481–504. [Google Scholar] [CrossRef]
- Davis, W.M. Peneplains and the geographical cycle. Bull. Geol. Soc. Am. 1922, 33, 587–598. [Google Scholar] [CrossRef]
- Davis, W.M. The geographical cycle. In Climatic Geomorphology; Springer: Berlin/Heidelberg, Germany, 1973; pp. 19–50. [Google Scholar]
- Zhuchkova, V.; Rakovskaja, E. Metody Kompleksnyh Fiziko-Geograficheskih Issledovanij; Publishing House of Moscow State University: Moscow, Russia, 2004; p. 318. [Google Scholar]
- Blatt, H.; Jones, R.L. Proportions of exposed igneous, metamorphic, and sedimentary rocks. Geol. Soc. Am. Bull. 1975, 86, 1085–1088. [Google Scholar] [CrossRef]
- Kim, K.W. The comparison of visibility measurement between image-based visual range, human eye-based visual range, and meteorological optical range. Atmos. Environ. 2018, 190, 74–86. [Google Scholar] [CrossRef]
- Krisciunas, K.; Carona, D. At what distance can the human eye detect a candle flame? arXiv 2015, arXiv:1507.06270. [Google Scholar]
- Cronin, S.J.; Bonte-Grapentin, M.; Nemeth, K. Samoa technical report-Review of volcanic hazard maps for Savai’i and Upolu; South Pacific Applied Geoscience Commission: Suva, Fiji, 2006. [Google Scholar]
- Fepuleai, A.; Németh, K. Volcanic Geoheritage of landslides and rockfalls on a tropical ocean island (Western Samoa, SW Pacific). Geoheritage 2019, 11, 577–596. [Google Scholar] [CrossRef]
- Németh, K.; Cronin, S.J. Volcanic structures and oral traditions of volcanism of Western Samoa (SW Pacific) and their implications for hazard education. J. Volcanol. Geotherm. Res. 2009, 186, 223–237. [Google Scholar] [CrossRef]
- Whistler, W.A. The Samoan Rainforest: A Guide to the Vegetation of the Samoan Archipelago; Arthur, W., Ed.; The University of British Columbia Press: Vancouver, BC, Canada, 2002. [Google Scholar]
- Ibanez, T.; Ainsworth, A.; Gross, J.; Price, J.P.; Webb, E.L.; Hart, P.J. Rarity patterns of woody plant species are associated with life form and diversification rates in Pacific islands forests. Am. J. Bot. 2021, 108, 946–957. [Google Scholar] [CrossRef]
- Keppel, G.; Gillespie, T.W.; Ormerod, P.; Fricker, G.A. Habitat diversity predicts orchid diversity in the tropical south-west Pacific. J. Biogeogr. 2016, 43, 2332–2342. [Google Scholar] [CrossRef]
- Neubert, E.; Bouchet, P. The Diplommatinidae of Fiji–a hotspot of Pacific land snail biodiversity (Caenogastropoda, Cyclophoroidea). ZooKeys 2015, 487, 1. [Google Scholar] [CrossRef] [Green Version]
- Fall, P.L.; Drezner, T.D. Species origins, dispersal, and island vegetation dynamics in the South Pacific. Ann. Assoc. Am. Geogr. 2013, 103, 1041–1057. [Google Scholar] [CrossRef]
- Keppel, G.; Buckley, Y.M.; Possingham, H.P. Drivers of lowland rain forest community assembly, species diversity and forest structure on islands in the tropical South Pacific. J. Ecol. 2010, 98, 87–95. [Google Scholar] [CrossRef]
- Crisp, J.R.; Ellison, J.C.; Fischer, A. Omnidiversity Consolidation of Conservation Assessment: A Case Study of Tasmanian Coastal Geoconservation Sites. Geoconserv. Res. 2022, 5, 108–134. [Google Scholar]


Publisher’s Note: MDPI stays neutral with regard to jurisdictional claims in published maps and institutional affiliations. |
© 2022 by the authors. Licensee MDPI, Basel, Switzerland. This article is an open access article distributed under the terms and conditions of the Creative Commons Attribution (CC BY) license (https://creativecommons.org/licenses/by/4.0/).