Abstract
In the field of flood management, risk and loss estimation is a prerequisite to undertake precautionary measures. Among several available tools, the HAZUS model is one of the most effective ones that can assist in the analysis of different dimensions of natural hazards, such as earthquakes, hurricanes, floods, and tsunamis. The flood hazard analysis portion of the model characterizes the spatial variation of flood regimes for a given study area. This research attempts to illustrate how the geoinformatics tool HAZUS can help in estimating overall risk and potential loss and damage due to floods and how this knowledge can guide the decision-making process and enhance community resilience. Examining a case study in the Rural Municipality of St. Andrews in Manitoba, Canada, this study found that both the ‘Quick Look’ and ‘Enhanced Quick Look’ analyses provided robust results. However, for the RM of St. Andrews, which is characterized by differing levels of exposure on the floodplain, and where many new housing starts occur in high-risk flood zones, ‘Enhanced Quick Look’ with spatially explicit building stock is recommended. The case study of the RM of St. Andrews demonstrates that the HAZUS model can predict loss and damage with increasing magnitude of flooding depth. It is thus recognized that the risk and loss estimation tools can be effective means for future flood loss and damage reduction.
Keywords:
flood; risk; loss and damage; disaster; emergency management; physical exposure; vulnerability 1. Introduction
Flooding is the most recurrent and widespread natural hazard worldwide [1,2], causing fatalities and damaging a significant amount of infrastructure. In the Canadian province of Manitoba, it is also the most frequent hazard. Residents of Manitoba have been coping with floods since the province was settled [3]. South-central Manitoba is especially highly vulnerable to Red River flooding because of numerous physiographic and environmental factors [4,5]. Originating at the confluence of the Bois de Sioux and Otter Tail rivers between the USA states of Minnesota and North Dakota, the Red River flows toward north through the center of Manitoba. The river empties into Lake Winnipeg in the St. Andrews municipality, and its water ultimately flows into the Hudson Bay via the Nelson River [6]. The Red River occupies a large flat flood plain formed from the basin of glacial Lake Agassiz and has a minimal gradient (−0.15 m/km over 450 km). This northward flow direction follows a climatic gradient that results in a peak spring flowrate and ice-free conditions, having occurred for much of the southern length of the river before ice-off along its northernmost reaches [5]. Thus, the hazard of flooding is a serious threat to southern Manitoba, and it is the location of the greatest floods in the history of Manitoba [7,8]. Major recorded floods with substantial damages have occurred along the Red River since the early 1800s, with the most devastating floods occurring in 1826, 1852, 1861, 1950, 1979, 1997, 2009, and 2011. Winnipeg city has endured more physical, social, and economic damage than any other large city in Canada as a result of catastrophic flooding. In particular in the last 60 years, floods in 1950, 1997, 2009, and 2011 have caused significant damage. However, the flood of 1950, which cost over CAD 1 billion and required the evacuation of 100,000 people [9], resulted in the establishment of mitigation measures for the city that include a floodway. While floods still impact the city of Winnipeg, one of the most recent floods, that of 2011 that also cost nearly CAD 1 billion, now shift the extreme flooding impacts to exurban rural municipalities [10].
Anticipatory flood risk estimation is essential for reducing flood risk effectively and building resilient communities [11]. The development of modern computing technology and geoinformatics technologies, such as GIS and Remote Sensing, has provided disaster managers with the tools necessary for risk assessment and estimation of disaster loss. In recent decades, HAZUS-MH has been widely utilized to estimate flood risk. In disaster risk management, HAZUS could be used for emergency preparedness by identifying the spatial distribution and degree of the hazard, selecting mitigation options by understanding the loss effect, and acting precisely in the relief and rehabilitation process by understanding the restriction of risk to be impacted [12].
HAZUS-MH is a geoinformatics tool that was developed by the Federal Emergency Management Agency (FEMA) of the USA in the early 1990s. The primary advantage of a geoinformatics natural hazard loss estimation software is the ability to incorporate physiography and the spatial distribution of population and property when assessing risk. HAZUS can work with aggregated (census-based) general building stock and also on spatially discrete building stock. A library of preinstalled degrees of damage loss expressed in dollar values can be used to calculate risk [13]. Presently (as of 2022), HAZUS can quantify these losses and damages for four types of hazards—earthquakes, cyclones, floods, and tsunamis.
HAZUS-MH has been widely used in different parts of the USA to assess loss and damages due to natural hazards, such as earthquakes, cyclones, and floods. A total of 33 HAZUS user groups in the USA and three from outside the USA have been contributing their knowledge, experience, findings, and limitations on working with HAZUS. FEMA’s official website on HAZUS maintains links of the findings and discussions on the development of these user groups. There are numerous HAZUS ‘success stories’ available with the FEMA’s HAZUS user groups, and it is worth making a brief overview of a couple of selected experiments with flooding hazards here.
Since 1993, the Devils Lake in North Dakota has risen about 29 feet. Because of the rise in elevation of the lake, unprecedented flooding has occurred. An estimated 450 homes and 650 structures were moved or destroyed by the rising lake in this time [14]. Research was carried out with support from the Minnewaukan government and FEMA to create a site-specific database using building information provided by the Benson County Tax Assessor’s Office. The research successfully identified the location of inundated buildings on the map. With the help of HAZUS, the locations were then classified and assessed by value of properties.
The community of Eagle, Alaska witnessed a devastating flood in the year 2009. A severe ice jam on the Yukon River resulted in an extreme flood event for the local community. Equipment supporting the local livelihoods, such as fishwheels, boats, and nets, were crushed beneath the weight of moving ice [15]. A project for identifying flood zones in the affected areas was conducted by the Geospatial Intelligence Unit (GIU) and the Risk Analysis Branch at the Federal Emergency Management Agency (FEMA). The HAZUS model primarily identified areas that were most severely affected, which helped the emergency responders to focus on their response. HAZUS also proved very useful in the recovery phase. FEMA and the state of Alaska put much of their efforts in the reconstruction of the affected houses. Later, the GIU team developed several flood zoning maps to show to community members, identifying the safest areas for rebuilding.
The conventional approach to flood loss and damage potential focused on inferential statistical tools, ignoring the critical spatial dimensions. In addition, the limited literature on spatial analysis of flood loss estimation were characterized by conceptual tools without demonstrating how they would be effective empirically at the local community level. The present study makes novel attempt to (1) highlight the significance of spatial dimensions of flood loss and damage potential estimation, and (2) to bridge the spatial conceptual tools of flood loss estimation with empirical application to the local community level.
From the above USA examples, it is recognized that quantification of flood loss and damage estimates can help planning for disaster management, reducing flood risk, and addressing various factors of vulnerability, such as physical exposure, flood zoning, issuing building permits [16,17,18,19]. However, the tool was originally developed in the United States using data with finer levels of spatial aggregation and damage loss curves that might be less applicable to the Canadian context. Natural Resources Canada has developed aggregated census-based inventories for the country and has made other modifications to the program, however these have had limited testing and application.
The purpose of this research work is to apply HAZUS flood loss and damage estimation models to a Canadian rural municipality that experiences extreme and frequent flooding. The paper is organized in three parts: (i) an introduction to the HAZUS model; (ii) lessons learned from using the HAZUS model in various parts of the USA; and (iii) an analysis of the application of HAZUS in Manitoba, Canada, based on a case study in the Rural Municipality of St. Andrews.
2. Study Area
As noted earlier, the Rural Municipality (RM) of St. Andrews in the province of Manitoba was selected as a Canadian local community case study. The RM of St. Andrews was incorporated into the province on 14 February 1880 [20]. It is located between Lake Winnipeg and the provincial capital city of Winnipeg, where the Red River demarcates the eastern boundary of the RM (geographically the RM is located from 50°00″ to 50°30″ north latitude and 97°57″ to 96°20″ west longitude, as shown in Figure 1).
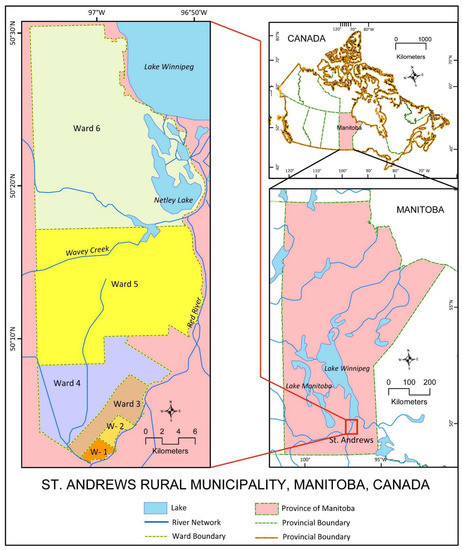
Figure 1.
Location map of the study area.
The RM of St. Andrews contains the communities of Clandeboye, Petersfield, and Lockport and St. Andrews. The RM is part of Manitoba census division 13 and divided into six wards [21]. St. Andrews occupies an area of 752.70 sq km, has a 53 km north–south and a 23 km east–west axis and a population density of 16 per sq km. The average population growth between the last two censuses (2001, 2011) was about 4.5% [22]. The high influx of floodwater discharges through the Red River Floodway at Lockport, followed by frequent ice jams downstream during the spring months (April–May), create an extremely vulnerable flooding scenario for St. Andrews communities. Many of the devastating floods occurring in the flood history of St. Andrews are caused exclusively by the ice jams that form at the river mouth at Lake Winnipeg during high volume of discharge of the Red River Floodway [22] although discharges from the floodway due to summer storms have been a factor. The vulnerable physical setting of St. Andrews made it suitable for exploring the application of a geoinformatics tool, such as HAZUS. The RM of St. Andrews was also selected as study area because the RM had proactively developed a highly detailed spatial and local database, which is relevant and required for testing the HAZUS model.
3. Materials and Methods
3.1. The HAZUS Model
HAZUS-MH is a software package that runs in ArcGIS Desktop (ESRI Inc., Redlands, CA, USA ) created by the Federal Emergency Management Agency (FEMA) of the United States for estimating potential losses from nature-triggered disasters. FEMA released the first version of HAZUS in 1997 as “HAZUS97” for earthquake hazard risk estimation. After that, HAZUS-MH 2.0 for multi-hazards was released in 2004. At the time of the research presented here (conducted in 2015), it was able to work on three particular types of hazards: earthquakes, floods, and hurricanes. However as of 2021, HAZUS-MH (5.1) (Dept. of Homeland Security, Washington, DC, USA ) has been extended to cover tsunami hazards.
HAZUS-MH is a Geographical Information System (GIS)-based hazard loss estimation software package technology that can estimate potential physical, economic, and social impacts of disasters. These estimates are derived using current scientific and engineering knowledge and information. It can also graphically illustrate the impacts to identified high-risk locations [17,23]. Hence, users can visually interpret the spatial distribution of the people, property, and resources at risk, which can assist in emergency preparedness among other management goals [19,24,25]. In recent years, HAZUS has been used in disaster management for a number of purposes: (a) for emergency preparedness through acquiring knowledge of the spatial distribution of the extent of hazard, (b) for choosing mitigation options through acquiring knowledge of potential impact and resultant loss, and (c) for responding precisely in recovery processes by knowing the parameters of risk [17,24].
HAZUS supports three levels of analysis based on the data available, the amount of effort expended in modelling, and expertise of the end user. It is also possible to improve the accuracy of HAZUS loss estimates by furnishing more detailed data about the community or engineering expertise on the building inventory. The levels in the HAZUS study are shown in Figure 2 [18], and described below:
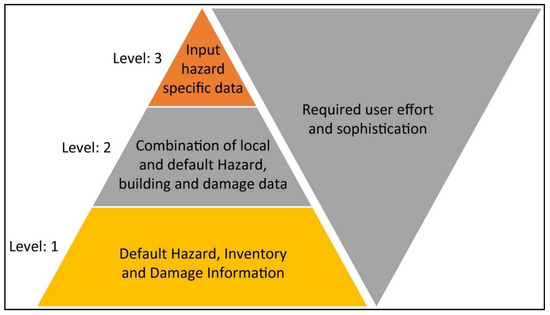
Figure 2.
Levels of study in HAZUS-MH. Source: Compiled after FEMA 2014 [26].
Level 1: A basic estimate of potential hazard losses can be produced based on national databases. This is commonly referred to as the “default” loss estimation technique. However, based on the unique conditions for a specific study region, this level can also play a significant role in estimating close literal loss.
Level 2: This level of study has the potential for more accurate loss estimation than that of Level 1. In this level, national default inventories can be replaced by more precise local inventories of buildings, essential facilities, and other infrastructure, along with detailed information on local hazard conditions. There is no standard way to perform a Level 2 study; rather, it is the user who decides the depth of the analysis. However, background in loss estimation and experience in using HAZUS could be an added advantage to perform the study at this level.
Level 3: In addition to expert adjustment of analysis parameters and the use of advanced HAZUS capabilities, such as the Advanced Engineering Building Module (AEBM) and the Potable Water System Analysis Model (POWSAM), Level 3 is the most sophisticated level for the estimation of actual loss. A Level 3 effort requires participation by earth scientists, structural engineers, land use planners, and/or emergency managers, to provide an accurate inventory and assessment of community vulnerability.
The present research was conducted as a Canadian case study of HAZUS application to a local community—a place—known as the Rural Municipality (RM) of St. Andrews in the province of Manitoba. The case study-based research approach provides in-depth descriptions of a process or phenomenon within a bounded system or setting, e.g., here the flood hazard problem of the RM of St. Andrews [27]. The concept was derived from the hazards-of-place model developed by Cutter [28] (Figure 3). The hazards-of-place model tends to combine both the traditional view of biophysical vulnerability and emerging ideas on social vulnerability. In turn, the HAZUS model was tested to explore its potential for the community’s vulnerability reduction and enhancing resilience to floods.
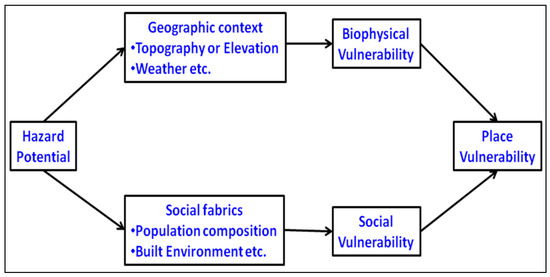
Figure 3.
Hazards-of-place model by Susan Cutter. Source: After Cutter, 1996 [27].
In addition, the potential of a geoinformatics tool (e.g., HAZUS) in flood disaster preparedness, response and planning was explored to find out how the use of the HAZUS model could help in enhancing the community’s capability for flood risk reduction and management. This goal of capacity building could be achieved by offering HAZUS as a useful decision-making tool for estimating flood loss potential.
3.2. Application Process of the HAZUS Model
The HAZUS model has the capacity to assist analysis of different dimensions of natural hazards, such as earthquakes, hurricanes, and floods. This research project considered only the flood model for the study area. The flood model in HAZUS is an integrated system for identifying and quantifying the flood loss risks in the study area. This model consists of two major parts: (i) a flood hazard analysis, and (ii) flood loss estimation analysis. The analytical process of applying HAZUS involved a total of five steps (Figure 4). Step-1 and Step-2 represented in Figure 4 concern and depend on the location of the study area. Some study sites can experience several of the HAZUS hazard models (e.g., earthquakes, tsunamis, and coastal and riverine floods), while others, such as St. Andrews, may only experience one (here riverine flooding). Selecting the flood hazard model analysis determines which libraries of damage and loss relationships that will be used in the second part of the flood model. These can estimate structural damage to buildings, infrastructure, and services through the use of depth–damage analysis predicting direct and indirect costs of a hazard. HAZUS can also use a detailed inventory of the spatial distribution of the population and resources at risk. Step-3, Step-4, and Step-5, as represented in Figure 4, enable creating such an inventory and estimating the magnitude of potential loss and damages. In this study, the riverine flood condition was selected to run the model and from the estimates provided by HAZUS direct and indirect economic losses were computed and results are presented in the Results section. A more detailed description of the steps applying HAZUS follows.
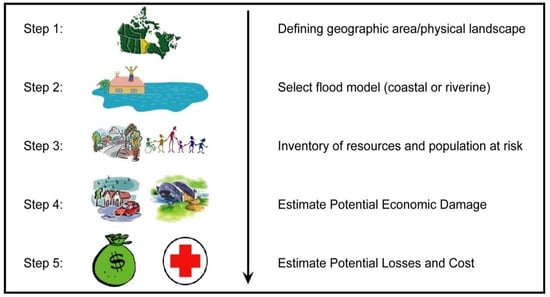
Figure 4.
Steps for HAZUS flood model (is clip-art royalty free?).
3.2.1. Flood Hazard Analysis
The primary task in running HAZUS is to define a geographic area. In the HAZUS model, this is commonly known as defining a “study region”. This is a guided workflow in HAZUS using a Microsoft Windows ‘Wizard’ dialog sequence (Figure 5). When the HAZUS model is run, it prompts the user to create, use, or modify an existing region (1). If the user selects a new region, the wizard opens a welcome page for region creation (2). Basic metadata: the name and its description are prompted (3), and then the selection of a model is sought (e.g., earthquake, flood, or hurricane). For the purpose of this research work, the ‘flood model’ was selected (4). The wizard then asks for analysis level.
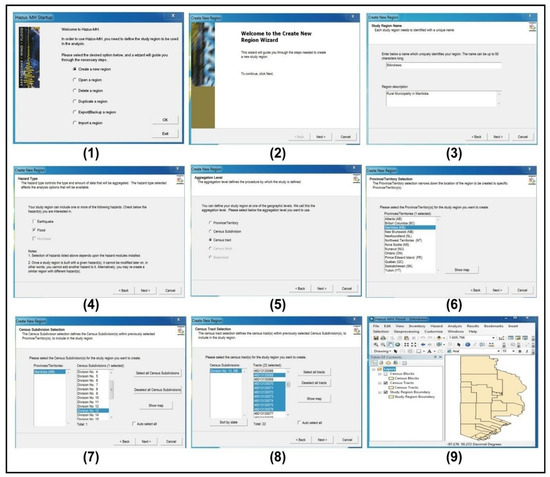
Figure 5.
Workflow to create a study region in HAZUS.
In the present study, census tract level analysis was selected (5). As stated previously, Natural Resources Canada developed a census database for the country and thus the next several steps provide options based on those additions and also will be different (and need to be developed) in jurisdictions outside of the USA and Canada. To select the study area, as part of the province of Manitoba (6), Division 13 (7) was chosen. The subdivisions that consist of the RM of St. Andrews were finally selected (8) to build a study region of St. Andrews (9). The wizard then automatically collated and joined the associated database tables from the HAZUS (Canada) default dataset and opened in ArcGIS Desktop ArcMap with HAZUS tools for analysis.
Users are required to have ESRI’s Spatial Analyst extension installed in the ArcGIS package to run HAZUS. In this study, demonstration of the HAZUS model was explored using (i) Quick Look, and Enhanced Quick Look, and (ii) user-defined depth grid data.
- (i)
- Quick Look Analysis and Enhanced Quick Look Analysis
Quick Look and Enhanced Quick Look are two simple ways to overview the functionality of the HAZUS model. The main difference between these two analysis methods is that Enhanced Quick Look Analysis considers topographic variation, whereas the Quick Look Analysis assumes a flat topography over the defined area. In Quick Look Analysis, a polygon of interest area is drawn manually with an expected constant flood depth that might inundate the area of interest. The model then creates a flood boundary for the area of interest (Figure 6) and then calculates all damage estimates and completes the modelling procedures automatically. In the case of Enhanced Quick Look Analysis, the user needs to provide topographic data (Digital Elevation Model) and a flood plain boundary with vertical units and a vertical datum (Figure 7). The rest of the procedures are automated in the model. For the present research, the entirety Ward-1 was selected as the boundary of floods to standardize the area modelled for software testing and comparison of approaches.
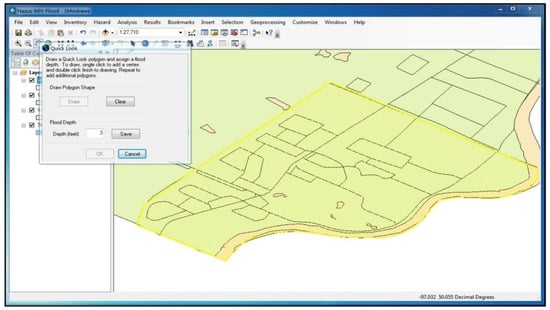
Figure 6.
A step of Quick Look Analysis in HAZUS.
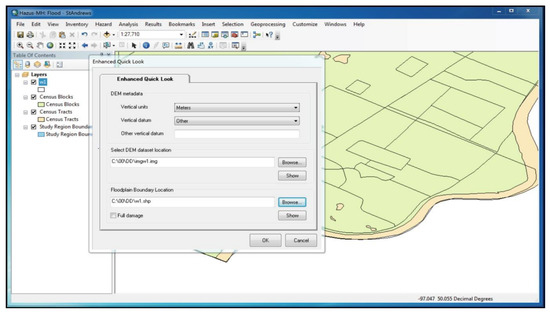
Figure 7.
A step of Enhanced Quick Look Analysis in HAZUS.
- (ii)
- User-defined depth grid-based analysis
For user-defined depth grid-based analysis, the user is required to provide flood depth grid data in ESRI GRID file format. The difference between the ground surface and the flood surface elevations offers the boundary and depth of flooding, i.e., flood depth grid. For topographic elevation, 5 m resolution DEM data were downloaded from the official web library of the Manitoba Land Initiative (MLI). However, due to unavailability of any comprehensive flood surface elevation data for the province of Manitoba, proxy data, that were generated from the flood elevation point data along the Red River and delivered by the Manitoba Infrastructure and Transportation (MIT) of the Government of Manitoba, were used to run the model.
For building the 2009 flood regime, the flood surface level information from the Red River at James Avenue was used. The station gauge estimates that during 2009 flood the water level rose as high as 228.6 m, or 750 feet. This water surface elevation was also valid for Ward-1 of the RM of St. Andrews. Hence all the areas in Ward-1 which have an elevation less than 750 feet had undergone flooding. The Red River Floodway discharges its water after Lockport in Ward-3. The flood surface elevation after this portion of the municipality changes significantly. Assuming this, all elevation information below 750 feet was declared as “No Data” in the reclassification technique of ArcGIS and a new raster GRID file of flood-free surface area at the 2009 flood level was prepared. The collected DEM data were then subtracted by this new flood-free surface data, which created a flood inundated area by using the “minus” operation in “spatial analysis” of ArcGIS. Another flood regime was constructed in the same way considering an additional 2 m rise of floodwater in the study area. A conceptual diagram showing the relationship among ground surface elevation, flood surface elevation, normal water surface elevation and flood depth grid is presented in Figure 8 showing the flooded area.
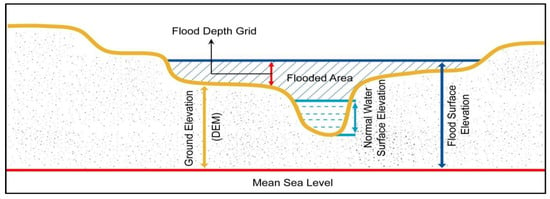
Figure 8.
Conceptual diagram showing the calculation procedure of the flooded area.
After providing the newly created proxy flood depth grid data, two new flood regimes were created by selecting the area of interest in HAZUS. The database was then run using the ‘riverine model’. The model was run by delineating the floodplain boundary under the riverine model option in HAZUS (Figure 9).
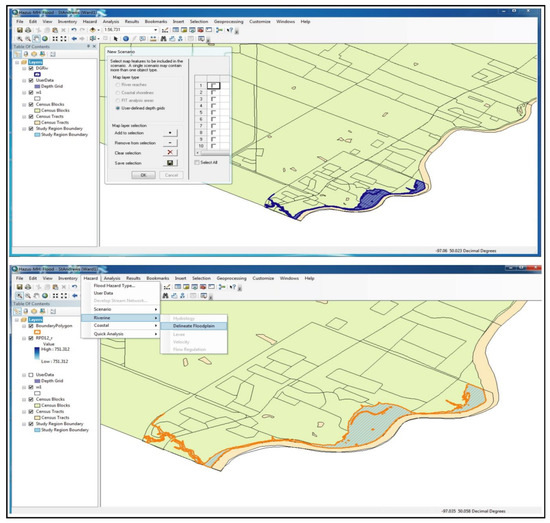
Figure 9.
Sample steps of user-defined depth grid data-based analysis in HAZUS.
3.2.2. Flood Loss Estimation Analysis
The automated riverine analysis built in HAZUS calculates the flood hazard area and estimates subsequent loss and damages associated with the flood depth in economic terms (i.e., values in dollar). The spatial distribution of population and resources at risk within the flood boundary can also be determined from the built-in inventory data included within the model. The model commonly uses national data on the general building stock to estimate direct physical damage to buildings and their contents. In the case of the present research, it produced a summary report showing the inventory and potential damages. The exposure of buildings and estimated potential losses in economic values were automatically calculated and output as reports. Depth–damage curves were then applied to determine magnitude of damages. The resulting damage and loss estimates were applied to all building occupancy classifications and general building types. Maps were then prepared in HAZUS to depict the estimated damages for each of the building types. The “Natural Break” classification scheme was adopted to show the distributional pattern of the damages into several categories.
4. Results
4.1. Prospect of Application of the HAZUS Model to Canadian Communities—RM of St. Andrews in Manitoba
In the HAZUS models run for the RM of St. Andrews (Manitoba, Canada), the built-in Canadian database provides attributes for 369 Census Dissemination Blocks for the full geographic study region of 463.98 sq km. According to Statistics Canada census data, the study region contains over 4000 households and 12,818 people living in them. There are an estimated 4473 buildings in the region with a total building replacement value of CAD 837 million. Approximately 93.8% of the buildings are associated with residential housing. However, it should be underscored here that the estimates of social and economic impacts contained in the present study, generated using the HAZUS model, were based on scientific tools available at the time of this research (2015). As there are uncertainties inherent in any loss estimation technique, the estimates are approximations of the on-the-ground reality.
4.1.1. Quick Look Analysis and Enhanced Quick Look-Based Analysis
The flood Quick Look Analysis is a built-in option in the HAZUS model where the user can quickly estimate the magnitude of potential damage and loss by drawing areas of uniform flood depths. The analysis performed in this way is therefore based on user-supplied, often anecdotal, information. Users are required to enter anticipated flood depths for an area of their selection. Based on the infrastructure present in the area selected, approximate damages are estimated by the HAZUS model.
The Enhanced Quick Look Analysis uses topographic data, such as DEM, and users need to provide a polygon that represents the floodplain boundary. The model then estimates a flood depth within that boundary. It is thus this approach that offers a relatively improved representation of the flood regimes as it considers the topographic elevation while also providing a quick analysis [29,30,31].
To investigate the prospect of Quick Look Analysis and Enhanced Quick Look Analysis, both analyses were run in the HAZUS model for Ward-1 in the RM of St. Andrews. Maps produced by each of the analyses are presented in Figure 10. While Quick Look Analysis inundated the entire area with uniform flood depth, the Enhanced Quick Look Analysis with topographic data shows variable flooding depth in different parts of the ward. This analysis reveals that areas along the Red River and its tributaries, and the oxbow lake area would be flooded to higher water levels. During the field visit, the chief executive officer of the RM of St. Andrews also mentioned that the oxbow lake area is their most serious concern for flood damage. These findings signify and validate the robustness of the HAZUS mode.
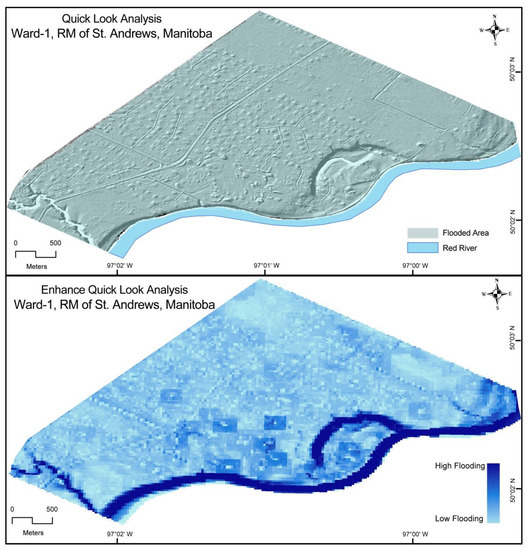
Figure 10.
Quick Look and Enhanced Quick Look Analysis in HAZUS.
Table 1 summarizes the expected damage by general occupancy for the buildings in the study area and Table 2 summarizes the expected damage by general building type for both Quick Look and Enhanced Quick Look Analysis. The Quick Look Analysis estimates that about 487 buildings would be at least moderately damaged and an estimated 20 buildings would be destroyed in Ward-1. The Enhanced Quick Look Analysis estimates that about 113 buildings would be moderately damaged and an estimated 20 buildings would be destroyed. The total number of affected buildings is much higher in Quick Look Analysis because of application of uniform flood depth for the entire study region, which is likely to be an inflated estimation. However, the amount of substantial damage (damage more than 50%) is the same for both analyses whereas they vary noticeably in terms of expected damages by building types (Table 2). While Quick Look Analysis predicted substantial damages would be for “Manufactured Houses”, the Enhanced Quick Look Analysis predicted that “Wooden Houses” would have damage greater than 50%. This reflects the ground condition, where most of the houses closest to the river and in the oxbow area are newer and of wooden construction, whereas manufactured houses (mostly trailers) are found at some of the highest ground elevations in the ward.

Table 1.
Expected damage by general occupancy for the buildings.

Table 2.
Expected damage by general building types.
4.1.2. User-Defined Data-Based Analysis
Contrary to the default analysis of Quick Look and Enhanced Quick Look, a more comprehensive HAZUS analysis can be performed by user-defined analysis. This analysis follows a simple four step operation for a comprehensive output—(a) defining the physical landscape, (b) inventorying of the population and resources at risk, (c) estimating potential damage, and (d) estimating potential losses and cost. For the purpose of this research work, two flood regimes were analyzed in HAZUS. The first one was at the flood level of 2009, which is a 33 year return flood and has also severely affected the municipality in recent past. The second flood regime hypothesized an additional 2 m of flood water rise from the 2009 level. The following sections explain the five steps of the user-defined HAZUS model comparing both flood regimes. This comparative analysis is intended explore further the prospect of the HAZUS model in the context of Manitoba.
- (a)
- Defining the physical landscape
The first step is to identify the ground surface elevation and flood surface elevation. The ground surface elevation could be retrieved from the LiDAR-based Digital Elevation Model (DEM) data, which were collected from the digital library of the Manitoba Land Initiative (MLI). The 5 m resolution DEM data were produced for an area of approximately 2883 sq km in the Red River Valley. Due to unavailability of flood surface elevation, the flood inundated area of the 2009 flood level (for the first 2009 flood regime) at 228.6 m or 750 feet and an additional 2 m rise of flood water (for the 2009 + 2 m flood regime) at 230.6 m or 756 feet were used.
- (b)
- Inventorying of population and resources at risk
HAZUS is capable of inventorying population and resources at risk within four broad categories, including: (1) general building stock: inventorying residential, commercial, industrial and other resources at risk; (2) demographic data: aggregated by household, population, sex, age, and income; (3) essential facilities: location of police, fire, emergency operations facilities, schools, medical centers; and (4) lifelines: utilities and transportation.
An inventory layer was provided by the RM and Figure 11a,b represents the inundation area affected buildings predicted by the two flood regimes. The red dots in these figures represent the location of the potentially affected buildings, and the yellow dots represent potentially unaffected buildings at the two different stated levels of flooding. Ward-1 has a dike along the Red River with an average height of 730 feet from the mean sea level. The local government also built community dikes in other areas of the RM. These neighborhood and individual dikes were also built at an average height of 730 feet from the mean sea level. For Ward-1, a water level below 730 feet would not affect the community people in a noticeable way. However, in 2009 the flood water rose at an average of 750 feet from mean sea level and thereby created massive destruction.
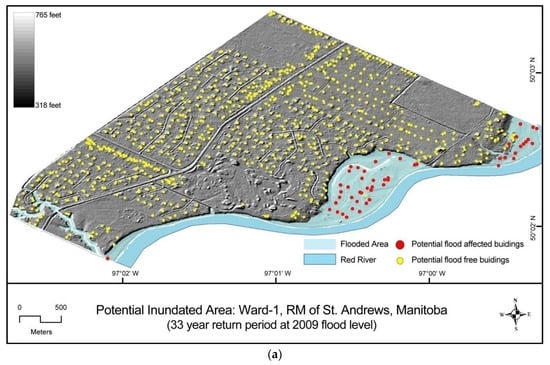
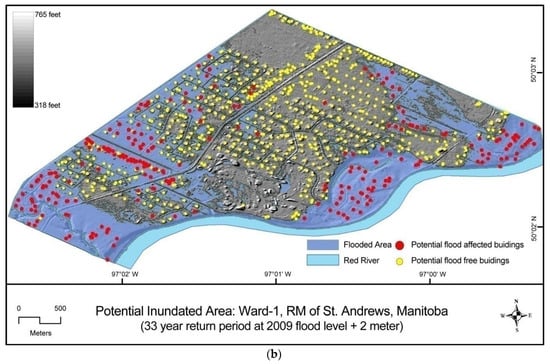
Figure 11.
(a) Potential inundated area using EQL with building stock (2009 flood regime) in Ward-1, RM of St. Andrews. (b) Potential inundated area using EQL with building stock (2009 + 2 m flood regime) in Ward-1, RM of St. Andrews at 2009 flood level + 2 m.
The EQL with building stock (2009 flood regime) reveals that floods at the 2009 level could inundate areas along the Red River and the entire area of the oxbow lake (Figure 11a). However, the EQL with building stock (2009 + 2 m flood regime) indicates that an increase in flood water by 2 additional meters could inundate almost 50% of Ward-1 (Figure 11b). HAZUS estimates that about 42 buildings will be affected if a flood like the 2009 level occurs in Ward-1 using the integrated census data. This is about 9% of the total number of buildings in the said flood regime. Although the HAZUS model identified 42 (EQL with building stock (2009 flood regime) and 146 (EQL with building stock (2009 + 2 m flood regime) potentially affected buildings, Figure 11a,b represent 51 and 247 dots. This is because the latter values reflect new constrictions included in the building stock in the RM’s database. HAZUS also estimates that there are 4473 buildings in the region, which have an aggregate total replacement value of CAD 837 million. The distribution of exposure values with respect to the general occupancies (487 for the entire ward; 42 for 2009 flood regime and 146 for 2009 + 2 m flood regime) by study region and flood regimes (the area affected by the flood event) is shown in Table 3.

Table 3.
Building stock exposure of values.
- (c)
- Estimating potential damage
The flood model in HAZUS performs its analysis at the census block level. For rural areas, this means that the analysis starts with a small number of buildings within each census block and applies a series of distributions necessary for analyzing the potential damage. The application of these distributions and the small number of buildings make the flood model more sensitive to rounding errors.
Although damage estimation in HAZUS includes damage to buildings (residential, commercial, industrial, etc.), essential facilities (hospitals, schools, fire stations, etc.), high potential loss facilities (dams/levees, waste disposal sites, military installations, etc.), and transportation facilities (roads, bridges, and ports), because of limited data availability, the HAZUS models in this study shows only the potential damages to buildings. The models report that private residences, commercial, and industrial buildings are the three major types of buildings in the study area likely to be affected by flooding. The detailed inventory of the damages by type of occupancy are listed in Table 4 and shows that private building damage of 85% and 86% would occur when we use EQL with building stock (2009 flood regime) and EQL with building stock (2009 + 2 m flood regime), respectively. For EQL with building stock (2009 flood regime), 10% damage would occur to the commercial buildings, while for EQL with building stock (2009 + 2 m flood regime), 12% damage would take place for the same category. Industrial damage for the case of EQL with building stock (2009 flood regime) will be below 5%, and less than 1% damage would occur in other types of buildings, such as religious buildings, e.g., churches, NGO buildings, etc. (Figure 12).

Table 4.
Potential economic losses in the study area (in CAD millions).
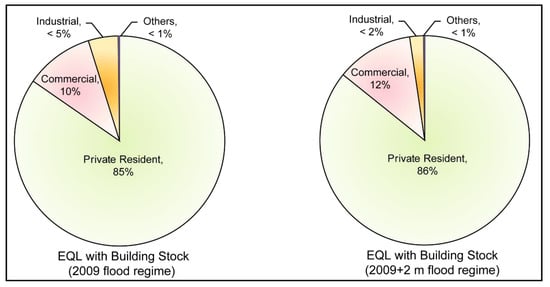
Figure 12.
Estimated potential damage by types of building.
- (d)
- Estimating potential loss and cost
For 2009 flood regime, the total economic loss estimated by HAZUS EQL model is CAD 11.12 million, which represents 22.84% of the total replacement value of the said flood regime buildings. The total building-related losses were CAD 11.09 million, where the residential occupancies alone made up 84.64% (CAD 9.41 million) of the total loss. For 2009 + 2 m flood regime, the total economic loss estimated by the HAZUS EQL model was CAD 41.43 million, which represents 31.06% of the total replacement value of the said flood regime buildings. The total building-related losses were CAD 41.36 million, where residential occupancies alone made up 85.79% (CAD 35.55 million) of the total loss.
A summary of the losses associated with the building damage for both flood regimes is shown in Table 4. The building-related losses are divided into two categories: direct building losses and business interruption losses. The direct building losses are the estimated costs to repair or replace the damage caused to the building and its contents. The business interruption losses are the losses associated with the inability to operate a business because of the damage sustained during the flood. Business interruption losses also include the temporary living expenses for those people displaced from their homes because of the flood.
Along with the numerical estimates of flood loss in dollar values, the HAZUS model also has the potential to visually interpret the spatial distribution of affected areas. For example, Figure 13a,b depicts the flood loss distributional pattern (in Canadian dollars) for both of the flood regimes. The darker the gradient in the maps represents a higher degree of potential flood loss. These visual interpretations can help the emergency planners to make appropriate decisions on emergency response and recovery measures.
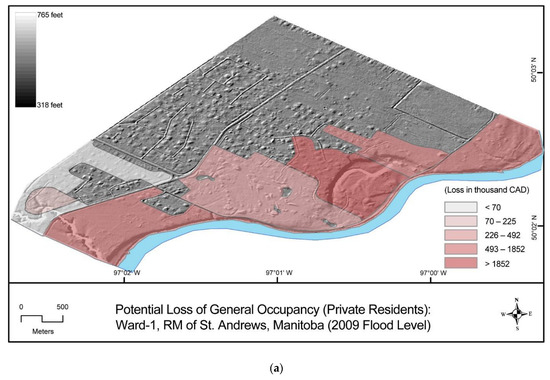
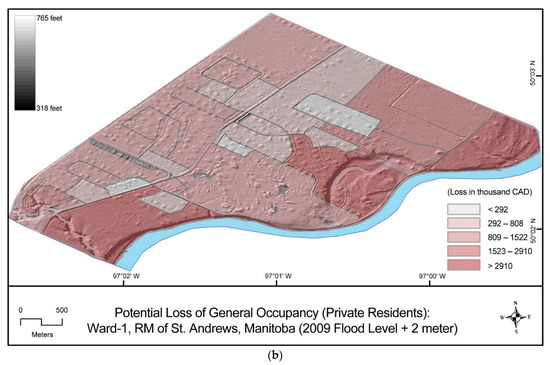
Figure 13.
(a) Potential private resident loss using EQL with building stock (2009 flood regime). (b) Potential private resident loss using EQL with building stock (2009 + 2 m flood regime).
Finally, the model also computed the possible damage to buildings and infrastructure that may result from a range of flooding levels. For this research, a summary of damage showing the potential building damages has been represented in Figure 14. As the municipality has dikes built to 730 feet height in Ward-1, no flood water below this water surface level would therefore adversely impact the community members. Estimated damages of flood loss from 750 feet to every 1 foot increase in flood water surface level has been computed in HAZUS and the estimated losses are presented in Figure 14, which indicates that, although there will be nominal increases in flood loss for commercial and industrial buildings with increasing floodwater surface level, severe adverse impacts can take place in private residence flood loss.
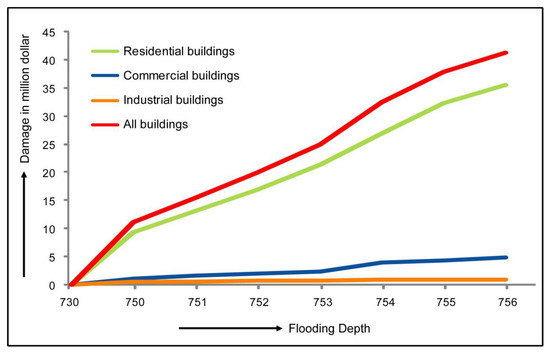
Figure 14.
Damage function showing increasing flood loss (in dollars) with increasing flooding level.
5. Discussion
The prospect of applying the HAZUS software and its associated models to emergency preparedness, choosing mitigation options, and acting precisely on the response and recovery phase during and after the flood disasters in St. Andrews is very good. A synthesis of these potential applications of the standardized HAZUS model is shown in Table 5a–c.

Table 5.
(a) Potential applications of HAZUS in emergency preparedness. (b) Potential applications of HAZUS in choosing mitigation strategy. (c) Potential applications of HAZUS in disaster response and recovery.
The RM of St. Andrews or similar local communities of Manitoba can benefit from some recent examples of the HAZUS application and their successes in the local communities of the USA. For flooding in the Devils Lake Basin, North Dakota, USA, researchers successfully identified the location of inundated buildings on maps, and with the help of HAZUS, the locations were then classified and assessed by the value of properties. The present study demonstrated that the HAZUS model could potentially identify the inundated area and spatial distribution of affected buildings; in addition, the model could also estimate the market economic values of the associated loss and damages. This type of assessment could be used by the provincial and local governments for planning and formulating disaster response and recovery strategies. Well planned response and recovery strategies could improve community resilience to flooding disasters by allowing a rapid return to pre-disaster conditions.
Based on the market economic values of flood losses of the existing establishments within the flood zones (which can be produced by the HAZUS model as explained in this paper), the local administration and community members could assess cost–benefit analysis to consider relocating existing establishments as well. In a nutshell, HAZUS-based flood zoning could help the local community as a tool for undertaking a long-term non-structural flood control measure, which also could potentially help them in disaster management by reducing disaster risk. For example, a project carried out by the Geospatial Intelligence Unit (GIU) and the Risk Analysis Branch at The Federal Emergency Management Agency (FEMA) on the case of flooding in the Yukon River Basin, Alaska, USA, successfully prepared flood zoning maps in the affected areas to illustrate to the community members about the safe zones for rebuilding.
In recent years the evidence of success in the application of HAZUS in local disaster management has also accumulated substantially [13]. Studies in recent years found several drivers of possible flood loss, some major drivers are: area of county land susceptible to a 100 year flood; square footage of buildings potentially affected; number of buildings potentially damaged; direct economic losses tied to buildings. These studies provide a good foundation for a state/provincewide flood vulnerability analysis that other states/provinces might employ.
HAZUS outputs can also be used during the disaster response period. On the one hand, identification of vulnerable roads could potentially ensure the safety of human lives by declaring the closure of vulnerable roads. On the other hand, the identification of safe evacuation routes could also potentially help to evacuate flood victims and to supply emergency medical services as well as food and other relief. For tactical decisions such as these, the custom tool with building stock and location of specific infrastructure would likely improve decisions over the use of census aggregate data.
Above all, the built-in capability of ArcGIS in the HAZUS model has also the potential to explore the social vulnerability of a study region. The census data used in HAZUS could potentially calculate and represent the social vulnerability of a study area. The local governments as well as the provincial governments in Canada can assess the level and distribution of socially vulnerable groups in areas of interest. This will help the government agencies in planning for procuring the necessary supports during emergencies as well as for formulating the recovery strategy in the post-disaster period.
The model presented in this paper was part of a preliminary investigation to establish whether HAZUS can be applied in a Canadian context. The major goal was to identify the types of data required, to determine what types of gaps exist presently, and to extract fruitful outputs from the model. It is important here to reveal some of the noticeable limitations and gaps to appropriately run the model:
- First floor height and foundation type: Theoretically the HAZUS framework supports different foundation types as a parameter in flood assessment. The model as developed in the USA only takes the basement foundation type into account. For all other foundation types there is no difference on flood loss assessment. Hence the first-floor elevation is crucial for running the HAZUS model. Although the RM of St. Andrews has a database with some first-floor elevation height, the data are not standardized and there are also a significant number of missing data. This is likely very true of most Canadian RMs.
- Disadvantage of aggregated data in flood assessment: The building stocks and demographic data are aggregated using census data and included in HAZUS. The problem of aggregated data in flood assessment is that the location of aggregated objects is unknown and in Canada, for many rural areas, census polygons are very large. An inventory of building stock with the exact locations of those structures is necessary for accurate predictions in rural areas in Canada.
- Unavailable Flood Information Table (FIT): The most important aspect for running the riverine flood model is to have a comprehensive Flood Information Table (FIT). At present HAZUS Canada does not have built-in FIT to run the model. FIT could be created with the help of ground surface elevation, flood surface elevation and flood boundaries. At the time of this study only 5 m resolution DEM data were available, and the coverage of the floodplain was limited to either side of the river channel. This has improved, but in addition, comprehensive flood boundaries are still not available and would greatly augment these kinds of analyses. For many large rivers Lidar data are being made available, but this issue persists for smaller watersheds. Generating food depth grid data to run a comprehensive flood model in HAZUS will therefore be a challenging task for many RMs.
6. Conclusions
The HAZUS model can map the spatial distribution of hazards and estimate economic damage and the potential effects of flood disasters on the population. The numerical as well as visual interpretation of loss and damages can help emergency managers to make timely and appropriate decisions. The output of the HAZUS model can be used in decision-making for developing mitigation, emergency preparedness, and recovery policies. As the present study in Canada demonstrated, the HAZUS model and software can effectively help local community people to enhance their resilience to natural hazards in countries outside the USA. Understanding and pre-disaster action to reduce the potential loss and damage can reduce vulnerability of people and places to flood hazards significantly.
Author Contributions
Conceptualization, C.E.H. and K.H.M.; methodology, K.H.M., D.W. and C.E.H.; software, K.H.M. and D.W.; validation, C.E.H., K.H.M. and D.W.; formal analysis, K.H.M. and C.E.H.; investigation, K.H.M. and C.E.H.; resources, C.E.H.; data curation, K.H.M. and D.W.; writing—original draft preparation, C.E.H. and K.H.M.; writing—review and editing, C.E.H. and D.W.; visualization, C.E.H. and K.H.M.; supervision, C.E.H. and D.W.; project administration, C.E.H.; funding acquisition, C.E.H. All authors have read and agreed to the published version of the manuscript.
Funding
This research was funded by the Social Science and Humanities Research Council (SSHRC), Ottawa, Canada, InSight Grant #435-2018-552.
Data Availability Statement
The datasets used and/or analyzed during the present study are available from the corresponding author on reasonable request.
Acknowledgments
The authors are thankful to the Social Science and Humanities Research Council (SSHRC), Ottawa, Canada (InSight Grant #435-2018-552) for funding this research. We are also thankful to Jeremy Angus, Deputy Minister, Manitoba Infrastructure, for his interest in our research and help, and to the community participants from the Rural Municipality of St. Andrews, Manitoba, Canada for their kind collaboration with the field work.
Conflicts of Interest
The authors declare no conflict of interest. The funders had no role in the design of the study; in the collection, analyses, or interpretation of data; in the writing of the manuscript, or in the decision to publish the results.
References
- Glago, F.J. Flood disaster hazards; causes, impacts and management: A state-of-the art review. In Natural Hazards; Farsangi, E.N., Ed.; Intechopen Ltd.: London, UK, 2021. [Google Scholar] [CrossRef]
- Rentschler, J.; Salhab, M. People in Harm’ Way: Flood Exposure and Poverty in 189 Countries. In Policy Research Working Paper 9447; The World Bank Group: Washington, DC, USA, 2020. [Google Scholar]
- Welsted, W.; Everitt, J.; Stadel, C. Manitoba: Geographical Identity of a Prairie Province. In The Geography of Manitoba: Its Land and Its People; Welsted, J., Everitt, J., Stadel, C., Eds.; The University of Manitoba Press: Winnipeg, MB, Canada, 1996; pp. 3–7. [Google Scholar]
- Rannie, W.F. The 1997 Red River flood in Manitoba, Canada. Prairie Perspect. Geogr. Essays 1998, 1, 1–24. [Google Scholar]
- Haque, C.E.; Mahmud, K.H.; Walker, D.; Zaman, J.R. Geophysical and Societal Dimensions of Floods in Manitoba, Canada: A Social Vulnerability Assessment of the Rural Municipality of St. Andrews. Geosciences 2022, 12, 56. [Google Scholar] [CrossRef]
- Kalssen, R.W. Quaternary geology and geomorphology of Assiniboine and Qu’appelle valleys of Manitoba and Saskatchewan. In Bulletin of Geological Survey of Canada; Department of Energy, Mines and Resources: Ottawa, ON, Canada, 1975; Volume 228, pp. 61–69. [Google Scholar]
- Halsey, L.; Vitt, D.; Zoltai, S. Climatic and physiographic controls on wetland type and distribution in Manitoba. Wetl. Soc. Wetl. Sci. 1997, 17, 243–262. [Google Scholar] [CrossRef][Green Version]
- Haque, C.E. Risk assessment, emergency preparedness and response to hazards: The case of the 1997 Red River valley flood, Canada. Nat. Hazards 2000, 21, 225–245. [Google Scholar] [CrossRef]
- Government of Manitoba. History of Flooding in Manitoba. Available online: https://www.gov.mb.ca/flooding/history/index.html (accessed on 12 May 2022).
- Haque, C.E.; Choudhury, M.-U.-I.; Sikder, M.S. Events and failures are our only means for making policy changes: Learning in disaster and emergency management policies in Manitoba, Canada. Nat. Hazards 2019, 98, 137–162. [Google Scholar] [CrossRef]
- Remo, J.W.F.; Pinter, N.; Mahgoub, M. Assessing Illinois’s flood vulnerability using Hazus-MH. Nat. Hazards 2016, 81, 265–287. [Google Scholar] [CrossRef]
- Allen, M.; Gillespie-Marthaler, L.; Abkowitz, M.; Camp, J. Evaluating flood resilience in rural communities: A case-based assessment of Dyer County, Tennessee. Nat. Hazards 2020, 101, 173–194. [Google Scholar] [CrossRef]
- FEMA. HAZUS-MH Flood Model. 2018. Available online: https://www.fema.gov/protecting-our-communities/hazus-mh-flood-model (accessed on 19 December 2021).
- FEMA. HAZUS User Groups Success Story: Using Hazus at Devils Lake, North Dakota. 2013. Available online: https://www.fema.gov/media-library/assets/documents/22095 (accessed on 17 December 2021).
- FEMA. Eagle, Alaska Uses HAZUS to Map Safe Rebuilding Zones Following Ice Jam Devastation. 2010. Available online: http://www.fema.gov/media-library/assets/documents/19657 (accessed on 14 December 2021).
- Scawthorn, C.; Blais, N.; Seligson, H.; Tate, E.; Mifflin, E.; Thomas, W.; Murphy, J.; Jones, C. HAZUS-MH flood loss estimation methodology. I: Overview and flood hazard characterization. Nat. Hazards Rev. 2006, 7, 60–71. [Google Scholar] [CrossRef]
- Vickery, P.J.; Skerlj, P.F.; Lin, J.; Twisdale Jr, L.A.; Young, M.A.; Lavelle, F.M. HAZUS-MH hurricane model methodology. II: Damage and loss estimation. Nat. Hazards Rev. 2006, 7, 94–103. [Google Scholar] [CrossRef]
- Ding, A.; White, J.F.; Ullman, P.W.; Fashokun, A.O. Evaluation of HAZUS-MH flood model with local data and other program. Nat. Hazards Rev. 2008, 9, 20–28. [Google Scholar]
- Porter, K. Cracking an Open Safe: HAZUS Vulnerability Functions in Terms of Structure-Independent Spectral Acceleration. Earthq. Spectra 2009, 25, 361–378. [Google Scholar] [CrossRef]
- Manitoba Historical Society. 2014. Available online: http://www.mhs.mb.ca/docs/municipalities/standrews.shtml (accessed on 6 July 2014).
- RM of St. Andrews. 2014. Available online: http://www.rmofstandrews.com/main.asp?cat_ID=2 (accessed on 12 November 2021).
- StatCan. 2011. Available online: http://www12.statcan.gc.ca/census-recensement/2011/dp-pd/prof/details/page.cfm?Lang=E&Geo1=CSD&Code1=4613043&Geo2=PR&Code2=46&Data=Count&SearchText=St.%20Andrews&SearchType=Begins&SearchPR=01&B1=All&Custom= (accessed on 21 July 2021).
- FEMA. 2008b; Wisconsin Emergency Management: Using HAZUS-MH to Evaluate Flood Risks and Losses across the State. Available online: https://www.fema.gov/media-library/assets/documents/13647 (accessed on 12 December 2021).
- Schneider, P.J.; Schauer, B.A. HAZUS—Its development and its future. Nat. Hazards Rev. 2006, 7, 40–44. [Google Scholar] [CrossRef]
- Banks, J.C.; Camp, J.V.; Abkowitz, M.D. A screening method for bridge scour estimation and flood adaptation planning utilizing HAZUS-MH 2.1 and HEC-18. Nat. Hazards 2016, 83, 1731–1746. [Google Scholar] [CrossRef]
- FEMA. HAZUS-MH Flood Model. 2014. Available online: https://www.fema.gov/sites/default/files/2020-09/fema_hazus_flood_user-guidance_4.2.pdf (accessed on 11 May 2022).
- Lincoln, S.Y. Naturalistic Inquiry; Egon, G., Ed.; Sage Publications: London, UK, 1985; Volume 75. [Google Scholar]
- Cutter, S.L. Vulnerability to Environmental Hazards. Prog. Hum. Geogr. 1996, 20, 529–539. [Google Scholar] [CrossRef]
- Kulmesch, S. Evaluation of the HAZUS-MH Loss Estimation Methodology for a Natural Risk Management Case Study in Carinthia, Austria. Ph.D. Thesis, Louisiana State University, Baton Rouge, LA, USA, 2010. [Google Scholar]
- Huyck, C.K.; Amyx, P.R. Technologies for real-time data acquisition, integration, and transmission. In Wiley Handbook of Science and Technology for Homeland Security; Voeller, J.G., Ed.; John Wiley and Sons: Hoboken, NJ, USA, 2010. [Google Scholar]
- Donnellan, A.; Glasscoe, M.; Parker, J.W.; Granat, R.; Pierce, M.; Wang, J.; Fox, G.; McLeod, D.; Rundle, J.; Heien, E.; et al. Integrating remotely sensed and ground observations for modeling, analysis, and decision support. In Proceedings of the Aerospace Conference, Big Sky, MT, USA, 2–9 March 2013; pp. 1–12. [Google Scholar]
Publisher’s Note: MDPI stays neutral with regard to jurisdictional claims in published maps and institutional affiliations. |
© 2022 by the authors. Licensee MDPI, Basel, Switzerland. This article is an open access article distributed under the terms and conditions of the Creative Commons Attribution (CC BY) license (https://creativecommons.org/licenses/by/4.0/).