
Understanding Flood Risk and Vulnerability of a Place: Estimating Prospective Loss and Damage Using the HAZUS Model


Abstract
1. Introduction
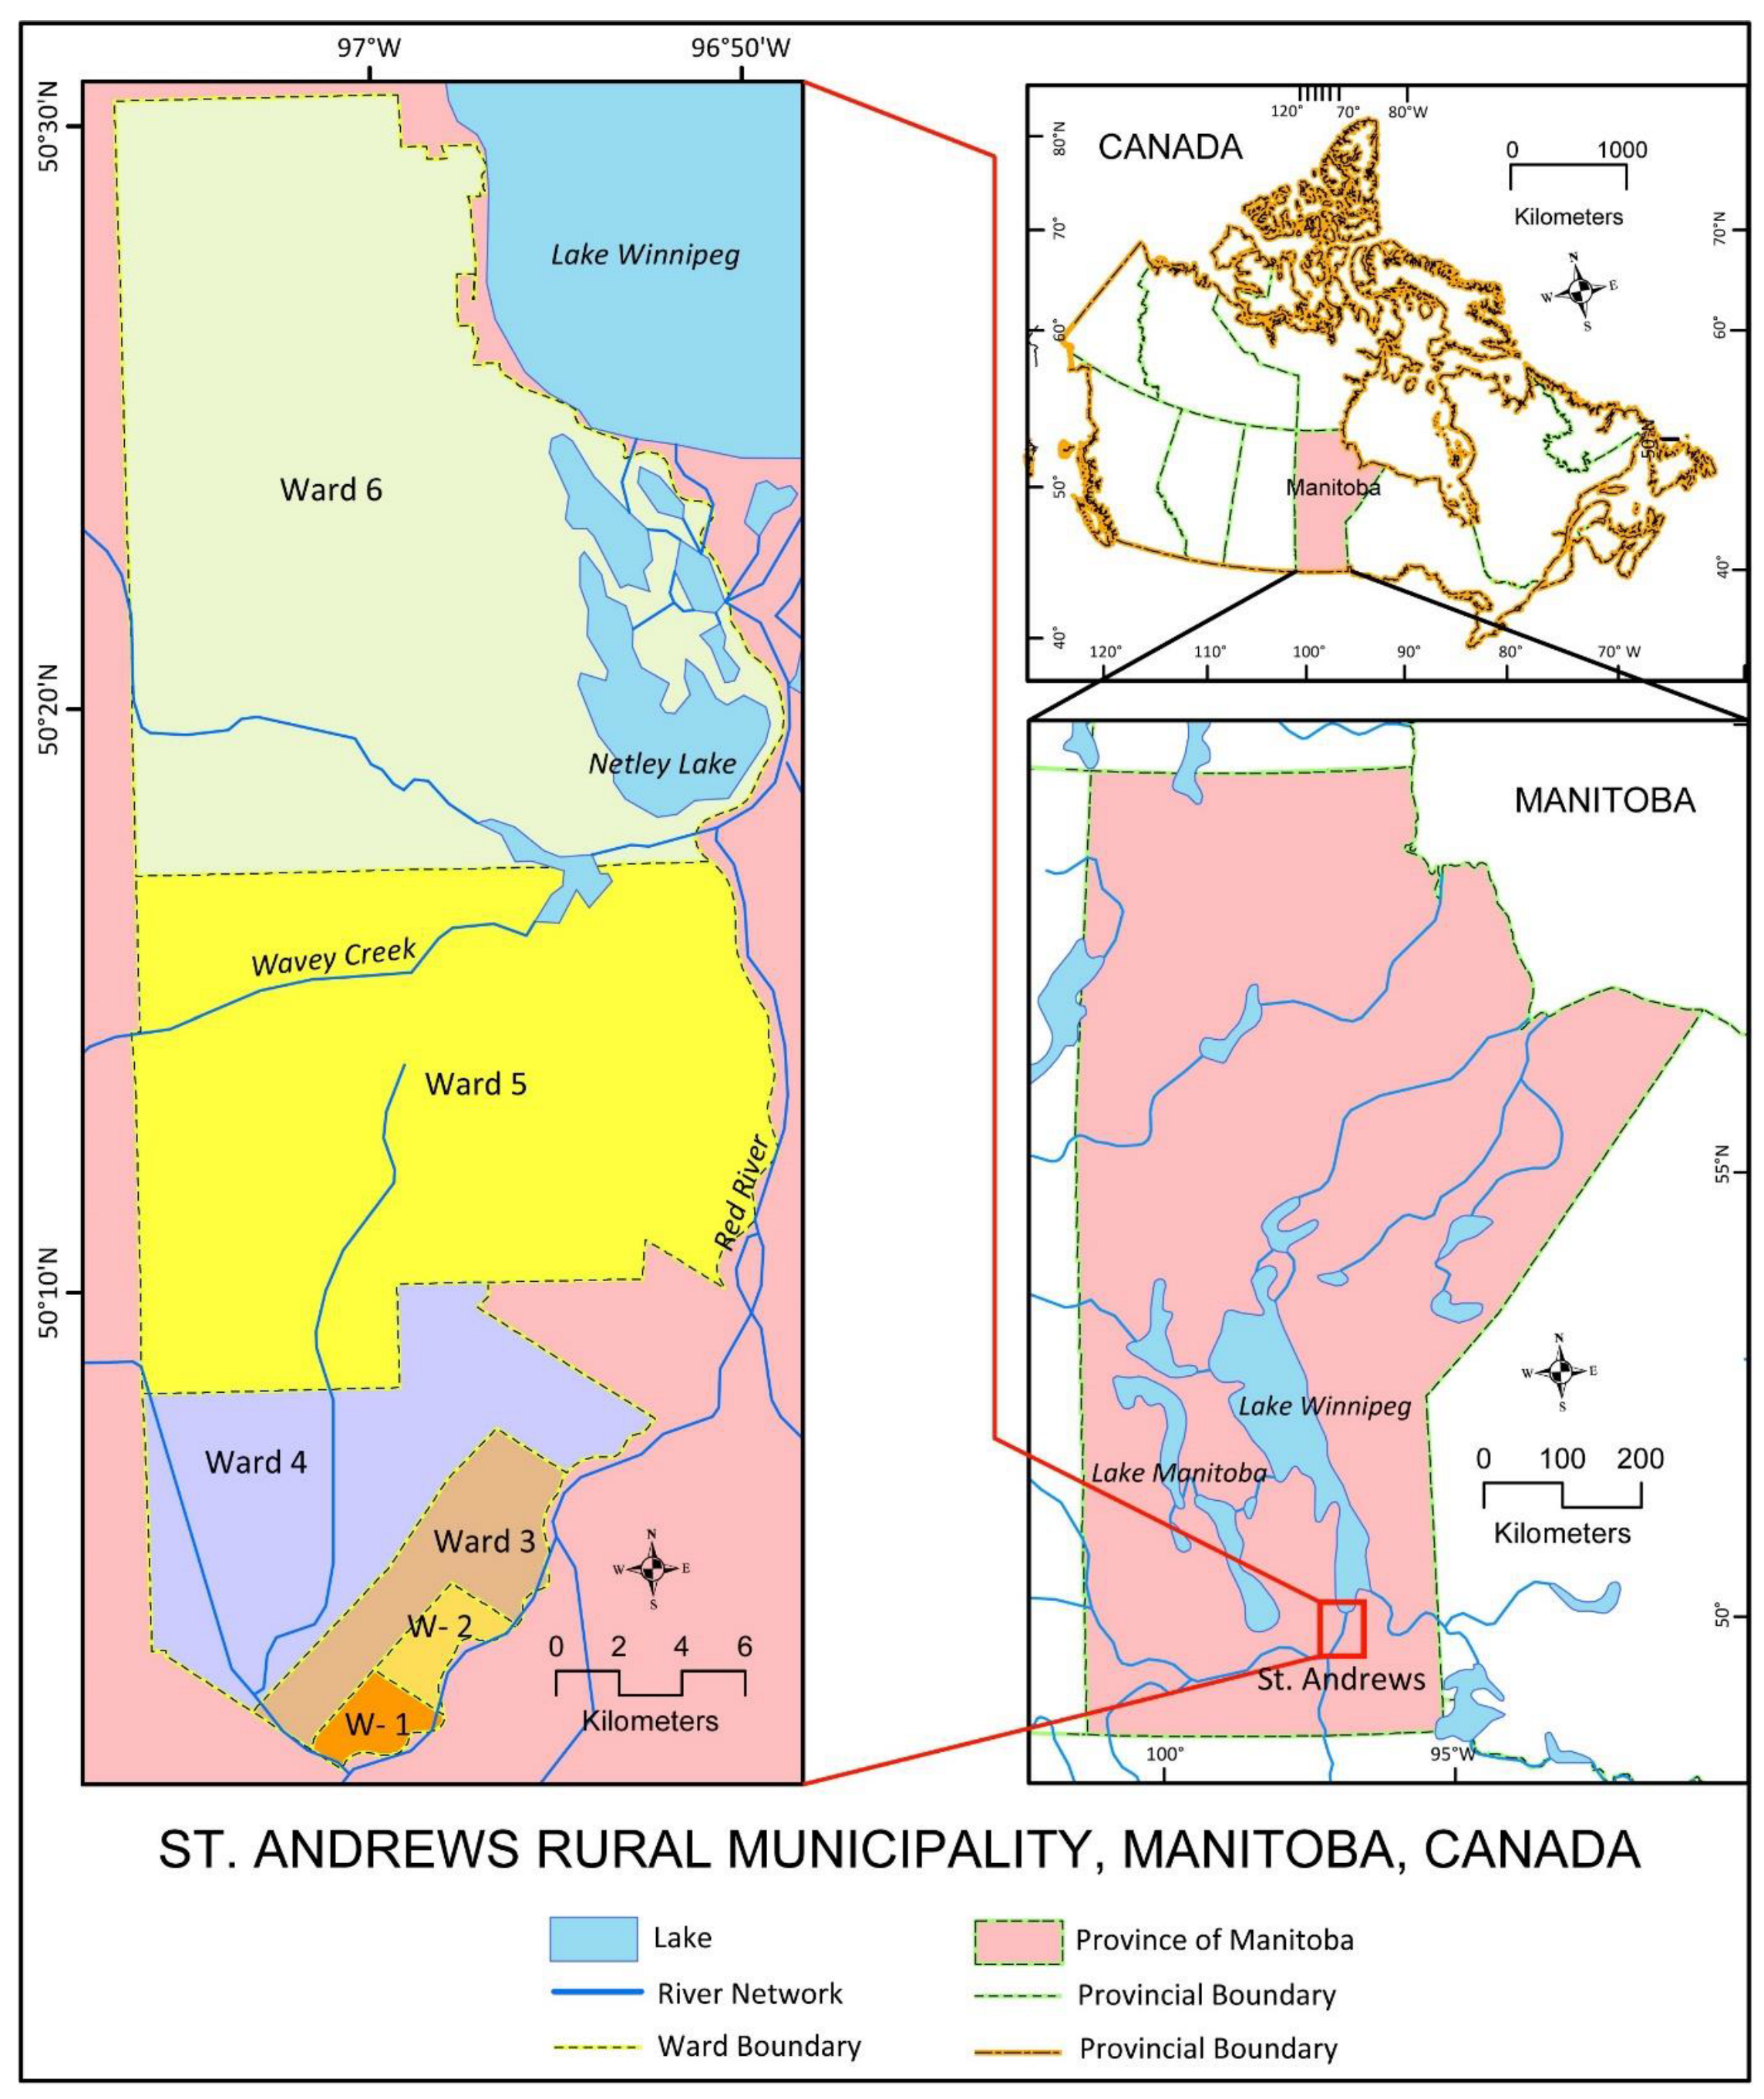
2. Study Area
3. Materials and Methods
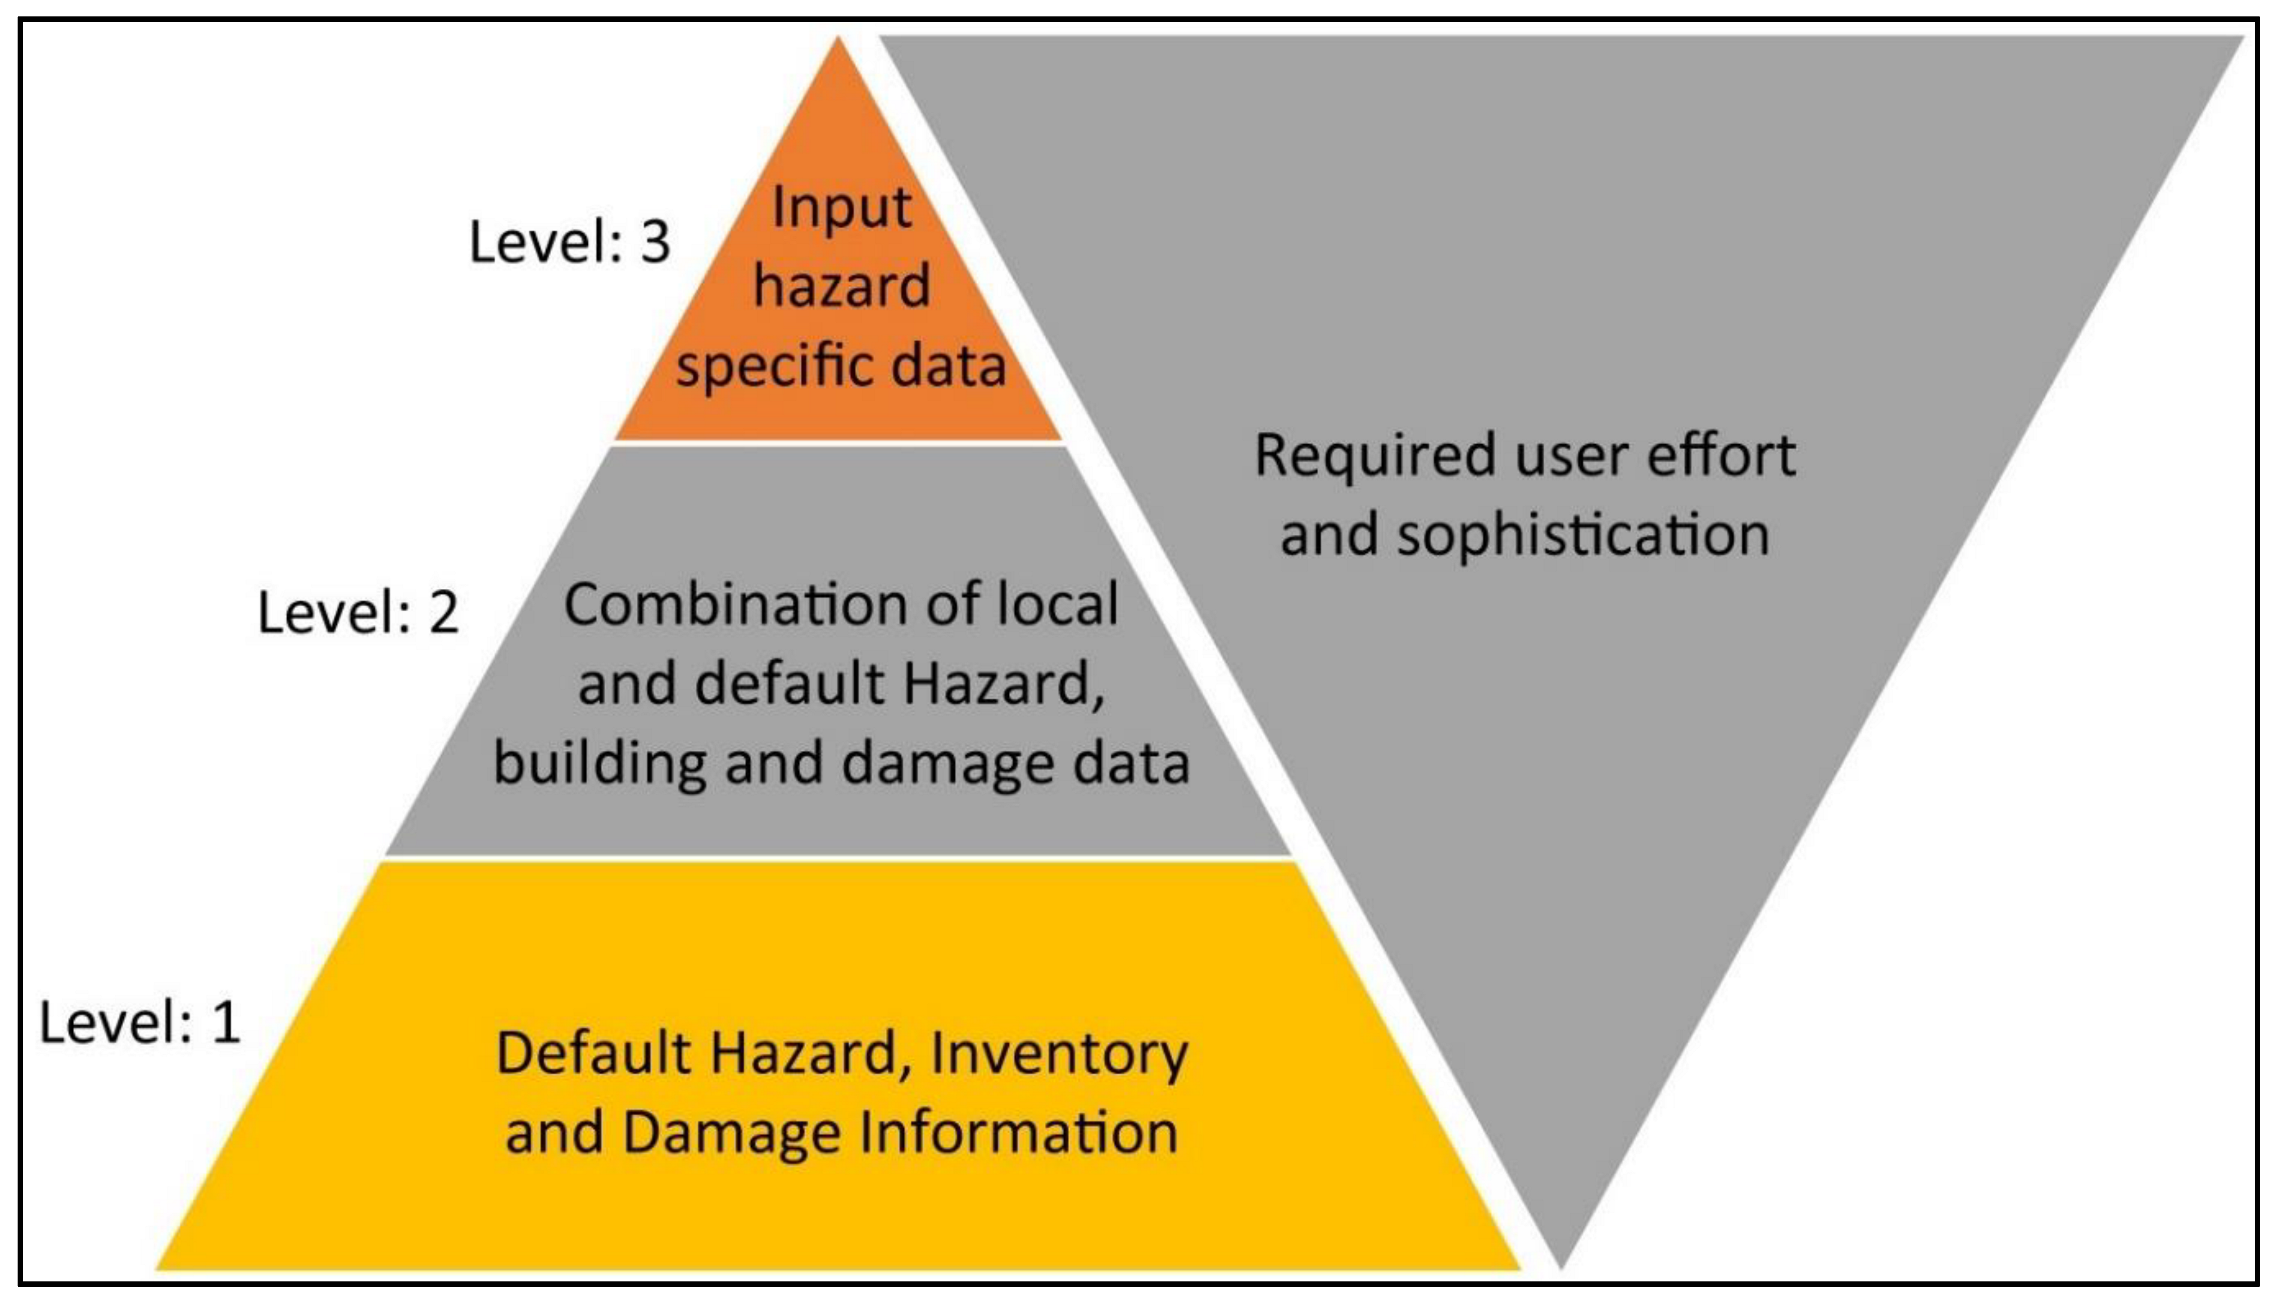
3.1. The HAZUS Model
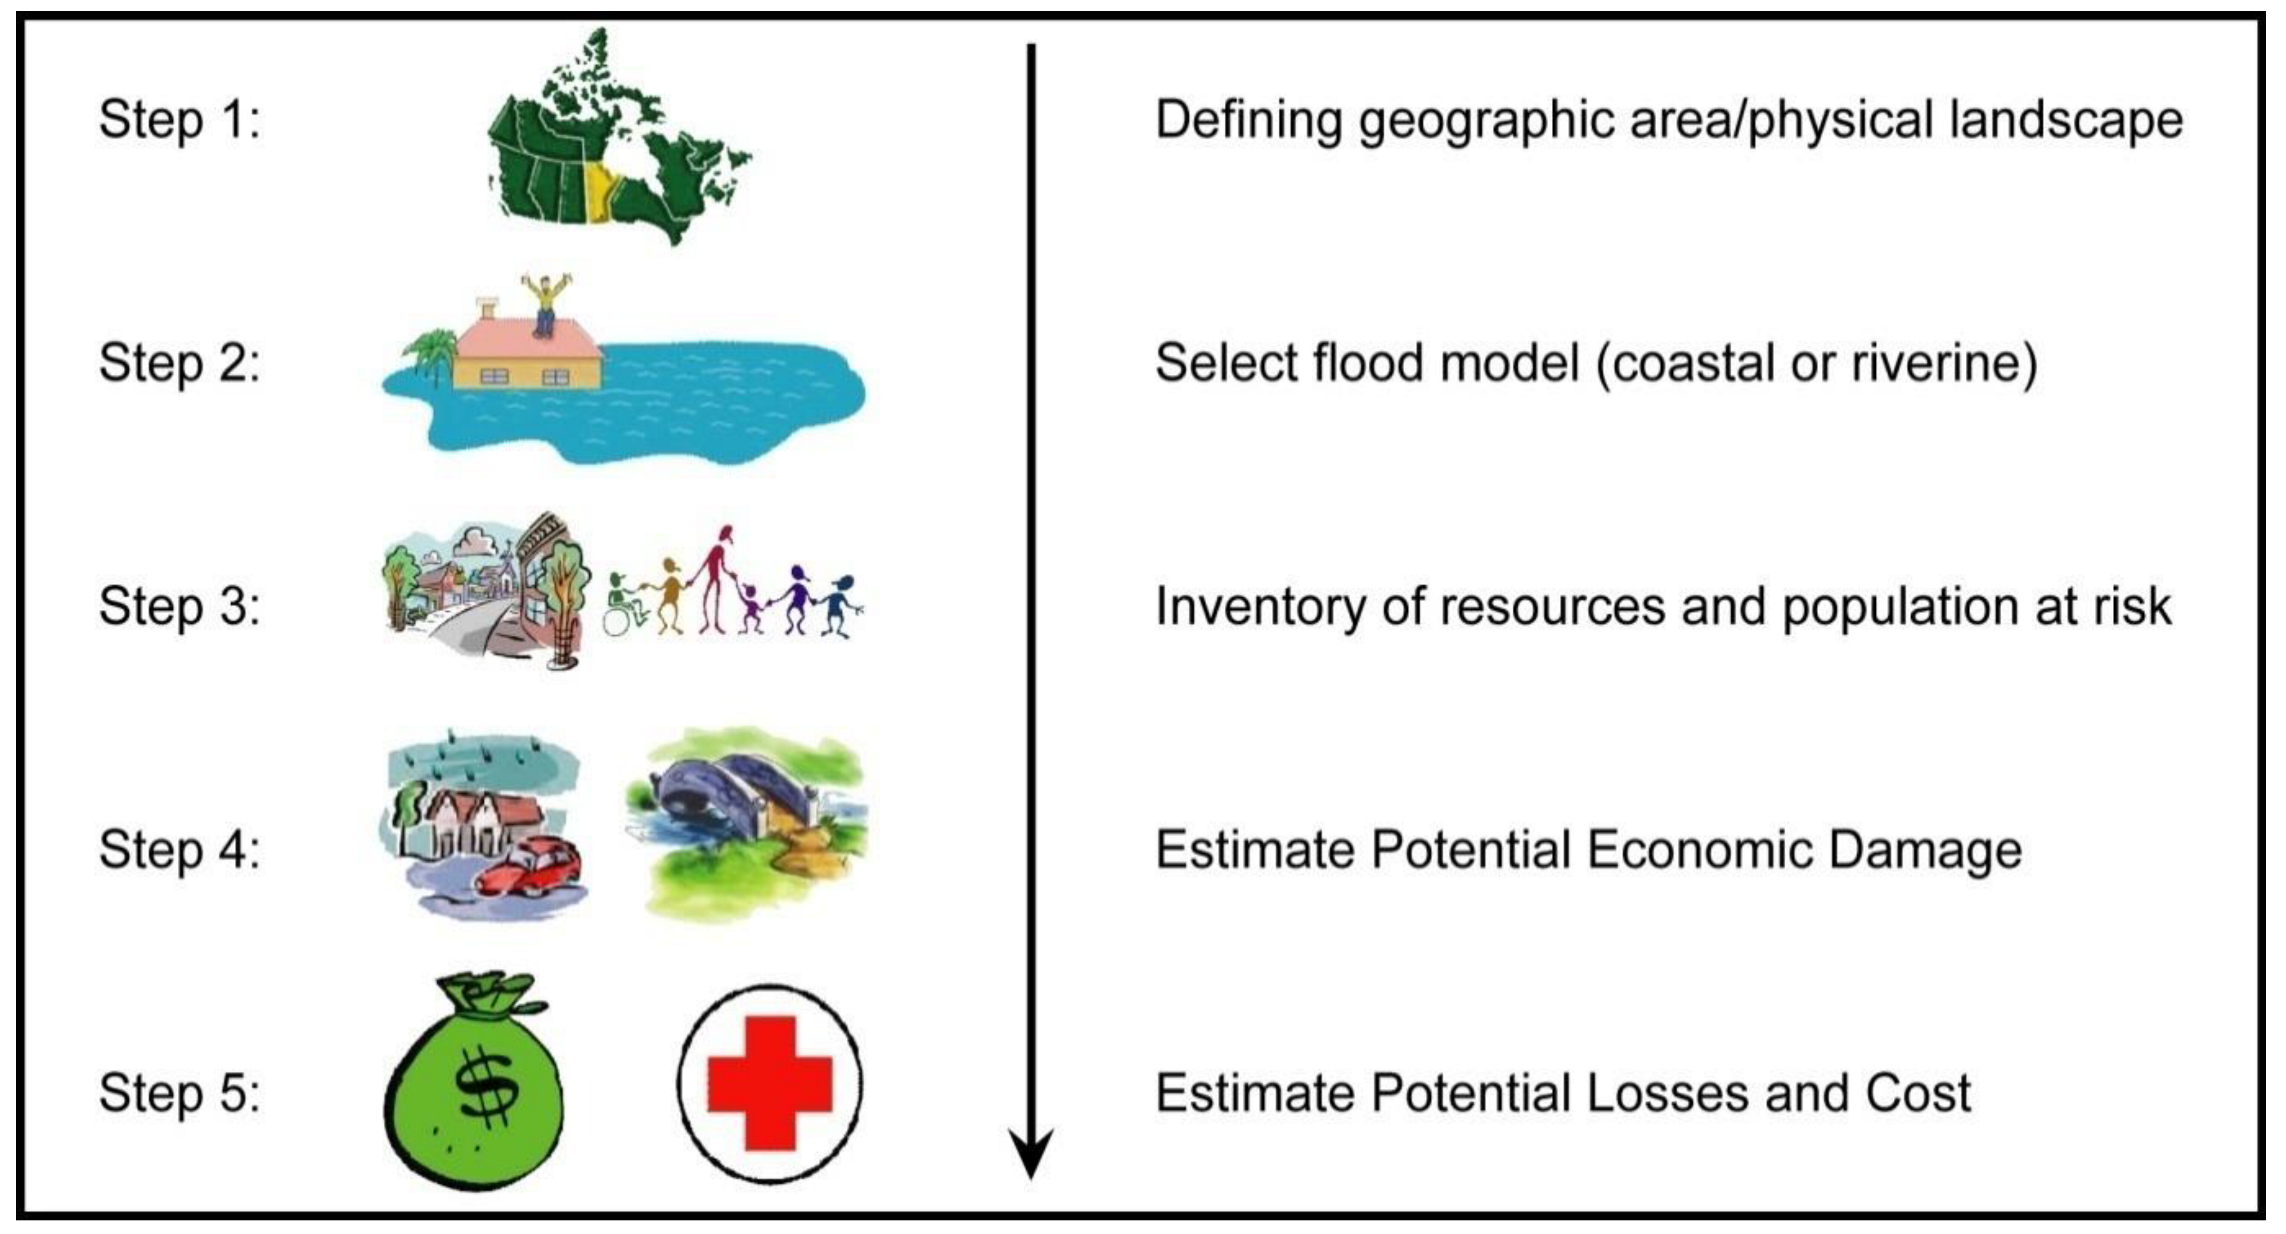
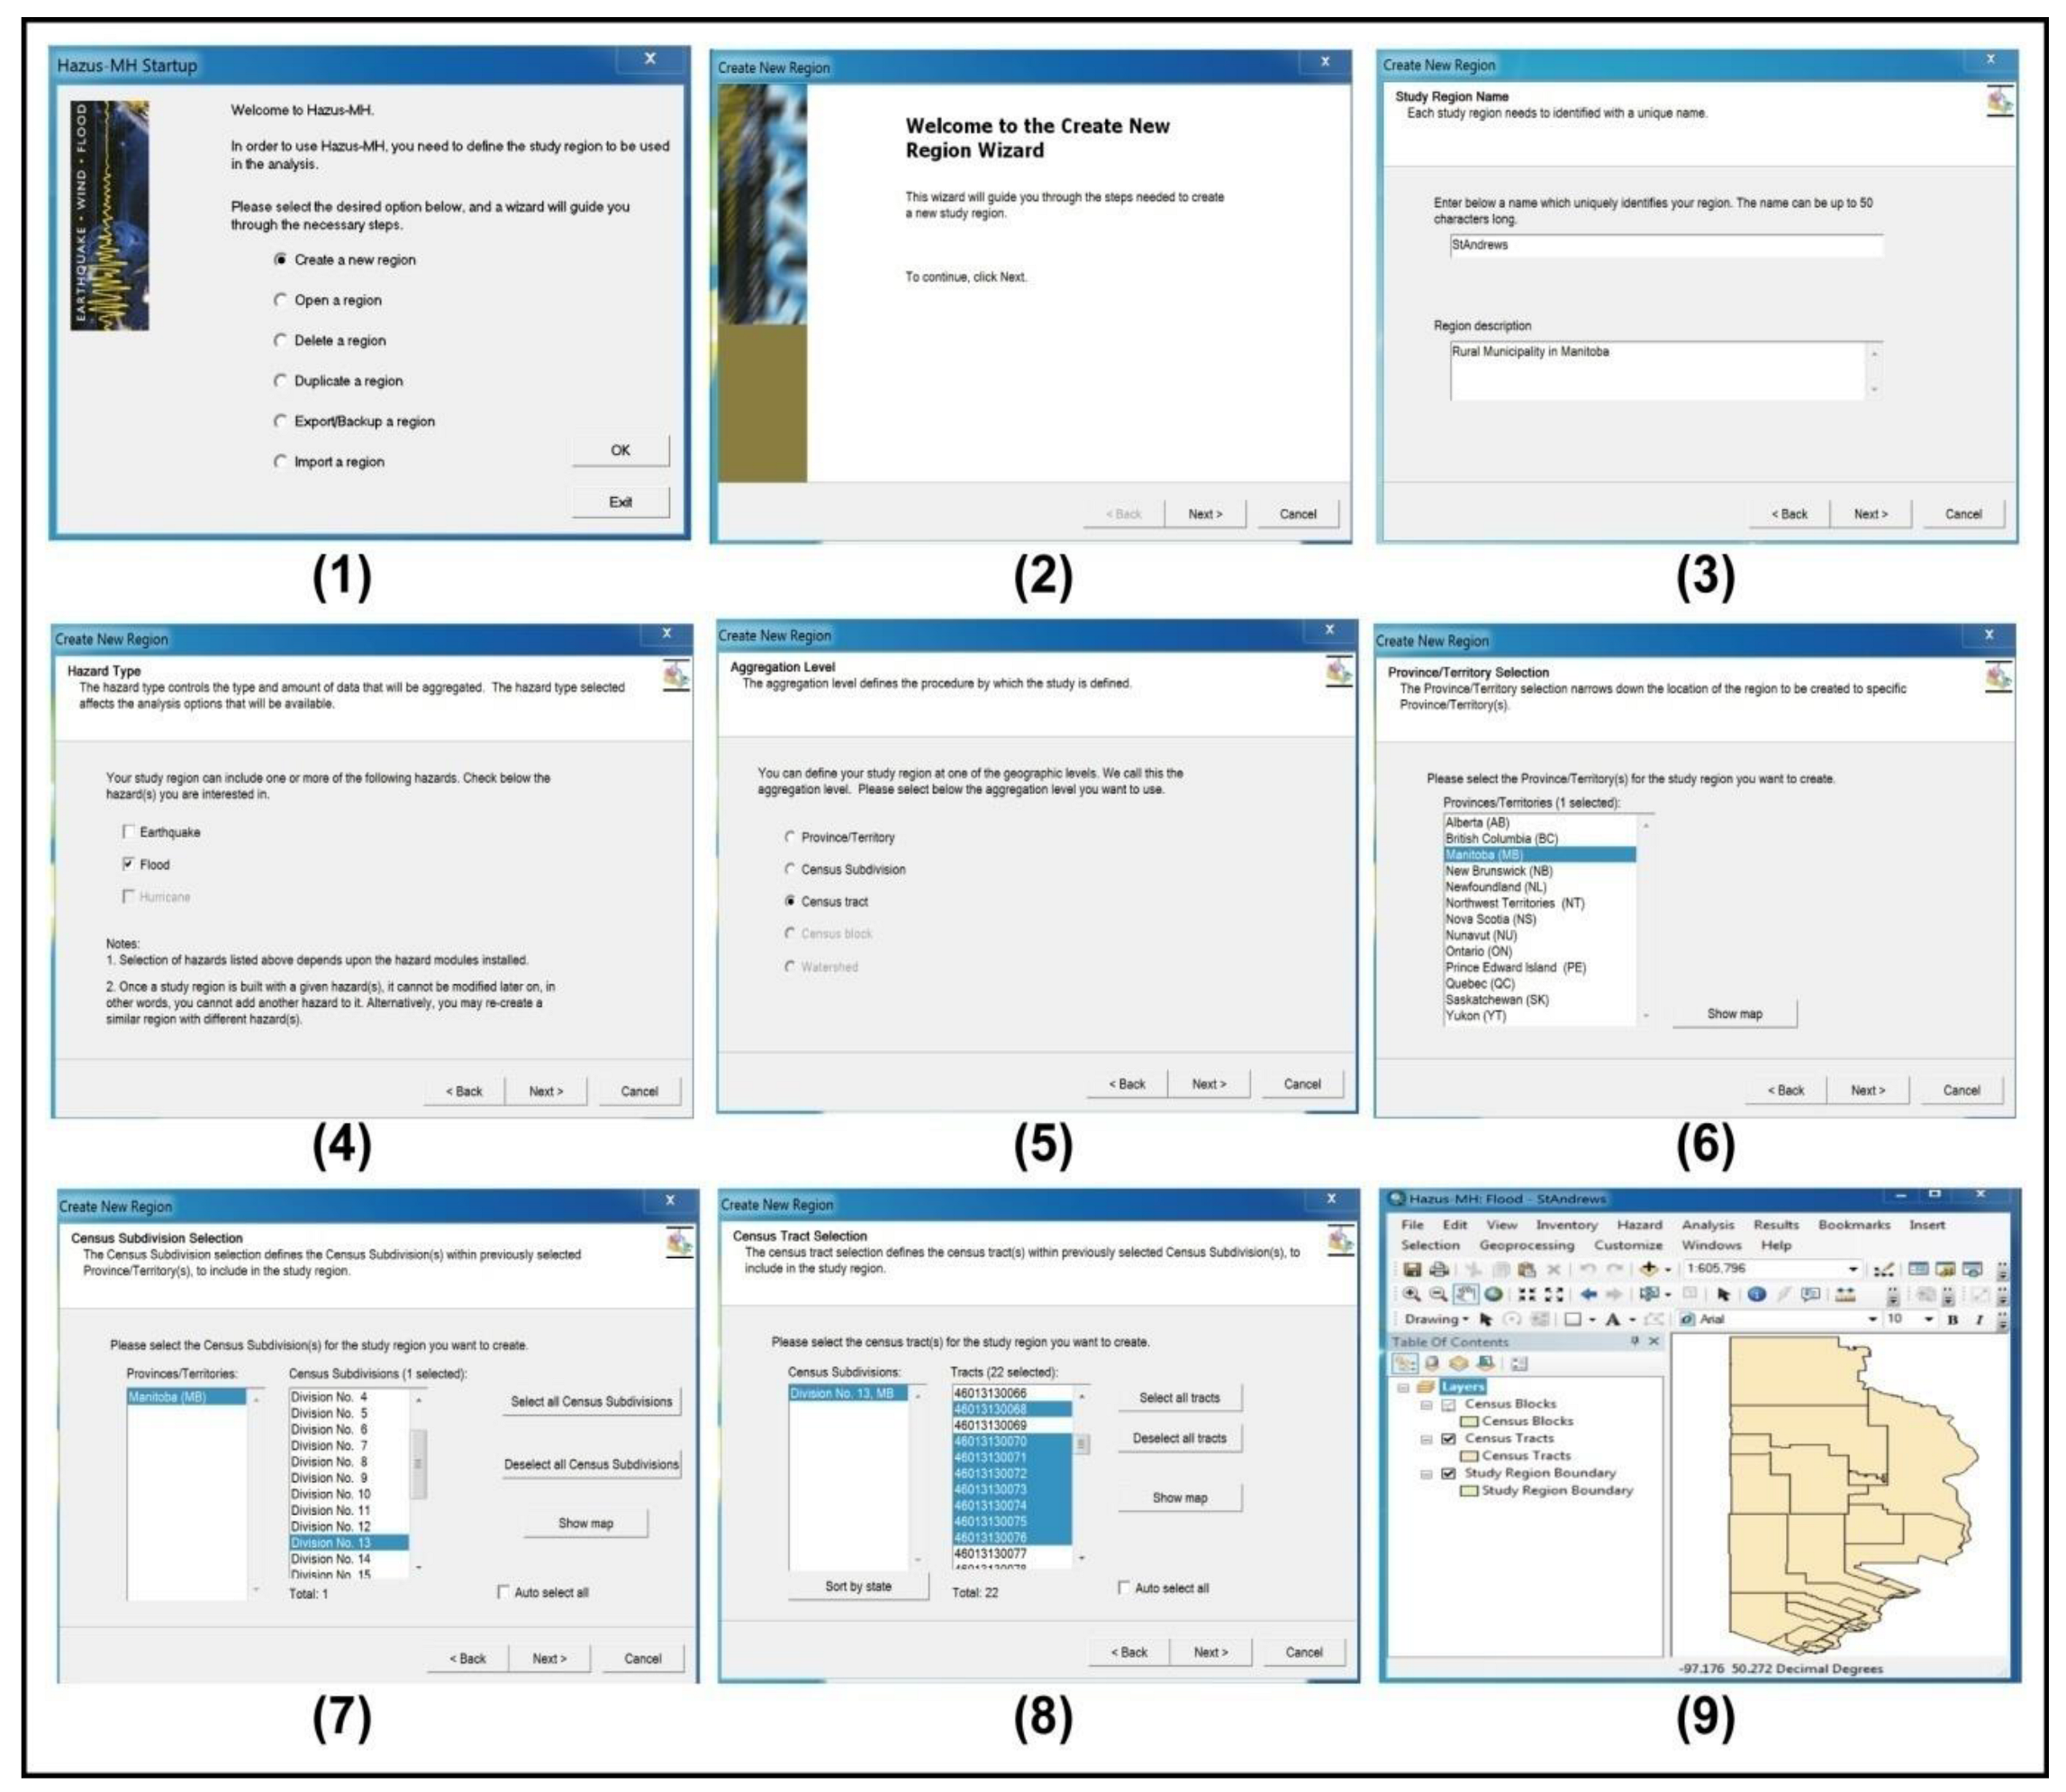
3.2. Application Process of the HAZUS Model
3.2.1. Flood Hazard Analysis
- (i)
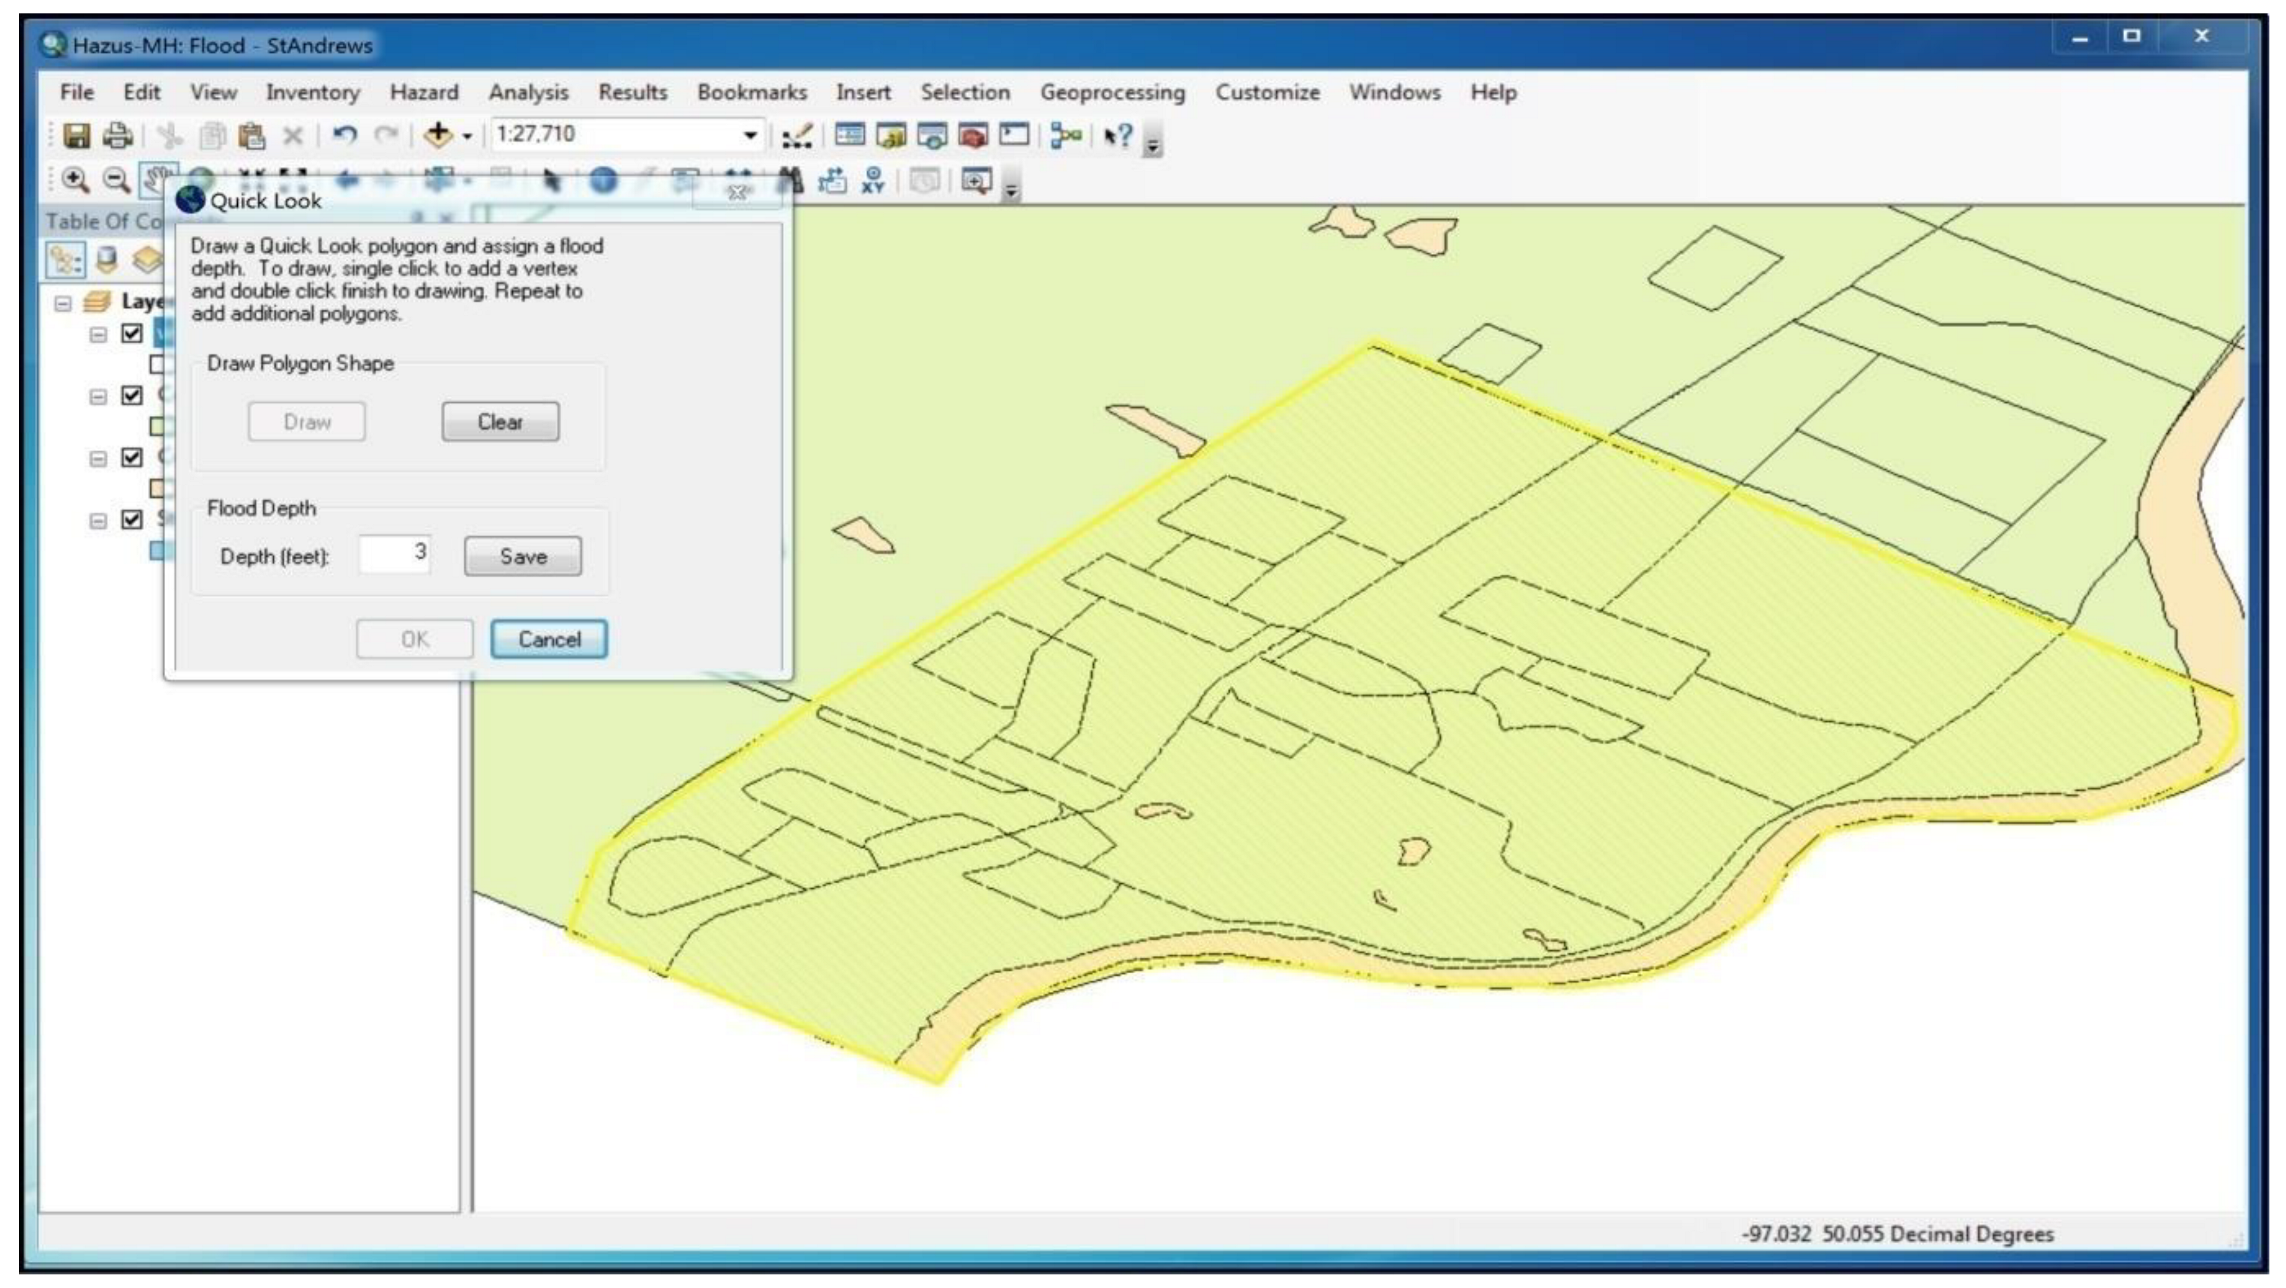
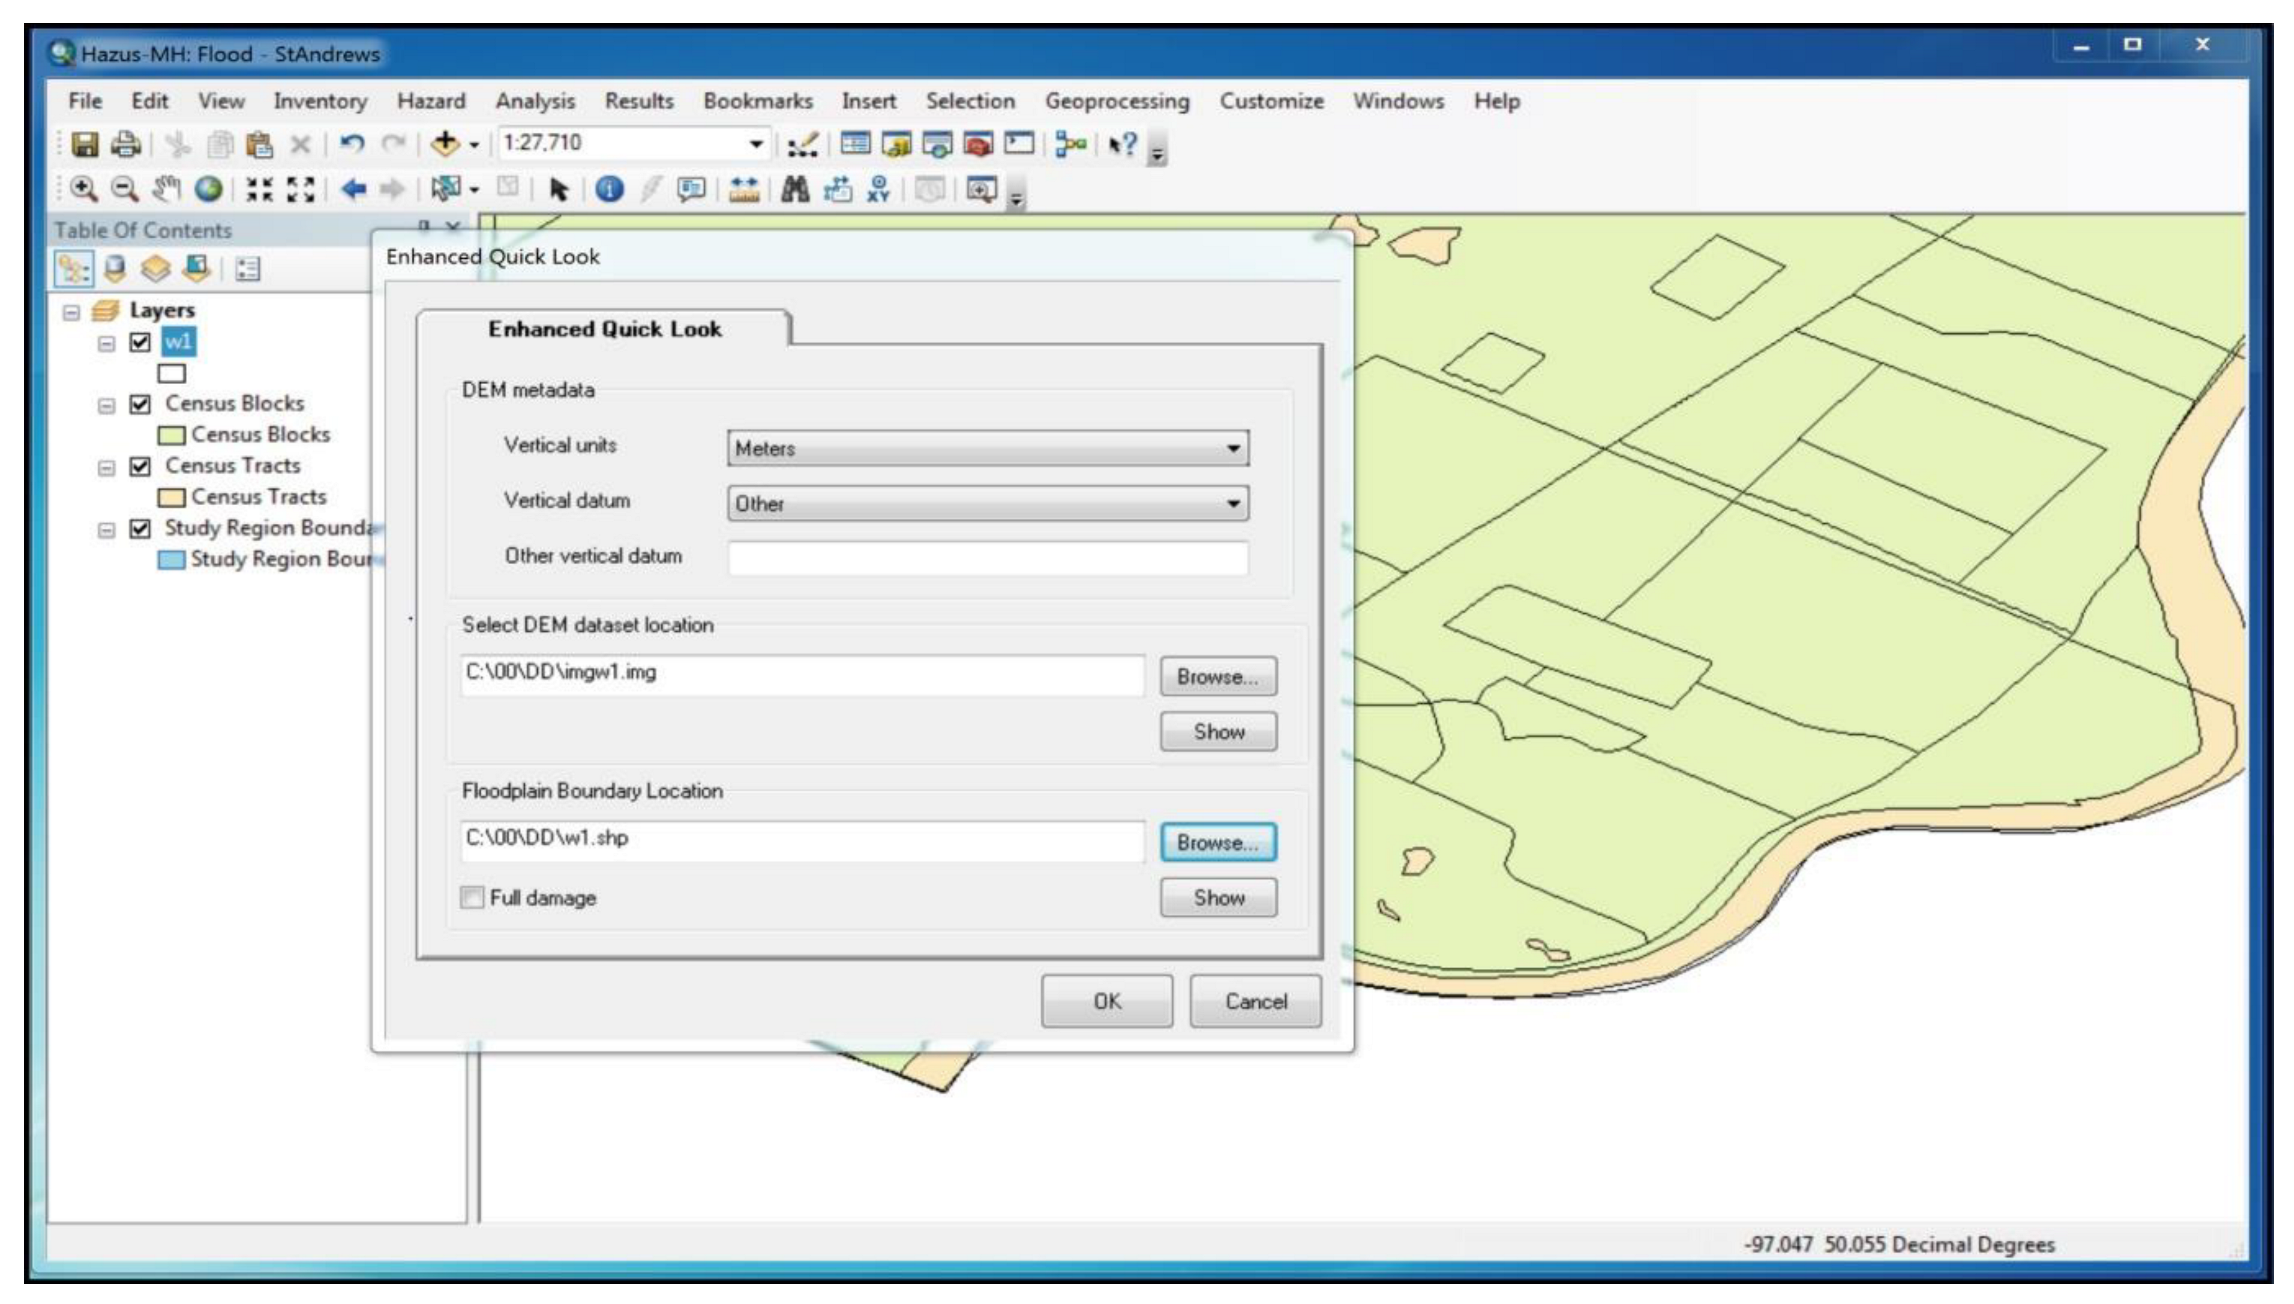
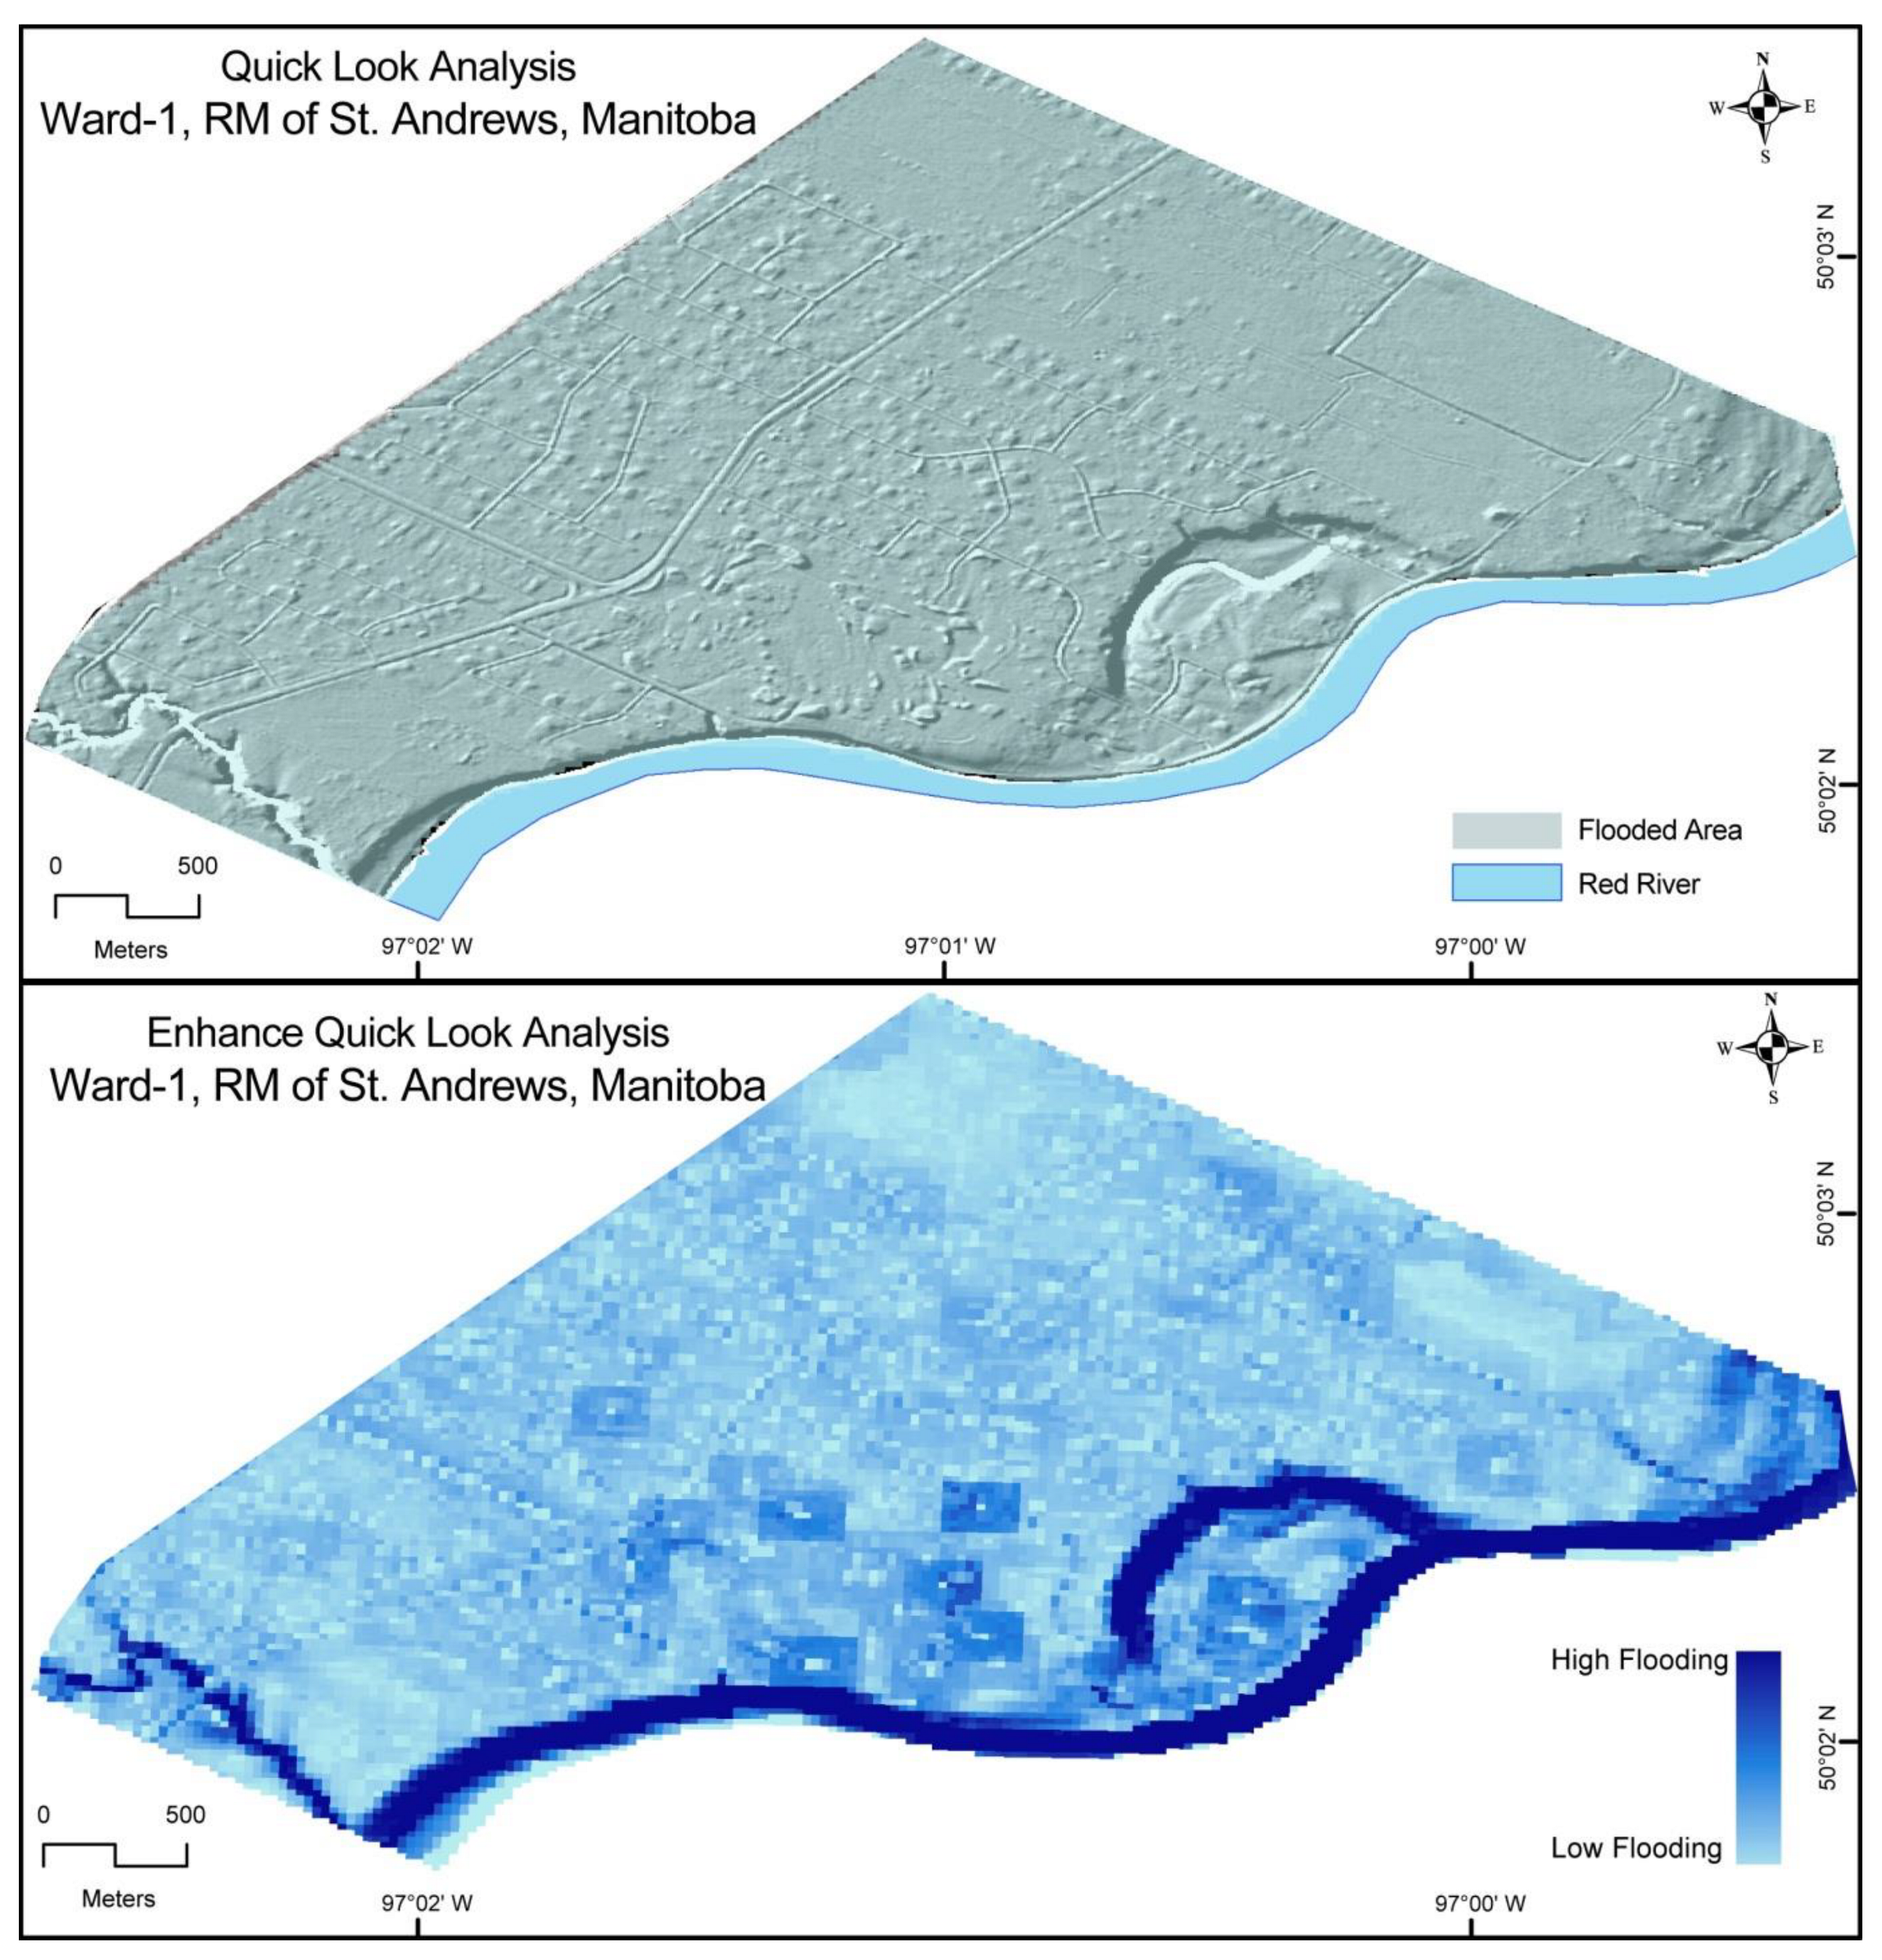
- Quick Look Analysis and Enhanced Quick Look Analysis
- (ii)
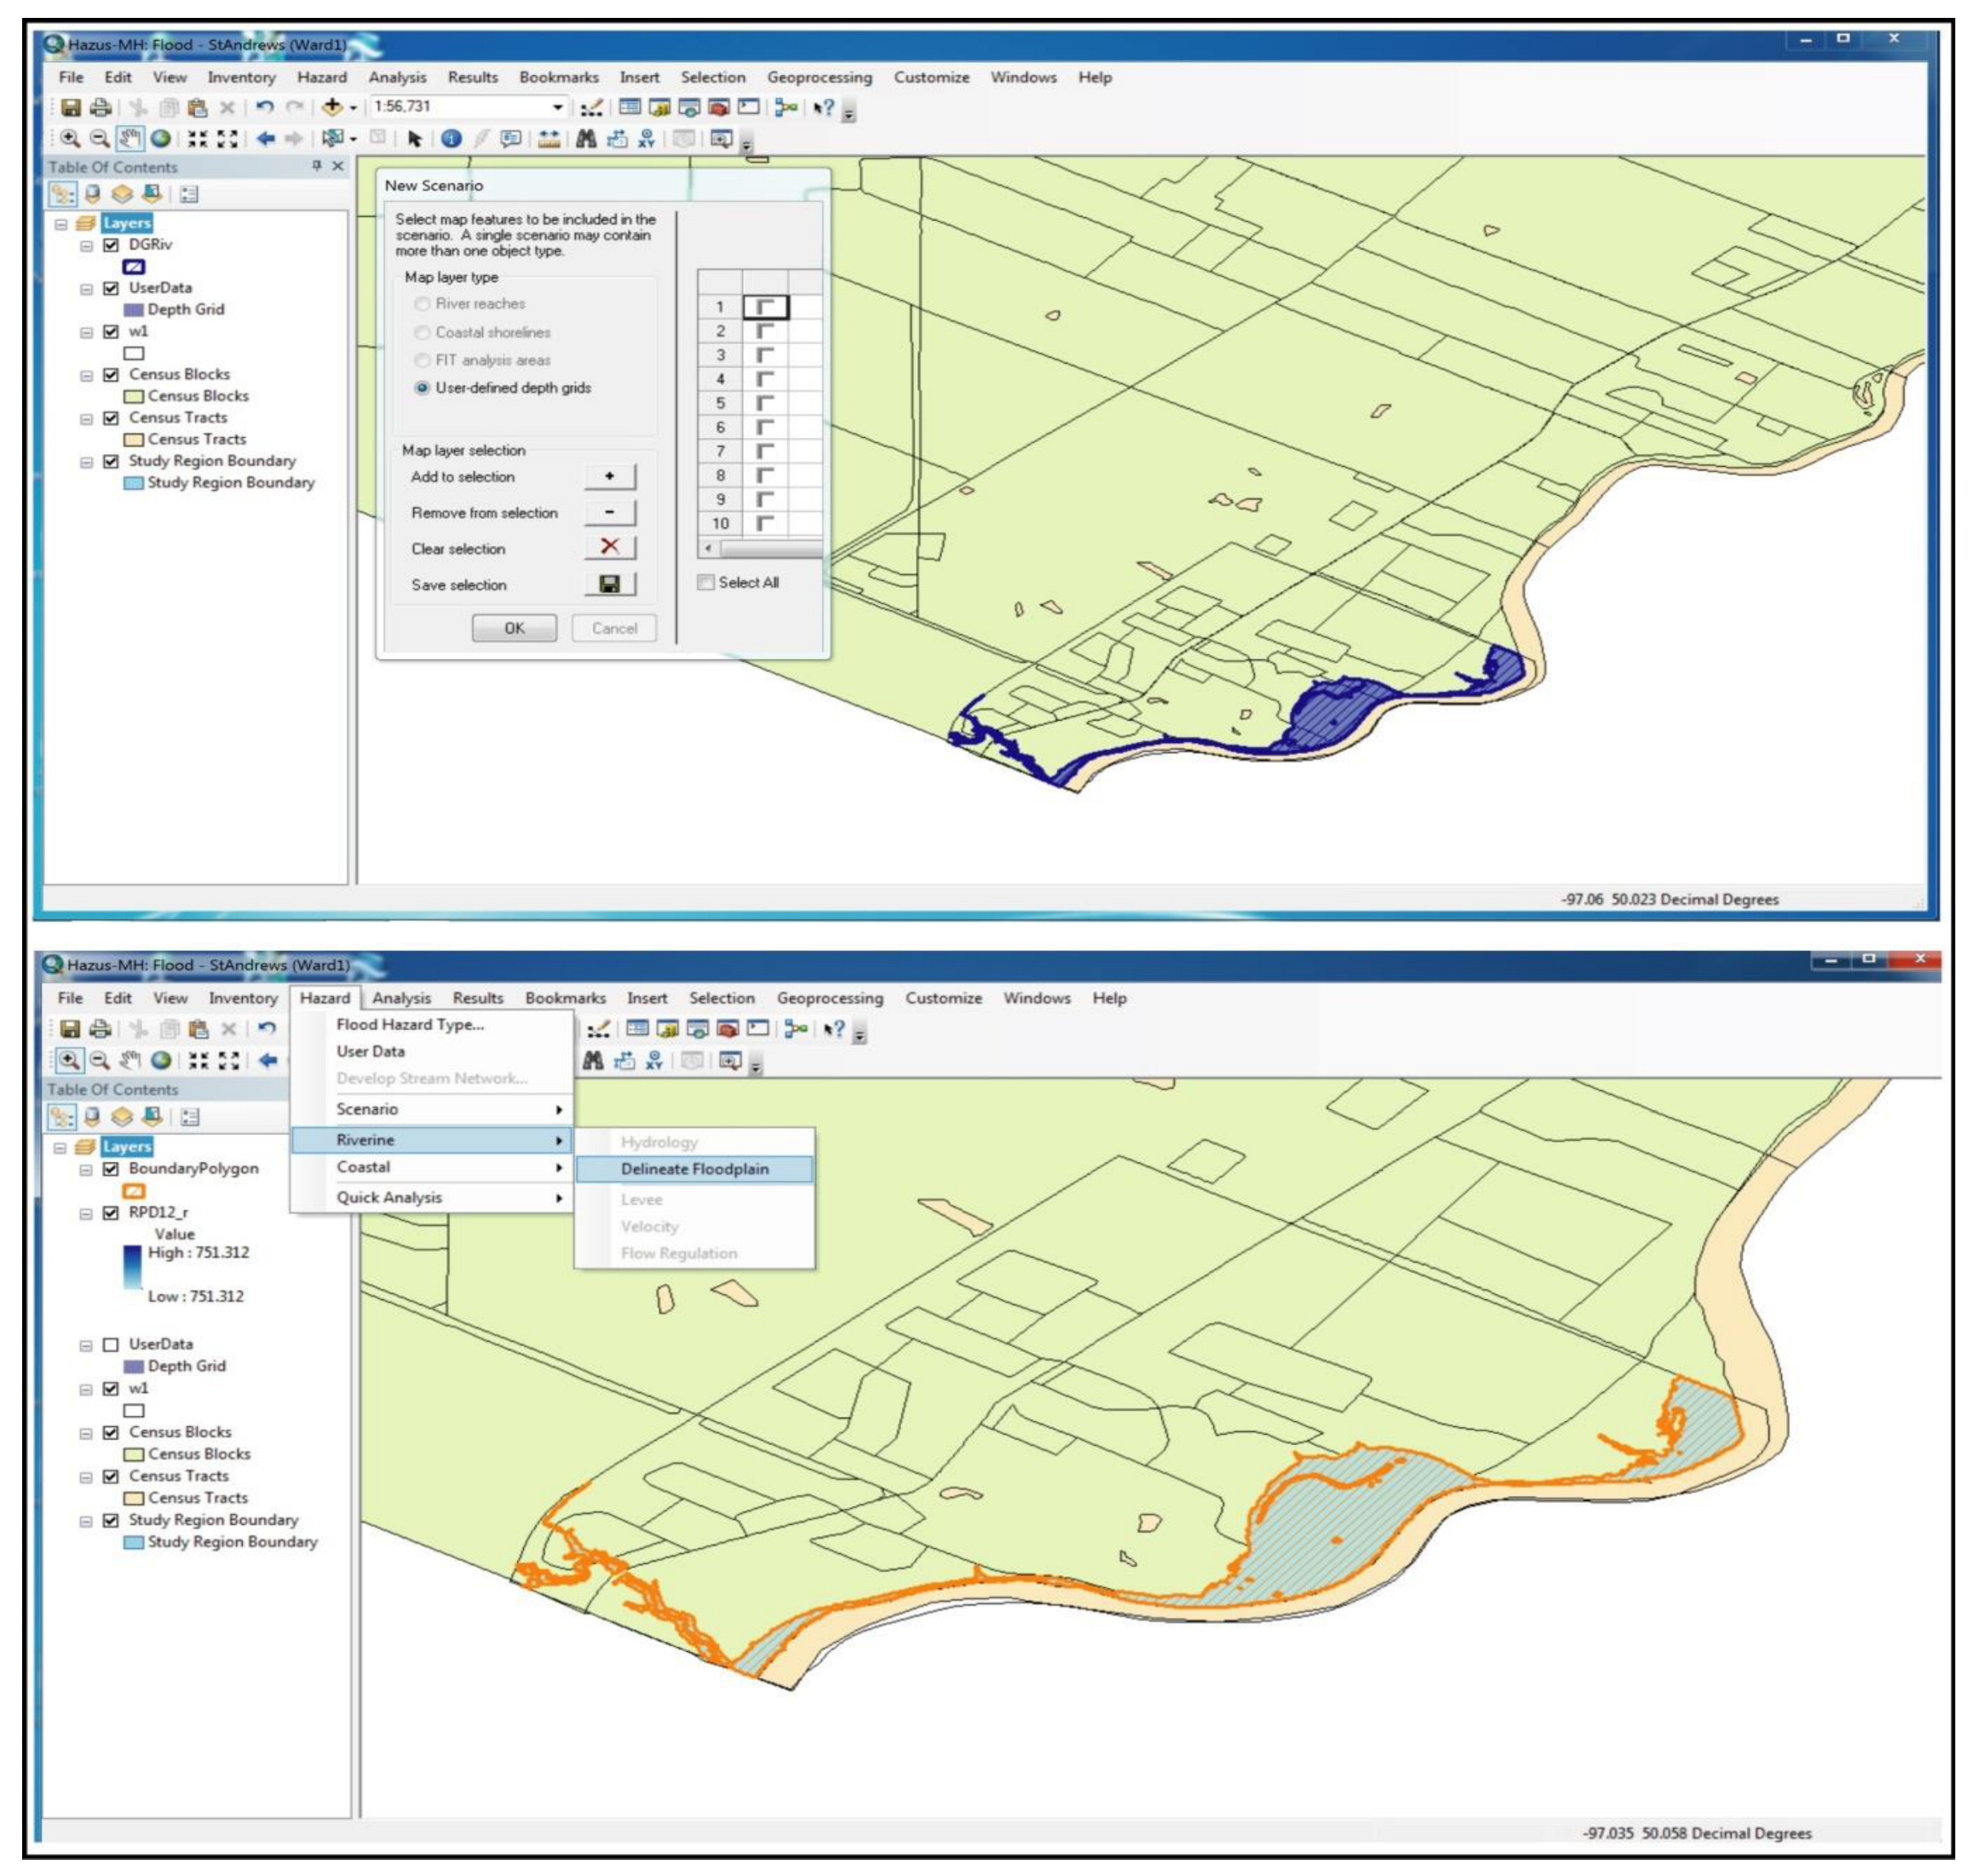
- User-defined depth grid-based analysis
3.2.2. Flood Loss Estimation Analysis
4. Results
4.1. Prospect of Application of the HAZUS Model to Canadian Communities—RM of St. Andrews in Manitoba
4.1.1. Quick Look Analysis and Enhanced Quick Look-Based Analysis
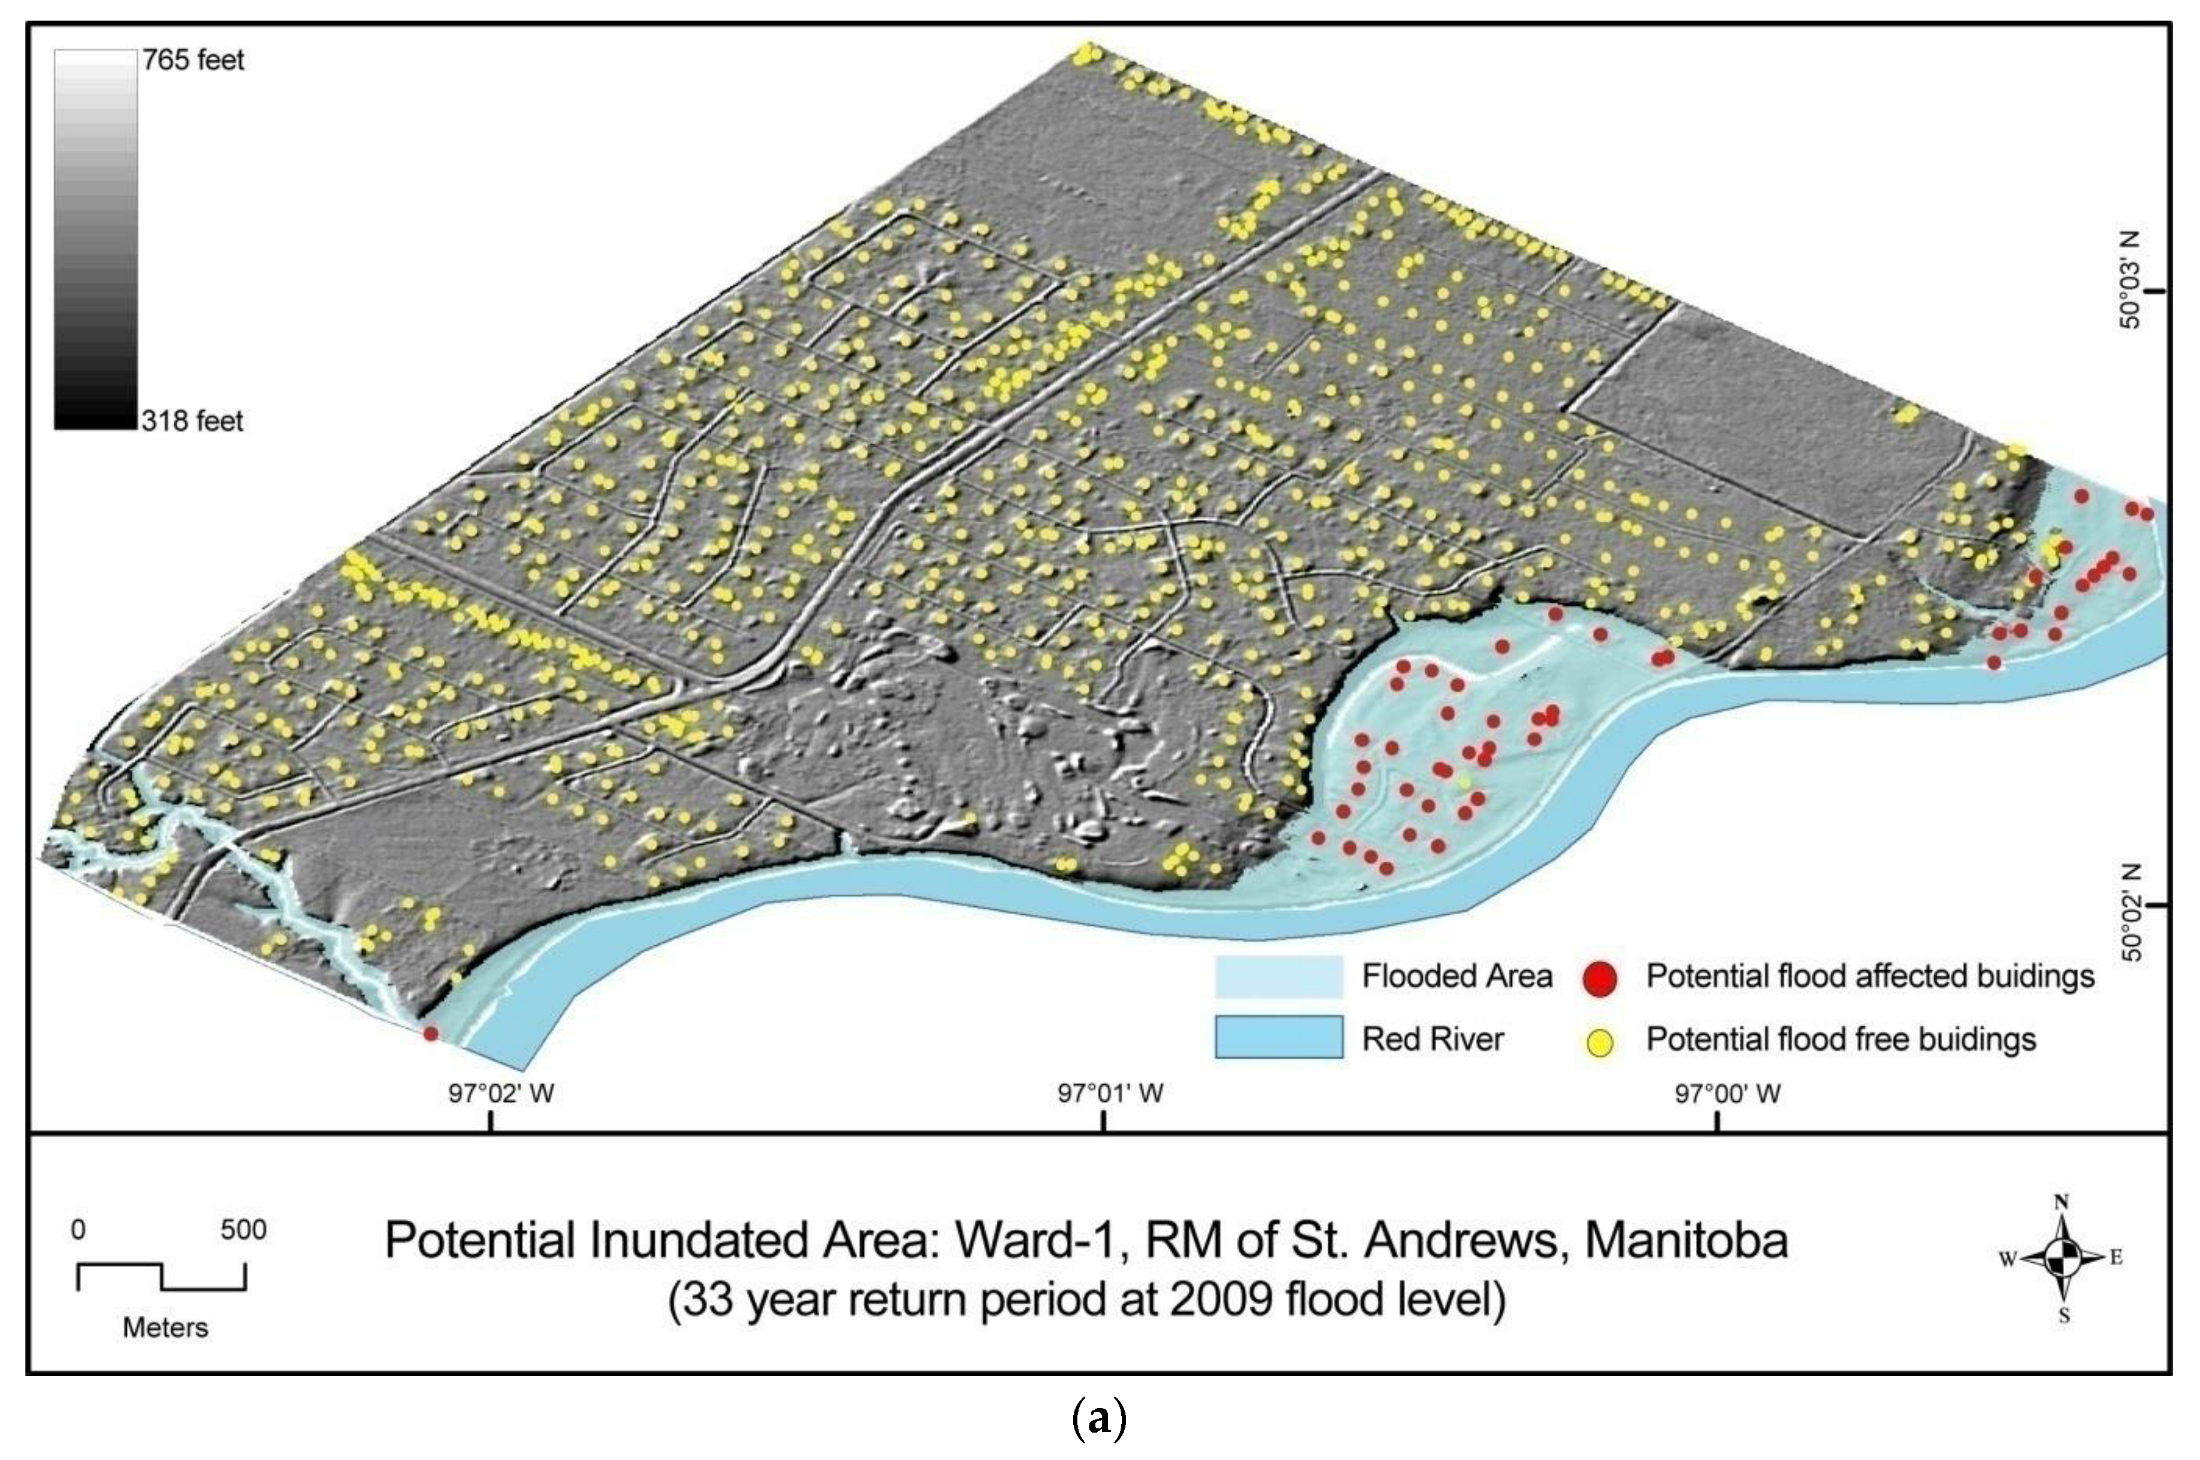
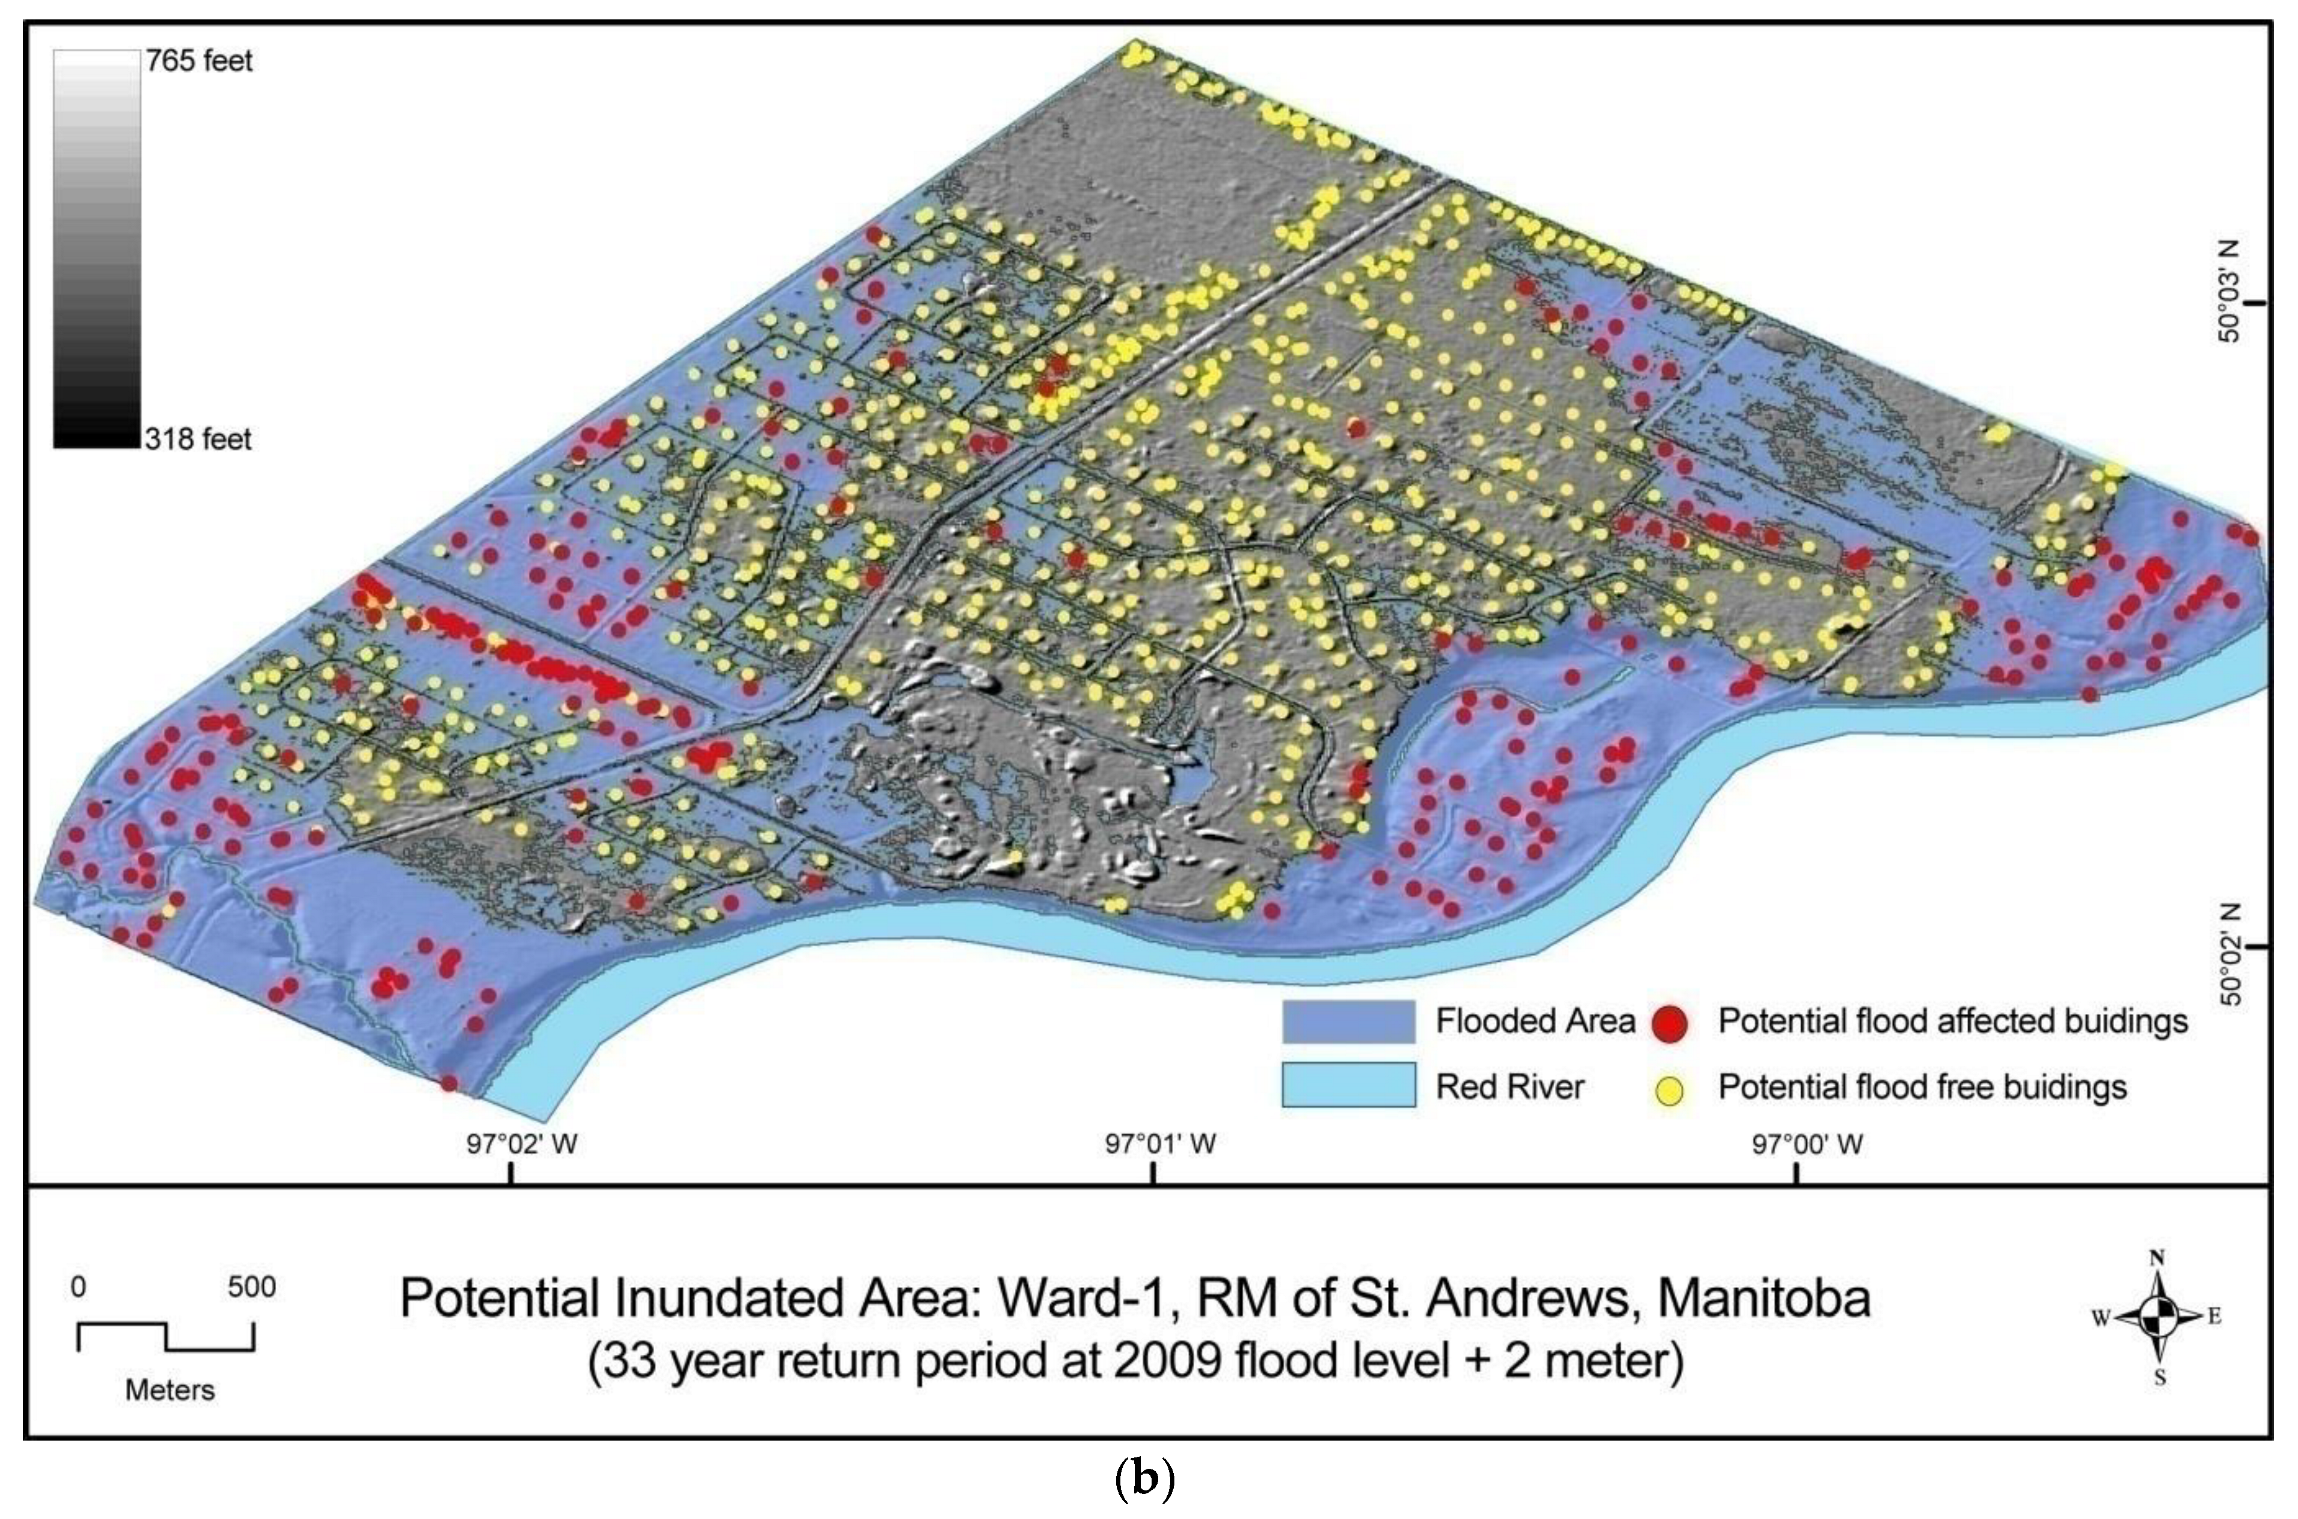
4.1.2. User-Defined Data-Based Analysis
- (a)
- Defining the physical landscape
- (b)
- Inventorying of population and resources at risk
- (c)
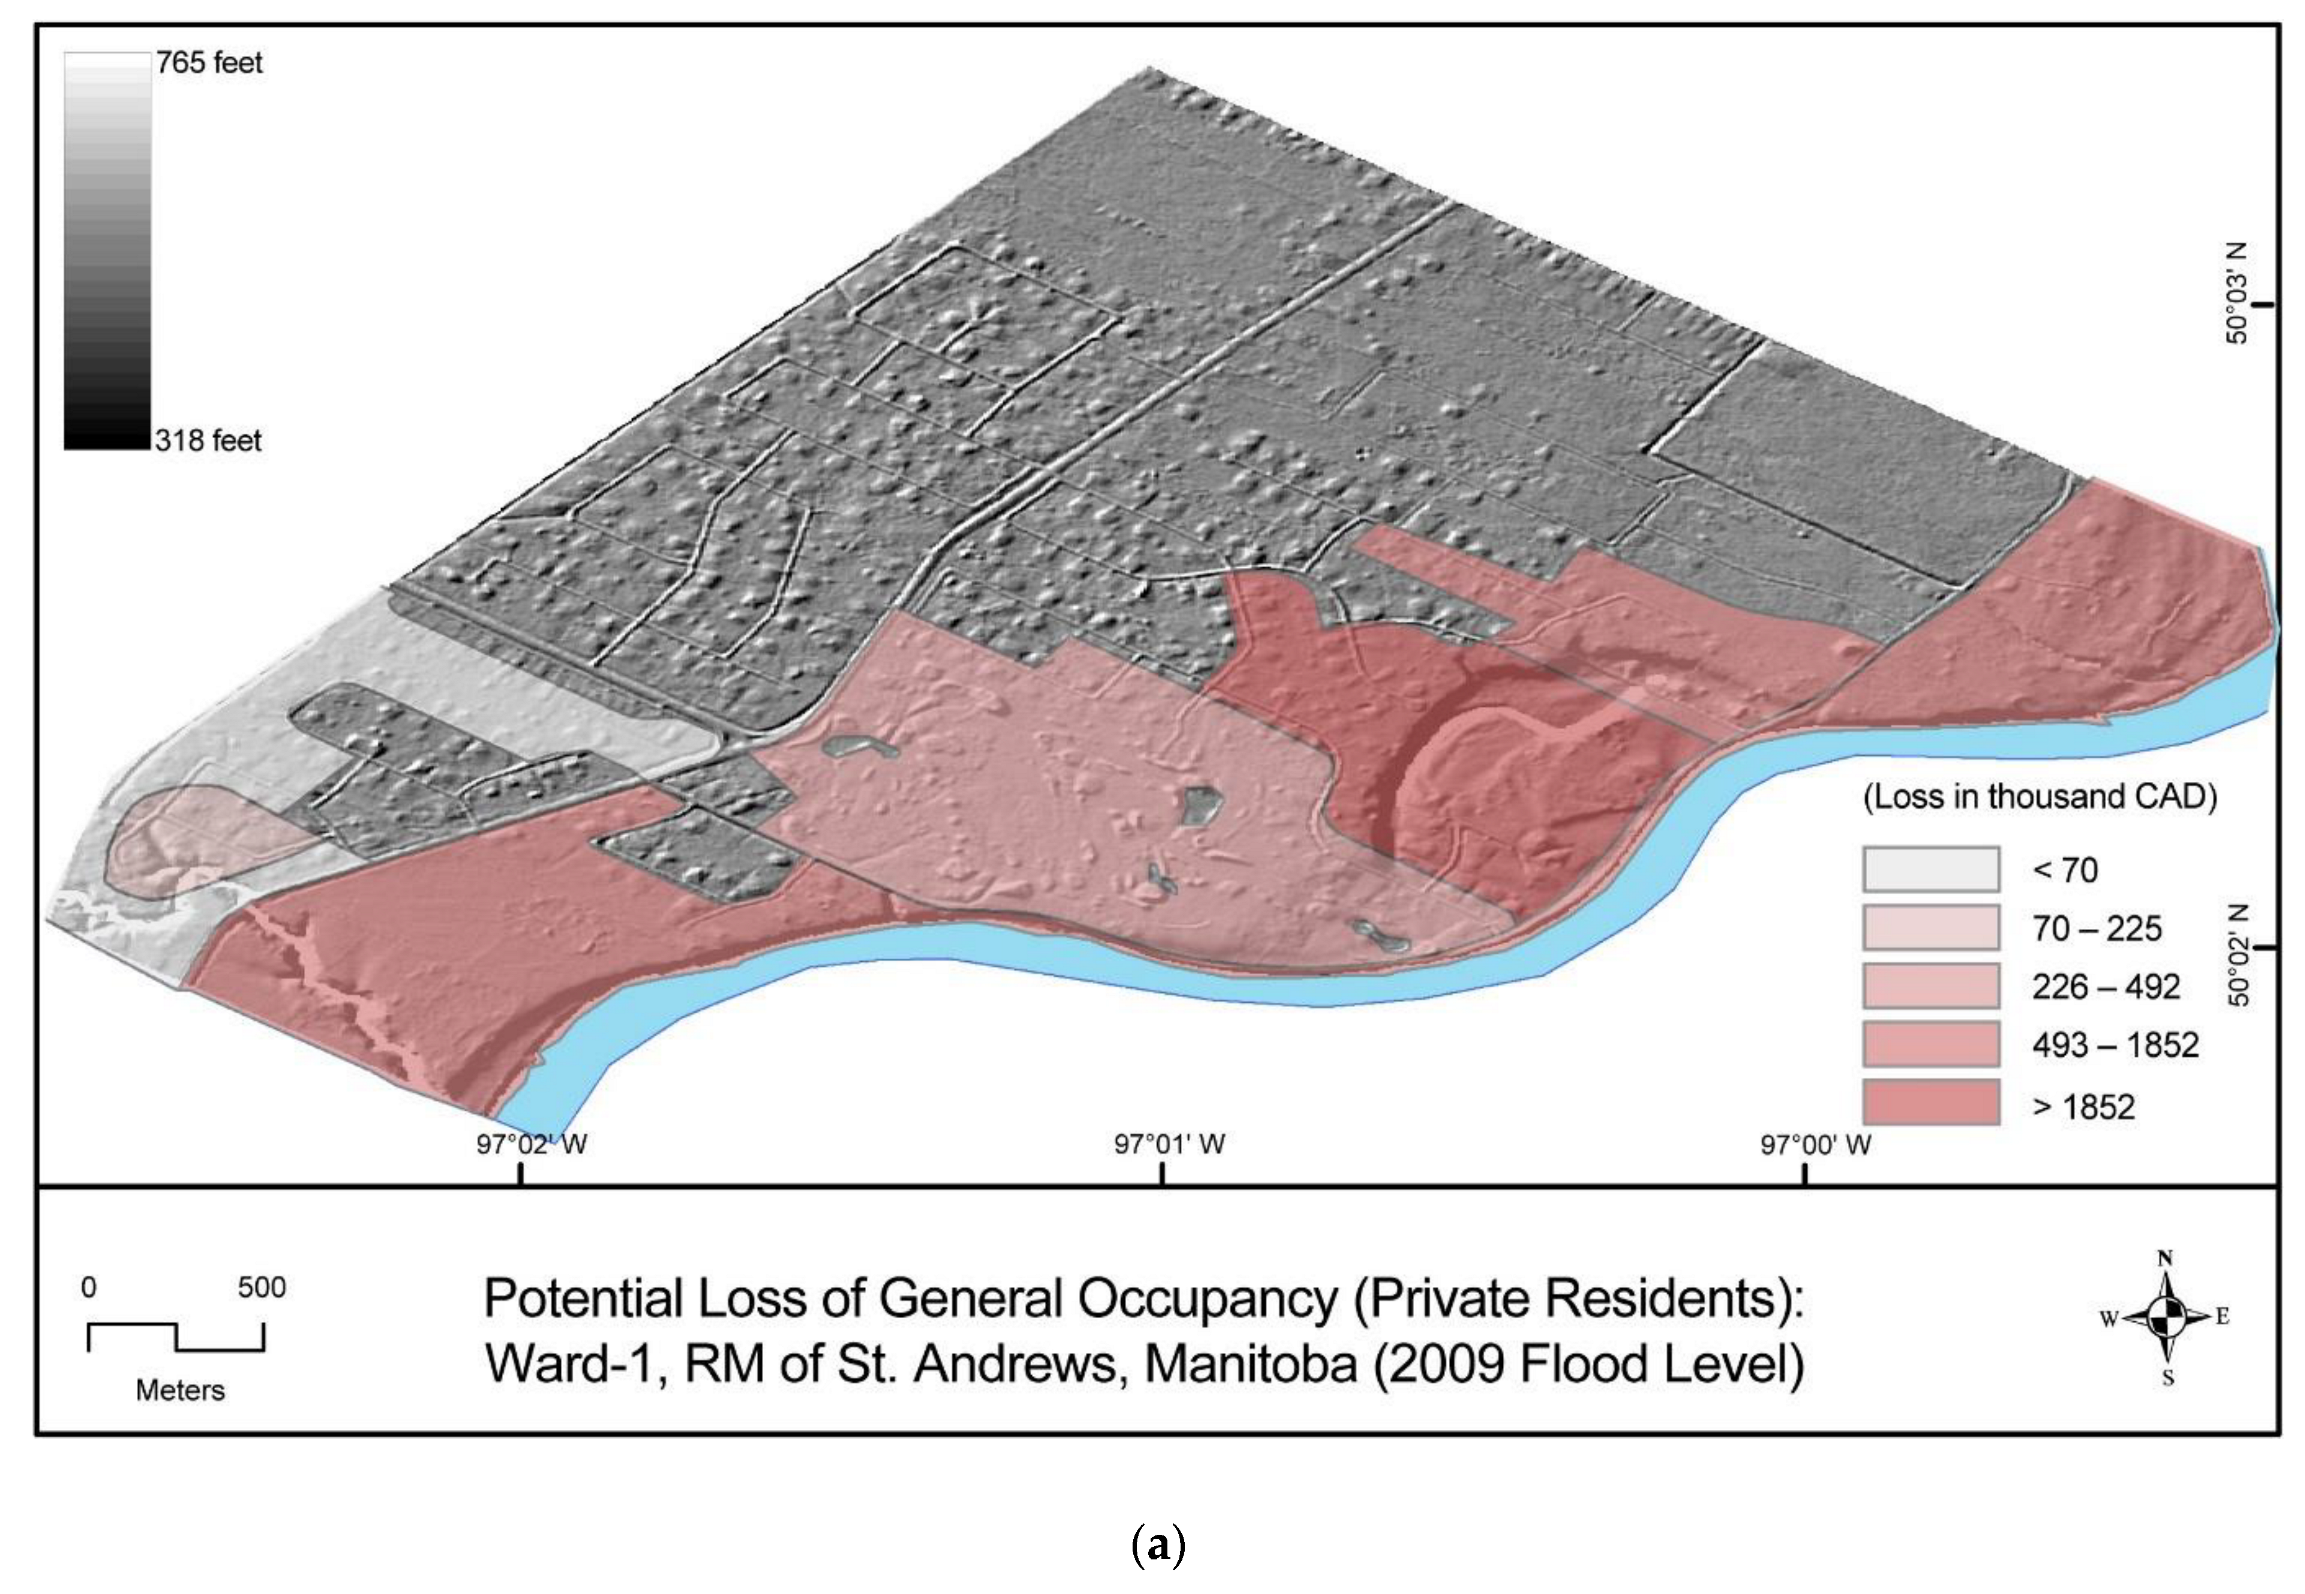
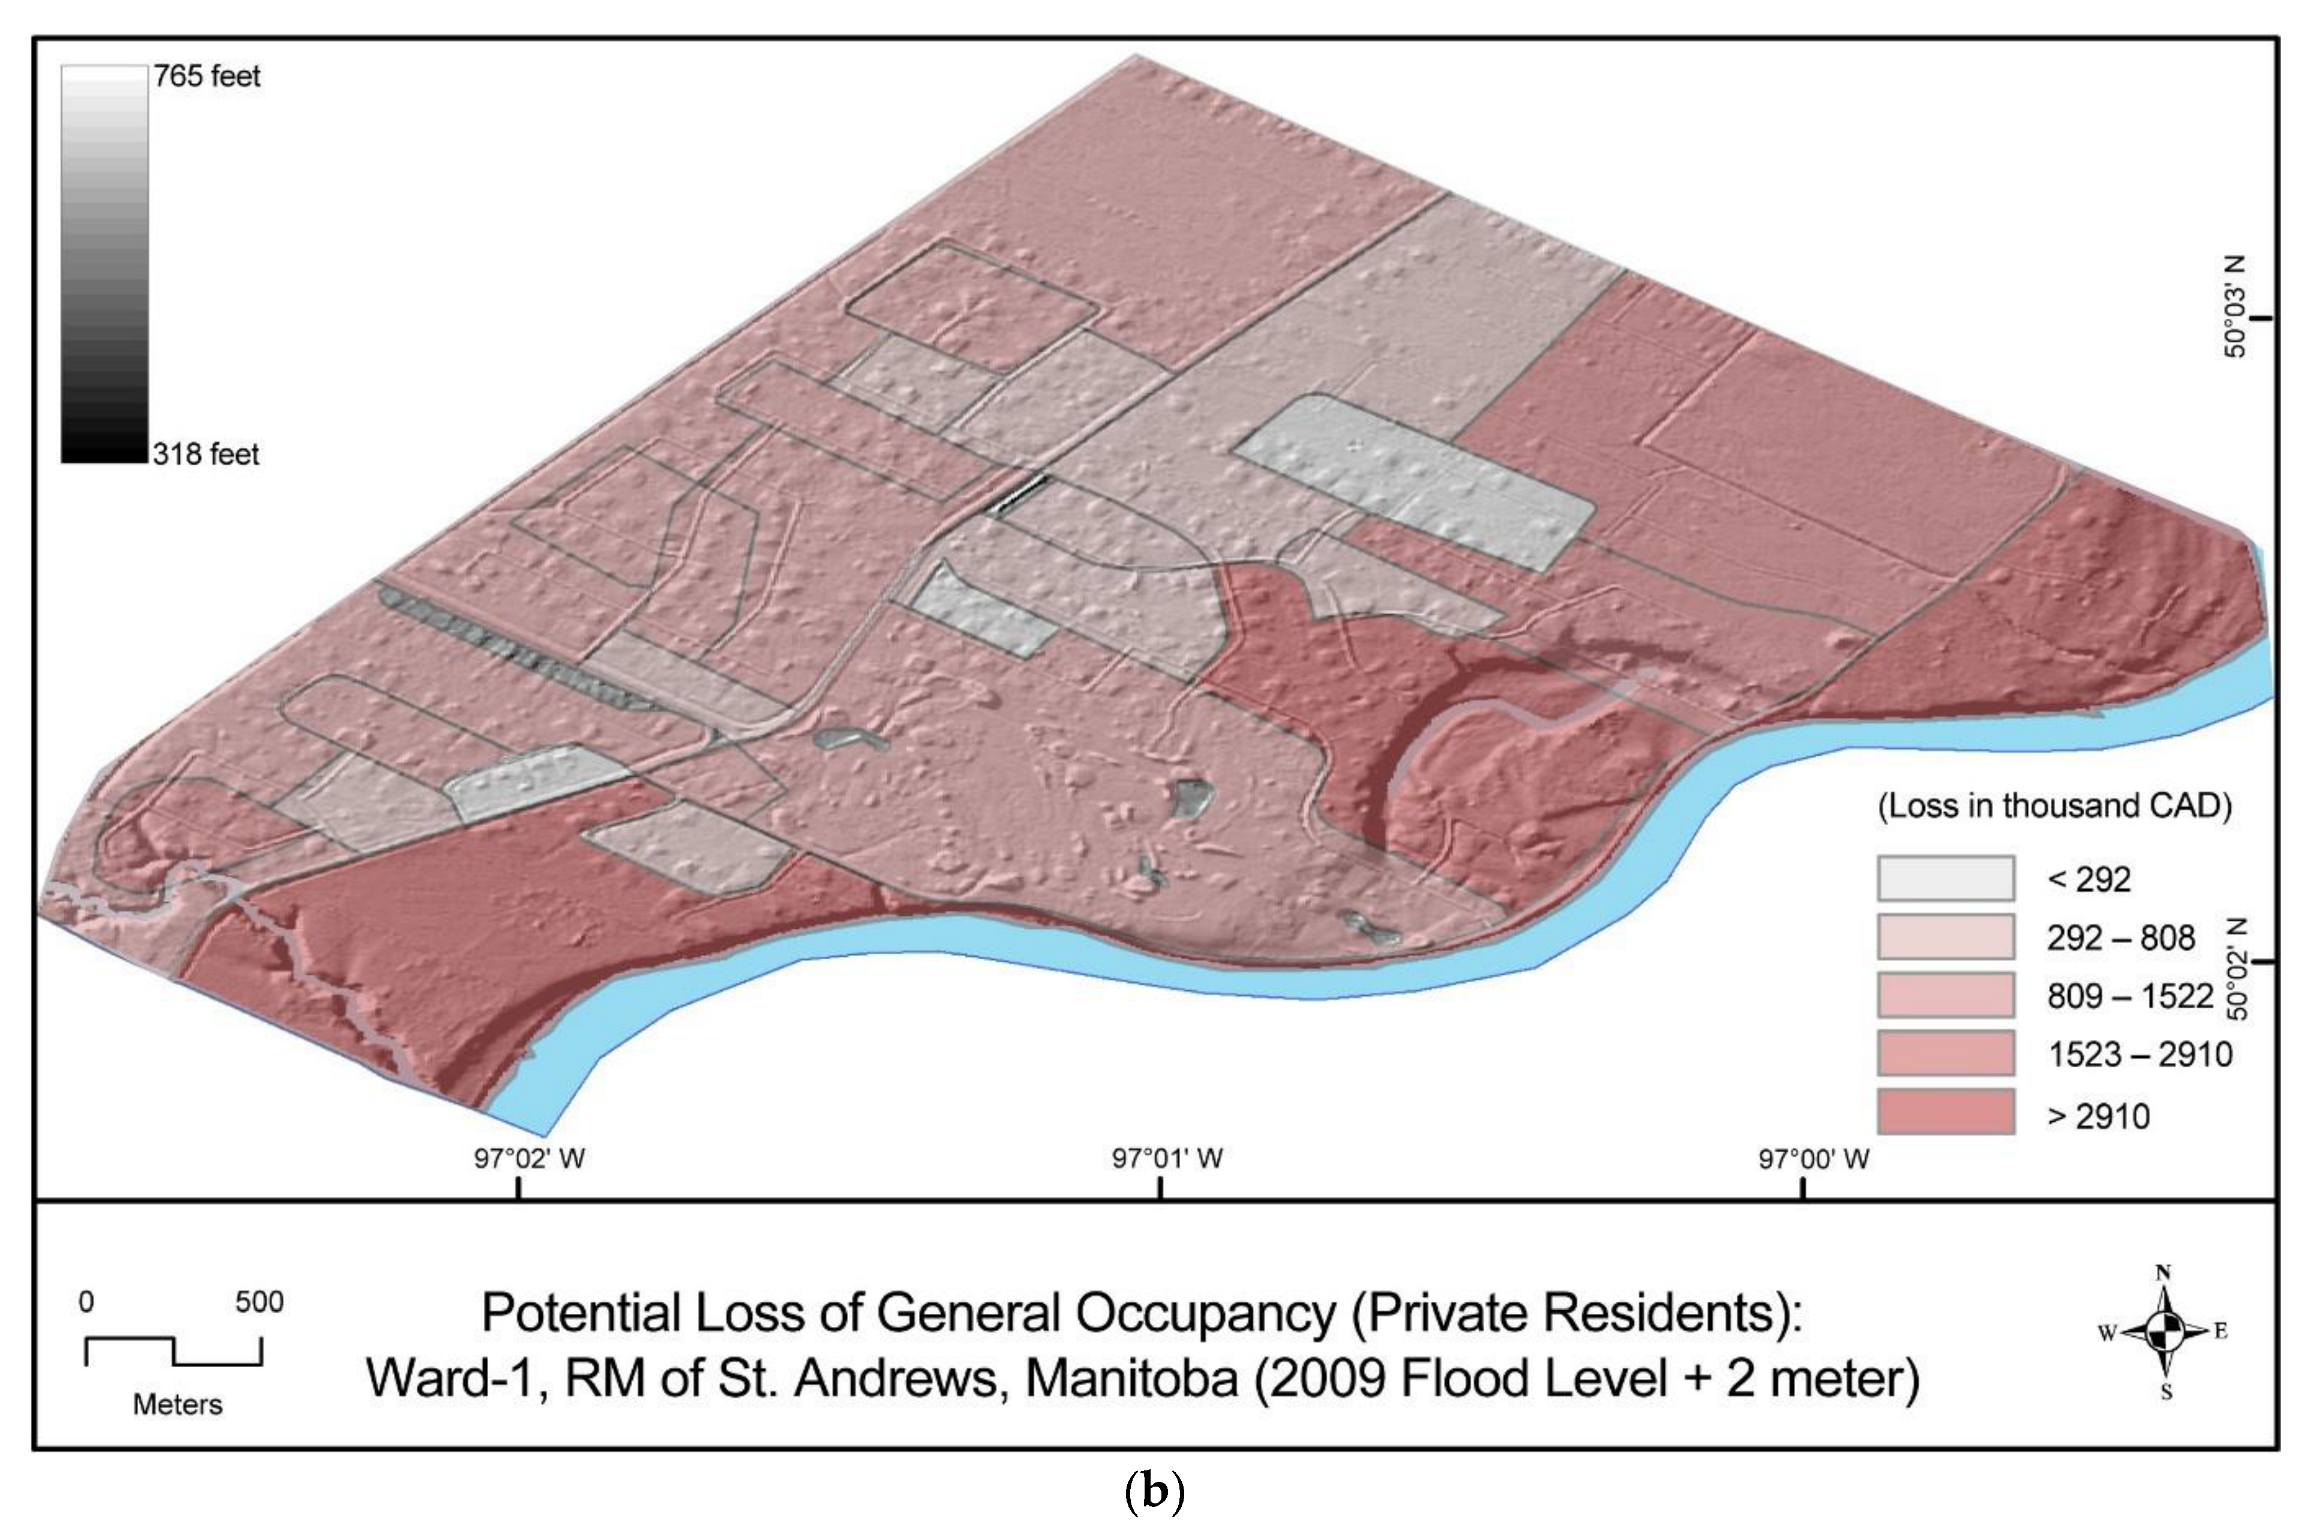
- Estimating potential damage
- (d)
- Estimating potential loss and cost
5. Discussion
- First floor height and foundation type: Theoretically the HAZUS framework supports different foundation types as a parameter in flood assessment. The model as developed in the USA only takes the basement foundation type into account. For all other foundation types there is no difference on flood loss assessment. Hence the first-floor elevation is crucial for running the HAZUS model. Although the RM of St. Andrews has a database with some first-floor elevation height, the data are not standardized and there are also a significant number of missing data. This is likely very true of most Canadian RMs.
- Disadvantage of aggregated data in flood assessment: The building stocks and demographic data are aggregated using census data and included in HAZUS. The problem of aggregated data in flood assessment is that the location of aggregated objects is unknown and in Canada, for many rural areas, census polygons are very large. An inventory of building stock with the exact locations of those structures is necessary for accurate predictions in rural areas in Canada.
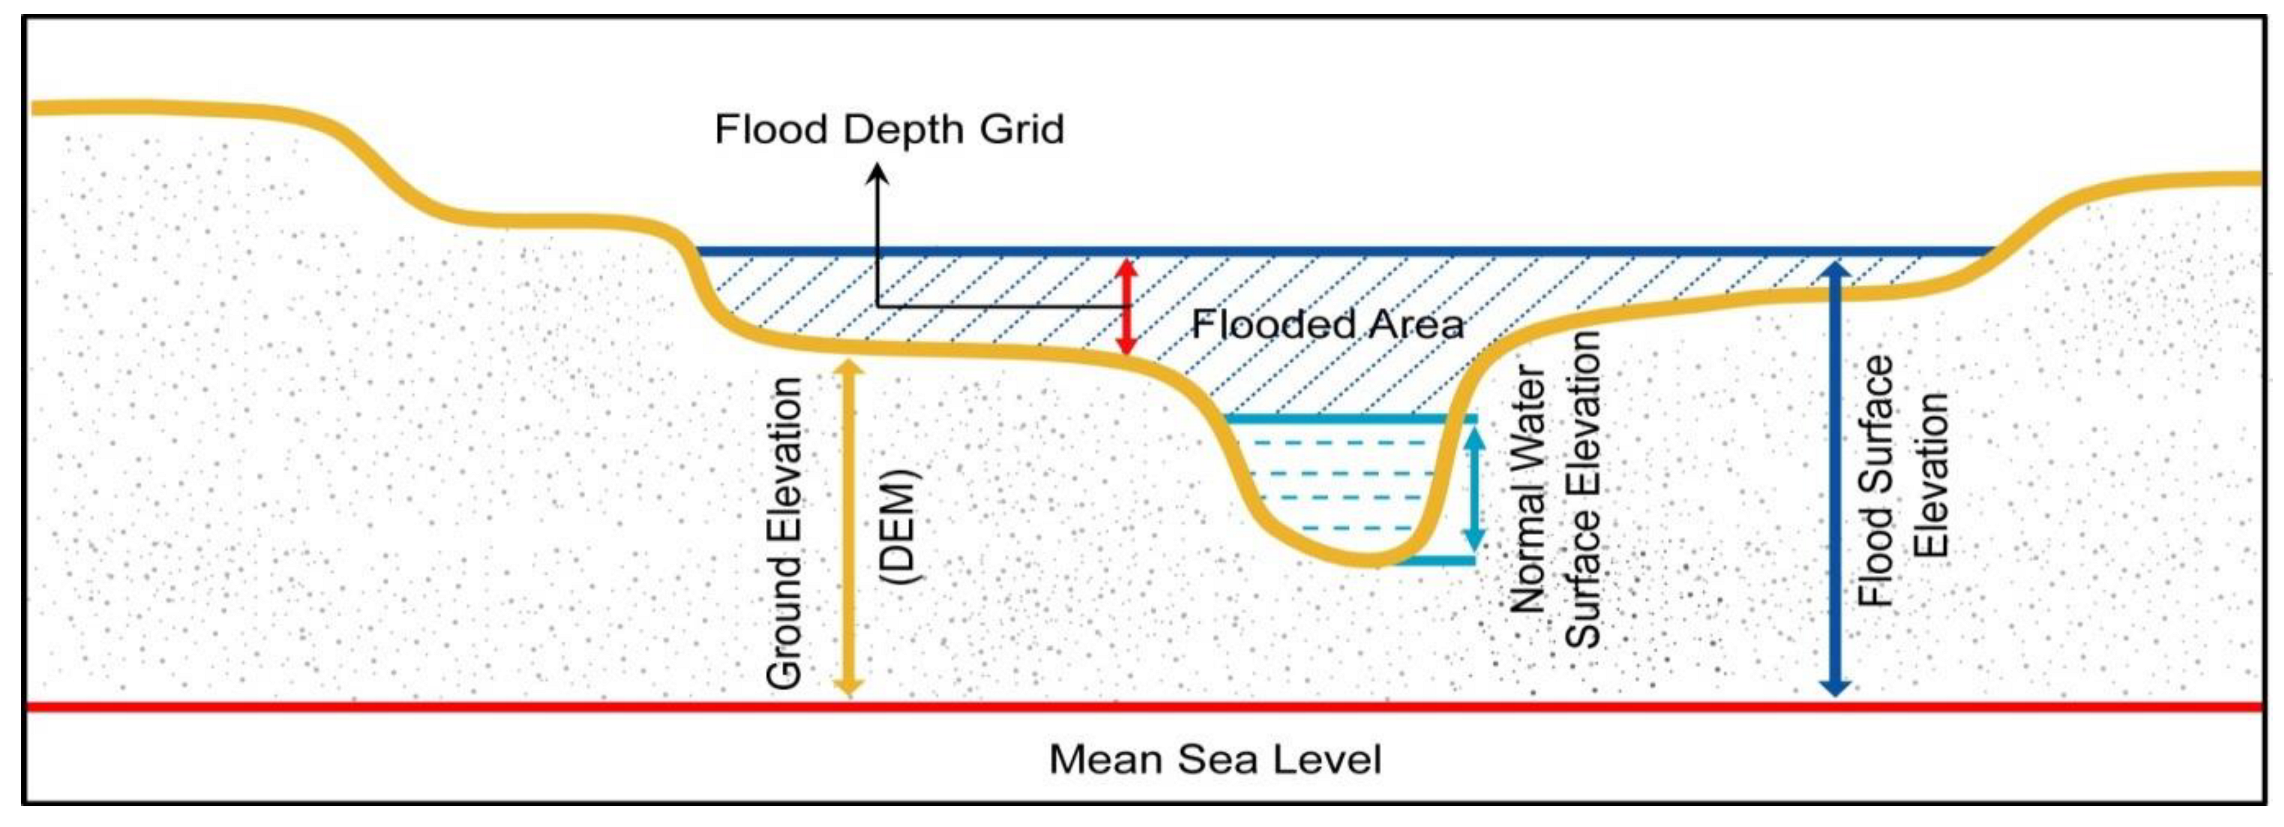
- Unavailable Flood Information Table (FIT): The most important aspect for running the riverine flood model is to have a comprehensive Flood Information Table (FIT). At present HAZUS Canada does not have built-in FIT to run the model. FIT could be created with the help of ground surface elevation, flood surface elevation and flood boundaries. At the time of this study only 5 m resolution DEM data were available, and the coverage of the floodplain was limited to either side of the river channel. This has improved, but in addition, comprehensive flood boundaries are still not available and would greatly augment these kinds of analyses. For many large rivers Lidar data are being made available, but this issue persists for smaller watersheds. Generating food depth grid data to run a comprehensive flood model in HAZUS will therefore be a challenging task for many RMs.
6. Conclusions
Author Contributions
Funding
Data Availability Statement
Acknowledgments
Conflicts of Interest
References
- Glago, F.J. Flood disaster hazards; causes, impacts and management: A state-of-the art review. In Natural Hazards; Farsangi, E.N., Ed.; Intechopen Ltd.: London, UK, 2021. [Google Scholar] [CrossRef]
- Rentschler, J.; Salhab, M. People in Harm’ Way: Flood Exposure and Poverty in 189 Countries. In Policy Research Working Paper 9447; The World Bank Group: Washington, DC, USA, 2020. [Google Scholar]
- Welsted, W.; Everitt, J.; Stadel, C. Manitoba: Geographical Identity of a Prairie Province. In The Geography of Manitoba: Its Land and Its People; Welsted, J., Everitt, J., Stadel, C., Eds.; The University of Manitoba Press: Winnipeg, MB, Canada, 1996; pp. 3–7. [Google Scholar]
- Rannie, W.F. The 1997 Red River flood in Manitoba, Canada. Prairie Perspect. Geogr. Essays 1998, 1, 1–24. [Google Scholar]
- Haque, C.E.; Mahmud, K.H.; Walker, D.; Zaman, J.R. Geophysical and Societal Dimensions of Floods in Manitoba, Canada: A Social Vulnerability Assessment of the Rural Municipality of St. Andrews. Geosciences 2022, 12, 56. [Google Scholar] [CrossRef]
- Kalssen, R.W. Quaternary geology and geomorphology of Assiniboine and Qu’appelle valleys of Manitoba and Saskatchewan. In Bulletin of Geological Survey of Canada; Department of Energy, Mines and Resources: Ottawa, ON, Canada, 1975; Volume 228, pp. 61–69. [Google Scholar]
- Halsey, L.; Vitt, D.; Zoltai, S. Climatic and physiographic controls on wetland type and distribution in Manitoba. Wetl. Soc. Wetl. Sci. 1997, 17, 243–262. [Google Scholar] [CrossRef][Green Version]
- Haque, C.E. Risk assessment, emergency preparedness and response to hazards: The case of the 1997 Red River valley flood, Canada. Nat. Hazards 2000, 21, 225–245. [Google Scholar] [CrossRef]
- Government of Manitoba. History of Flooding in Manitoba. Available online: https://www.gov.mb.ca/flooding/history/index.html (accessed on 12 May 2022).
- Haque, C.E.; Choudhury, M.-U.-I.; Sikder, M.S. Events and failures are our only means for making policy changes: Learning in disaster and emergency management policies in Manitoba, Canada. Nat. Hazards 2019, 98, 137–162. [Google Scholar] [CrossRef]
- Remo, J.W.F.; Pinter, N.; Mahgoub, M. Assessing Illinois’s flood vulnerability using Hazus-MH. Nat. Hazards 2016, 81, 265–287. [Google Scholar] [CrossRef]
- Allen, M.; Gillespie-Marthaler, L.; Abkowitz, M.; Camp, J. Evaluating flood resilience in rural communities: A case-based assessment of Dyer County, Tennessee. Nat. Hazards 2020, 101, 173–194. [Google Scholar] [CrossRef]
- FEMA. HAZUS-MH Flood Model. 2018. Available online: https://www.fema.gov/protecting-our-communities/hazus-mh-flood-model (accessed on 19 December 2021).
- FEMA. HAZUS User Groups Success Story: Using Hazus at Devils Lake, North Dakota. 2013. Available online: https://www.fema.gov/media-library/assets/documents/22095 (accessed on 17 December 2021).
- FEMA. Eagle, Alaska Uses HAZUS to Map Safe Rebuilding Zones Following Ice Jam Devastation. 2010. Available online: http://www.fema.gov/media-library/assets/documents/19657 (accessed on 14 December 2021).
- Scawthorn, C.; Blais, N.; Seligson, H.; Tate, E.; Mifflin, E.; Thomas, W.; Murphy, J.; Jones, C. HAZUS-MH flood loss estimation methodology. I: Overview and flood hazard characterization. Nat. Hazards Rev. 2006, 7, 60–71. [Google Scholar] [CrossRef]
- Vickery, P.J.; Skerlj, P.F.; Lin, J.; Twisdale Jr, L.A.; Young, M.A.; Lavelle, F.M. HAZUS-MH hurricane model methodology. II: Damage and loss estimation. Nat. Hazards Rev. 2006, 7, 94–103. [Google Scholar] [CrossRef]
- Ding, A.; White, J.F.; Ullman, P.W.; Fashokun, A.O. Evaluation of HAZUS-MH flood model with local data and other program. Nat. Hazards Rev. 2008, 9, 20–28. [Google Scholar]
- Porter, K. Cracking an Open Safe: HAZUS Vulnerability Functions in Terms of Structure-Independent Spectral Acceleration. Earthq. Spectra 2009, 25, 361–378. [Google Scholar] [CrossRef]
- Manitoba Historical Society. 2014. Available online: http://www.mhs.mb.ca/docs/municipalities/standrews.shtml (accessed on 6 July 2014).
- RM of St. Andrews. 2014. Available online: http://www.rmofstandrews.com/main.asp?cat_ID=2 (accessed on 12 November 2021).
- StatCan. 2011. Available online: http://www12.statcan.gc.ca/census-recensement/2011/dp-pd/prof/details/page.cfm?Lang=E&Geo1=CSD&Code1=4613043&Geo2=PR&Code2=46&Data=Count&SearchText=St.%20Andrews&SearchType=Begins&SearchPR=01&B1=All&Custom= (accessed on 21 July 2021).
- FEMA. 2008b; Wisconsin Emergency Management: Using HAZUS-MH to Evaluate Flood Risks and Losses across the State. Available online: https://www.fema.gov/media-library/assets/documents/13647 (accessed on 12 December 2021).
- Schneider, P.J.; Schauer, B.A. HAZUS—Its development and its future. Nat. Hazards Rev. 2006, 7, 40–44. [Google Scholar] [CrossRef]
- Banks, J.C.; Camp, J.V.; Abkowitz, M.D. A screening method for bridge scour estimation and flood adaptation planning utilizing HAZUS-MH 2.1 and HEC-18. Nat. Hazards 2016, 83, 1731–1746. [Google Scholar] [CrossRef]
- FEMA. HAZUS-MH Flood Model. 2014. Available online: https://www.fema.gov/sites/default/files/2020-09/fema_hazus_flood_user-guidance_4.2.pdf (accessed on 11 May 2022).
- Lincoln, S.Y. Naturalistic Inquiry; Egon, G., Ed.; Sage Publications: London, UK, 1985; Volume 75. [Google Scholar]
- Cutter, S.L. Vulnerability to Environmental Hazards. Prog. Hum. Geogr. 1996, 20, 529–539. [Google Scholar] [CrossRef]
- Kulmesch, S. Evaluation of the HAZUS-MH Loss Estimation Methodology for a Natural Risk Management Case Study in Carinthia, Austria. Ph.D. Thesis, Louisiana State University, Baton Rouge, LA, USA, 2010. [Google Scholar]
- Huyck, C.K.; Amyx, P.R. Technologies for real-time data acquisition, integration, and transmission. In Wiley Handbook of Science and Technology for Homeland Security; Voeller, J.G., Ed.; John Wiley and Sons: Hoboken, NJ, USA, 2010. [Google Scholar]
- Donnellan, A.; Glasscoe, M.; Parker, J.W.; Granat, R.; Pierce, M.; Wang, J.; Fox, G.; McLeod, D.; Rundle, J.; Heien, E.; et al. Integrating remotely sensed and ground observations for modeling, analysis, and decision support. In Proceedings of the Aerospace Conference, Big Sky, MT, USA, 2–9 March 2013; pp. 1–12. [Google Scholar]


| Occupancy | Damage: 1–10% | Damage: 11–20% | Damage: 21–30% | Damage: 31–40% | Damage: 41–50% | Damage: >50% | ||||||
|---|---|---|---|---|---|---|---|---|---|---|---|---|
| QL | EQL | QL | EQL | QL | EQL | QL | EQL | QL | EQL | QL | EQL | |
| Agriculture | 0 | 0 | 0 | 0 | 0 | 0 | 0 | 0 | 0 | 0 | 0 | 0 |
| Commercial | 0 | 0 | 8 | 1 | 0 | 0 | 4 | 0 | 0 | 0 | 0 | 0 |
| Education | 0 | 0 | 0 | 0 | 0 | 0 | 0 | 0 | 0 | 0 | 0 | 0 |
| Government | 0 | 0 | 0 | 0 | 0 | 0 | 0 | 0 | 0 | 0 | 0 | 0 |
| Industrial | 0 | 0 | 0 | 0 | 1 | 0 | 0 | 0 | 2 | 0 | 0 | 0 |
| Religion | 0 | 0 | 1 | 0 | 0 | 0 | 0 | 0 | 0 | 0 | 0 | 0 |
| Residential | 0 | 0 | 0 | 20 | 57 | 0 | 247 | 33 | 147 | 15 | 20 | 20 |
| Total | 0 | 0 | 9 | 21 | 58 | 24 | 251 | 33 | 149 | 15 | 20 | 20 |
| Building Type | Damage: 1–10% | Damage: 11–20% | Damage: 21–30% | Damage: 31–40% | Damage: 41–50% | Damage: >50% | ||||||
|---|---|---|---|---|---|---|---|---|---|---|---|---|
| QL | EQL | QL | EQL | QL | EQL | QL | EQL | QL | EQL | QL | EQL | |
| Concrete | 0 | 0 | 1 | 0 | 0 | 0 | 0 | 0 | 0 | 0 | 0 | 0 |
| Manufactured | 0 | 0 | 0 | 0 | 0 | 0 | 0 | 0 | 0 | 0 | 20 | 0 |
| Masonry | 0 | 0 | 1 | 0 | 0 | 0 | 3 | 0 | 2 | 0 | 0 | 0 |
| Steel | 0 | 0 | 1 | 0 | 1 | 0 | 0 | 0 | 0 | 0 | 0 | 0 |
| Wood | 0 | 0 | 1 | 20 | 57 | 24 | 246 | 33 | 147 | 15 | 0 | 20 |
| Occupancy | Study Region (RM of St. Andrews) | Flood Regime (Ward-1) | |||
|---|---|---|---|---|---|
| (Exposure in CAD 1000) | EQL with Building Stock (2009 Flood Regime) | EQL with Building Stock (2009 + 2 m Flood Regime) | |||
| (In CAD 1000) | Percent | (In CAD 1000) | Percent | ||
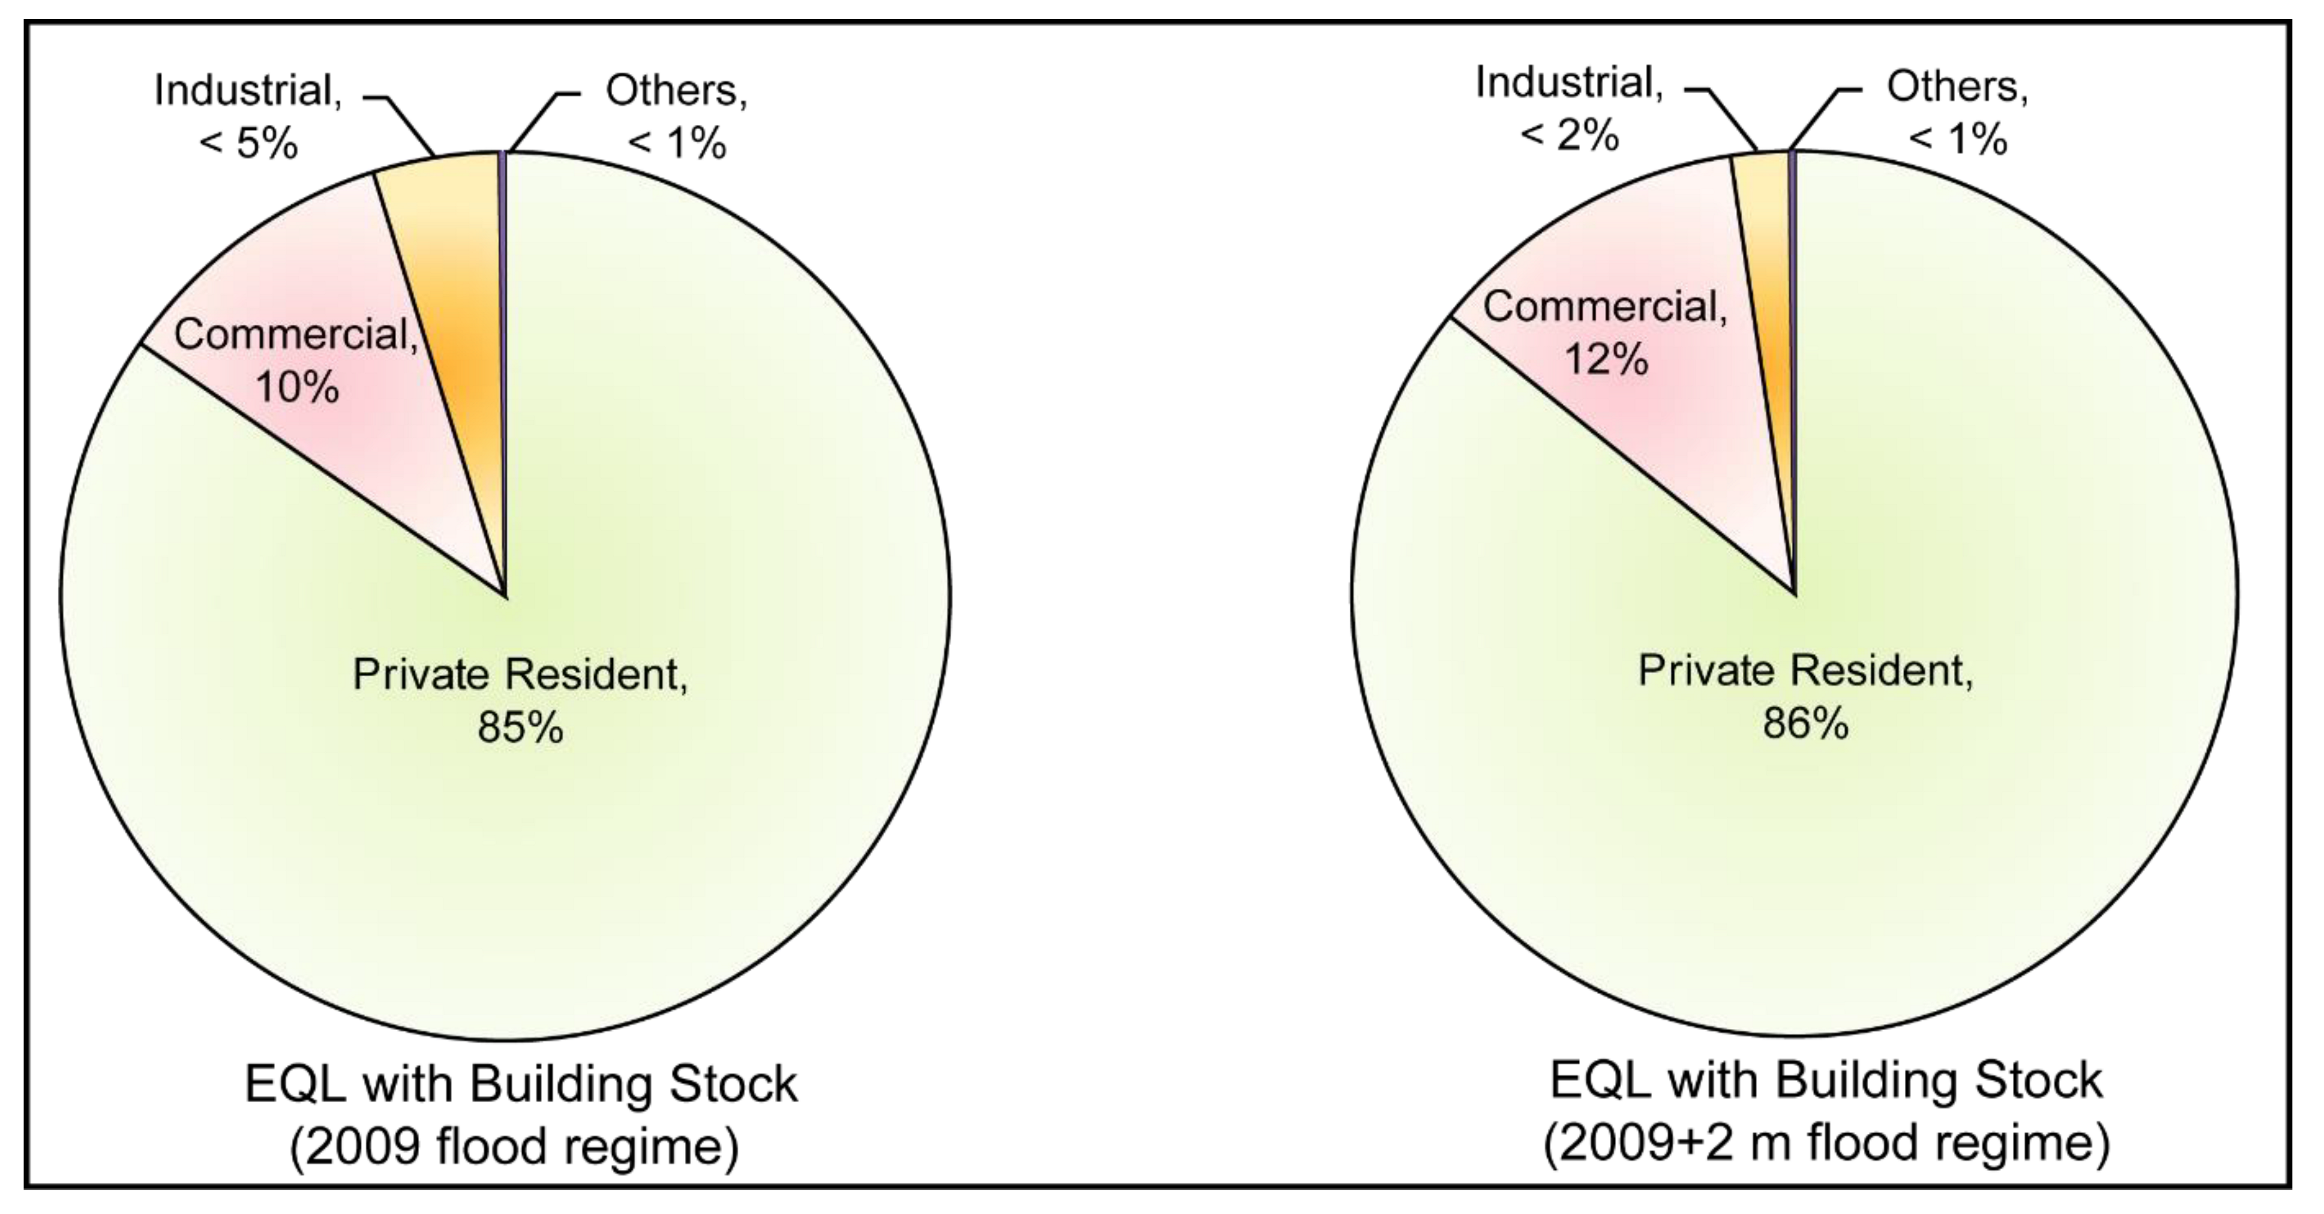
| Residential | 730,192 | 40,782 | 83.8 | 123,069 | 92.3 |
| Commercial | 76,787 | 6968 | 14.3 | 9423 | 7.1 |
| Industrial | 8220 | 770 | 1.6 | 770 | 0.6 |
| Agriculture | 7445 | 0 | 0 | 0 | 0 |
| Religion | 1527 | 139 | 0.3 | 139 | 0.1 |
| Government | 3540 | 0 | 0 | 0 | 0 |
| Education | 9570 | 0 | 0 | 0 | 0 |
| Total | 837,281 | 48,659 | 100 | 133,401 | 100 |
| Area | Residential | Commercial | Industrial | Others | Total | |||||
|---|---|---|---|---|---|---|---|---|---|---|
| S-1 | S-2 | S-1 | S-2 | S-1 | S-2 | S-1 | S-2 | S-1 | S-2 | |
| Building Loss | ||||||||||
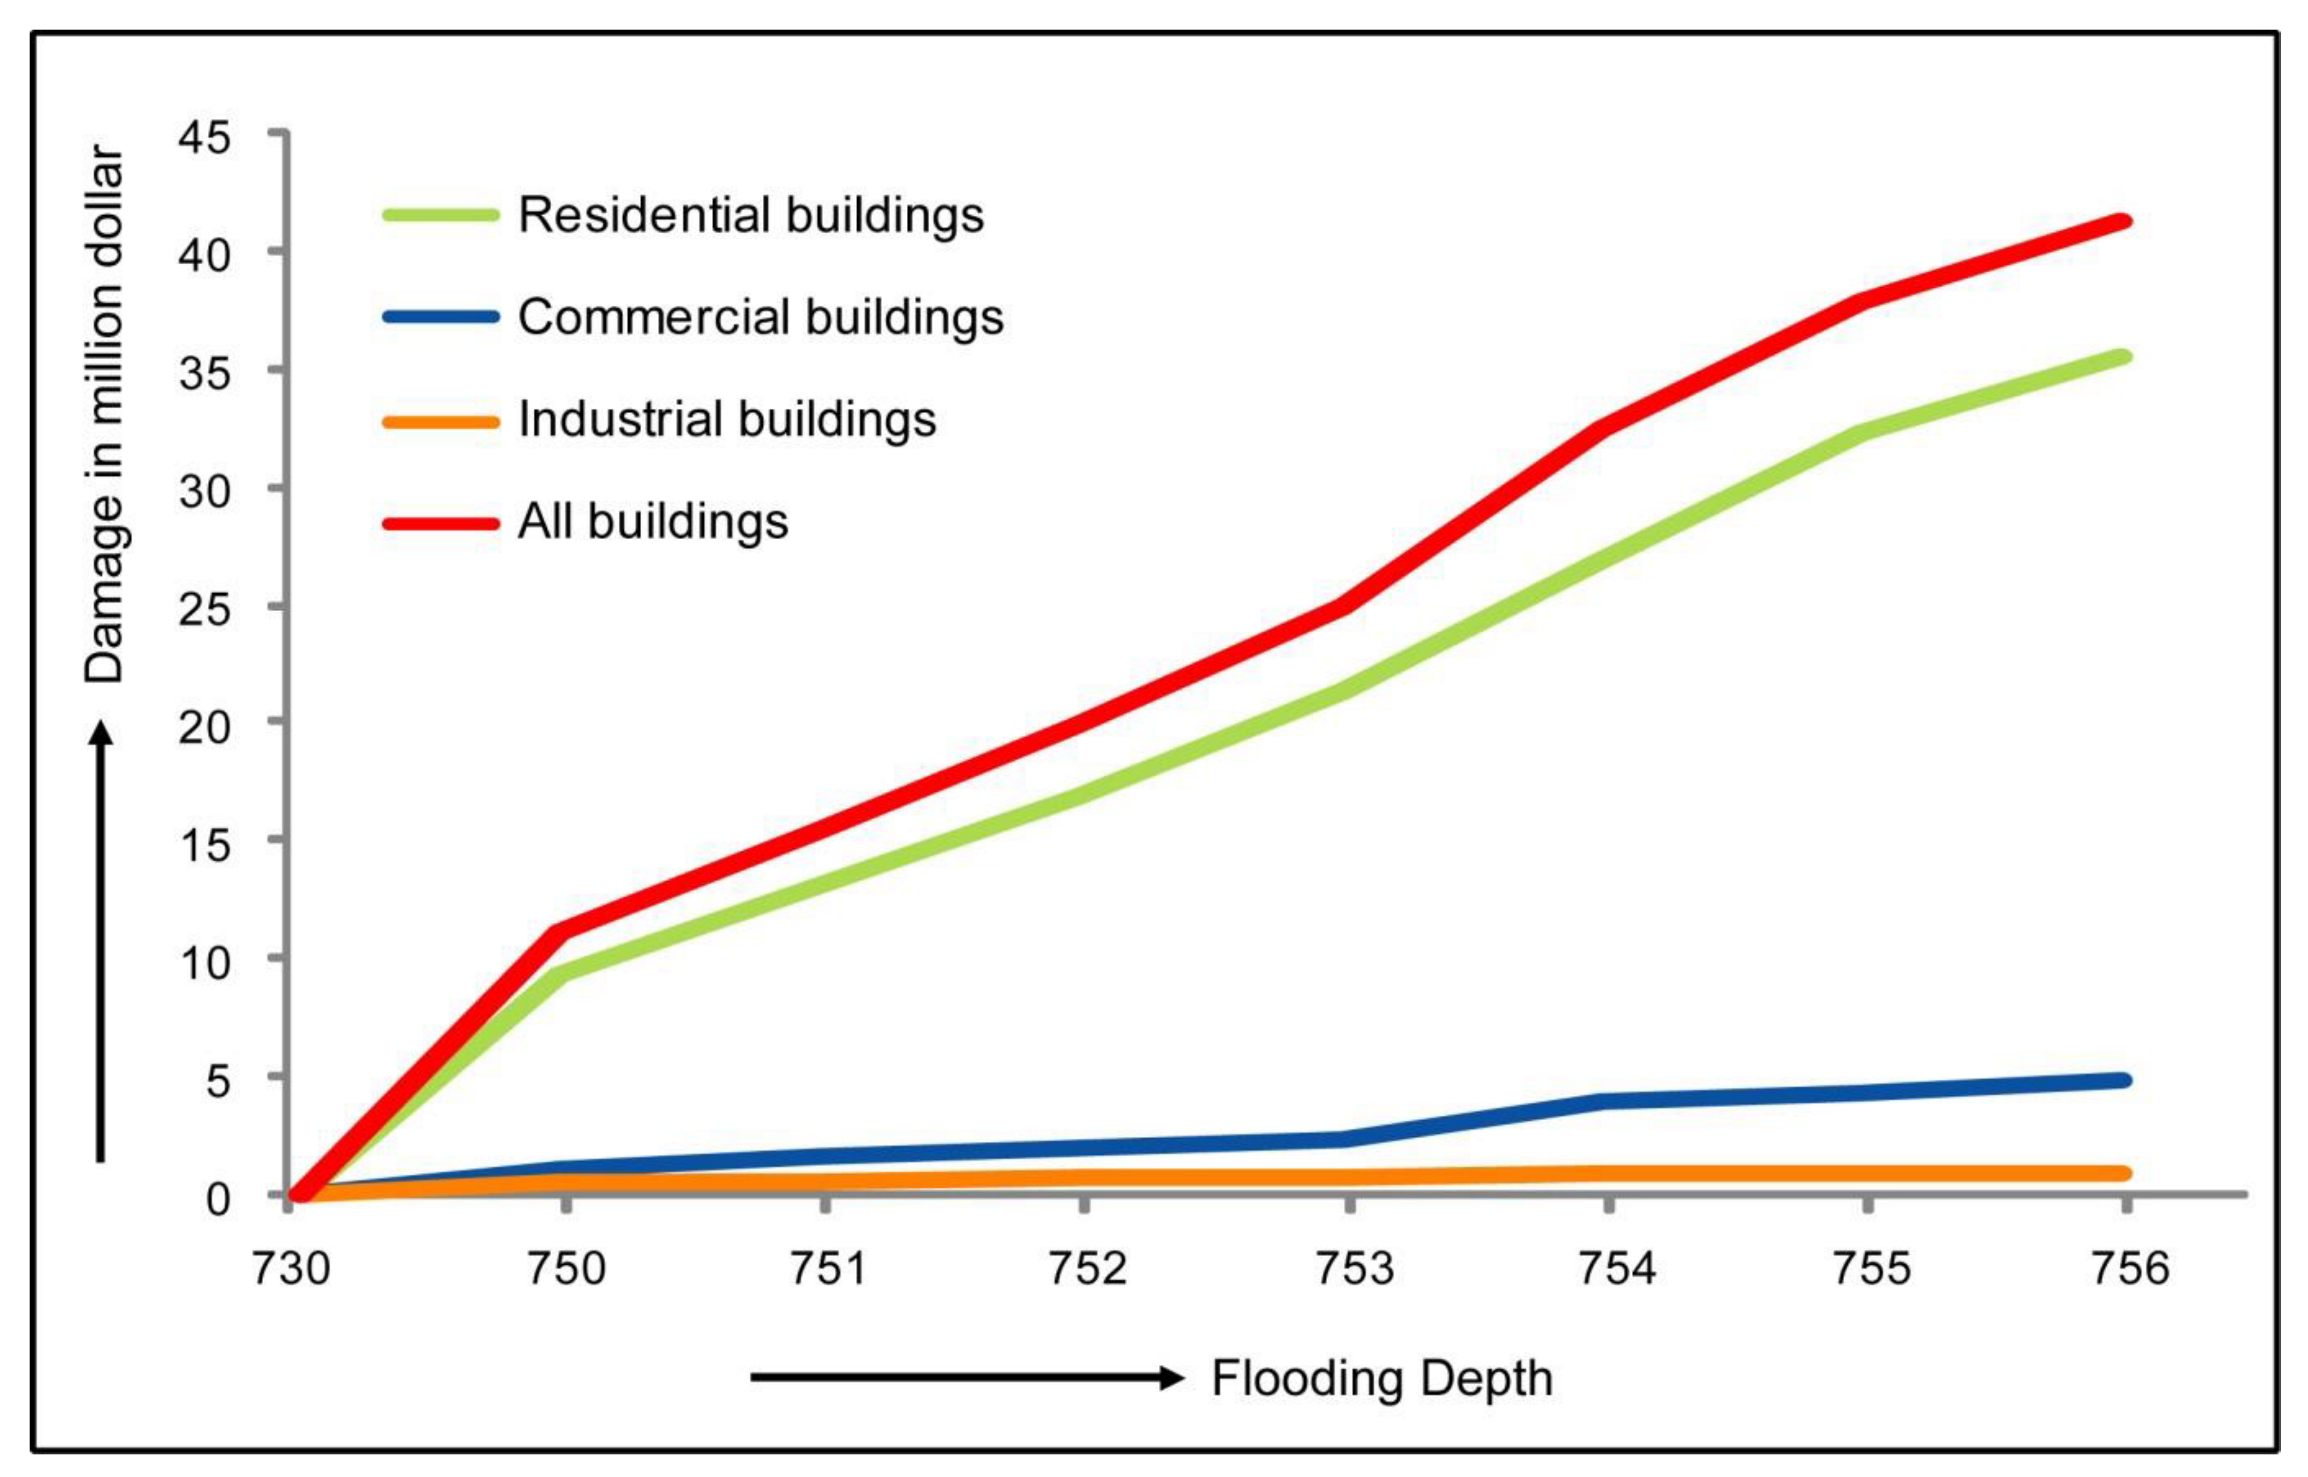
| Building | 6.70 | 25.31 | 0.53 | 2.27 | 0.16 | 0.28 | 0.01 | 0.04 | 7.40 | 27.89 |
| Content | 2.70 | 10.20 | 0.63 | 2.58 | 0.29 | 0.50 | 0.01 | 0.04 | 3.63 | 13.33 |
| Inventory | 0.00 | 0.00 | 0.00 | 0.03 | 0.06 | 0.11 | 0.00 | 0.00 | 0.07 | 0.14 |
| Sub Total | 9.40 | 35.51 | 1.16 | 4.88 | 0.51 | 0.89 | 0.02 | 0.08 | 11.10 | 41.36 |
| Business Interruption | ||||||||||
| Income | 0.00 | 0.00 | 0.01 | 0.02 | 0.00 | 0.00 | 0.00 | 0.00 | 0.01 | 0.02 |
| Relocation | 0.01 | 0.03 | 0.00 | 0.00 | 0.00 | 0.00 | 0.00 | 0.00 | 0.01 | 0.03 |
| Rental | 0.00 | 0.01 | 0.00 | 0.00 | 0.00 | 0.00 | 0.00 | 0.00 | 0.00 | 0.01 |
| Wage | 0.00 | 0.00 | 0.01 | 0.02 | 0.00 | 0.00 | 0.00 | 0.00 | 0.01 | 0.02 |
| Sub Total | 0.01 | 0.04 | 0.02 | 0.04 | 0.00 | 0.00 | 0.00 | 0.00 | 0.03 | 0.08 |
| Total | 9.41 | 35.55 | 1.17 | 4.92 | 0.51 | 0.89 | 0.02 | 0.07 | 11.11 | 41.43 |
| (a) | |||
| Develop Emergency Response Plans | Organize Response Exercises | ||
|
| ||
| (b) | |||
| Assessment | Measures | Programs | |
|
|
| |
| (c) | |||
| Response | Recovery | ||
|
| ||
Publisher’s Note: MDPI stays neutral with regard to jurisdictional claims in published maps and institutional affiliations. |
© 2022 by the authors. Licensee MDPI, Basel, Switzerland. This article is an open access article distributed under the terms and conditions of the Creative Commons Attribution (CC BY) license (https://creativecommons.org/licenses/by/4.0/).
Share and Cite
Haque, C.E.; Mahmud, K.H.; Walker, D. Understanding Flood Risk and Vulnerability of a Place: Estimating Prospective Loss and Damage Using the HAZUS Model. Geographies 2022, 2, 453-475. https://doi.org/10.3390/geographies2030028
Haque CE, Mahmud KH, Walker D. Understanding Flood Risk and Vulnerability of a Place: Estimating Prospective Loss and Damage Using the HAZUS Model. Geographies. 2022; 2(3):453-475. https://doi.org/10.3390/geographies2030028
Chicago/Turabian StyleHaque, C. Emdad, Khandakar Hasan Mahmud, and David Walker. 2022. "Understanding Flood Risk and Vulnerability of a Place: Estimating Prospective Loss and Damage Using the HAZUS Model" Geographies 2, no. 3: 453-475. https://doi.org/10.3390/geographies2030028
APA StyleHaque, C. E., Mahmud, K. H., & Walker, D. (2022). Understanding Flood Risk and Vulnerability of a Place: Estimating Prospective Loss and Damage Using the HAZUS Model. Geographies, 2(3), 453-475. https://doi.org/10.3390/geographies2030028