Abstract
As highlighted by the EU Water Framework Directive from 2000, the hydromorphology of a stream, besides water quality and biological aspects, is one of the main elements to be evaluated to correctly assess its ecological state. Notwithstanding this, there are no such studies in peninsular Southern Italy. This study provides a contribution to filling this gap by assessing the morphological quality of one of the major rivers of this area, i.e., the Calore River, by using the IDRAIM method. The latter presents the advantage of taking into account the specific Italian context in terms of channel adjustments and human pressures, together with pre-existing geomorphological approaches developed in other countries. The method is based on data obtained by means of GIS analysis, remote sensing, and field survey. The analysis provided encouraging results, highlighting the good morphological quality of the Calore River. To maintain such quality, accurate monitoring of the human activities and/or careful planning of structures that could negatively affect the river’s morphological quality is unquestionably needed. The Calore River morphological quality seems to be controlled by artificiality rather than by the channel changes experienced since the 1950s. The results will be fundamental for already planned studies dealing with flood hazard and risk assessment.
1. Introduction
In the last century, and in particular, between the 1930s and the early 2000s, most of the Italian rivers underwent remarkable morphological changes. Two types of channel adjustments were observed, i.e., riverbed lowering, which is on average in the order of 6–7 m, and channel narrowing, in some cases up to 90% [1,2,3,4,5]. These processes had serious repercussions on the ecological conditions of the river corridor, which includes channel, floodplain, and recent terraces. In particular, a significant functionality alteration of the lateral continuity processes of liquid and solid flows was observed [6,7,8].
The causes of such channel adjustments (incision and narrowing) are still debated. However, most authors invoke a dominant control by various types of anthropogenic interventions, such as land-use changes, channelizations, constructions of dams, and in-channel sediment mining [1,9,10,11,12]. Other authors [13,14] argue that climate change and related modifications in flood frequency and magnitude are the main control factors of short-term channel adjustments. According to these authors, human interventions would simply modulate the role played by such natural factors, often further exacerbating their action. Recently, Magliulo et al. [15] showed that relatively small rivers affected by negligible in-channel human disturbances underwent short-term morphological changes fully comparable to those experienced by more anthropized rivers. Thus, they conclude that the interactions between multidecadal rainfall changes and land-use changes at the basin scale, together with variations in floods magnitude and frequency, are the main controlling factors, at least for relatively small rivers.
In this framework, the assessment of the morphological and ecological status of streams is of fundamental importance for their management and protection. To this aim, the European Water Framework Directive 2000/60/EC (WFD) is the reference legislation. The directive introduced the assessment of the hydromorphological features of streams, in addition to the biological and chemical-physical ones, to define the river ecological status [16]. The directive envisaged the achievement, for all natural water bodies, of a “Good Ecological Status”, which reflects the conditions of good biodiversity and chemical-physical status. In practice, the ultimate aim is to identify the conditions that determine the natural equilibrium of the system and evaluate the human disturbances, which often negatively impact the equilibrium state [17].
In 2008, the Italian National Institute for Environmental Protection and Research (ISPRA) promoted a research program with the aim of developing a comprehensive methodology for the hydromorphological analysis of the Italian streams. This methodology, called IDRAIM (stream hydromorphological assessment, analysis, and monitoring system) [17,18,19,20], pursued an integrated analysis of both the morphological quality and the risks associated with the channel dynamics, aimed at implementing both the framework directive on water and the EU Floods Directive [21]. The Italian Ministry of the Environment also issued the monitoring and classification standards of the Water Framework Directive [22], introducing the Morphological Quality Index (IQM), whose assessment is part of IDRAIM methodology, as a protocol for the evaluation of the morphological quality of each reach of the investigated rivers [19].
It is widely accepted that a given classification system works better as a guide to stream management when it is developed for specific physiographic regions. The IDRAIM framework takes into account pre-existing geomorphological approaches developed in other countries but also the specific Italian context in terms of channel adjustments and human pressures. Furthermore, a basin-level perspective characterizes the method, and the analysis explicitly takes into account the temporal component in terms of reconstruction of the channel morpho-evolutionary trajectory as a basis for the interpretation of current river conditions and future trends [19,20]. Moreover, the method is based on an integration of GIS analysis, remote sensing, and field survey [23,24].
Several pre-existing studies focused on the hydromorphological quality assessment of streams [16,25,26,27,28,29,30], however, in peninsular Southern Italy, such studies are lacking. This is an important gap due to the proven impact of anthropogenic activities on the recent geomorphological changes of the river channels in this area [4,31,32]. The almost total absence of such kind of studies in this area can be partly explained by taking into account that, until the 2010s, an almost total lack of knowledge existed about the short-term morphological changes of rivers in Southern Italy. Such knowledge, as stated above, is of fundamental importance for the morphological quality assessment of a given river. Furthermore, the morphological quality assessment represents a first but fundamental step in the correct evaluation of the flood risks. However, the hydromorphological analysis should support and not replace classical methods of flood risk assessment based on previous inundation ranges and digital elevation models. In fact, hydromorphological analysis, such as that carried out using the IDRAIM method, considers, in an integrated way, the processes (such as riverbed lowering, lateral mobility, etc.) that control the risks associated with river morphological dynamics and induced flooding. The assessment of such processes, which are both of linear (i.e., at the reach scale) and areal type (i.e., by defining zones of different morphological river dynamics), should be integrated with the results provided by the methodologies traditionally used for the analysis of flood risk (i.e., hydraulic, topographic, and geotechnical analyses).
Due to the particular climatic and topographic conditions, the rivers of Southern Italy are often subject to catastrophic floods [33], with deep impacts on the weak local economies. Moreover, for this reason, the application of morphological quality assessment methodologies to the rivers of Southern Italy appears to be desirable.
This study aims to provide the first contribution to fill this gap by means of the hydromorphological characterization of one of the major rivers of Southern Italy, the Calore River (Figure 1), which suffered a catastrophic flood on 14–15 October 2015 [34]. The analysis was carried out by using the IDRAIM methodology, which allowed, among others, the identification of the reaches with the most critical issues.
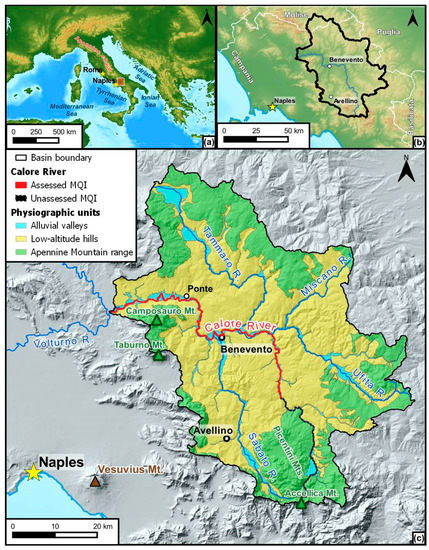
Figure 1.
Location map of the Calore River basin in the framework of (a) the Italian peninsula and (b) the main regions of Southern Italy. In (a), the location of the Apennines Mountain chain is also shown. In (c), the physiographic units, the main tributaries of the Calore River, and the main urban settlements are also reported.
Study Area
The Calore River basin is located in Southern Italy, within the axis of the Campanian sector of the Southern Apennines fold-and-thrust belt (Figure 1), which is the result of compressional tectonics mainly active during the Tertiary [35].
The basin has an extension of 3050 km2 and is located between 41°30′ N and 40°46′ N latitude and 14°27′ E and 15°20′ E longitude. The highest altitude (i.e., Accellica Mount, Massif of the Picentini Mountains) is 1810 m a.s.l., while the lowest is 55 m a.s.l. (i.e., at the confluence into the Volturno River) [5].
The climate in the Calore River basin is temperate-warm, with mean annual rainfall of ∼1150 mm, mainly concentrated during autumn and winter [36]. The rainiest month is November, while August is the driest. Mean annual temperature is 15.1 °C.
The Calore River flows into morphostructural depressions infilled with alluvial, volcanic, and slope deposits [37]. In some cases (e.g., lower Calore River valley), Quaternary alluvial deposits form very thick sedimentary successions [38].
The Calore River basin can be subdivided into three main physiographic units (Figure 1c): (a) The Apennine Mountain range, located along the basin border, (b) the low-altitude hills, which occupy a large portion of the inner part of the basin, and (c) the alluvial valleys.
The Apennine Mountain range is shaped into limestone and dolostone, Jurassic to Cretaceous in age. Steep slopes, locally deeply dissected by tributary streams, characterize this physiographic unit. At the top of these slopes, karstified remnants of ancient erosional landscapes (paleosurfaces or Paleosuperfici Auct.) are present.
The hilly relieves are shaped into terrigenous deposits, mainly Miocene to Pliocene-aged. The hills are gently sloping and gently rolling [5]. Frequent and clear evidence of severe water erosion and mass movements affect these relieves. Such erosional processes control the contribution of solid material to the river, which affects its morphological variations, whose assessment is fundamental for the MQI calculation that we carried out in this study. Landslides of various types are also extremely common in the Calore River basin [39].
The alluvial valleys are shaped into Quaternary sediments and are mainly of morphostructural origin [38,40,41]. Thick successions of alluvial and slope deposits, often forming coalescent and/or telescopically arranged alluvial fans, connect the slopes to the alluvial plains. The latter are characterized by different orders of river terraces. Locally, structural terraces shaped into pyroclastic deposits (i.e., Campanian Ignimbrite) and travertines are present.
The land-use in the Calore River basin [42] is dominated by agricultural lands (64% of the total area) and, subordinately, by forests (23%). In the last 60 years, the studied basin experienced an increase in forested areas at the expense of agricultural lands. Most of the land-use changes in the study area occurred between the 1960s and the 1990s, followed by a period of substantial stability. This likely led to a decrease in soil erosion and sediment supply to the rivers between 1960 and 1990 [42], which is confirmed by recent studies dealing with short-term river channel adjustments [4,5,43], followed by a phase of overall stability since the 1990s [42].
The Calore River, which flows through the basin, is the main left tributary of the Volturno River and one of the major rivers of the Campanian Apennines. It starts from Accellica Mount and flows down for some 110 km before joining the Volturno River. The mean annual flow discharge, measured just upstream from the confluence into the Volturno River, is ~30 m3/s [31]. The Calore River valley pattern is strongly controlled by tectonics, as evidenced by the four successive segments that form at 90° angles to each other [37].
Of the entire Calore River, only the middle-lower course was investigated for the calculation of the MQI (Figure 1c). The investigated reach is comprised between the points of coordinates 41°11′03″ N–8°27′45″ E and 41°00′03″ N–8°56′51″ E. The reach located upstream from the latter point was excluded from the analysis for reasons that will be better clarified in the “Materials and Methods” section.
2. Materials and Methods
The present research required: (i) The characterization of the fluvial system, (ii) the assessment of past morphological evolution, and (iii) the evaluation of the current conditions of the Calore River. We used the QGIS 3.24 software (OSGeo, Beaverton, OR, USA) to obtain and process all the data.
A preliminary step in the application of the methodology consisted in the manual digitization of all the environmental features that were necessary for the MQI calculation. In particular, we manually digitized: (i) The active channel of the Calore River, (ii) the centreline (i.e., the line that connects the points equally distanced from the riverbanks within the active channel), (iii) the valley axis (which was necessary for the sinuosity calculation, as will be better explained below), (iv) the fluvial bars, whose spatial distribution is necessary to assess the channel morphology), and, (v) the anthropogenic structures (e.g., bridges, check-dams, mining sites, walls).
For the digitization of the above-listed elements, we used, as background in GIS environment: (i) 1:5000-scaled digital color orthophotos, produced by the Campania Region in 2014 and georeferenced in the UTM-WGS84 coordinate system, (ii) a 10 m-cell size Digital Terrain Model (DTM), freely available and downloadable from the INGV-SURFLT website [44], (iii) 1:25,000-scaled topographic maps from 1955, produced by the Italian Military Geographical Institute (IGMI), in *.ecw format, georeferenced in the UTM-WGS84 coordinate system. The latter were necessary to assess the variations in channel width and morphology that occurred between 1955 and 2014. The data were then validated in field.
2.1. Characterization of Fluvial System
2.1.1. Physiographic Units, River Segments (RS), and Confinement Conditions Definition
As a first step, we subdivided the Calore River basin into three physiographic units, i.e., the Apennine Mountain range (AMR), low-altitude hills (LAH), and alluvial valleys (AV) (Figure 1), whose features were described in the “Study area” section. According to Rinaldi et al. [20], we defined the physiographic units based on both elevation and geological data. More precisely, the 600 m a.s.l. contour line (as derived from the 10 m-cell DTM mentioned above) marked the boundary between AMR and LAH physiographic units, while the upper lithological limit of the Quaternary-aged alluvial deposits marked the boundary between AV and LAH physiographic units. We digitized the latter boundary from five Geological Maps at 1:100,000 scale, produced by Servizio Geologico d’Italia, i.e., (i) Sheet N. 173—“Benevento” [45], (ii) Sheet N. 174—“Ariano Irpino” [46], (iii) Sheet N. 162—“Campobasso” [47], (iv) Sheet N. 185—“Salerno” [48], and (v) Sheet N. 186 “S. Angelo de’ Lombardi” [49]. These maps were previously scanned, imported into the QGIS 3.24 software, and georeferenced in the UTM-WGS84 coordinate system.
The intersections between the boundaries of the physiographic units and the Calore River allowed a first subdivision of the studied river into River Segments (RS). Such subdivision was further refined based on river confinement conditions. To this aim, two parameters were calculated, i.e., the Confinement Degree (CD) and the Confinement Index (CI).
To calculate the CD (which expresses the lateral confinement of the river), we overlaid the riverbanks (that we previously digitized at the 1:5000 scale) on the Geological Maps (1:100,000-scaled) listed above. Thus, we split each riverbank into “confined” segments (i.e., bordered by slopes, landslides, alluvial fans, Pleistocene-aged river terraces) and “unconfined segments” (i.e., bordered by alluvial plain shaped into Holocene-aged alluvial deposits). We refined such subdivision by overlaying the previously split riverbanks on the Digital Terrain Model to identify more precisely the inner boundary of the alluvial plain. Then, the GIS software automatically calculated the length of the “confined” riverbanks, as well as the total riverbank length. We calculated the CD of each RS by means of the following formula:
We considered the following possible cases, based on the CD values [23]:
- Confined channel: More than 90% of the riverbanks are bordered by slopes, landslide bodies, alluvial fans, or inactive river terraces;
- Partly confined channel: A part of the riverbanks ranging between 10% and 90% is bordered by slopes, landslide bodies, alluvial fans, or inactive river terraces;
- Unconfined channel: Less than 10% of the riverbanks is bordered by slopes, landslide bodies, alluvial fans, or inactive river terraces.
To calculate the CI (which expresses the longitudinal river confinement), we first digitized the alluvial plain, based on the spatial distribution of the Holocene-aged alluvial deposits. We then refined the digitized boundary by overlaying it on the DTM to take into account also the local topography. For each RS, the GIS software automatically calculated both the channel area and the alluvial plain area. Then, the “Fluvial Corridor” QGis tool automatically traced a centerline for both the alluvial plain and the river channel. The length of both centerlines was automatically calculated by the software. By dividing the alluvial plain area by the length of the alluvial plain centerline, we calculated the alluvial plain mean width. Similarly, we calculated the river channel mean width [50]. This allowed us to calculate the CI of each RS as follows:
According to Rinaldi et al. [20], we used the following classes of CI:
- High confinement: 1 < CI < 1.5;
- Medium confinement: 1.5 < CI ≤ k;
- Low confinement: CI > k
Because the Calore River is a single-thread channel [31], k = 5 [20].
Finally, we defined the overall confinement of each RS based on both CD and CI, according to Table 1 [20]:

Table 1.
Definition of the RS confinement classes.
2.1.2. Channel Morphology Assessment
To define the channel morphology, both the sinuosity index [51] and morphological pattern were determined.
The sinuosity index calculation requested splitting the entire centerline of the Calore River into shorter segments, i.e., the previously identified RSs. Then, the QGis software automatically calculated the length of each RS centerline. The straight segment joining the extremes of each RS represented the valley axis. Similar to the centerline, the length of the valley axis for each RS was automatically calculated by the software. Finally, we calculated the sinuosity index (SI) for each RS as follows:
To complete the characterization of the channel morphology, we also took into account the distribution of the fluvial bars within the active channel. The fluvial bars were previously digitized on the orthophotos of 2014. This allowed us to define the channel morphological pattern according to Rinaldi [52]. By combining the SI values and the channel morphological pattern, we defined the channel morphology class for each RS according to Rinaldi et al. [20] (Table 2).
Table 2.
Classes of channel morphology and associated threshold values of sinuosity index.
Unfortunately, it was not possible to assess the channel morphology for the entire Calore River. In fact, in sectors located upstream from the point of coordinates 41°00′03″ N and 8°56′51″ E, the fluvial bars were not correctly identifiable on the orthophotos due to both the negligible channel width and bar extension and, especially because they were partly or totally hidden by a very dense arboreal overhanging riparian vegetation. Thus, it was not possible to assess both the channel morphology and, subsequently, the MQI of these sectors (Figure 1).
2.1.3. Final Definition of the River Reaches (RR)
In this step, the river reaches previously defined on the basis of confinement (both lateral and longitudinal), sinuosity, and channel morphological pattern were, where necessary, further subdivided on the basis of: (i) Presence of important hydrological discontinuities (e.g., confluences with the main tributaries), (ii) excessive length (i.e., >5 km), (iii) presence of sediment extraction sites, (iv) further variations in channel morphology. The final river reaches (hereinafter, RRs) identified in this step represented the basic elementary unit functional to the following analyses.
2.2. Assessment of the Past Morphological Evolution
In this phase, the previously obtained data were analyzed in the framework of a morpho-evolutionary framework. This was aimed at deriving an assessment of the current river morphological conditions also based on the knowledge of past conditions. In particular, we analyzed the adjustments in: (i) Channel pattern, (ii) channel width, (iii) riverbed level.
2.2.1. Assessment of Adjustments in Channel Pattern
For this parameter, in the GIS environment, we made a comparison between the morphology of the different RRs from 1955 and 2014.
According to Rinaldi et al. [20], we considered the following possible cases:
- Unchanged morphological configuration;
- Limited or moderate variation in morphological configuration, i.e., between contiguous types;
- Intense morphological configuration variation, i.e., between non-contiguous types.
Contiguous types refer to similar morphological configurations (e.g., a riverbed that passes from meandering to sinuous), while non-contiguous types include variations between very different morphologies (e.g., from multiple channels to single channels).
We have, therefore, classified the changes in the morphological configuration based on whether or not the channel switched to a different morphology than the initial one in the time interval under consideration (i.e., 1955–2014; Table 3).
Table 3.
Definition of contiguous and non-contiguous morphologies in the variations of morphological configuration. Morphologies: ST = straight, S = sinuous, M = meandering, SAB = sinuous with alternating bars, W = wandering;  = passage in both directions. Class: B = transition to contiguous morphology; C = transition to non-contiguous morphology (From: Rinaldi et al. [20]).
= passage in both directions. Class: B = transition to contiguous morphology; C = transition to non-contiguous morphology (From: Rinaldi et al. [20]).
2.2.2. Assessment of Adjustments in Channel Width
To assess the adjustments in channel width, we first divided the Calore River channel from 1955 into the same RRs identified for the channel in 2014. The QGis software automatically calculated the area of each RR from 1955. Similarly, we also split the centerline of the Calore River from 1955 according to the RRs identified in 2014. The centerline length of each reach was automatically calculated by the software. We then calculated, for each RR from 1955, the channel mean width (RRCMW1955) as follows [50]:
We then compared RRCMW1955 and RRCMW2014 (i.e., the active channel mean width of each RR in 2014, which we previously calculated to determine the river confinement). We calculated the variation in width, expressed in meters, between RRCMW1955 and RRCMW2014 (∆CMW1955–2014) as follows:
Finally, we expressed the observed variation in active channel mean width in the considered period as a percent of the CMW in 1955:
The calculated ∆CMW1955–2014 were classified according to Rinaldi et al. [20], i.e.,
- Channel unchanged or affected by limited variations: ∆CMW1955–2014 ≤ 15% of RRCMW1955;
- Moderate narrowing or widening: 15% < ∆CMW1955–2014 < 35% of RRCMW1955;
- Intense narrowing or widening: ∆CMW1955–2014 > 35% of RRCMW1955.
2.2.3. Assessment of Adjustments in Bed-Level
We derived data about bed-level changes from the literature. In particular, Magliulo et al. [31] demonstrated that, between 1955 and 1998, the Calore River underwent a riverbed lowering ranging between 3 and 5 m. Such an amount allows classifying (according to Rinaldi et al. [20]) the riverbed lowering experienced by the Calore River as “intense” (i.e., ranging between 3 and 6 m). Magliulo et al. [5] report that no significant changes affected the Calore River and its main tributaries in the 2000s. Thus, the amount of the incisions reported by Magliulo et al. [31] for the period 1955–1998 is very likely valid also for the entire 1955–2014 timespan.
2.3. Assessment of the Current Conditions of the Calore River
Morphological Quality Index (MQI) Assessment
According to Rinaldi et al. [20], we assessed three different hydromorphological features, i.e.,
- Geomorphic functionality, which is based on the observations of fluvial landforms and processes.
- Artificiality, which expresses presence, frequency, and spatial continuity of anthropogenic structures and/or activities, which could affect the considered river morphological parameters;
- River channel changes.
We analyzed such three features by integrating results derived from GIS-analysis of the topographic maps and remotely sensed data described above with field-surveyed data. The analysis was based on the assignment of scores to Functionality, Artificiality, and Channel Changes indicators. Both the indicators and the scores are reported on the Evaluation Forms freely downloadable from the website https://www.isprambiente.gov.it/it/pubblicazioni/manuali-e-linee-guida/idraim-sistema-di-valutazione-idromorfologica-analisi-e-monitoraggio-dei-corsi-dacqua (accessed on 23 June 2022) [53]. The scores are synthesized in Table 4.
Table 4.
Scores relating to the indicators of functionality, artificiality, and channel adjustments. (A) absence of alterations, (B) medium alteration, (C) high alteration.
We then calculated the Morphological Alteration Index (MAI) as follows [20]:
where Stot is the sum of the scores and Smax is the maximum possible deviation for the given stream typology (i.e., the sum of the class C scores, reported in Table 4, for all the questions applicable to the study case). The MAI is equal to 1 in a completely unaltered river, while it is equal to 0 in a completely altered river.
MAI = Stot/Smax
The final step was the assessment of the Calore River morphological quality by means of the calculation, for each RR, of the Morphological Quality Index (MQI), as follows:
MQI = 1 − IAM.
Based on the MQI values for each RR, we defined the Morphological Quality Classes according to Rinaldi et al. [20]. These classes are reported in Table 5.
Table 5.
Morphological quality classes.
We finally assessed the overall morphological state of the Calore River by calculating the Mean Morphological Quality Index (MMQI) by means of the following formula [20]:
where:
MQIRR-i is the Morphological Quality Index of the RR “I”;
LRR-i is the length of the RR “I”.
3. Results
3.1. Physiographic Units and River Segments (RS) Definition
As already stated above, following the method by Rinaldi et al. [20], the Calore River basin can be subdivided into three physiographic units, i.e., the Apennine Mountain Range (AMR), the low-altitude hills (LAH), and the alluvial valleys (AV). Figure 1 shows the spatial distribution of the detected physiographic units, while Table 6 reports their extension. The LAH physiographic unit is the most widespread one, accounting for 60% of the total basin area (Table 6). It occupies most of the inner part of the basin (Figure 1) and is mainly shaped into terrigenous deposits. The AMR is located along the basin boundaries (Figure 1), is mainly shaped into carbonate rocks, and accounts for 34% of the Calore River basin (Table 6). Finally, the AV physiographic unit accounts for the remaining 6% of the basin area only.
Table 6.
Main features of the Calore River basin physiographic units.
The intersections between the physiographic unit boundaries and the Calore River channel allowed subdividing the latter into 6 River Segments (RSs; Figure 2).
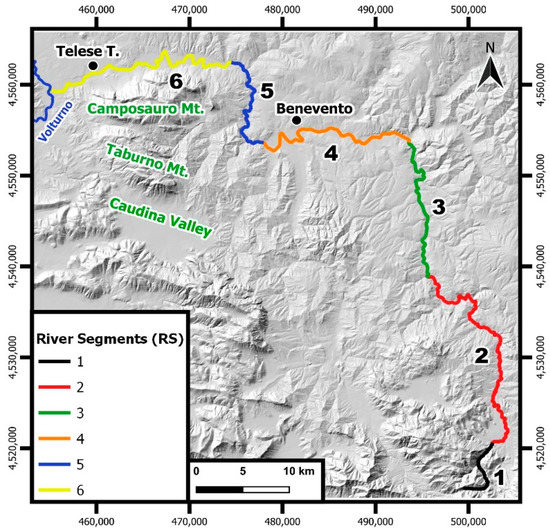
Figure 2.
River Segments (RS) of the Calore River.
Table 7 shows that the RS2 is the longest one, as it accounts for 26% of the total Calore River length, while RS1 is the shortest, as it accounts for 7% of the total length of the Calore River only.
Table 7.
Length of the detected RS of the Calore River.
3.2. Confinement and Channel Morphology Assessment
The aerial photos interpretation of the RSs defined above showed that it was not possible to detect and digitize the fluvial bars correctly in GIS environment in both RS1 and RS2. This was due to both the negligible channel width and, mostly, to the presence of a very dense arboreal riparian vegetation, which, locally, totally hides the channel. Because the spatial distribution of the fluvial bars in the active channel, i.e., the channel pattern, is fundamental in correctly subdividing the RS (which, in turn, is necessary for a correct assessment of the MQI), we decided to exclude RS1 and RS2 from the following analysis.
We carried out the further subdivisions of the investigated RSs into River Reaches (RRs) based on the variations of Confinement degree (CD), Confinement Index (CI), Sinuosity Index (SI), and channel morphology. Some RRs that were too long (i.e., >5 km) and/or included hydrological discontinuities (e.g., confluences with tributaries) or anthropogenic structures (e.g., walls, sediment extraction sites) were further subdivided to define the final 30 RRs (Table 8 and Figure 3). Table 8 summarizes the above-listed parameters (i.e., CD, CI, and SI) and associated variations that led to the final definition of the RRs, while Figure 3a shows the spatial variations of the channel morphology. Finally, Figure 3b shows the location of the final RRs.
Table 8.
Main parameters of the 30 Calore River reaches. RR = river reach; CD = confinement degree; CI = confinement index; CC = confinement class; SI = sinuosity index; PC = partly confined; UC = unconfined; S = sinuous; ST = straight; M = meandering. RRs that present the same CC and SI-based morphological pattern (e.g., 3.1.1 and 3.1.2) were separated based on channel morphology (Figure 3a) and/or hydrological discontinuities and/or presence of anthropogenic structures.
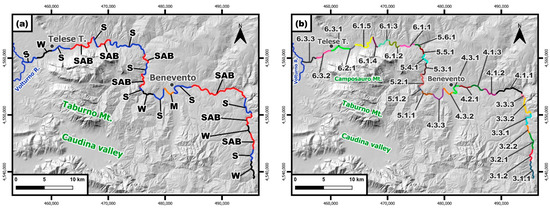
Figure 3.
(a) Spatial distribution of the river channel morphologies; (b) Locations of the final River Reaches (RRs) used for the MQI assessment. The classification of the RRs channel morphology in (a) derives from the SI-based morphological pattern shown in Table 8, integrated with observations about the spatial distribution of the fluvial bars.
Table 8 shows that 21 RRs out of 30 shows a CD ranging between 10% and 90% and a CI > 1.5. Thus, according to Rinaldi et al. [20], they can be classified as “partly confined”. The remaining nine RRs show a CD lower than 10% and a CI > 5, meeting the requirements of the “unconfined” reaches for the single-thread rivers (as the Calore River is). The unconfined reaches are located in the lower Calore River and coincide with the RRs of the RS6.
As regards the SI-based morphological pattern (Table 8), the “sinuous” one is the most widespread, as it characterizes 21 RRs out of 30. “Meandering” SI-based morphological patterns characterize six RRs over 30, while only three RRs display a straight pattern. Considering also the spatial distribution of the fluvial bars within the active channel (Table 9 and Figure 3a), the “sinuous” morphology is the most widespread, as it characterizes 14 RRs out of 30. The “sinuous with alternate bars” channel morphology is also quite widespread, as it characterizes 11 RRs out of 30. Finally, four RRs display a wandering channel morphology, and only one RR, located just upstream from the town of Benevento (Figure 3a), displays a meandering channel morphology.
Table 9.
Comparison between RRs channel morphologies from 1955 and 2014. SAB = Sinuous with alternated bars; ST = straight; W = wandering; S = sinuous; L = limited; U = unchanged; I = intense.
3.3. Short-Term Channel Changes
The channel adjustments that occurred in the period 1955–2014 that we considered included changes in: (i) Channel morphology, (ii) channel width, and (iii) channel depth.
The analysis of the Calore River channel morphology from 1955 showed a strong predominance of the “sinuous with alternated bars” channel morphology, which characterized 24 RRs out of 30 (Table 9). The comparison with the channel morphology from 2014 showed that, according to Rinaldi et al. [20], the morphological variation was “limited” in 19 RRs out of 30. The channel morphology remained unchanged in 9 RRs out of 30, while only 2 RRs experienced an “intense” channel morphology variation (Figure 4).
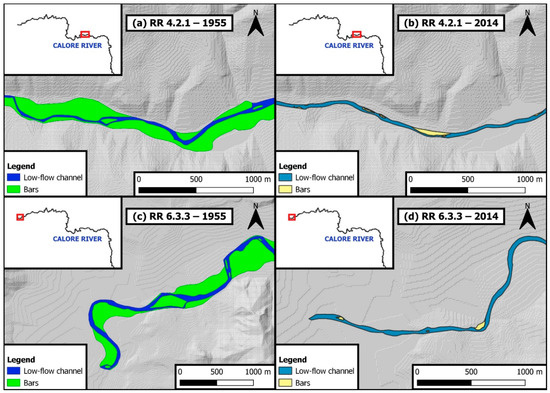
Figure 4.
Geomorphological sketches showing the “intense” (sensu [20]) channel morphology variations experienced by RRs 4.2.1 (a,b) and 6.3.3 (c,d). In both cases, the channel morphology changed from wandering to sinuous. Inset boxes show the RRs locations.
Table 10 summarizes the active channel mean width variations experienced by the detected Calore RRs in the period and their classification according to Rinaldi et al. [20].
Table 10.
Active channel mean width variations and associated classification experienced by the Calore River reaches between 1955 and 2014. RR = river reaches.
The active channel mean width variations showed that all the investigated RRs of the Calore River experienced processes of narrowing between 1955 and 2014. In some cases, these processes were dramatic, with peaks of more than 86% (e.g., RR 4.1.2; Figure 5). More generally, 22 RRs out of 30 experienced an “intense” narrowing (sensu [20]). Only 2 RRs out of 30 experienced a “limited” narrowing, while the remaining 6 RRs underwent a “moderate” narrowing.
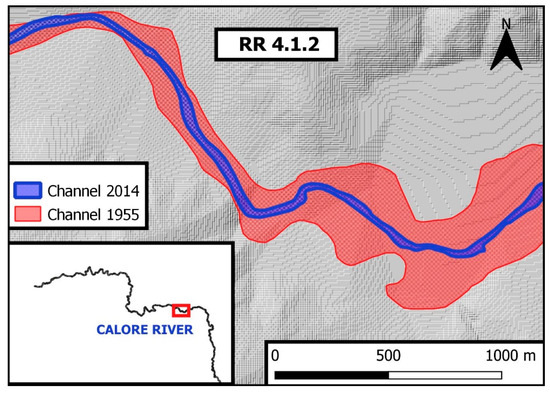
Figure 5.
Geomorphological sketch showing the evidence of the dramatic narrowing experienced by RR 4.1.2 between 1955 and 2014.
As regards the bed-level changes, unfortunately, it was not possible to obtain original data. However, literature data [31] show that between 1955 and 1998, the Calore River underwent a riverbed lowering due to channel incisions ranging between 3 and 5 m. Other studies (e.g., [5]) report that no significant changes affected the Calore River and its main tributaries in the 2000s. Thus, the amount of the incisions reported by Magliulo et al. [31] for the period 1955–1998 can be considered valid also for the entire time span considered in this study (i.e., 1955–2014). Furthermore, the field survey carried out in this study fully confirmed the evidence of the riverbed lowering reported by the studies mentioned above [31] (Figure 6). The amount of riverbed lowering experienced by the Calore River allowed classifying such incisions as “intense”, i.e., ranging between 3 and 6 m [20].
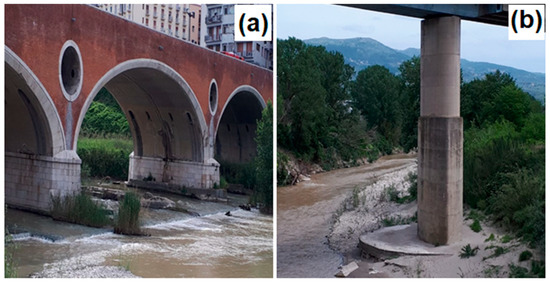
Figure 6.
Evidence of riverbed lowering. (a) Exhumation of the Vanvitelli bridge basal concrete plate, urban area of Benevento (RR 4.3.2); (b) evidence of exhumation and undermining at the foot of the viaduct pile of the SS372 road “Telesina” (RR 6.2.1).
3.4. Morphological Quality Index (MQI) Assessment
The MQI was calculated by assigning a score to the indicators of Functionality, Artificiality, and Morphological Changes for each RR, following the method by Rinaldi et al. [20].
Table 11 shows the scores assigned to the indicators of Functionality. These latter evaluate whether or not the processes and related forms responsible for the correct “functioning” of the river are prevented or altered by artificial elements or by channel adjustments. The higher the scores, the deeper the functionality alterations. Table 11 shows that RR 4.1.2 and 6.1.1 are those displaying the more severe alterations of Functionality. The spatial variation of the Functionality index is shown in Figure 7. A quite high alteration of functionality (11 < FI < 15) affects the entire segment of the Calore River located just upstream from the confluence into the Volturno River. Only one RR (i.e., RR 3.2.2) shows good functionality.
Table 11.
Scores assigned to the Functionality indicators. F1 = Longitudinal continuity in sediment and wood flux; F2 = Presence of a modern floodplain; F3 = Hillslope–river corridor connectivity; F4 = Processes of bank retreat; F5 = Presence of a potentially erodible corridor; F6 = Bed configuration–valley slope; F7 = Forms and processes typical of the channel pattern; F8 = Presence of typical fluvial forms in the alluvial plain; F9 = Variability of the cross-section; F10 = Structure of the channel bed; F11 = Presence of in-channel large wood; F12 = Width of functional vegetation; F13 = Linear extension of functional vegetation. N.E. = Not evaluated.
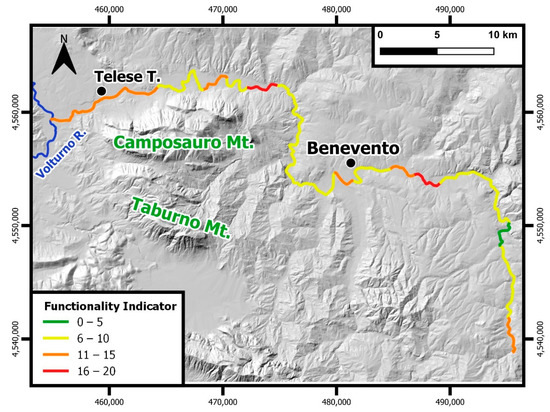
Figure 7.
Spatial distribution of the Functionality indicator. The higher the Functionality indicator value, the higher the functionality disturbance.
The scores assigned to the indicators of Artificiality are shown in Table 12. These indicators assess the presence and frequency of artificial elements or interventions. The higher the scores, the higher the artificiality of the RR. The spatial distribution of the Artificiality indicator is shown in Figure 8. The artificiality is obviously the highest on the RR located in the urban areas of Benevento (RR 4.3.2) and, subordinately, Ponte (RR 6.1.1). Eleven RRs out of 30 show a very low Artificiality Indicator (i.e., <5). The latter are mainly located in the lower Calore River (Figure 8).
Table 12.
Scores assigned to the Artificiality indicators. A1 = Upstream alteration of flows; A2 = Upstream alteration of sediment discharges; A3 = Alteration of flows in the reach; A4 = Alteration of sediment discharge in the reach; A5 = Crossing structures; A6 = Bank protections; A7 = Artificial levees; A8 = Artificial changes of river course; A9 = Other bed stabilization structures; A10 = Sediment removal; A11 = Wood removal; A12 = Vegetation management.
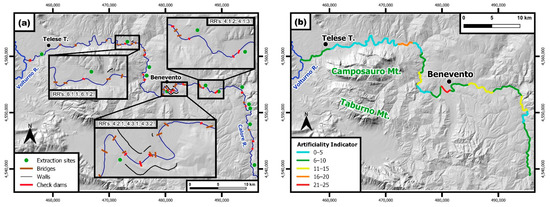
Figure 8.
(a) Spatial distribution of the main anthropogenic features affecting the degree of Artificiality of the Calore River. Inset boxes report enlargements of the mostly anthropized stretches. (b) Distribution of the Artificiality Indicator in the investigated Calore River reaches.
Table 13 shows the scores assigned to the Channel Adjustments indicators, while Figure 9 shows the spatial distribution of the sum of such scores (Stot) in the different RRs. The highest the sum, the highest the channel adjustments experienced by the RR in the period 1955–2014. All the investigated RRs show a very high (i.e., >16) or high (i.e., 11–15) value of Stot. The highest value (i.e., 20) was obtained for RRs 4.2.1 and 6.3.3.
Table 13.
Scores assigned the Channel adjustments indicators. CA1 = Adjustments in channel pattern; CA2 = Adjustments in channel width; CA3 = Bed-level adjustments.
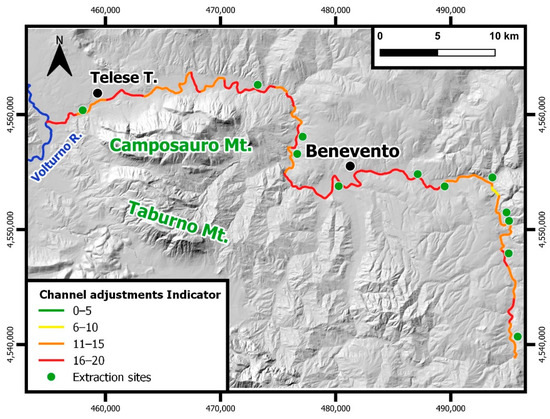
Figure 9.
Distribution of the Channel Adjustments indicators. The locations of the sediment extraction sites are also reported.
The values of the three indicators (i.e., Functionality, Artificiality and Channel Adjustments Indicators) were summed (Stot) and then, divided by the maximum possible deviation for the given stream typology (i.e., by the sum of the highest possible scores—Smax—of all the single indicators of Functionality, Artificiality, and Channel Adjustments reported in Table 11, Table 12 and Table 13). Smax are equal to 54 for Functionality, 72 for Artificiality, and 24 for Channel Adjustments. The ratio Stot/Smax, named Morphological Alteration Index (MAI), was fundamental for the calculation of the Morphological Quality Index, as this latter is complementary to the previous one (i.e., MQI = 1 − MAI).
The MQIs values and classes for all the RRs are reported in Table 14. The latter, according to the classification proposed by Rinaldi et al. [20], resulted to be “Good” (i.e., 0.7 ≤ MQI < 0.85) for 25 RRs out of 30, “moderate” (i.e., 0.5 ≤ MQI < 0.7) for four RRs, and “very good or high” (0.85 ≤ MQI ≤ 1) for one single RR (i.e., RR 3.3.1). The spatial distribution of MQI in the investigated RRs of the Calore River is shown in Figure 10. The weighted average of the MQI values was 0.76 (Table 14). This allowed classifying the morphological quality of the whole Calore River as “good”.
Table 14.
Morphological Quality Index (MQI) for the investigated Calore River reaches.
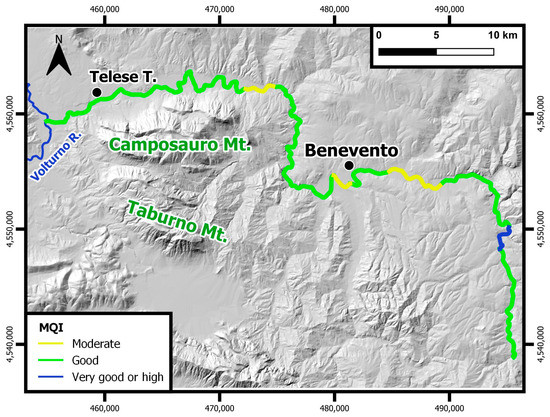
Figure 10.
Distribution of the MQI in the investigated Calore River reaches.
4. Discussion
The observation of the Indicators of Functionality (FI; Table 11), Artificiality (AI; Table 12), and Channel Adjustments (CAI; Table 13) clearly shows that the Calore River is characterized by a negligible overall artificiality (Figure 8b), severe channel adjustments experienced in the time-span 1955–2014 (Figure 9), and moderate functionality (Figure 7).
The negligible overall artificiality is demonstrated by the fact that, according to Rinaldi et al. [20], the highest possible value (Smax) for AI in a given RR is 72. In the case of Calore River, the highest value of the AI is 23/72, which characterizes only one RR out of thirty (i.e., RR 4.3.2; Table 12). In the remaining RRs, the AI is lower than 5/72 in 11 reaches (i.e., 37% of the total number of RR) and lower than 10/72 in 24 RRs out-of-thirty (80%).
In contrast, the Calore River was affected by severe channel adjustments. In fact, according to Rinaldi et al. [20], the CAI Smax is 24. In the case of the Calore River, two RRs display a very high value of such indicator (i.e., 20/24, in both RR 4.2.1 and RR 6.3.3). More generally, 57% of the total number of RRs display a high value (i.e., >17/24) of the CAI. Still more significant is the fact that 97% of the considered RRs display a CAI > 10/24.
As regards the Functionality, the Smax of the associate indicator (FI) is 54 [20]. In the case of the Calore River, the FI highest value is relatively low, i.e., 16/54, which was obtained in two RRs out of thirty, only (i.e., RR 4.1.2 and 6.1.1). Similarly, a very low value of FI (i.e., 5/54) was obtained for one RR only. Thus, most part of the RRs display moderate-low values of FI. More precisely, 63% display FI values ranging from 6/54 to 10/54. Such percent increases to 90% if we consider intermediate FI values ranging between 6/54 and 15/54.
Based on what was stated above, the morphological quality of the Calore River seems to be negligibly affected by the type and intensity of channel adjustments experienced between 1955 and 2014, while a deeper influence is probably exercised by the degree of artificiality of the river. In fact, the morphological quality of the Calore River is generally good (as highlighted by the generally high MQI values; Table 14), notwithstanding the intense or very intense channel adjustments experienced by the Calore River, the latter highlighted by the high values of the CAI (Table 13). In contrast, the good morphological quality (expressed by the high values of the MQI; Table 14) of the Calore River is well reflected in the generally low values of the AI (Table 12), which indicates a reduced artificiality of the river. As regards Functionality, it seems to display an overall moderate influence on the morphological quality of the Calore River, compared to Artificiality. However, the river morphological quality seems to be quite sensitive to variations in Functionality, as proved by the fact that two RRs with relatively lower (i.e., “moderate”) morphological quality (i.e., 4.1.2 and 6.1.1; Table 14) out of four are characterized by the highest values of FI (Table 11), which indicates a relatively more compromised geomorphic functionality.
Among the features controlling the morphological quality of the Calore River, check-dams play a relevant role in altering both the sediment discharge in the reach (see A4 in Table 12) and the longitudinal continuity of sediment and wood solids (see F1 in Table 11). Obviously, check dams are particularly frequent along the RRs that crosses the towns of Benevento (i.e., RR 4.3.2) and Ponte (RR 6.1.1). This concurs to explain why the morphological quality of such RRs is the lowest. The presence of walls and artificial levees (A6 and A7 in Table 12) concurs to reduce the river morphological quality in these RRs too.
Further considerations can also be made about the sediment extraction sites (A10 in Table 12). In fact, in-channel sediment removal is considered one of the main driving forces of channel incision and narrowing [1,10]. In the case of the Calore River, the relationship between in-channel sediment mining and channel adjustments (i.e., narrowing and incision) seems to be proved by the fact that the RR with the highest value of CAI (i.e., RR 4.1.2; Table 13) is limited both upstream and downstream by the two largest sediment extraction sites.
In any case, it should be stressed that the assessment of the morphological quality of the Calore River provided very encouraging results, as the morphological quality resulted “good” (sensu [20]) in most parts of the studied river. The morphological quality slightly decreases to “moderate” in four RRs out of thirty only, i.e., in both the urban RRs and in those RRs with sediment extraction sites. However, generally speaking, in the urban RRs, the morphological quality is often poor or very poor, due to a large number of features (mainly anthropogenic) that increase artificiality and negatively affect functionality. Thus, a “moderate” morphological quality in an urban RR, as in the case of the Calore River, can be considered quite satisfying. Furthermore, the improvement of the morphological quality in urban RRs would require the removal of human infrastructures, such as check dams and walls. Such removal is very difficult to imagine also because such infrastructures are aimed at contrasting the negative or catastrophic effects of floods and riverbed degradation.
As regards the effects of sediment removal, it should be reminded that, in Italy, the sediment removal from the riverbed has been unlawful since the 1990s. The presence of sediment extraction sites remains unquestionably an element that increases the artificiality and, accordingly, decreases the river morphological quality. However, avoiding the sediment removal from the riverbed reduces the impacts on the channel changes, namely on channel incision and narrowing, which, in turn, negatively affect the river morphological quality. Obviously, careful monitoring of sediment removal activities is strongly recommended to avoid unlawful sediment removal from the riverbed that could compromise the river morphological quality. Similarly, any anthropogenic activity that could decrease functionality or increase artificiality (Table 9) should be avoided, if possible, or, alternatively, carefully projected or evaluated, with the aim to preserve the good current morphological quality of the Calore River.
The results obtained in this study are consistent with those provided by other studies that determined the MQI by using the IDRAIM method on Italian rivers [25,26,27,28,30]. In fact, all these studies clearly indicate that Artificiality is the indicator that mainly controls the morphological quality of a river, while channel adjustments play a slightly more marginal role. For example, Rigon et al. [27] found a good or moderate MQI in 86% of the Cordevole River (Northern Italy) and a poor MQI in the remaining 14%, which characterizes the river reaches in which artificial elements are more widespread. Licciardello et al. [30] obtained less encouraging results for the Dittaino River, as 67% of the river showed high and moderate quality, while the remaining 33% showed poor morphological quality in reaches characterized by the presence of elements of artificiality, such as dams and check-dams.
As a general consideration, it should be stressed that the IDRAIM method unquestionably presents advantages and disadvantages. As regards advantages, the method at issue unquestionably takes into account the consideration and understanding of the geomorphological processes responsible for river functioning. Such understanding can be used for both classification and to support analyses of any intervention and impact, and the design of mitigation measures. Furthermore, the IDRAIM method was developed to fully comply with the WFD requirements. The main disadvantages [30] unquestionably consist of the strong degree of subjectivity in the scoring of the indexes, which is affected by the degree of experience and training of the operators. Furthermore, MQI assessment needs to define numerous indicators, which sometimes are not suitable for the hydrological conditions of the rivers located in Southern Italy. This is probably because most of the streams used in the testing phase of the procedure are localized in Central and Northern Italy. In fact, most rivers of Southern Italy, especially the smallest ones, are characterized by irregular water flow and harsh hydrological fluctuations that are not frequent in rivers located in central-northern Italy. However, this is not the case with the Calore River. Thus, the results we obtained in this study can be considered fairly reliable.
5. Conclusions
The present study represents the first attempt to assess the morphological quality of a river located in peninsular Southern Italy, according to the European Water Framework Directive 2000/60/EC (WFD), by using a widely accepted method (i.e., the IDRAIM method). The case study is that of the Calore River and provided encouraging results, as the morphological quality of the investigated river resulted averagely good and mainly controlled by the negligible artificiality of the watercourse. Accurate monitoring of future anthropogenic activities and careful planning of the infrastructures that could compromise the morphological quality are strongly recommended to maintain the current good morphological quality. The obtained results are an indispensable starting point for future studies aimed at assessing the Morphological Dynamics and the Event Dynamics of the Calore River that are fundamental in the framework of flood hazard zoning and hydraulic risk assessment. Such studies have been already planned, as they look fundamental for a river that experienced catastrophic floods (e.g., in 1949 and 2015) that strongly impacted the weak, agriculture-based local economy.
Author Contributions
Conceptualization, P.M.; methodology, P.M.; software, A.C.; validation, P.M. and F.R.; formal analysis, S.S., P.M., M.B., A.C. and A.G.; investigation, S.S.; resources, P.M.; data curation, S.S., A.C. and P.M.; writing—original draft preparation, S.S. and P.M.; writing—review and editing, S.S., P.M., M.B., A.C. and F.R.; visualization, S.S., A.C., M.B., A.G. and P.M.; supervision, P.M. and F.R.; project administration, P.M.; funding acquisition, P.M. All authors have read and agreed to the published version of the manuscript.
Funding
This research was funded by This research was funded by Università degli Studi del Sannio, Fondi per la Ricerca di Ateneo (FRA) 2020 (Resp. Paolo Magliulo).
Data Availability Statement
Data is contained within the article.
Acknowledgments
Authors are grateful to the three anonymous Reviewers, whose comments and suggestions greatly improved the readability and the scientific rigor of the paper.
Conflicts of Interest
The authors declare no conflict of interest. The funder had no role in the design of the study; in the collection, analyses, or interpretation of data; in the writing of the manuscript, or in the decision to publish the results.
References
- Surian, N.; Rinaldi, M. Morphological response to river engineering and management in alluvial channels in Italy. Geomorphology 2003, 50, 307–326. [Google Scholar] [CrossRef]
- Surian, N.; Ziliani, L.; Comiti, F.; Lenzi, M.A.; Mao, L. Channel adjustments and alteration of sediment fluxes in gravel-bed rivers of northeastern Italy: Potentials and limitations for channel recovery. River Res. Appl. 2009, 25, 551–567. [Google Scholar] [CrossRef]
- Surian, N.; Rinaldi, M.; Pellegrini, L.; Audisio, C.; Maraga, F.; Teruggi, L.B.; Turitto, O.; Ziliani, L. Channel adjustments in northern and central Italy over the last 200 years. In Management and Restoration of Fluvial Systems with Broad Historical Changes and Human Impacts: Geological Society of America Special Paper; James, L.A., Rathburn, S.L., Whittecar, G.R., Eds.; Geological Society of America: Boulder, CO, USA, 2009; Volume 451, pp. 83–95. [Google Scholar]
- Scorpio, V.; Aucelli, P.P.C.; Giano, I.; Pisano, L.; Robustelli, G.; Rosskopf, C.M.; Schiattarella, M. River channel adjustment in Southern Italy over the past 150 years and implications for channel recovery. Geomorphology 2015, 251, 77–90. [Google Scholar] [CrossRef]
- Magliulo, P.; Cusano, A.; Giannini, A.; Sessa, S.; Russo, F. Channel Width Variation Phases of the Major Rivers of the Campania Region (Southern Italy) over 150 Years: Preliminary Results. Earth 2021, 2, 374–386. [Google Scholar] [CrossRef]
- Bravard, J.P.; Kondolf, G.M.; Piegay, H. Environmental and societal effects of channel incision and remedial strategies. In Incised River Channels: Processes, Forms, Engineering and Management; Darby, S.E., Simon, A., Eds.; Wiley: Chichester, UK, 1999; pp. 303–341. [Google Scholar]
- Elosegi, A.; Díez, J.; Mutz, M. Effects of hydromorphological integrity on biodiversity and functioning of river ecosystems. Hydrobiologia 2010, 657, 199–215. [Google Scholar] [CrossRef]
- Elosegi, A.; Sabater, S. Effects of hydromorphological impacts on river ecosystem functioning: A review and suggestions for assessing ecological impacts. Hydrobiologia 2013, 712, 129143. [Google Scholar] [CrossRef]
- Kondolf, M.G. Hungry water: Effects of dams and gravel mining on river channels. Environ. Manag. 1997, 21, 533–551. [Google Scholar] [CrossRef]
- Rinaldi, M.; Wyźga, B.; Surian, N. Sediment mining in alluvial channels: Physical effects and management perspectives. River Res. Appl. 2005, 21, 805–828. [Google Scholar] [CrossRef]
- Cooper, S.D.; Lake, P.S.; Sabater, S.; Melack, J.M.; Sabo, J. The effects of land use changes on streams and rivers in Mediterranean climates. Hydrobiologia 2013, 719, 383–425. [Google Scholar] [CrossRef]
- Petts, G.E.; Gurnell, A.M. Dams and geomorphology: Research progress and future directions. Geomorphology 2005, 71, 27–47. [Google Scholar] [CrossRef]
- Hajdukiewicz, H.; Wyżga, B.; Mikuś, P.; Zawiejska, J.; Radecki-Pawlik, A. Impact of a large flood on mountain river habitats, channel morphology, and valley infrastructure. Geomorphology 2016, 272, 55–67. [Google Scholar] [CrossRef]
- Rădoane, M.; Obreja, F.; Cristea, I.; Mihailă, D. Changes in the channel-bed level of the eastern Carpathian rivers: Climatic vs. human control over the last 50 years. Geomorphology 2013, 193, 91–111. [Google Scholar] [CrossRef]
- Magliulo, P.; Bozzi, F.; Leone, G.; Fiorillo, F.; Leone, N.; Russo, F.; Valente, A. Channel adjustments over 140 years in response to extreme floods and land-use change, Tammaro River, Nouthern Italy. Geomorphology 2021, 383, 18. [Google Scholar] [CrossRef]
- Golfieri, B.; Surian, N.; Hardersen, S.; Maiolini, B. Assessment of morphological and ecological conditions of Italian alpine rivers using the Morphological Quality Index (IQM) and Odonata. In Proceedings of the IS Rivers 2012-Integrative Sciences and Sustainable Development of Rivers, Lyon, France, 26–28 June 2012. [Google Scholar]
- Rinaldi, M.; Surian, N.; Comiti, F.; Bussettini, M. Sistema di Valutazione Morfologica dei corsi d’acqua—Manuale tecnico-operativo per la valutazione ed il monitoraggio dello stato morfologico dei corsi d’acqua-Versione 0. In Istituto Superiore per la Protezione e la Ricerca Ambientale; ISPRA: Roma, Italy, 2010; p. 191. ISBN 978-88-448-0438-1. [Google Scholar]
- Rinaldi, M.; Surian, N.; Comiti, F.; Bussettini, M. Guidebook for the Evaluation of Stream Morphological Conditions by the Morphological Quality Index (MQI); Istituto Superiore per la Protezione e la Ricerca Ambientale: Roma, Italy, 2012; p. 90.
- Rinaldi, M.; Surian, N.; Comiti, F.; Bussettini, M. A methodological framework for hydromorphological assessment, analysis and monitoring (IDRAIM) aimed at promoting integrated river management. Geomorphology 2015, 251, 122–136. [Google Scholar] [CrossRef]
- Rinaldi, M.; Surian, N.; Comiti, F.; Bussettini, M. IDRAIM—Sistema di Valutazione Idromorfologica, Analisi e Monitoraggio dei Corsi d’acqua—Versione Aggiornata 2016; ISPRA: Roma, Italy, 2016.
- European Commission. Directive 2007/60/EC of the European Parliament and of the Council of 23 October 2007 on the Assessment and Management of Flood Risks. In Official Journal; European Commission: Brussels, Belgium, 2007; p. 8. [Google Scholar]
- Ministero dell’Ambiente, della Tutela del Territorio e del Mare (MATTM). Regolamento Recante i Criteri Tecnici per la Classificazione dello stato dei Corpi Idrici Superficiali, per la Modifica delle Norme Tecniche del Decreto Legislativo 3 Aprile 2006, n. 152. Decreto 8 Novembre 2010, n. 260, Supplemento Ordinario alla Gazzetta Ufficiale n. 30 del 7 Febbraio 2011. Available online: https://www.gazzettaufficiale.it/eli/id/2011/02/07/011G0035/sg (accessed on 28 May 2022).
- Brierley, G.J.; Fryirs, K.A. Geomorphology and River Management: Applications of the River Style Framework; Blackwell: Oxford, UK, 2005. [Google Scholar]
- Palmer, M.A.; Bernhardt, E.S.; Allan, J.D.; Lake, P.S.; Alexander, G.; Brooks, S.; Carr, J.; Clayton, S.; Dahm, C.N.; Shah, J.F.; et al. Standard for ecologically successful river restoration. J. Appl. Ecol. 2005, 42, 208–217. [Google Scholar] [CrossRef]
- Cencetti, C.; De Rosa, P.; Fredduzzi, A. L’indice di qualità morfologica (IQM) dei corsi d’acqua: Applicazione del metodo di valutazione al F. Chiani (Italia centrale). In Proceedings of the Atti 14 Conferenza Nazionale ASITA, Brescia, Italy, 9–12 November 2010; pp. 553–559. [Google Scholar]
- Vangelista, M. Application of the Morphological Quality Index (IQM) in Two Reaches of the Adige River. Diploma Thesis, University of Padova, Padua, Italy, 2011. [Google Scholar]
- Rigon, E.; Moretto, J.; Rainato, R.; Lenzi, M.A.; Zorzi, A. Evaluation of the morphological quality index in the Cordevole River (Bl, Italy). J. Agric. Eng. 2013, 44, e15. [Google Scholar] [CrossRef][Green Version]
- Loreggian, M. Applicazione Dell’indice di Qualità Morfologica (IQM) a Tredici Tratti dei Torrenti Fiorentina e Cordevole; Relatore Lenzi, M.A., Correlatore Rigon, E., Eds.; Dipartimento Territorio e Sistemi Agro-forestali, Facoltà di Agraria, Università degli Studi di Padova: Legnaro, Italy, 2013. [Google Scholar]
- Müller, H.; Hörbinger, S.; Franta, F.; Mendes, A.; Li, J.; Cao, P.; Baoligao, B.; Xu, F.; Rauch, H.P. Hydromorphological Assessment as the Basis for Ecosystem Restoration in the Nanxi River Basin (China). Land 2022, 11, 193. [Google Scholar] [CrossRef]
- Licciardello, F.; Barbagallo, S.; Muratore, S.M.; Toscano, A.; Giuffrida, E.R.; Cirelli, G.L. Hydro-Morphological Assessment of Dittaino River, Eastern Sicily, Italy. Water 2021, 13, 2499. [Google Scholar] [CrossRef]
- Magliulo, P.; Valente, A.; Cartojan, E. Recent morphological changes of the middle and lower Calore River (Campania, Southern Italy). Environ. Earth Sci. 2013, 70, 2785–2805. [Google Scholar] [CrossRef]
- de Musso, N.M.; Capolongo, D.; Caldara, M.; Surian, N.; Pennetta, L. Channel Changes and Controlling Factors over the Past 150 Years in the Basento River (Southern Italy). Water 2020, 12, 307. [Google Scholar] [CrossRef]
- Valente, A.; Iscaro, C.; Magliulo, P.; Russo, F. The 14–15 October 2015 flooding in Benevento: A short report. Rend Online Soc. Geol. It. 2016, 38, 105–108. [Google Scholar] [CrossRef]
- Guerriero, L.; Focareta, M.; Fusco, G.; Rabuano, R.; Guadagno, F.M.; Revellino, P. Flood hazard of major river segments, Benevento Province, Southern Italy. J. Maps 2018, 14, 597–606. [Google Scholar] [CrossRef]
- Patacca, E.; Scandone, P. Geology of the Southern Apennines. Boll. Soc. Geol. It. 2007, 7, 75–119. [Google Scholar]
- Magliulo, P.; Cusano, A. Geomorphology of the Lower Calore River alluvial plain (Southern Italy). J. Maps 2016, 12, 1119–1127. [Google Scholar] [CrossRef]
- Magliulo, P.; Russo, F.; Valente, A. Tectonic significance of geomorphological features in the Telesina Valley (Campanian Apennines). Boll. Soc. Geol. Ital. 2007, 126, 397–409. [Google Scholar]
- Magliulo, P. Quaternary deposits and geomorphological evolution of the Telesina Valley (Southern Apennines). Geogr. Fis Dinam. Quat. 2005, 28, 125–146. [Google Scholar]
- Guadagno, F.M.; Bencardino, M.; Grelle, G.; Lupo, G.; Rivellini, G.; Focareta, M.; Revellino, P. La Carta delle Frane della Provincia di Benevento; Sannio University Press: Benevento, Italy, 2006. [Google Scholar]
- Cartojan, E.; Magliulo, P.; Massa, B.; Valente, A. Morphotectonic features of the Tammaro River basin, Southern Apennines, Italy. Rend. Lincei 2014, 25, 217–229. [Google Scholar] [CrossRef]
- Ciarcia, S.; Magliulo, P.; Russo, F.; Valente, A. Osservazioni geologiche e geomorfologiche preliminari sul bacino pleistocenico intermontano di Benevento (Appennino Campano). In Evoluzione Geomorfologica di Lungo Termine del Paesaggio nell’Italia Meridionale: Il Contributo Delle Università Locali; Rosskopf, C.M., Aucelli, P.P.C., Eds.; Università degli Studi del Molise, Associazione Italiana di Geografia Fisica e Geomorfologia (AIGeo) Edition; Arti Grafiche la Regione: Ripalimosani, Italy, 2014; pp. 125–141. [Google Scholar]
- Magliulo, P.; Cusano, A.; Sessa, S.; Beatrice, M.; Russo, F. Multidecadal land-use changes and implications on soil protection in the Calore River Basin landscape (Southern Italy). Geosciences 2022, 12, 156. [Google Scholar] [CrossRef]
- Valente, A.; Magliulo, P. Short-term channel adjustments in an anthropized stretch of the Calore River (Southern Italy). In International Association of Geomorphologists (IAG). 8th International Conference (AIG) on Geomorphology—Abstracts Volume; IAG: Paris, France, 2013; p. 697. ISBN 978-987-1323-21-0. [Google Scholar]
- Tarquini, S.; Isola, I.; Favalli, M.; Battistini, A. TINITALY, a Digital Elevation Model of Italy with a 10 m-Cell Size (Version 1.0). Istituto Nazionale di Geofisica e Vulcanologia (INGV). 2007. Available online: https://data.ingv.it/dataset/185#additional-metadata (accessed on 17 May 2022). [CrossRef]
- Bergomi, C.; Jacobacci, A.; Martelli, G.; Manfredini, M. Carta Geologica d’Italia—Foglio 173 “Benevento”. Scala 1:100,000; Servizio Geologico d’Italia: Roma, Italy, 1970.
- Jacobacci, A.; Martelli, G. Carta Geologica d’Italia—Foglio 174 “Ariano Irpino”. Scala 1:100,000; Servizio Geologico d’Italia: Roma, Italy, 1967.
- Manfredini, M.; Catenacci, V.; Cestari, G.; Pannuzi, L.; Zattini, N.; Malferrari, N.; Brugner, W.; Valdinucci, A. Carta Geologica d’Italia—Foglio 162 “Campobasso”. Scala 1:100,000; Servizio Geologico d’Italia: Roma, Italy, 1970.
- Guzzetta, G.; Letto, A.; Sgrosso, L.; Scarsella, F.; Dragone, F.; Segre, A.G. Carta Geologica d’Italia—Foglio 185 “Salerno”. Scala 1:100,000; Servizio Geologico d’Italia: Roma, Italy, 1969.
- Chiocchini, U.; Brogini, F.; Chino, A.; Redini, R.; Barella, A.; Geronzi, A.; Jacobacci, A. Carta Geologica d’Italia—Foglio 186 “S. Angelo de’ Lombardi”. Scala 1:100,000; Servizio Geologico d’Italia: Roma, Italy, 1970.
- Surian, N.; Rinaldi, M.; Pellegrini, L. Linee Guida per L’analisi Geomorfologica Degli Alvei Fluviali e Delle Loro Tendenze Evolutive; Cleup: Padova, Italy, 2009; p. 79. [Google Scholar]
- Schumm, S.A. A tentative classification of fluvial river channels. In US Geological Survey Circular; US Geological Survey: Washington, DC, USA, 1963; Volume 477. [Google Scholar]
- Rinaldi, M. Recent channel adjustments in alluvial rivers of Tuscany, Central Italy. Earth Surf. Processes Landf. 2003, 28, 587–608. [Google Scholar] [CrossRef]
- ISPRA. Available online: https://www.isprambiente.gov.it/it/pubblicazioni/manuali-e-linee-guida/idraim-sistema-di-valutazione-idromorfologica-analisi-e-monitoraggio-dei-corsi-dacqua (accessed on 18 May 2022).


Publisher’s Note: MDPI stays neutral with regard to jurisdictional claims in published maps and institutional affiliations. |
© 2022 by the authors. Licensee MDPI, Basel, Switzerland. This article is an open access article distributed under the terms and conditions of the Creative Commons Attribution (CC BY) license (https://creativecommons.org/licenses/by/4.0/).