Article

Comparing Pressure, Force, and Contact Area over the Projected Median Nerve Region Across Cycling Glove Conditions: A Pilot Study

1
Padnos College of Engineering, Grand Valley State University, 301 West Fulton 301 West Fulton Street, Grand Rapids, MI 49504, USA
2
College of Health Professions, Grand Valley State University, 500 Lafayette NE, Grand Rapids, MI 49503, USA
*
Author to whom correspondence should be addressed.
Biomechanics 2026, 6(3), 77; https://doi.org/10.3390/biomechanics6030077
Submission received: 3 April 2026 / Revised: 16 August 2026 / Accepted: 18 August 2026 / Published: 26 August 2026
(This article belongs to the Section Injury Biomechanics and Rehabilitation)

Abstract

Background/Objectives: Carpal tunnel syndrome (CTS) is a prevalent neuropathy often associated with repetitive wrist movements, sustained wrist postures, and external compression. Although cycling offers numerous health benefits, prolonged handlebar contact may contribute to hand/wrist discomfort and cycling-related neuropathies. As a pilot study, the aim of this work was intended to (1) evaluate the feasibility of using pressure mapping to quantify glove-related pressure redistribution during cycling; (2) identify key confounding variables requiring improved control in future studies, including comfort/discomfort, posture, cycling experience, hand position, and anthropometric variability; and (3) provide preliminary estimates of pressure variability and effect magnitude between bare hands, conventional biking gloves, and Shock·Tek™ gloves to inform a larger confirmatory study. Methods: Thirteen right-handed adults were tested during low-intensity cycling using a stationary bike equipped with a pliance®-x pressure sensor wrapped around the handlebar under three conditions: no gloves, traditional padded gloves, and Shock·Tek™ gloves. Results: This exploratory pilot study (1) demonstrated the feasibility of using pressure mapping, (2) identified confounding variables, and (3) showed that while traditional gloves did not significantly reduce surface pressure in the projected median nerve region as we hypothesized, the Shock·Tek™ gloves yielded a 61% reduction in pressure (mean: 20.23 kPa vs. 51.96 kPa with no gloves). Conclusions: These preliminary findings suggest that glove design can influence surface pressure distribution over the projected median nerve region at the hand–glove–handlebar interface during short-duration stationary cycling.

1. Introduction

Carpal tunnel syndrome (CTS) is a compressive neuropathy of the median nerve as it passes through the carpal tunnel in the wrist, impacting motor and sensory function [1]. CTS is commonly linked to repetitive wrist motions, sustained flexion/extension, and external compression [2,3,4,5]. While much research focuses on occupational causes, recent studies implicate cycling due to prolonged pressure at the wrist and hand [6,7,8,9]. Additional recent studies have explored the effects of direct palmar pressure, measured by a pressure mat, on the ulnar nerve [10,11].
Though traditionally associated with ulnar nerve symptoms [12,13,14], case studies have identified cycling-induced median nerve compression [14,15,16]. Cycling gloves are designed to reduce shock and distribute load, yet few studies have evaluated their efficacy in reducing median nerve pressure.
While most means of measuring intra-carpal tunnel pressure are invasive, studies [4,17] have shown a direct link between externally applied palmar pressure and increased intra-carpal pressure. This direct link, at a minimum, allows situational comparison of different loading conditions and interventions via measurement of palmar pressure.
Additionally, Lundborg [18] showed a threshold at which intracarpal pressure causes median nerve fiber viability. This clearly links, in a two-step process, damage of the median nerve to palmar pressure.
Prior studies have shown that palmar pressure is directly linked to intra-carpal pressure [4,10,11,17], thereby allowing measurement of palmar pressure as a means of comparison between similar activities. Pressure mats have effectively been used to measure palmar pressure. The rationale for this study is that while studies have been conducted showing the specific effects of various gloves on ulnar nerve compression, none have specifically targeted the effect of gloves on median nerve pressure. As a pilot study, the aim of this work was intended to (1) evaluate the feasibility of using pressure mapping (novel.de, Munich, Germany) to quantify glove-related pressure redistribution during cycling; (2) identify key confounding variables requiring improved control in future studies, including comfort/discomfort, posture, cycling experience, hand position, and anthropometric variability; and (3) provide preliminary estimates of pressure variability and effect magnitude between bare hands, conventional biking gloves, (Luxobike, France), and Shock·Tek™ gloves (https://www.shocktek.com, MI, USA) to inform a larger confirmatory study.
We hypothesized that the Shock·Tek™ gloves would reduce surface pressure over the projected median nerve region compared with the other conditions.

2. Materials and Methods

2.1. Participant Screening

Participation in this study required individuals to be in good medical and physical health. Eligibility was ascertained through a comprehensive self-assessment, with inclusion criteria stipulating that participants had to be (1) aged between 18 and 65, (2) right-hand dominant, and (3) capable of engaging in low-intensity biking for a minimum of 20 min.
The exclusion criteria encompassed individuals who (1) wore size-small gloves, (2) had received a prior diagnosis of CTS from a registered physician, (3) experienced musculoskeletal injuries/impairments in the upper or lower extremities necessitating medical treatment within the last 12 months, (4) sustained a previous traumatic biking injury, (5) were currently pregnant, or (6) could not perform the specified floor-to-standing maneuver autonomously. Participants self-identified their eligibility based on the predefined inclusion criteria, as explicitly outlined in the informed consent form, as detailed in Supplementary S1. Prior to data collection, participants underwent a brief interview about their medical health history and age. The questionnaire is presented in Supplementary S2. Subsequently, physical assessments were conducted, including measurements for weight, height, and extremity length, as defined in Supplementary S3. The data for all subjects in summarized in Supplementary S4. Hand circumference was precisely measured to determine the appropriate glove size, adhering to the manufacturer’s recommendation for Glove B. Throughout the data collection process for each participant, specific individual characteristics were documented using the data collection sheet outlined in Supplementary S5.

2.2. Experimental Setup

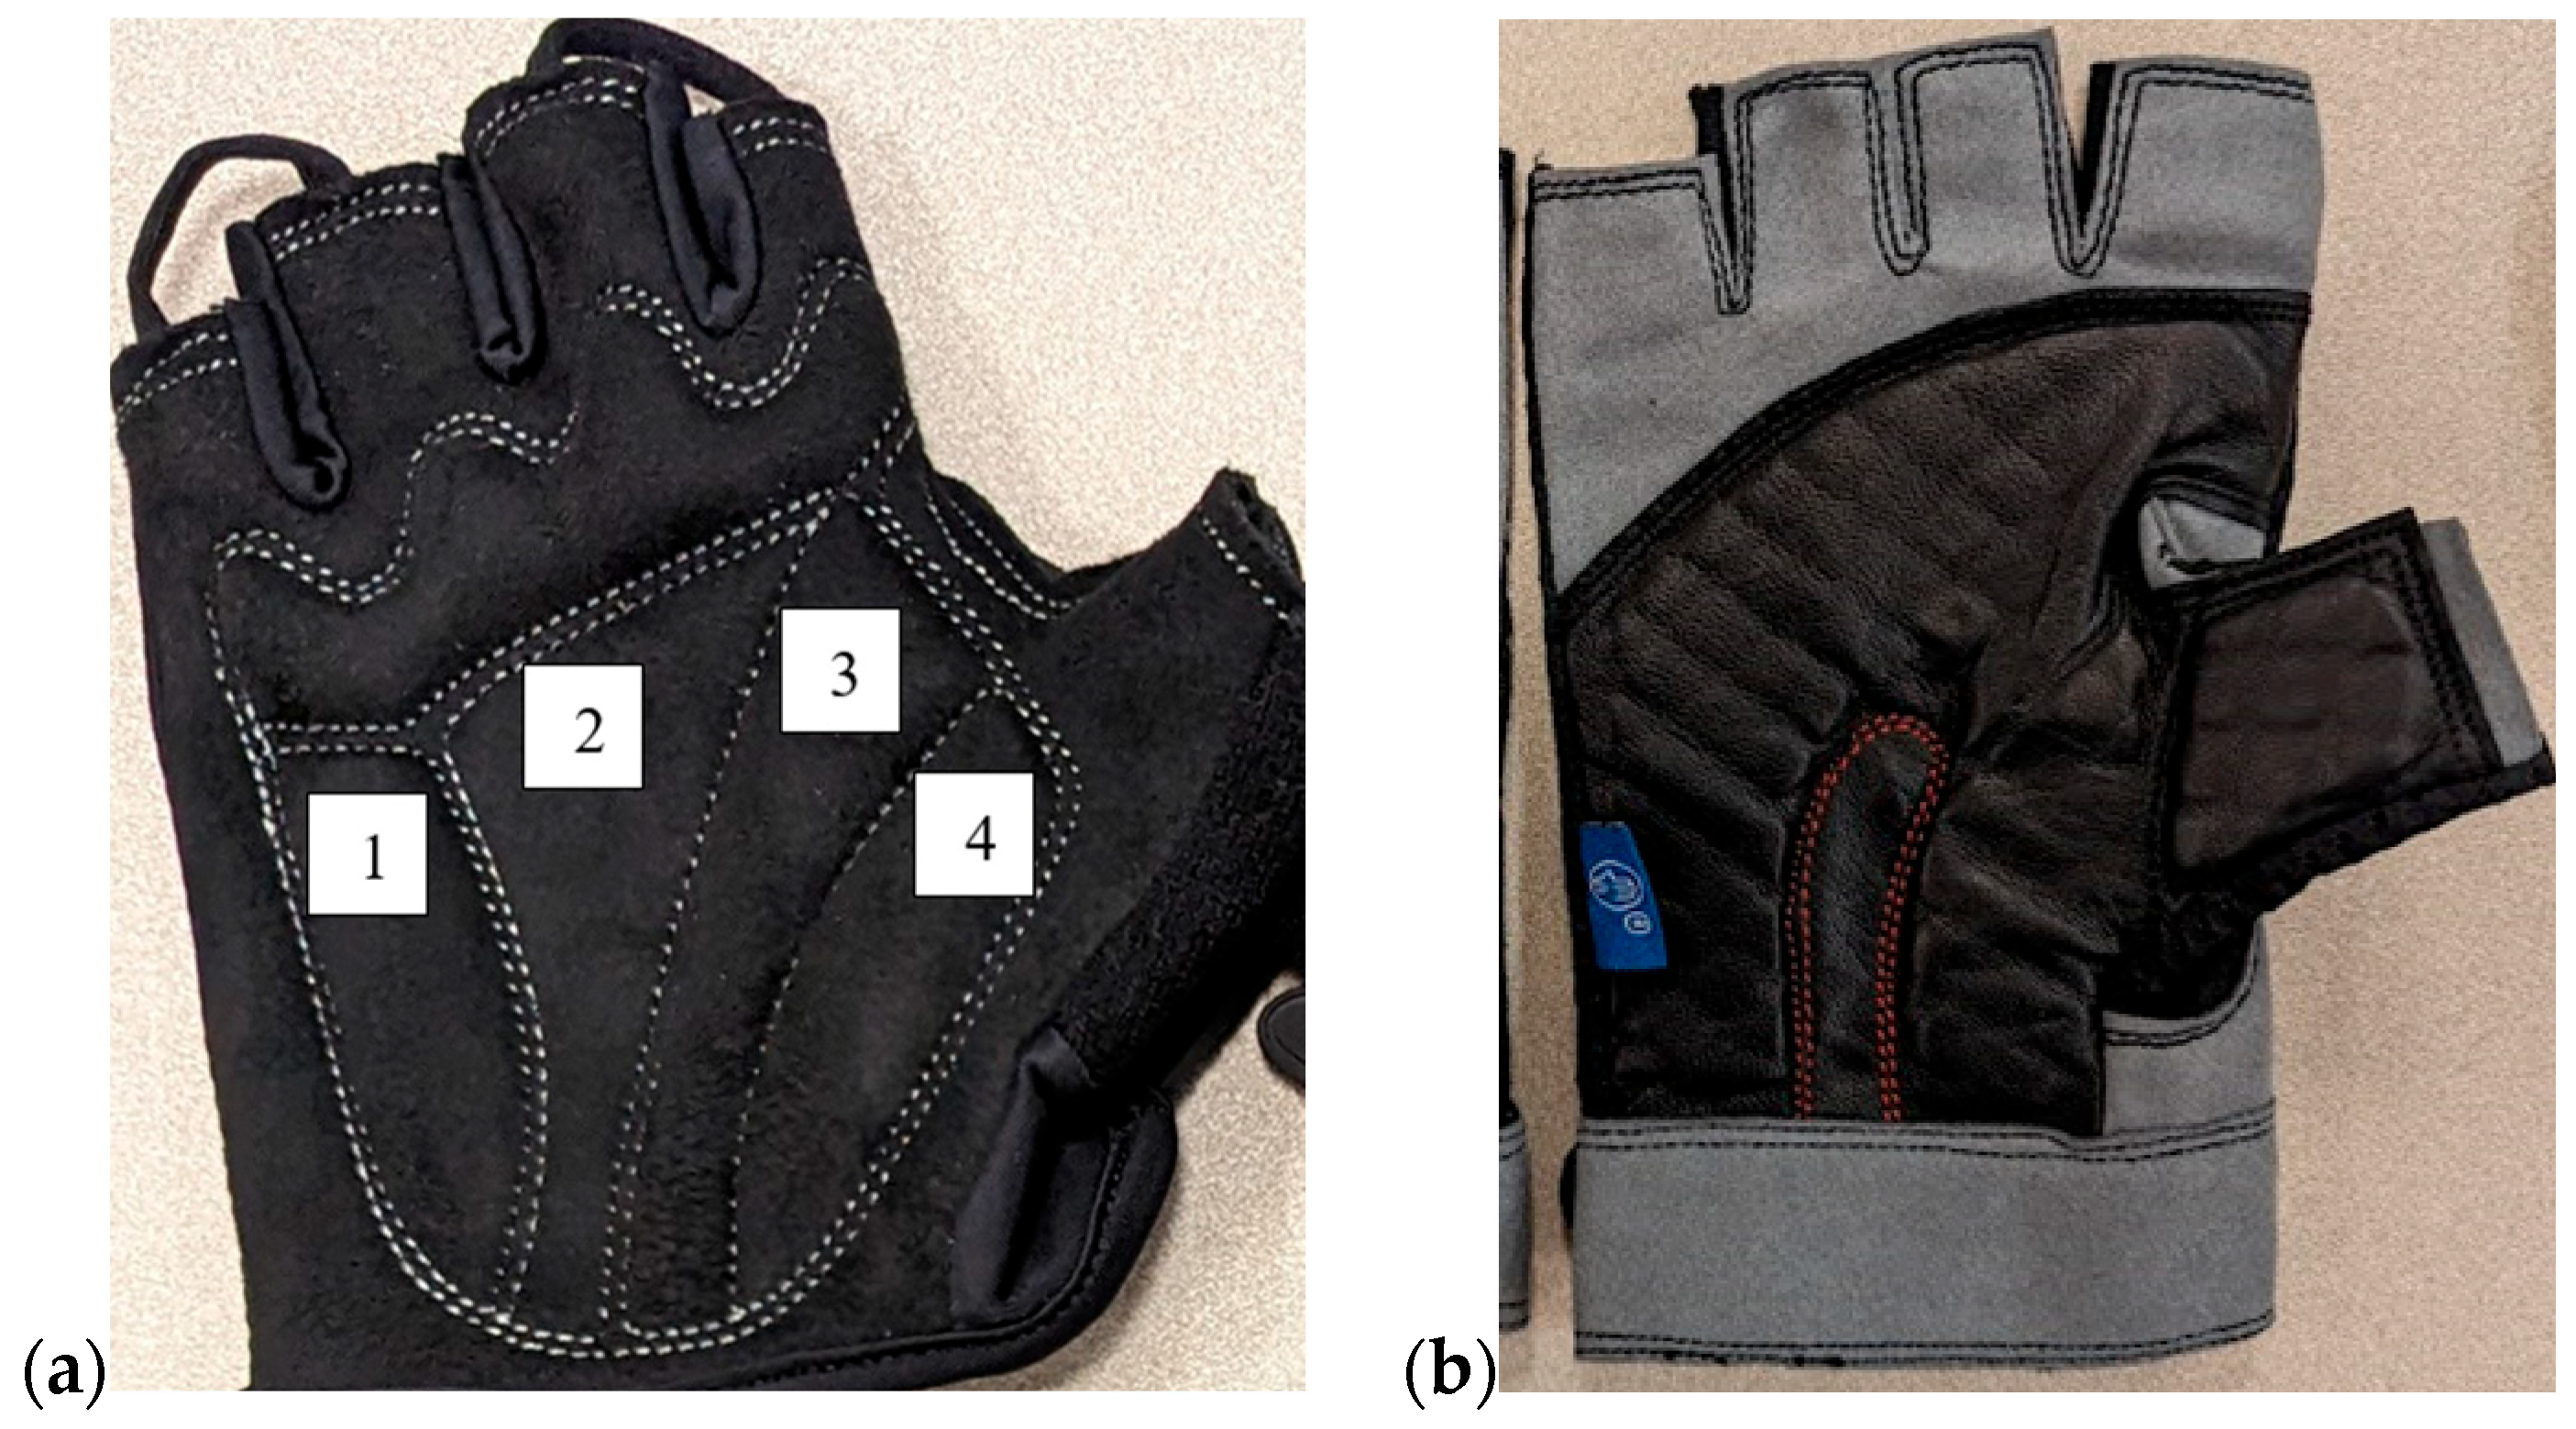
Thirteen participants who met the criteria in Section 2.1 were recruited. Anatomical data regarding these individuals are available in Supplementary S5. Three glove conditions (gloves shown below in Figure 1) were tested: Condition A: bare hands; Condition B: traditional padded gloves (LuxoBike half-finger biking gloves) (Glove A)Biomechanics 06 00077 i001; and Condition C: Shock·Tek™ gloves (Glove B).
A pliance-x® elastisens (ES-90-150/60-10) pressure sensor was used to capture the pressure data at the hand–glove–handlebar interface. The sensor was a 150 mm by 60 mm flexible rectangular array pressure sensor with a pressure range of 10–600 kPa. Each square in the array measured 7.07 mm in both dimensions. Each sensor in the array was a flexible capacitive sensor that provided input due to the pressure applied by an external force when placed against a rigid body (novel® USA, Pittsburgh, PA, USA). To capture and read the data, a wireless Bluetooth connection box was used to connect the sensor to a computer with a range of up to 100 m. The sensor was calibrated using the trublu® calibration device before testing to a maximum of 4 bar (400 kPa). The calibration line showed some inflation in the middle-pressure region, causing the graph to have a slightly non-linear curve. Since the pressures in this study were less than 160 kPa, this did not affect the results. The sensor sampling frequency was set to 20,000 Hz.
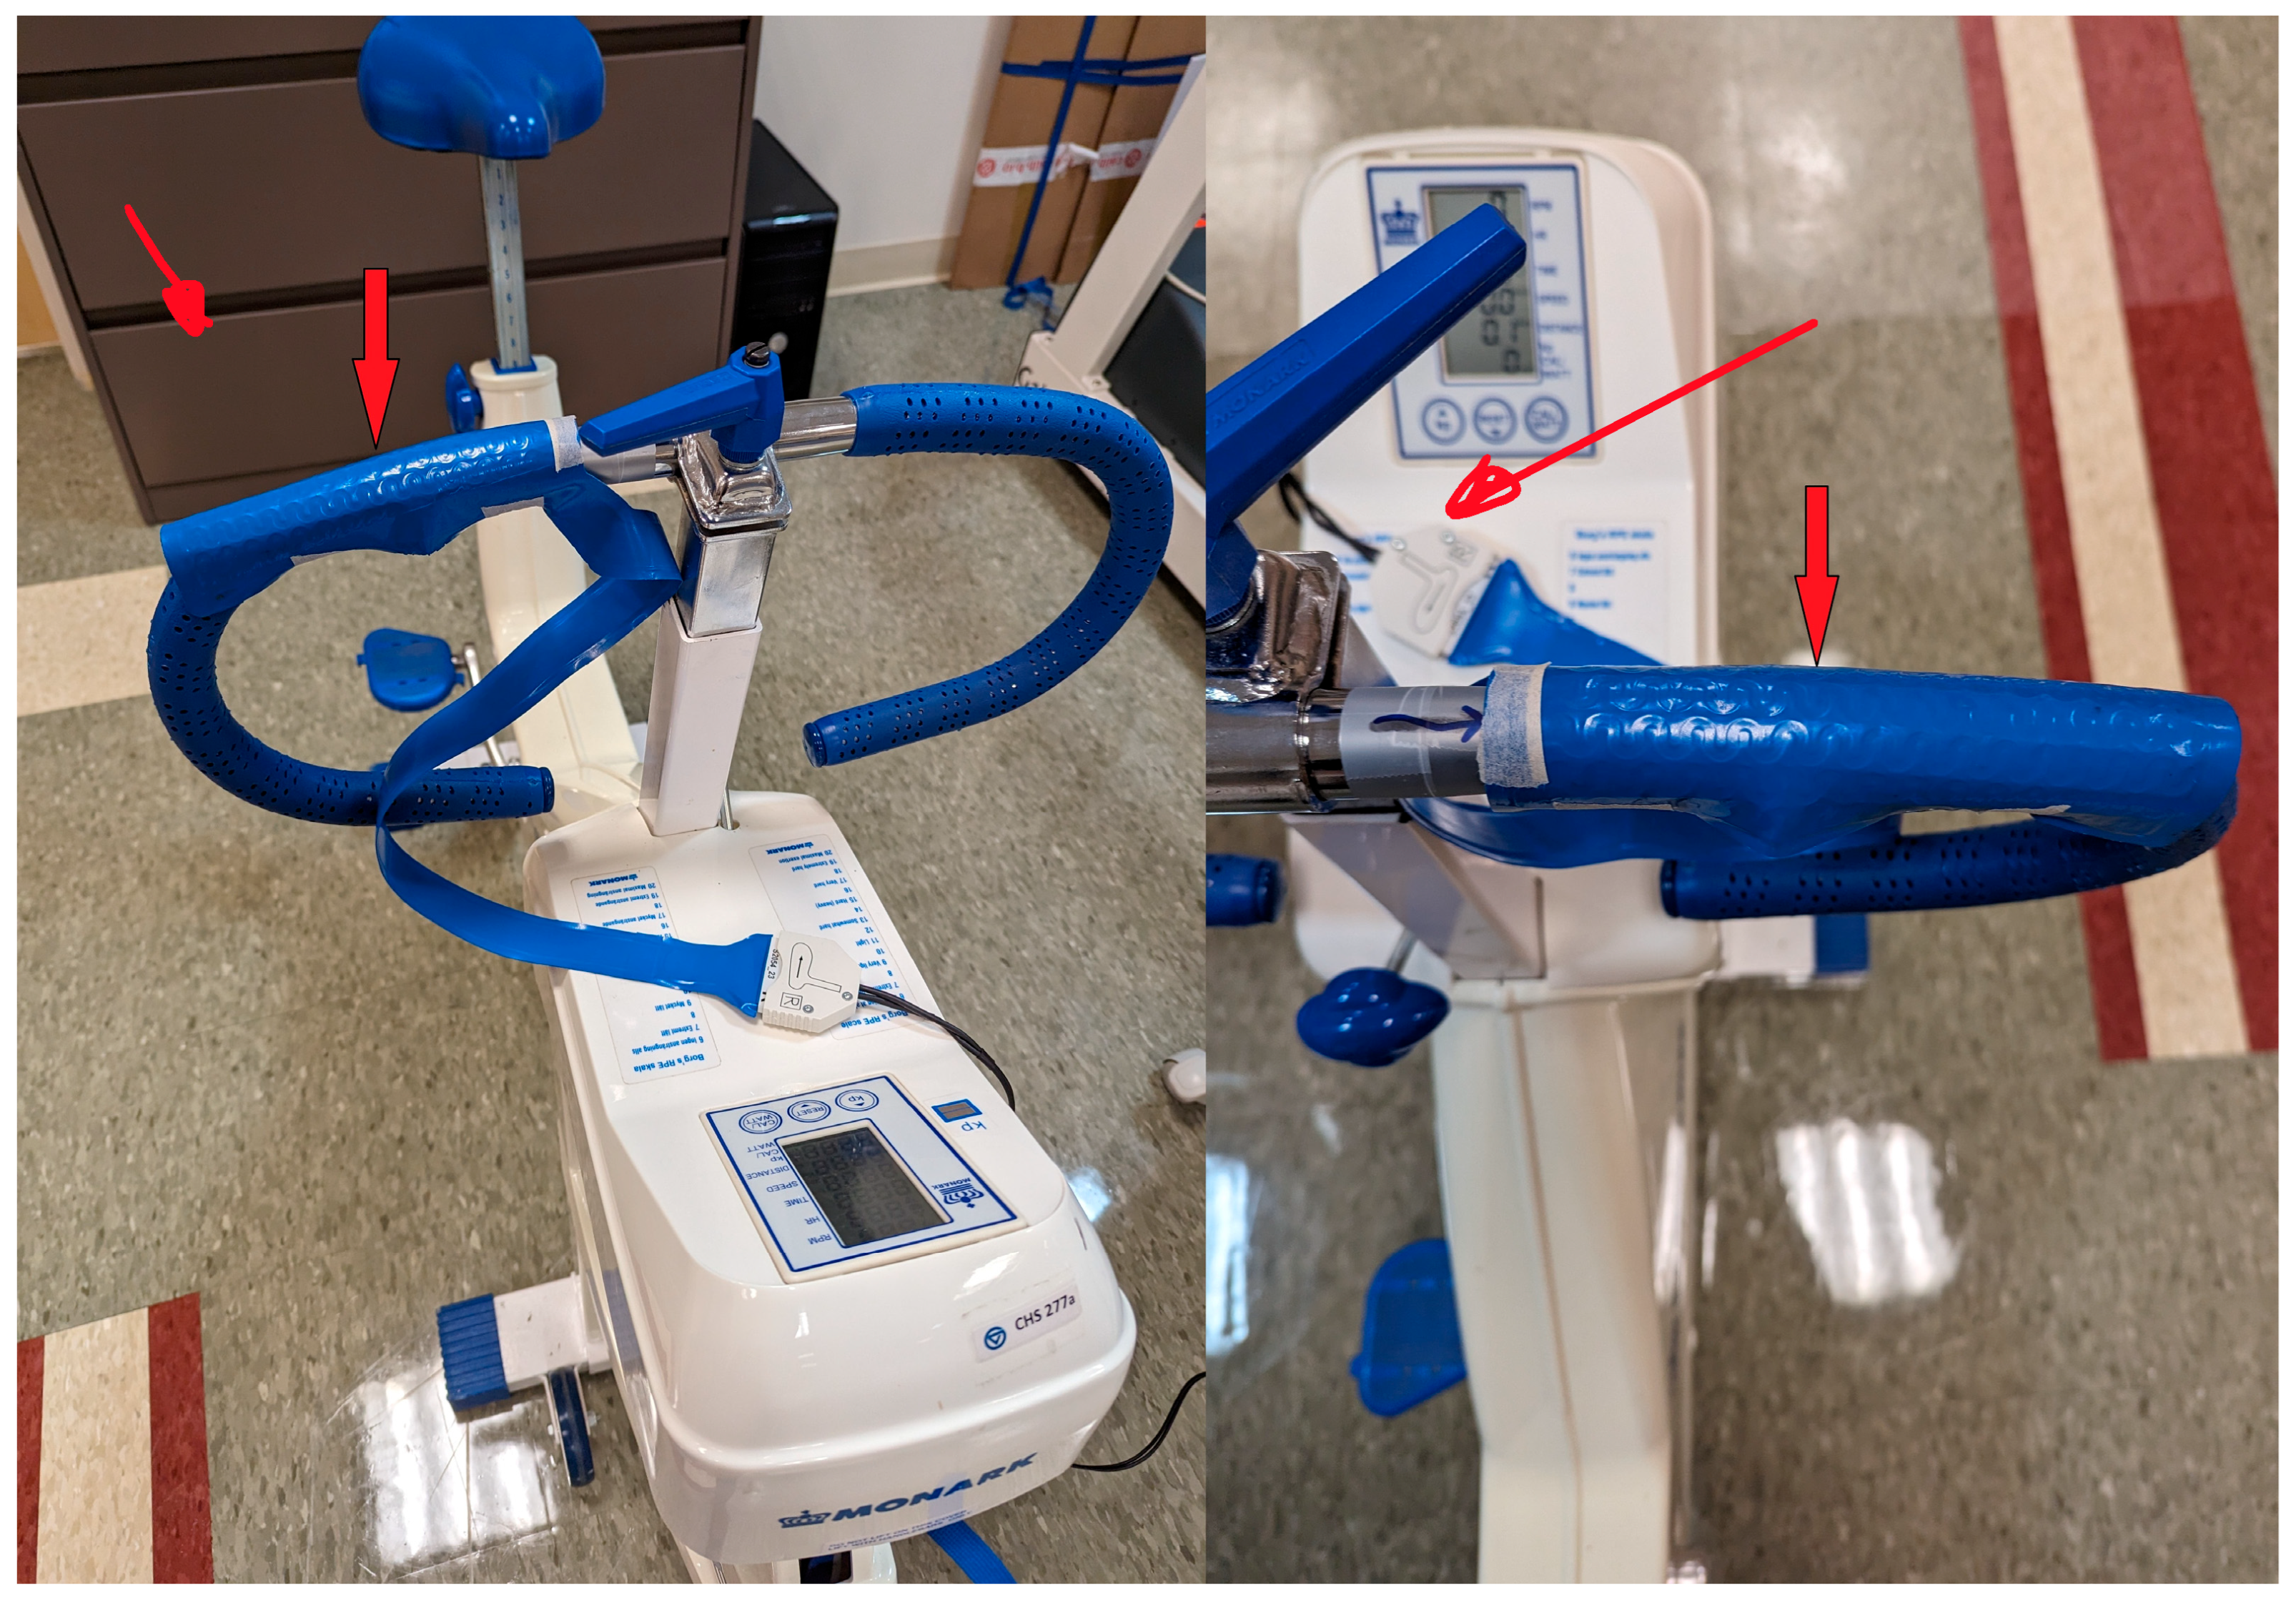
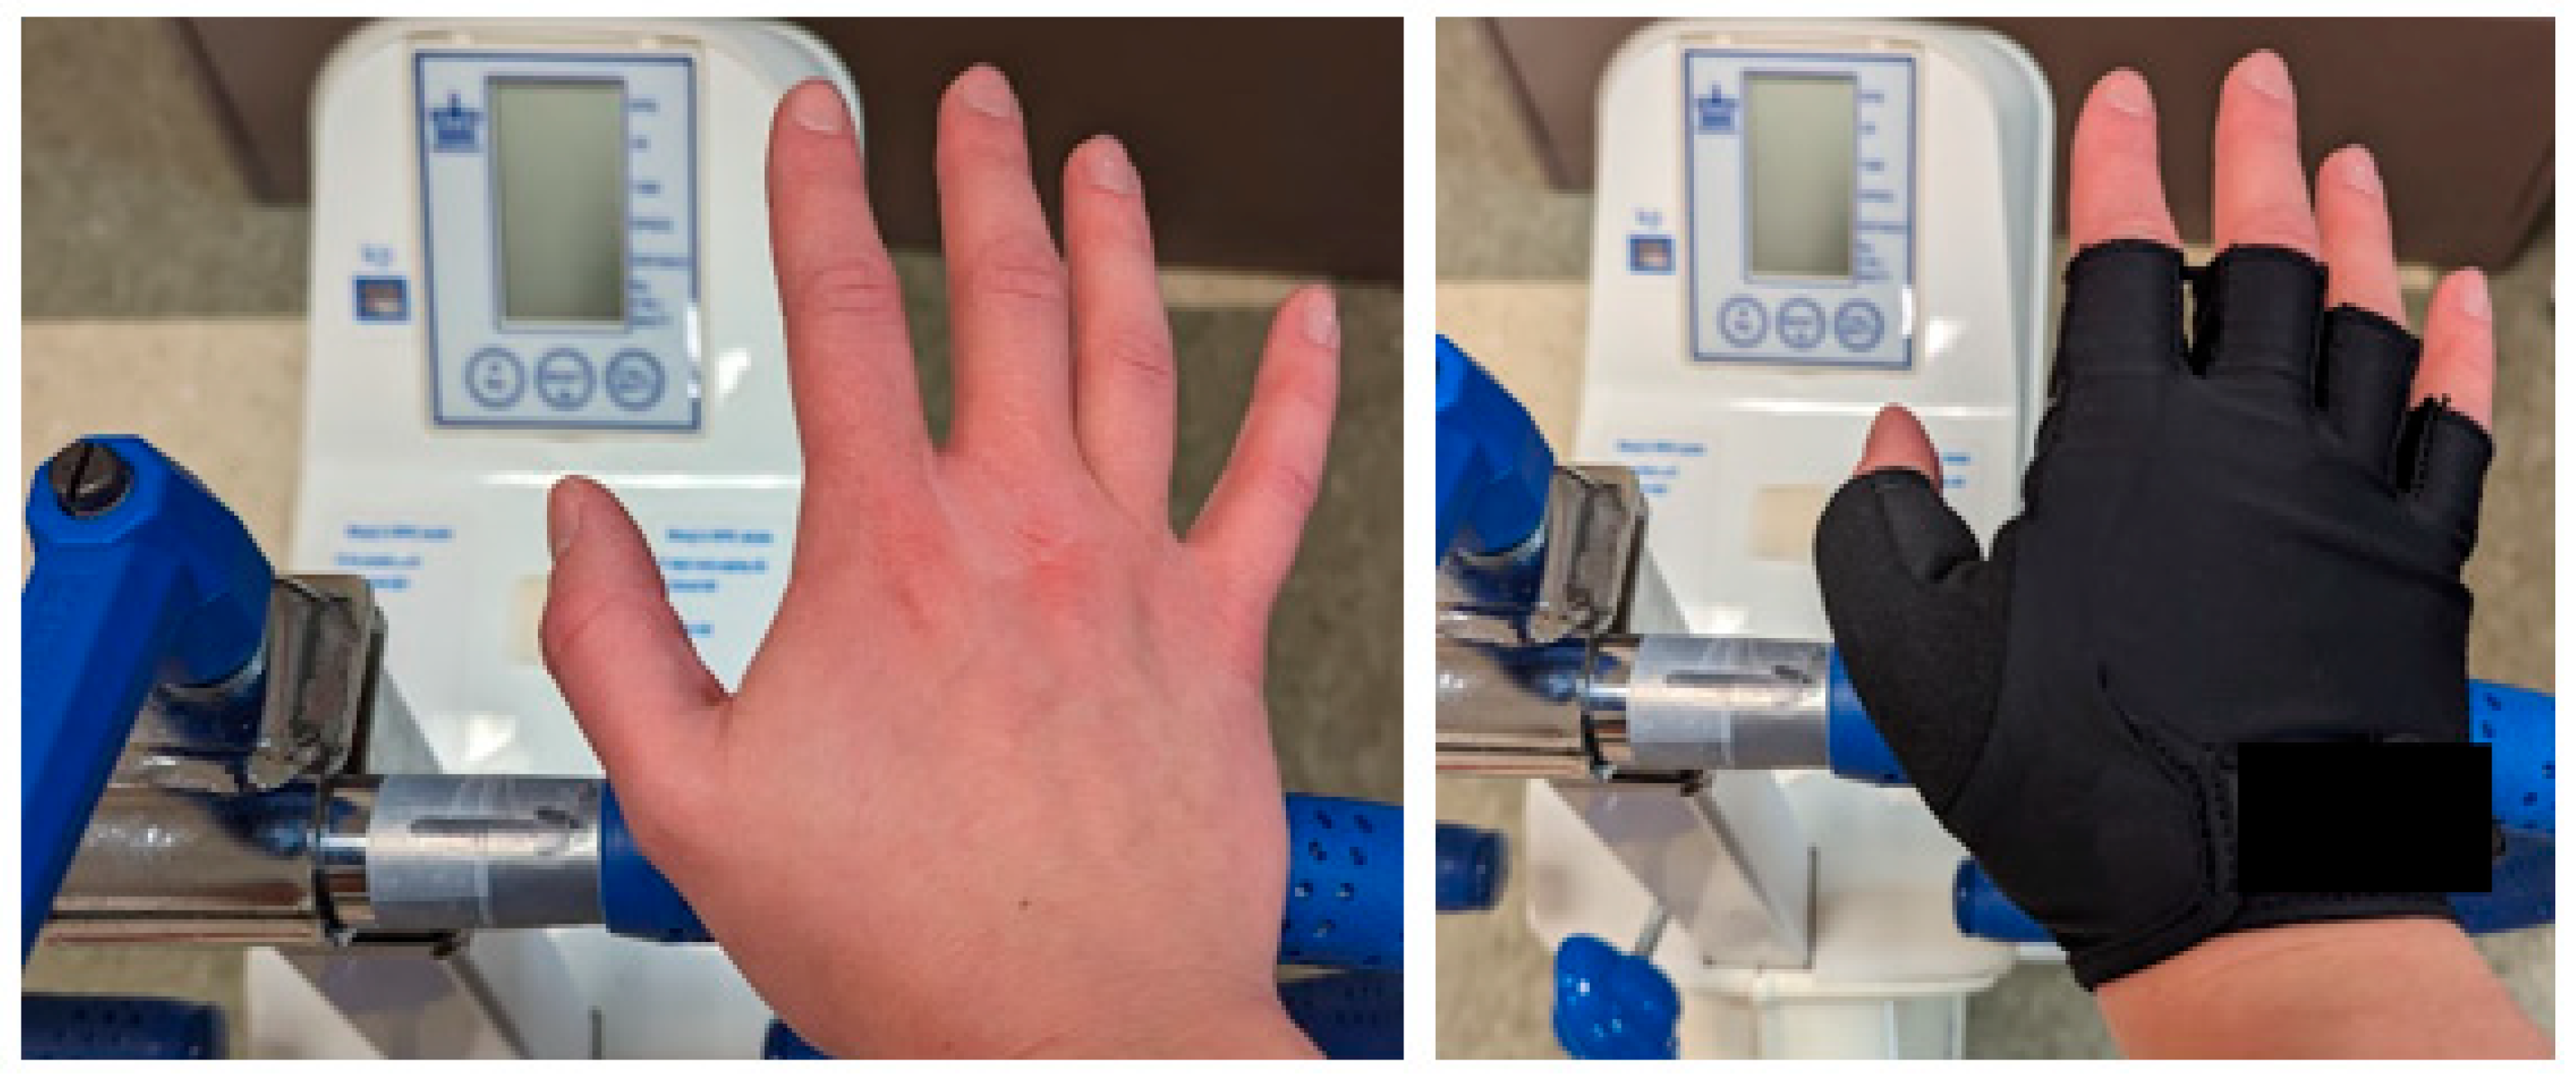
The pliance-x® sensor was affixed and fastened securely around the right side of the handlebar seen in Figure 2. The seating configuration of the cycling device was initially adjusted to each subject’s determined comfortable seat height. This choice was based on preliminary testing that showed that rider comfort influenced the consistency of palmar pressure. Subsequently, the center of the handlebar was aligned with the seat surface. Seat and handlebar height were recorded. Once positioned on the bicycle, subjects were instructed to align the metacarpophalangeal joint of their dominant hand’s thumb with a designated mark on the sensor demonstrated in Figure 3. The center of the palm was then marked on the sensor. During the ride, participants were given latitude to flex or extend their other digits; nonetheless, it was crucial to uphold the positioning of the thumb’s metacarpophalangeal and, proximally, the carpometacarpal (CMC) joint on the designated sensor mark. Given that alignment was contingent upon the joint, participants were permitted to move the distal thumb (interphalangeal joint) as they deemed comfortable without moving the palm of the hand. Following these adjustments, subjects engaged in a three-minute warm-up period, maintaining a cadence of 40 revolutions per minute (rpms).
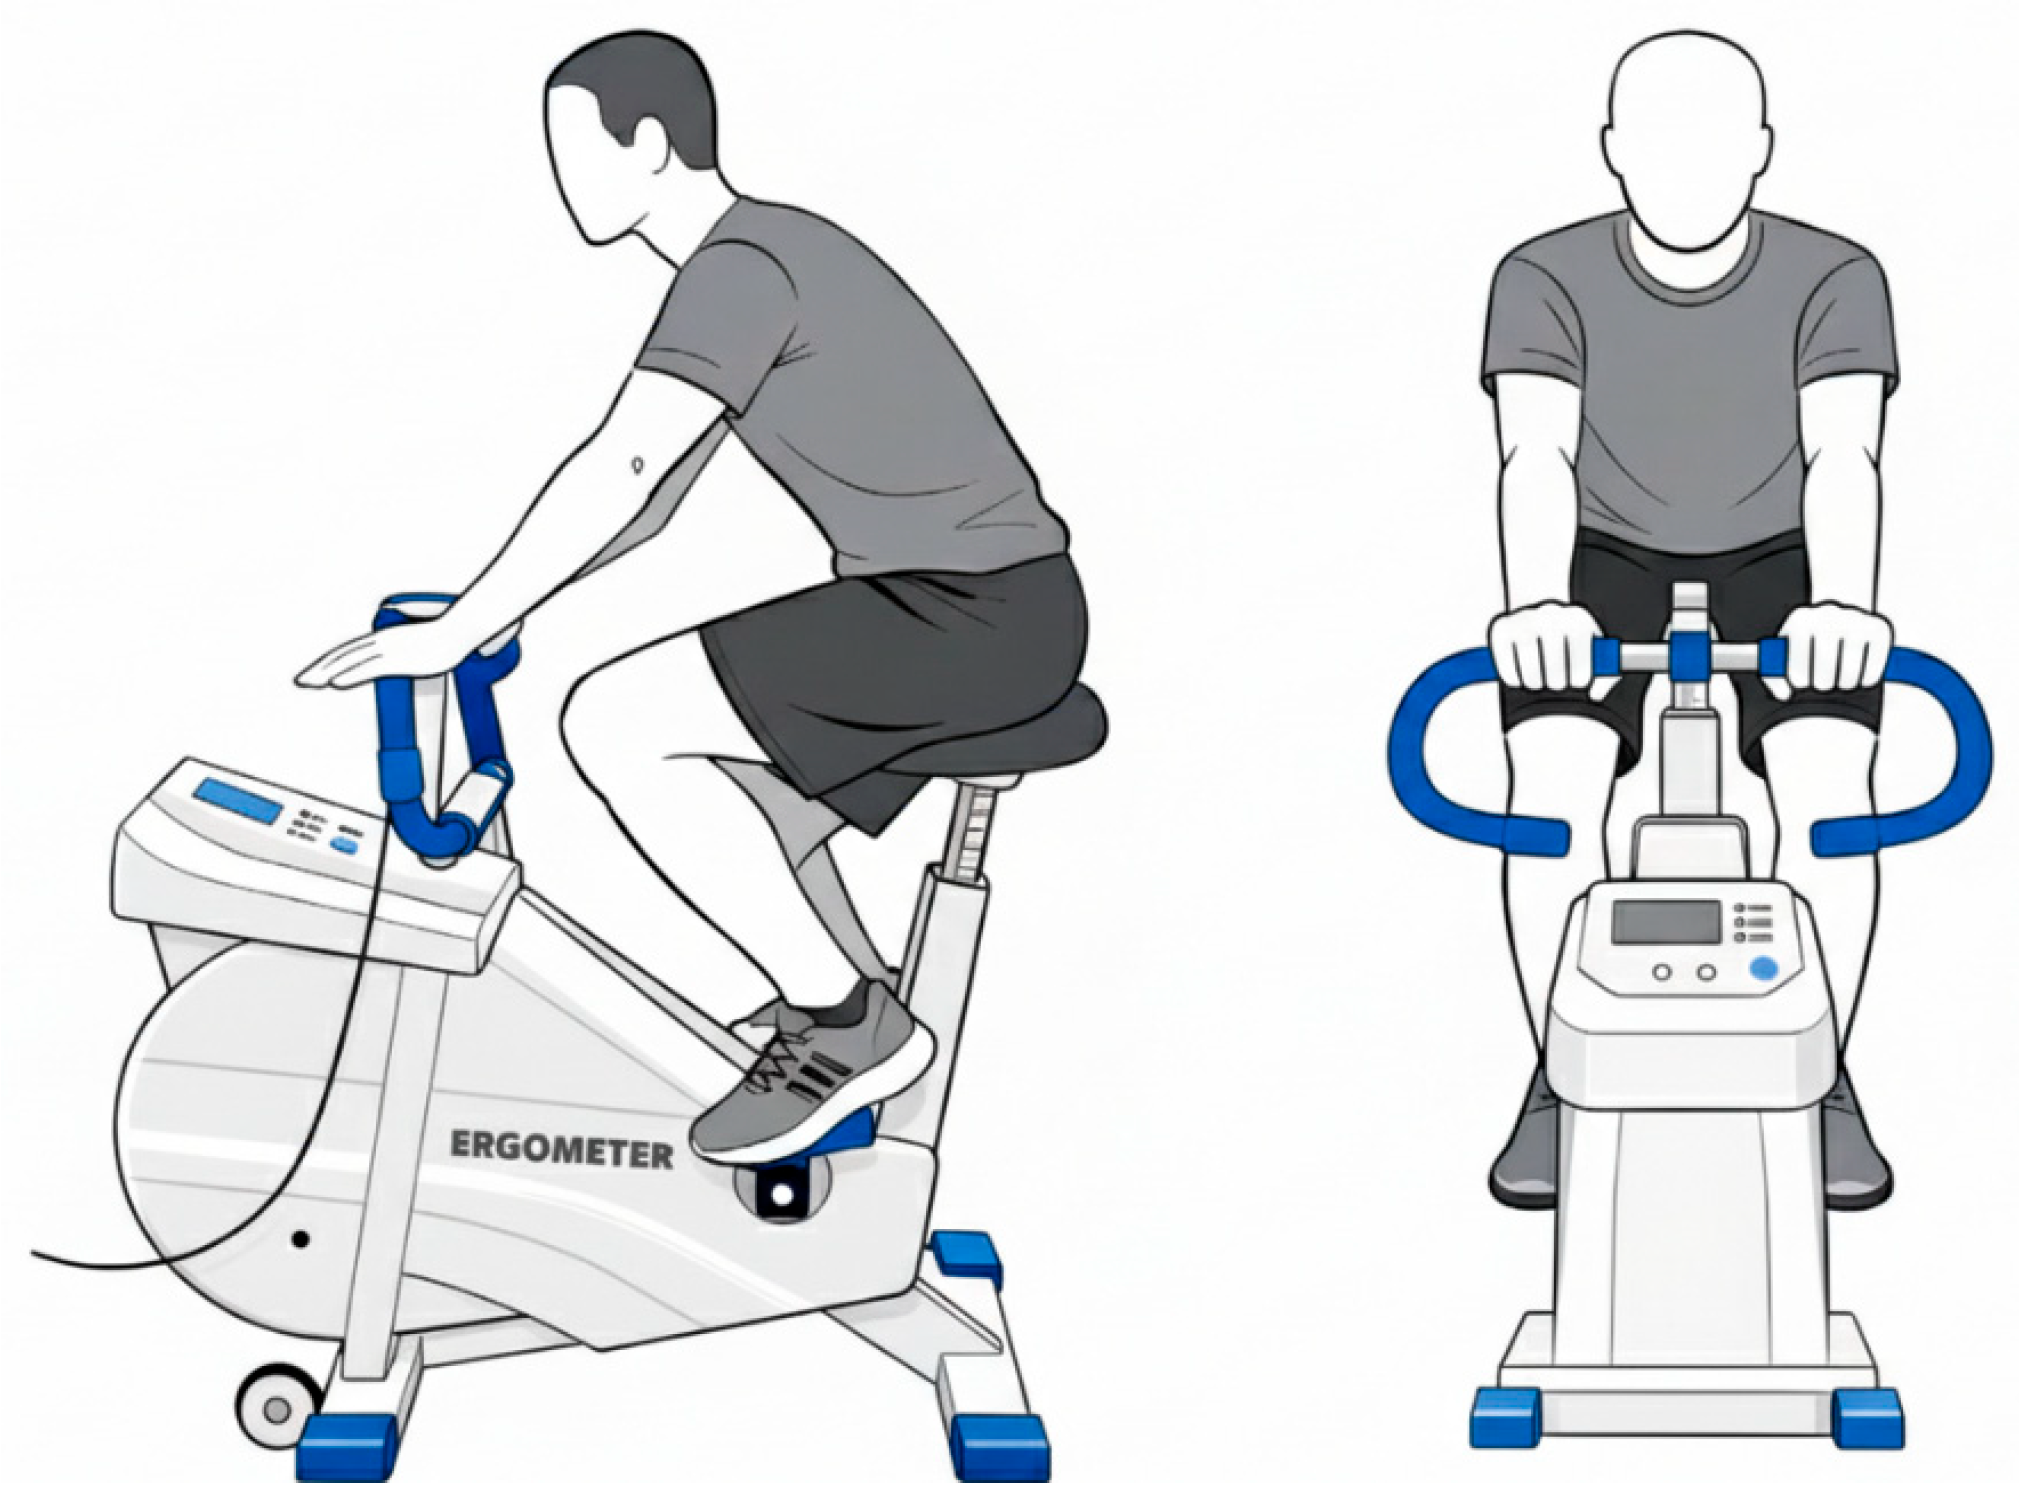
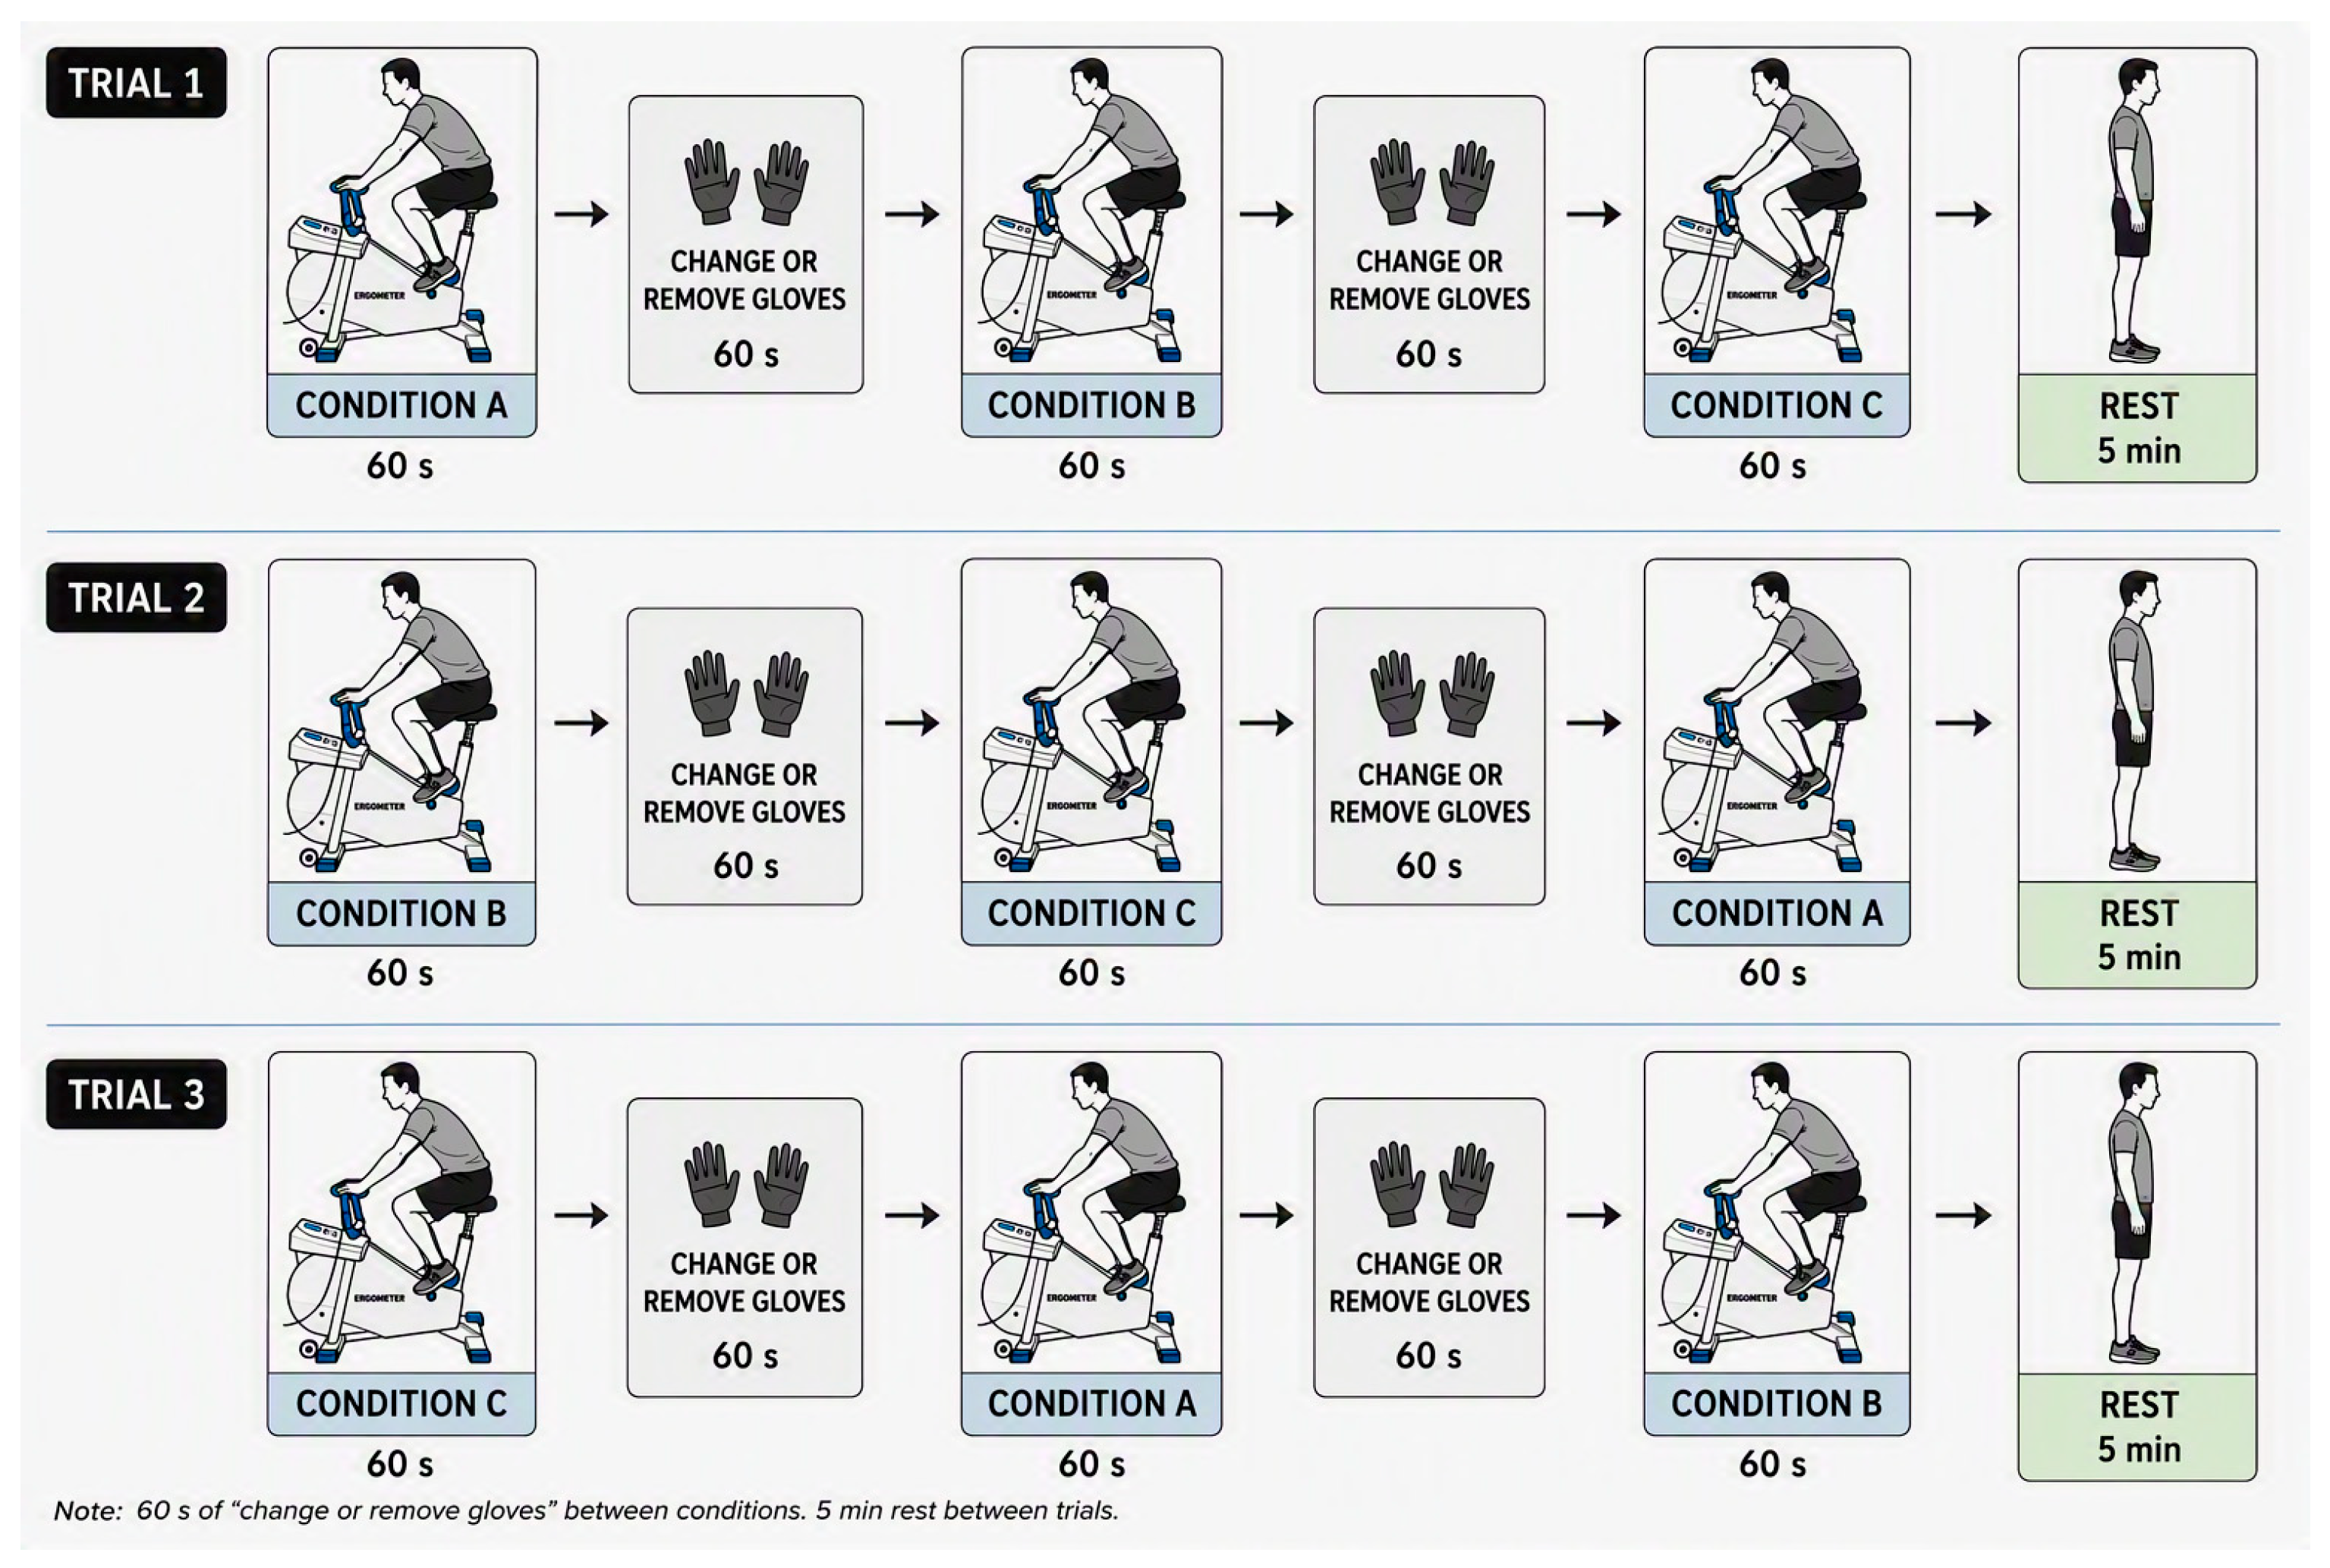
An illustration depicting a subject prepared for testing is provided in Figure 4. Upon completion of the warm-up phase, participants were given the first condition (the key for conditions is given above Figure 1 and refers to the condition of the hand—(A) bare, (B) Glove A, or (C) Glove B—for testing. A summary of the testing sequence is shown in Figure 4. Conditions were presented to each subject in a random order. They were instructed to elevate the bike speed to 60 rpms while maintaining low resistance. Once at the correct speed, pressure data were collected over a 60 s interval. Following data collection, participants were directed to reduce their speed to 40 rpms for a duration of 30 s. After the designated rest period (a five-minute break), participants were presented with the next randomly assigned condition and instructed to increase the bike speed once again to 60 rpms. The process of data collection, speed reduction to 40 rpms, and subsequent rest period was repeated for each of the assigned conditions (A, B, and C). To conclude the three trials, participants engaged in a five-minute break involving slow ambulation around the room. This entire procedure was replicated three times in total. It should be noted that the speed of the bike and low intensity were selected to maintain consistency throughout testing to prevent cyclist fatigue.
To summarize the sequence of testing, it was as follows: 60 s test at 60 rpms > 30 s rest at 40 rpms > change glove > repeat until all three gloves are tested > five-minute break > repeat previous sequence until three trials are completed. The total time actively pedaling was 13.5 min over a 28.5 min timeframe. All test subjects were questioned about fatigue following each test. None reported any fatigue. The sequence is represented visually in Figure 5.

2.3. Data Analysis

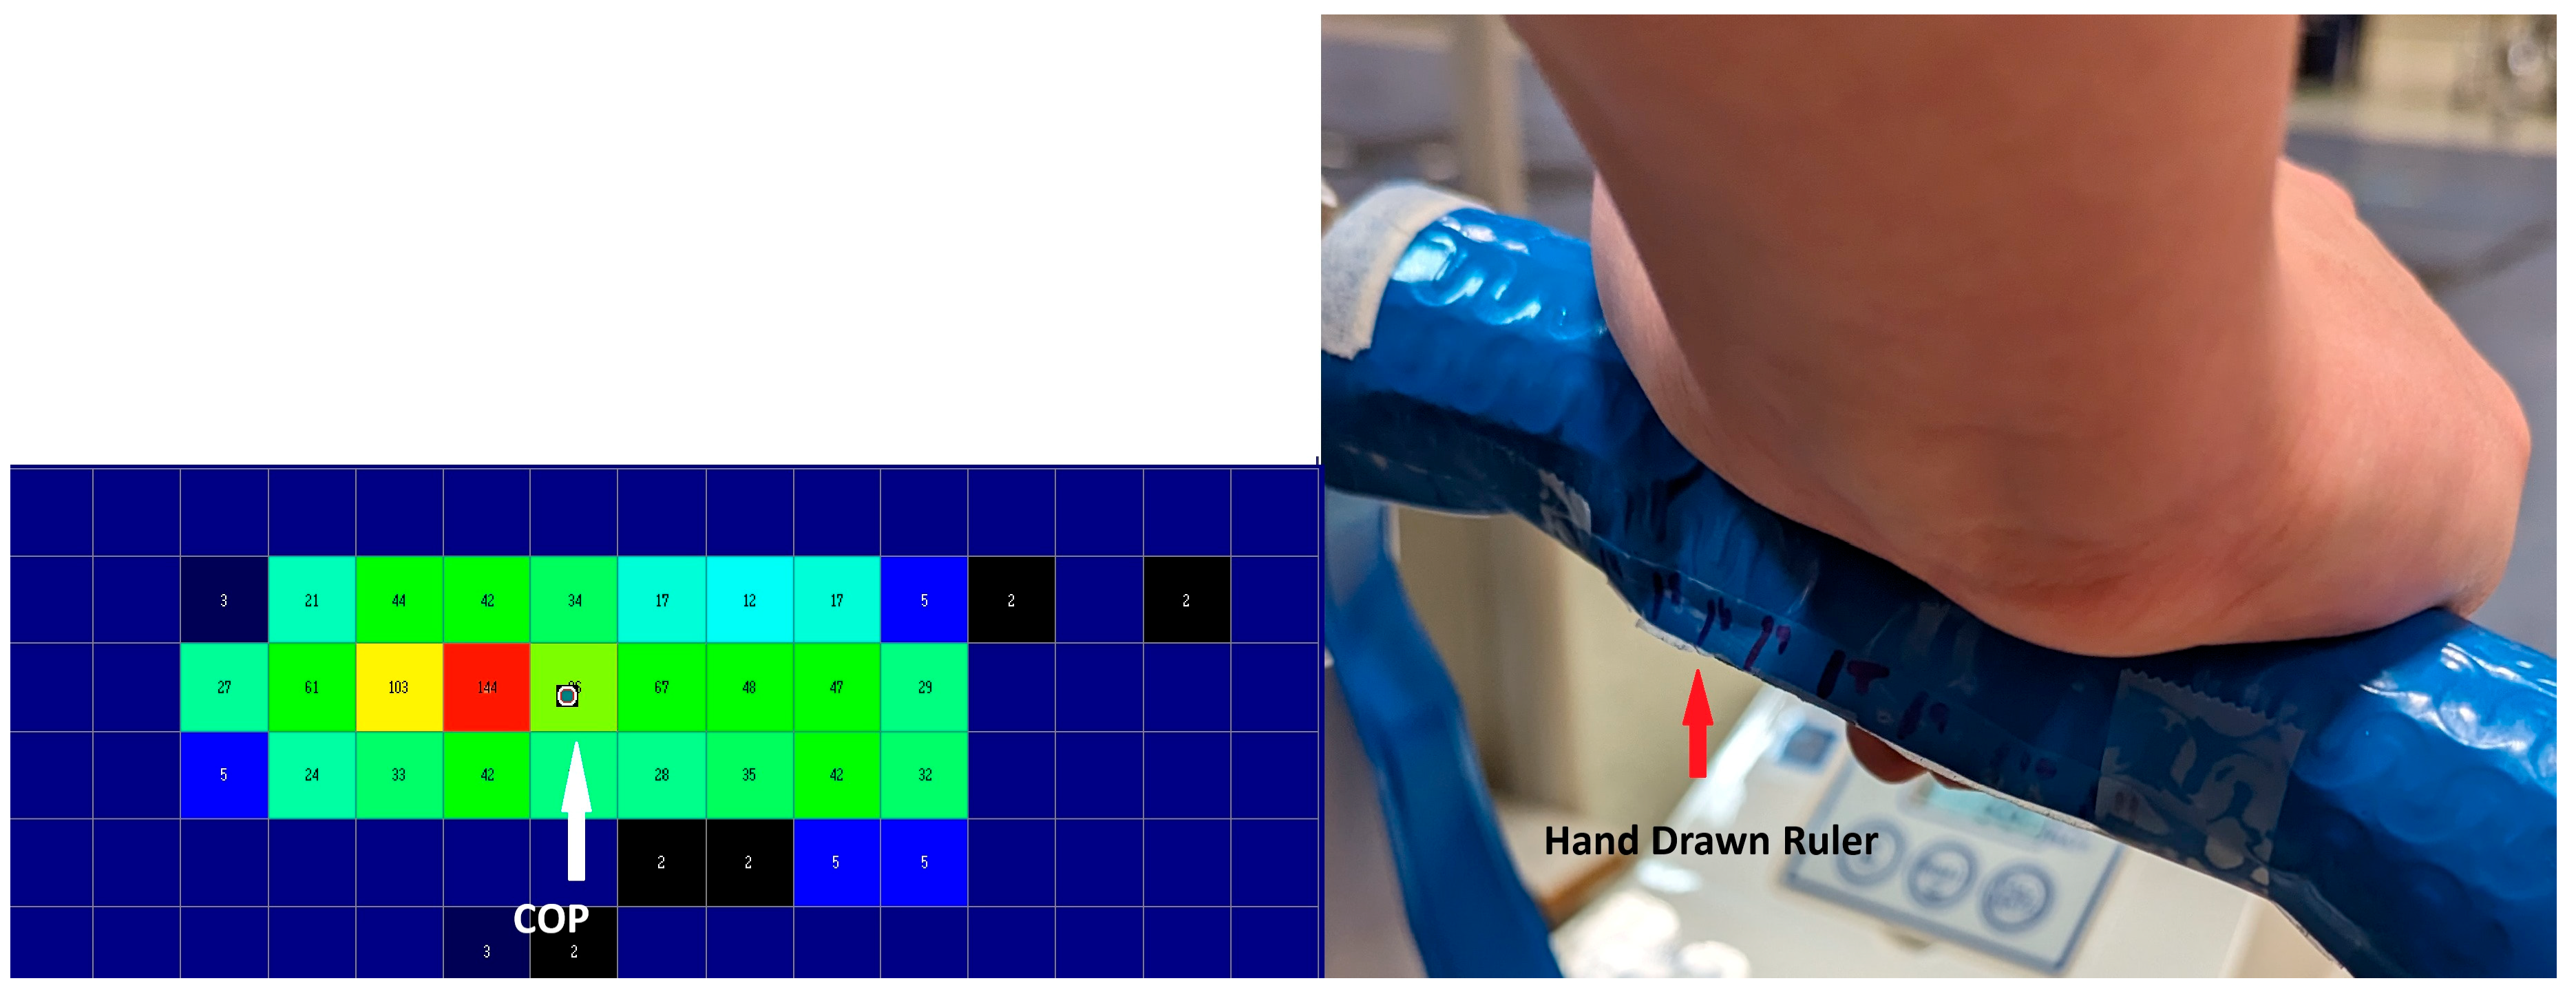
Each trial of the cycling data involved evaluation of pressure at the hand–glove–handlebar interface across three distinct areas of interest: total pressure at peak, the carpal tunnel region, and the median nerve region. The pliance-x® sensor used in the biking trial was a flexible 6 × 15 matrix, where each sensor was 7.07 mm × 7.70 mm. The matrix of the area of interest differed between the total pressure at peak, the carpal tunnel region, and the median nerve region. In all metrics of evaluating pressure, it was crucial to identify the subject’s center of palm on the sensor. To mitigate potential alignment issues, the center of pressure calculated by the pliance®-x software, version 24 software served as a reference for identifying the central palm region. Figure 6 (left) demonstrates an example of the center of pressure in the software. This alignment was further corroborated through the manual recording of the center of the palm on the sensor during each test (Figure 6, right).
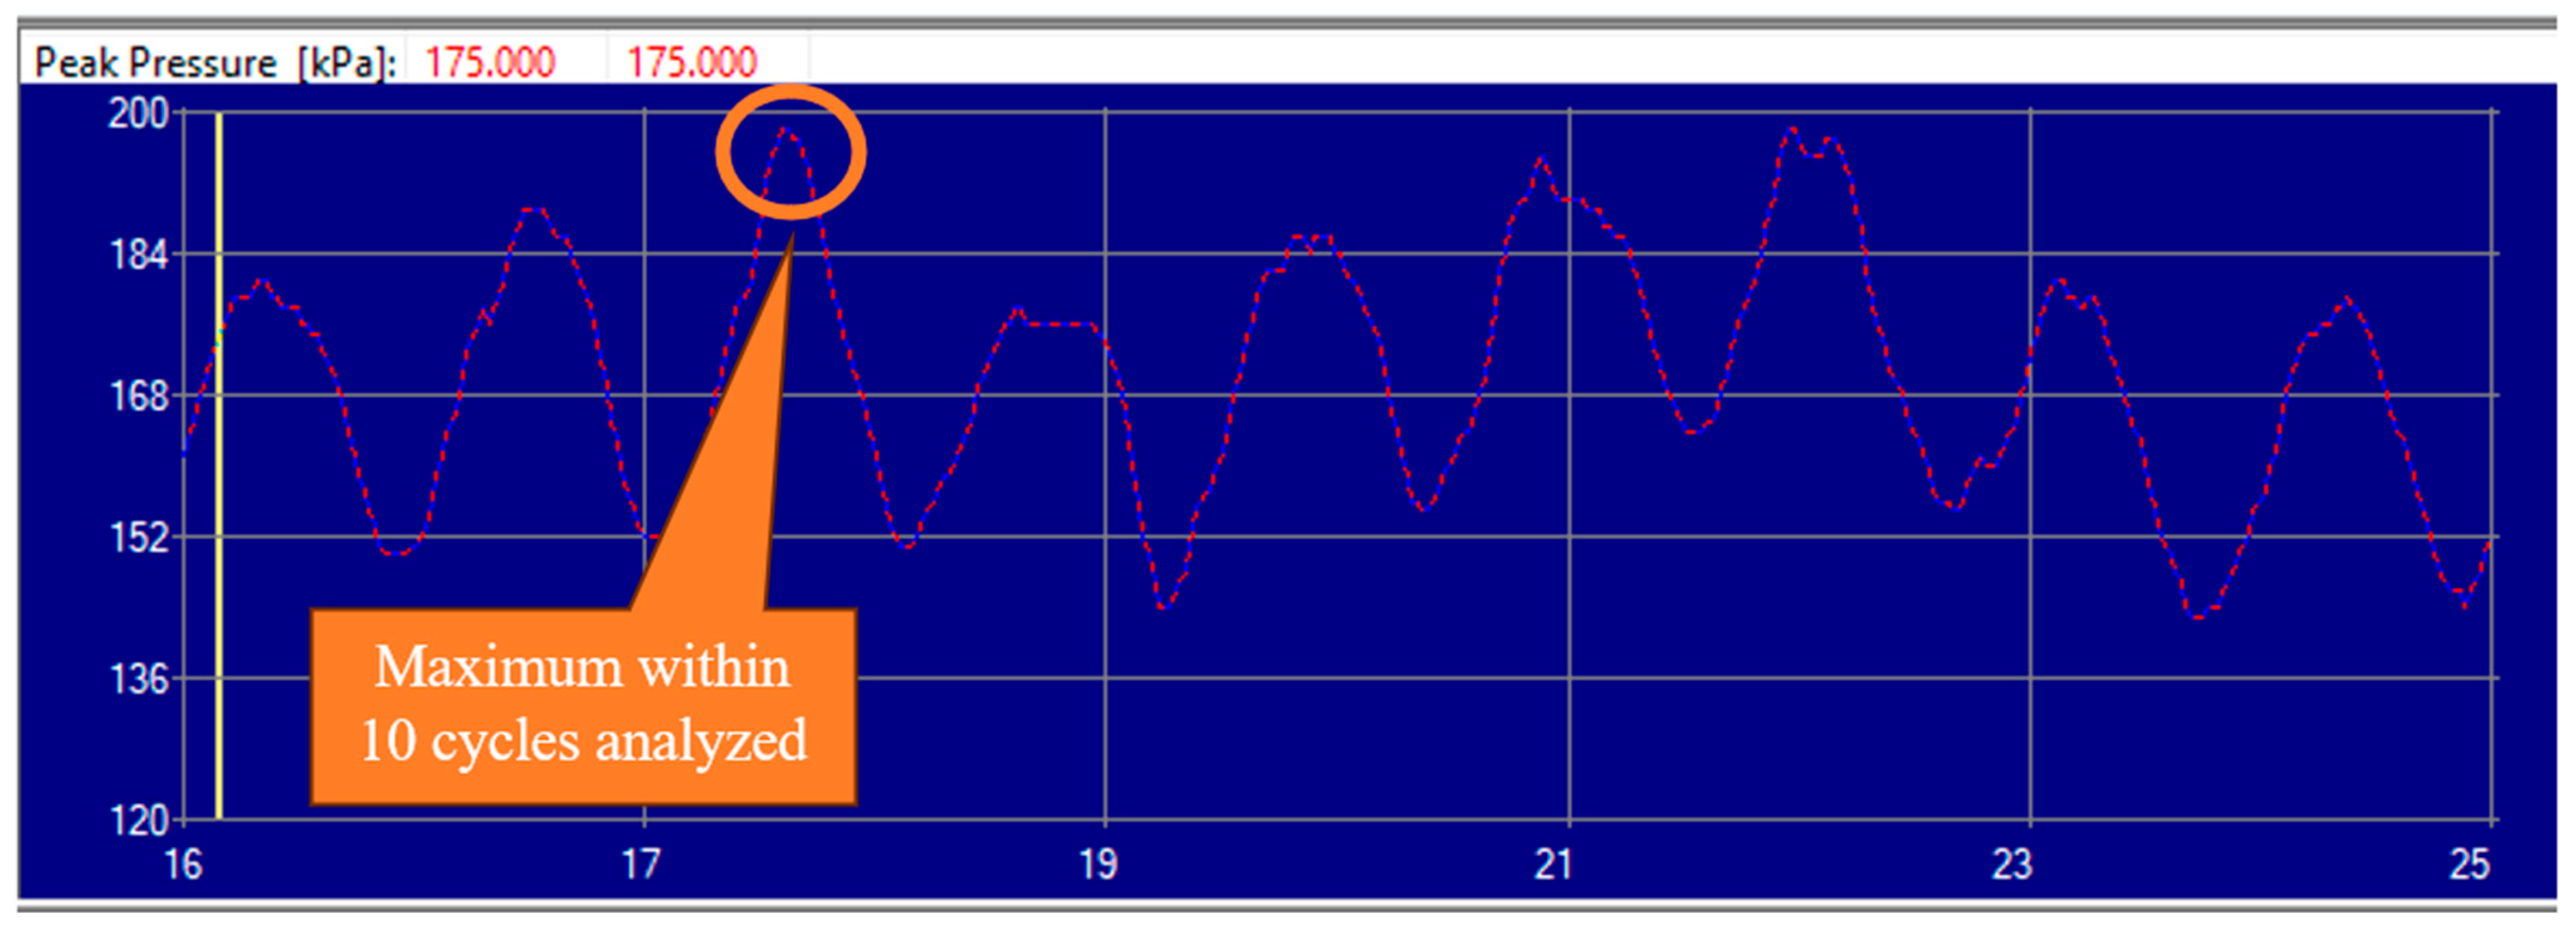
The average pressure at the hand–glove–handlebar interface within the carpal tunnel region and the median nerve region was computed over ten pedal strokes. In adherence to the participants’ instructed maintenance of a speed of approximately 60 rpm, local maximum pressure values were identified every second per manual review. The pressures within the array were recorded at the local maximum. Upon identifying ten sequential local maximums, they were averaged to find the overall average pressure across the carpal tunnel region (Figure 7). The total pressure across the matrix was calculated at the global maximum time step.

2.3.1. Summation of Pressures Area of Interest

Analysis was performed to determine whether the overall sum of pressures exerted across the palm of the hand remained consistent across the three distinct conditions. This value was determined by initially identifying the local maximum as described above, followed by the aggregation of all pressures reported by each sensor at that specific time.

2.3.2. Carpal Tunnel Region

As previously elucidated by Cobb et. al. [19], pressure applied to the section overlying the flexor retinaculum, also referred to as the transverse carpal ligament, near the center of the palm yielded the most significant increase in intracarpal tunnel pressures. In examining the potential impact on intracarpal pressure, particular attention was directed towards assessing the average pressure in the vicinity of the flexor retinaculum. The carpal tunnel spans an approximate width of 25 mm at its distal border [19]. Utilizing the flexible pliance®-x sensor (novel.de, Munich, Germany), a 2 × 4 cell matrix was utilized to encompass the area of interest within the carpal tunnel region seen in Figure 8.

2.3.3. Median Nerve

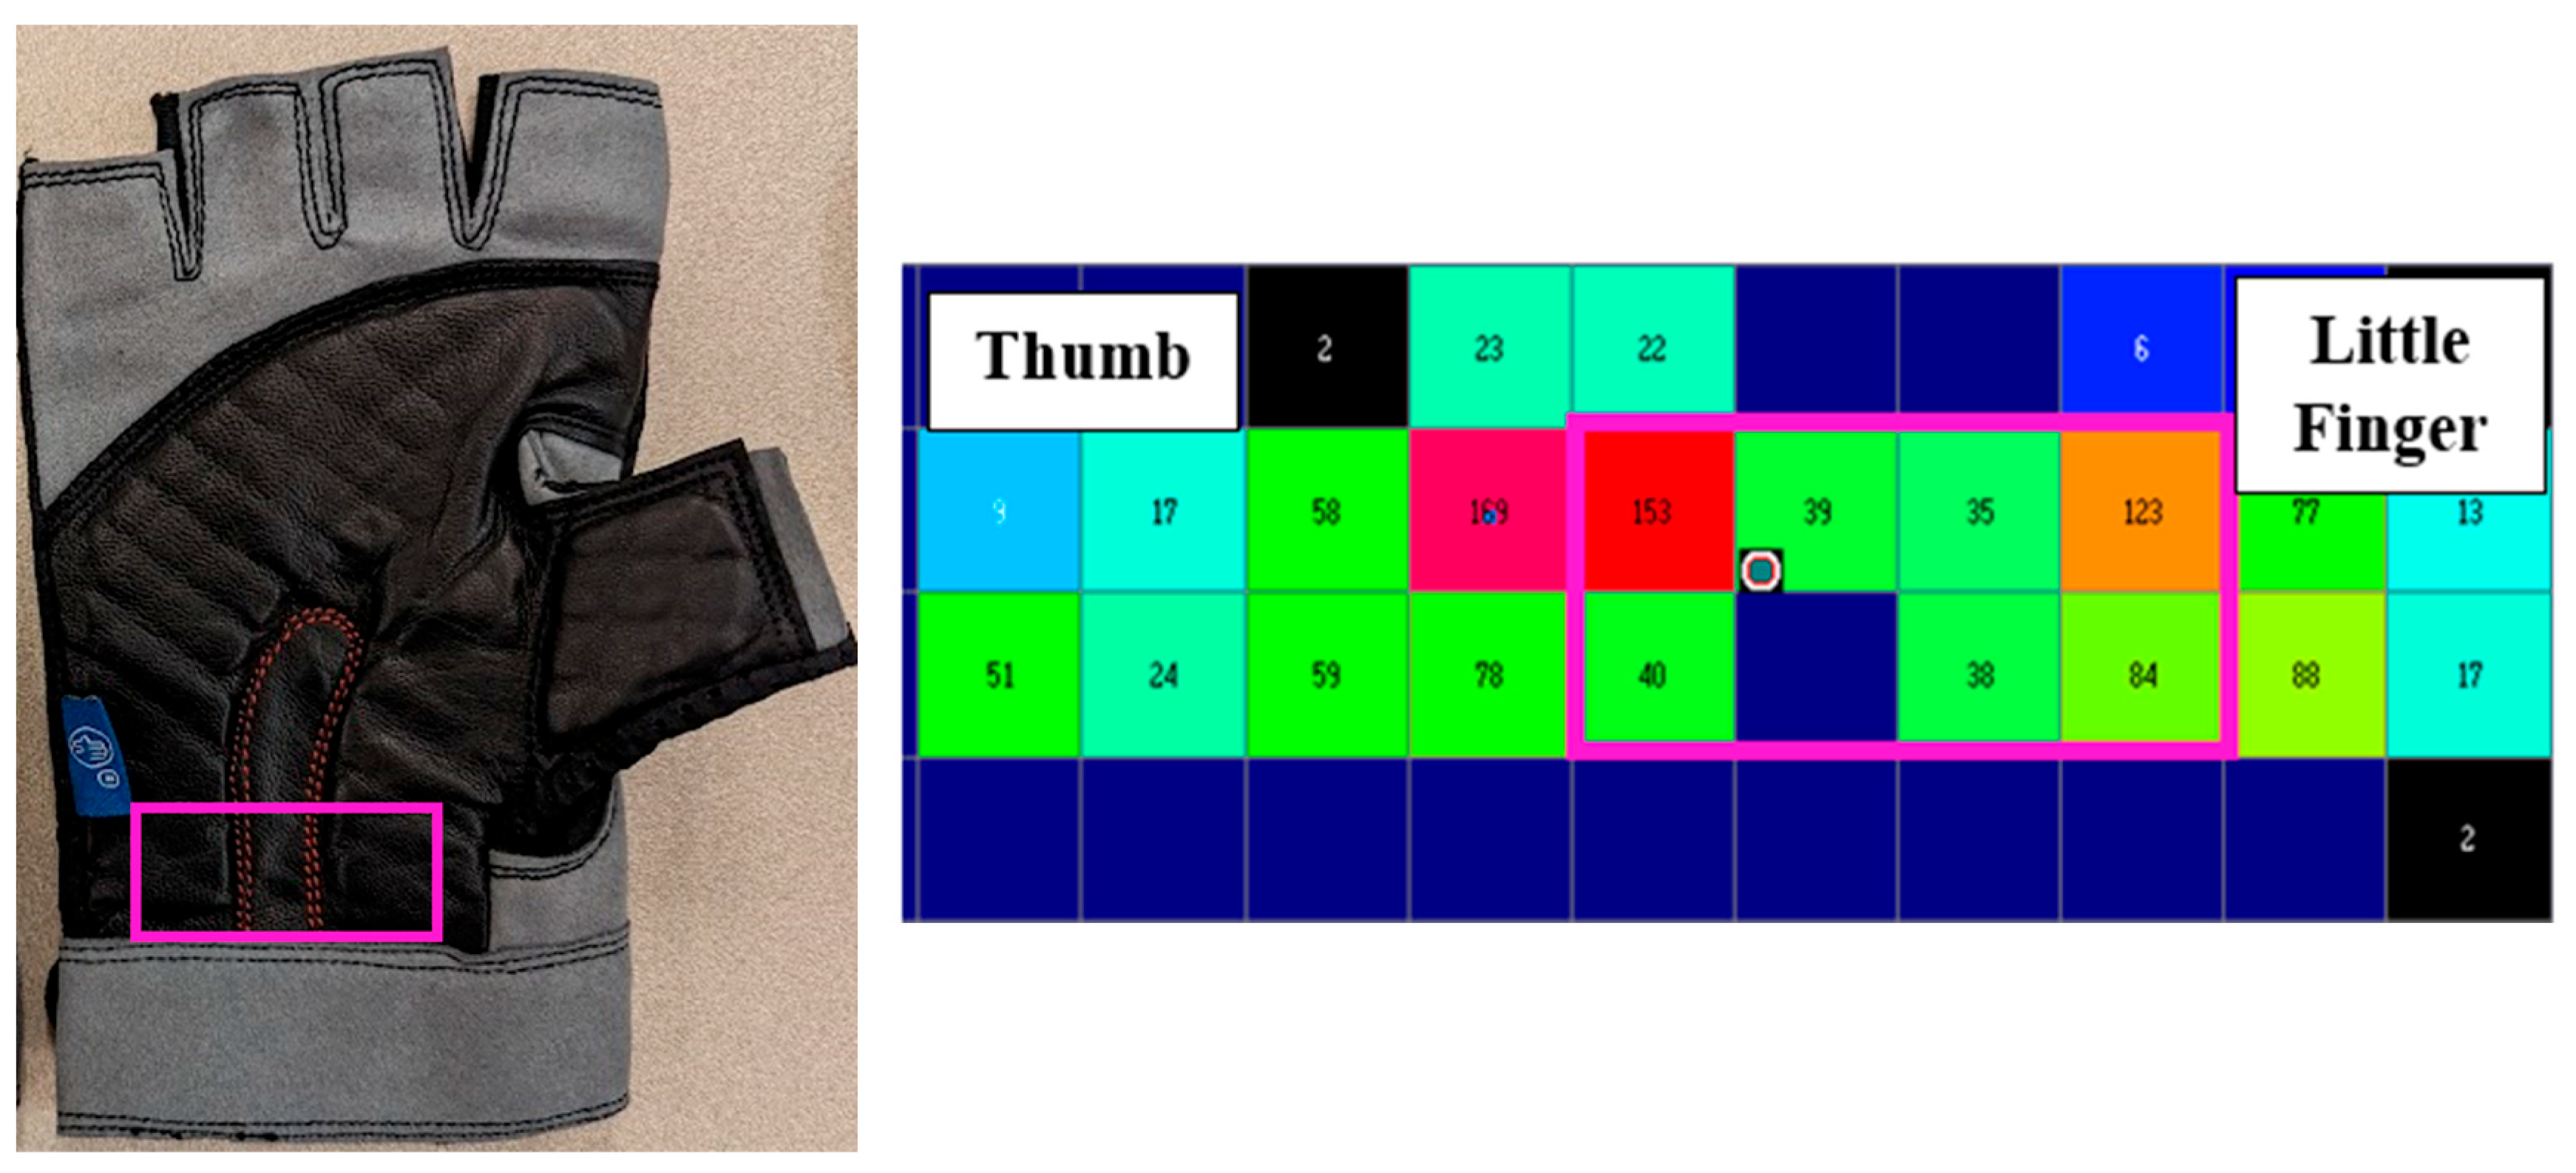
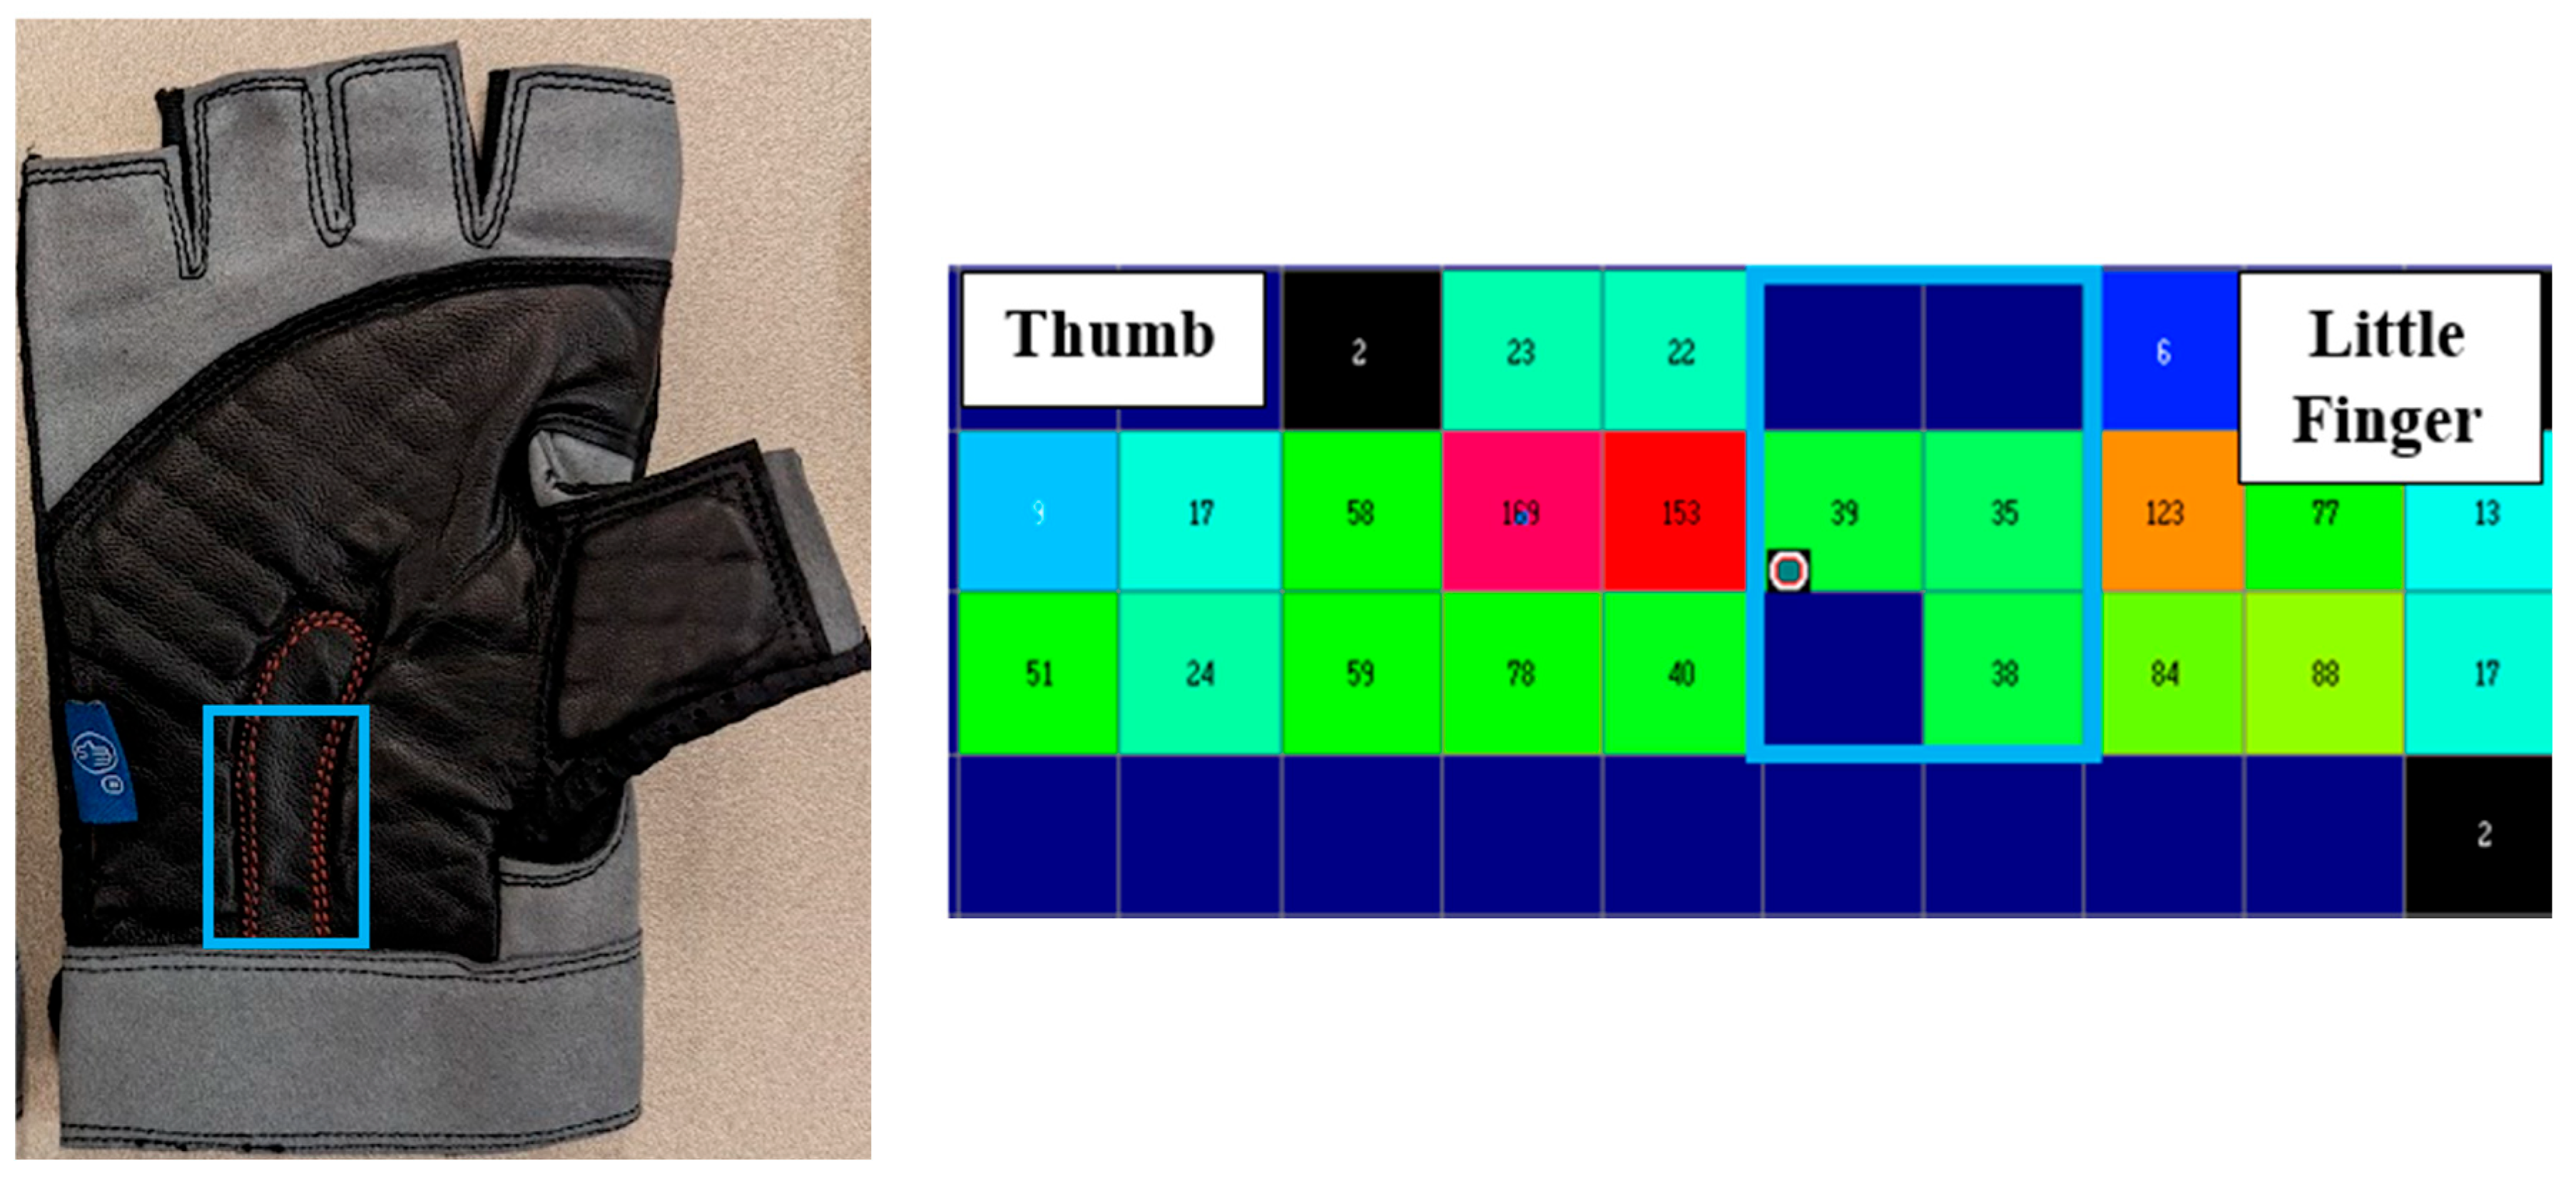
The design of the Shock·Tek™ gloves deliberately omits padding in the central hand area, spanning vertically from 4 to 6 cm, to facilitate median nerve offloading. According to Soubeyrand et al. [20], the primary branch of the median nerve exhibits a relatively circular shape, with a diameter of 7.5 mm (±1.5 mm), before entering the carpal tunnel. However, upon entry into the carpal tunnel, the shape of the median nerve may undergo alterations to accommodate the pressures exerted by the surrounding tissue. Given the glove’s exclusive focus on median nerve offloading, the third area of interest examined entailed a 3 × 2 matrix covering the projected region of the median nerve in the palm shown in Figure 9. This designated area of interest was specifically tailored to assess the pressure exerted on the median nerve at the hand–glove–handlebar interface across all three conditions. Although this path varies from individual to individual, the approximation was made based on the sensor resolution and average anatomical location and aligned with the thenar crease in all subjects. The exact location of the median nerve was not verified using ultrasound or other imaging techniques.

2.3.4. Sample Size Justification

This exploratory pilot study included a convenience/feasibility cohort of thirteen participants. The sample size was selected to evaluate the feasibility of pressure mapping during cycling, provide preliminary estimates of pressure variability and effect magnitude, and identify methodological factors requiring improved control in future confirmatory studies. The relatively small sample size, particularly for sex-stratified comparisons, is acknowledged as a limitation of this study. An a priori power analysis indicated an estimated target sample size of 15 participants. Because the final sample size was 13 participants, this study was underpowered for confirmatory hypothesis testing. Therefore, all inferential results and p-values should be interpreted as exploratory and hypothesis-generating rather than confirmatory.

2.3.5. Statistical Analysis

A priori power analysis was conducted for a within-subject repeated-measures design using an assumed effect size of 0.25, α = 0.05, and power = 0.80. This analysis indicated an estimated target sample size of 15 participants. As noted above, the final sample size fell short of the estimated target sample size; therefore, all statistical findings were interpreted as exploratory and hypothesis-generating and were considered together with descriptive statistics, percent differences, and observed pressure distribution patterns.
Given the repeated-measures design and multiple dependent variables (pressure, force, and contact area), a multivariate repeated-measures ANOVA (MANOVA) was used as an exploratory global test to assess differences across glove conditions and cycling trials [21]. Pressure, force, and contact area were treated as dependent variables, while glove condition (bare hands, traditional gloves, and Shock·Tek™ gloves) and trial number were treated as within-subject factors. Wilks’s lambda was used to evaluate multivariate effects, with statistical significance set at p < 0.05.
When significant condition effects were identified, post hoc pairwise/simple-effects contrasts were used to compare individual glove conditions. The pairwise comparisons are reported as F-statistics in the Results tables. Multiple pairwise comparisons were interpreted using a Bonferroni-adjusted significance threshold. Because of the small sample size, particularly after stratification by sex, sex-stratified analyses were considered exploratory only and were used to identify potential trends for future study rather than to support confirmatory conclusions. Statistical findings were interpreted together with descriptive statistics, percent differences, and observed pressure distribution patterns.

3. Results

3.1. Pressure Analysis from Cycling Test

Initially, Wilks’s lambda test for significance was conducted to evaluate the significance across conditions and trials. This analysis revealed a notable influence of sex, which will be elaborated upon in a subsequent section. Through this analysis, no significant interactions were observed among the three cycling trials for any of the areas of interest, namely, summation of pressure at peak (F = 0.05; p = 0.9500), carpal tunnel (F = 0.06; p = 0.9395), or median nerve (F = 0.10; p = 0.9063). Consequently, the average pressure across the three trials was utilized for subsequent plots.

3.1.1. Summation of Pressures Area of Interest

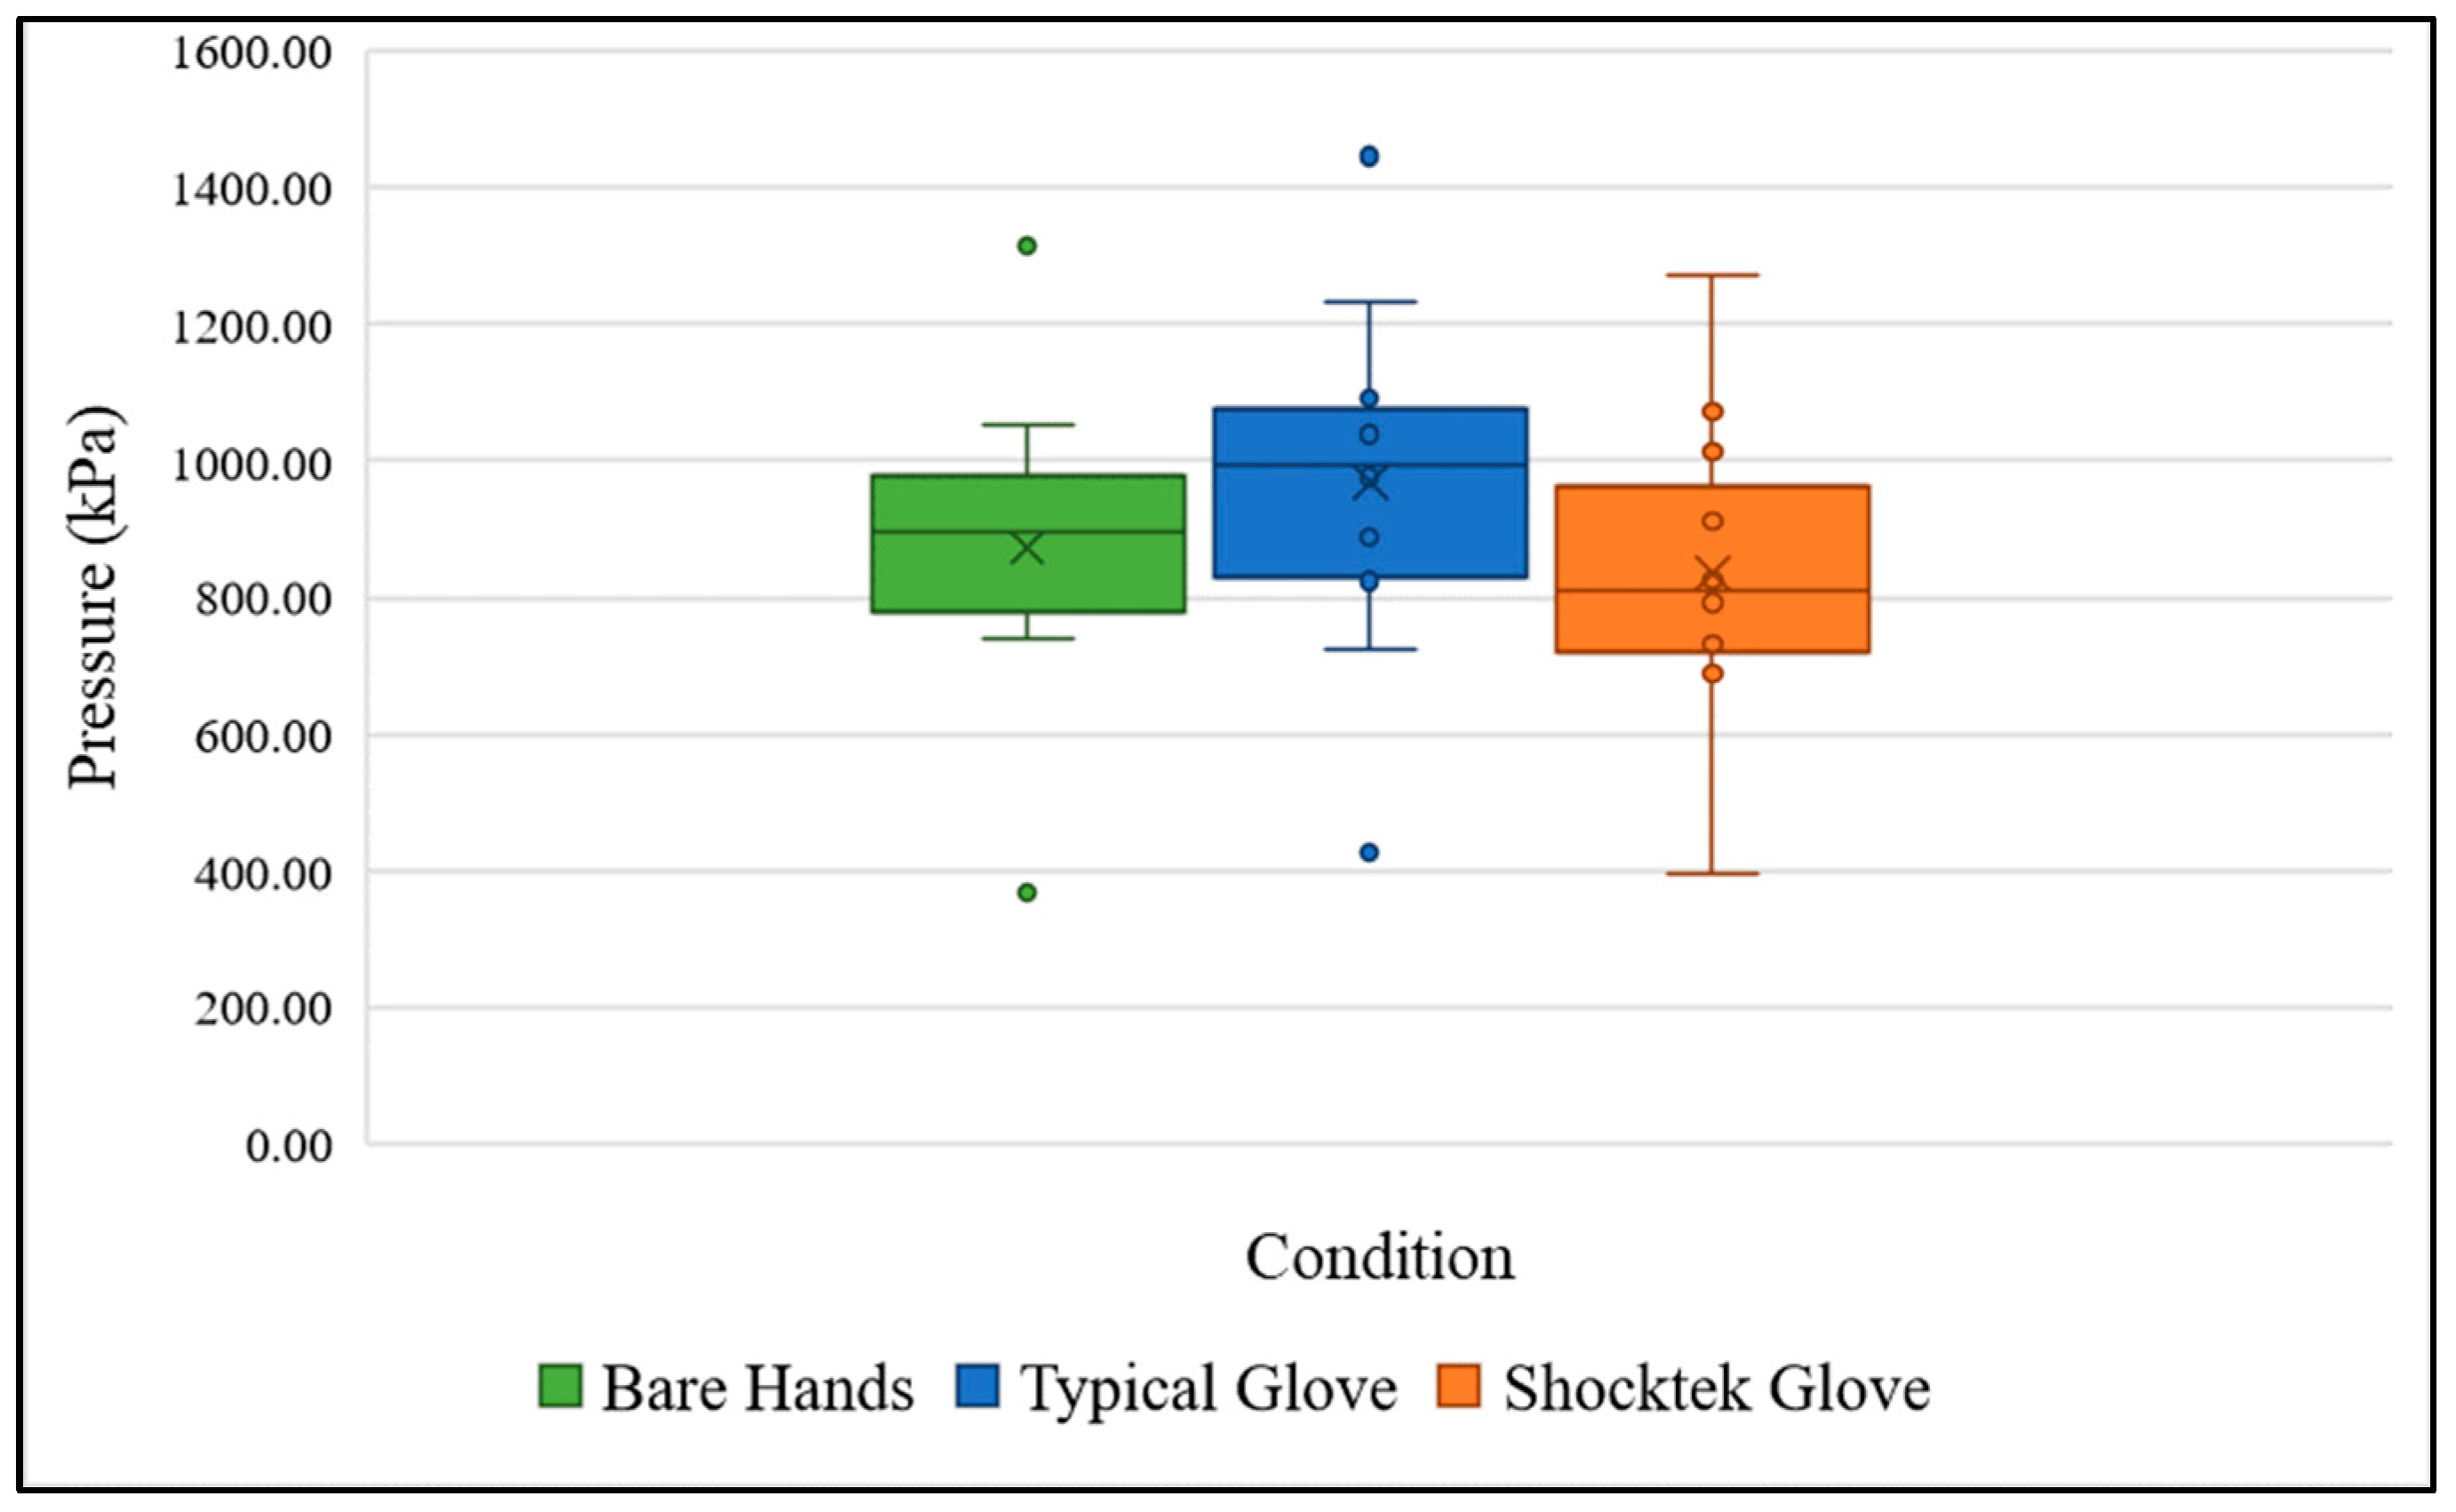
The mean summation of pressure exerted across the hand for all subjects was 873.49 kPa (range: 369.33–1314.33 kPa) for bare hands, 968.54 kPa (range: 427.00–1446.00 kPa) for typical gloves, and 835.49 kPa (range: 394.00–1269.67 kPa) for Shock·Tek™ gloves. All subjects except one exhibited a positive pressure differential when wearing typical gloves in comparison with bare hands, as seen in Figure 10 and summarized in Table 1. The observed increase in pressure with typical gloves suggests that subjects supported more of their body weight on the handlebars when using these gloves compared with bare hands or the Shock·Tek™ gloves. This observation is further supported by the post hoc paired-sample comparisons, which indicated a significant difference between typical gloves and both bare hands and Shock·Tek™ gloves, while the difference between Shock·Tek™ gloves and bare hands was smaller.
Wilks’s lambda test revealed a significant interaction between the overall response and condition (F = 21.80; p ≤ 0.0001). Subsequent paired t-tests revealed additional significant findings when comparing the conditions, with greater significance observed when comparing bare hands and Shock·Tek™ gloves with typical gloves as opposed to bare hands and Shock·Tek™ gloves. A summary of these findings can be seen in Table 2.
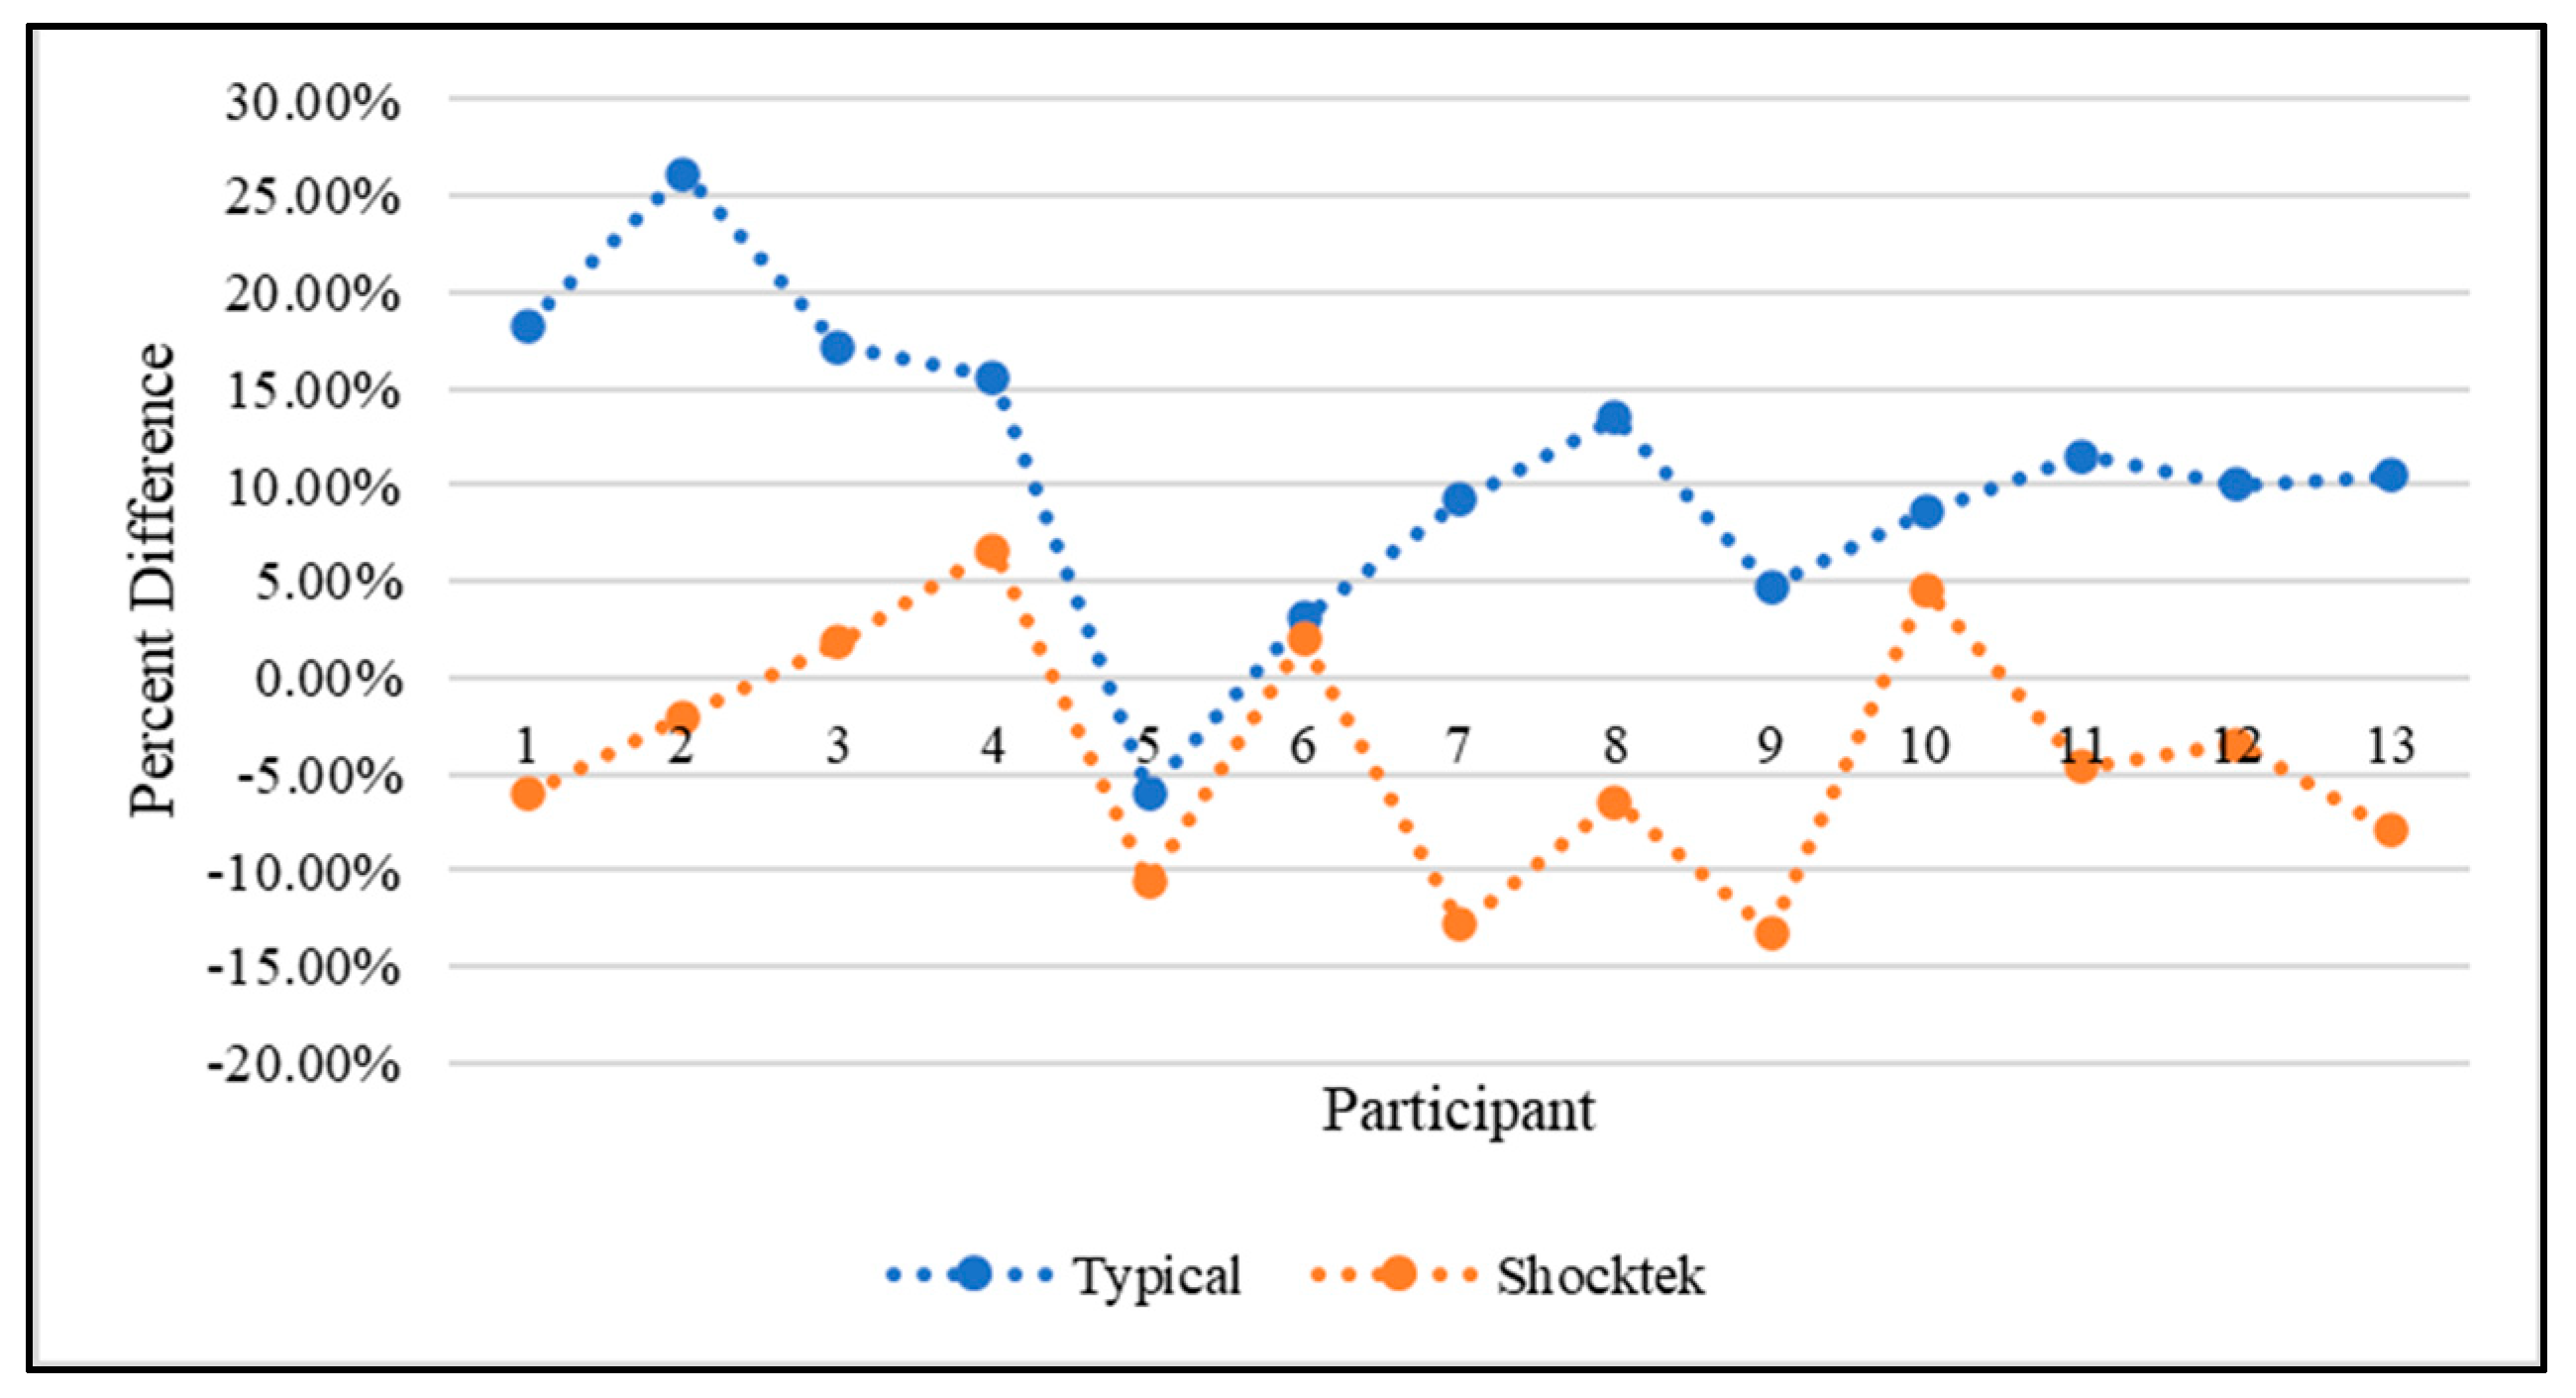
Conversely, only four of the thirteen subjects demonstrated a positive pressure differential when wearing the Shock·Tek™ gloves, as seen in Figure 11. The average marginal decreases in pressure with the Shock·Tek™ gloves indicate that the gloves do not alleviate pressure from the hands but instead redistribute it to other areas on the palm. This led to higher-pressure points toward the lateral and medial sides of the palm.

3.1.2. Carpal Tunnel Area of Interest

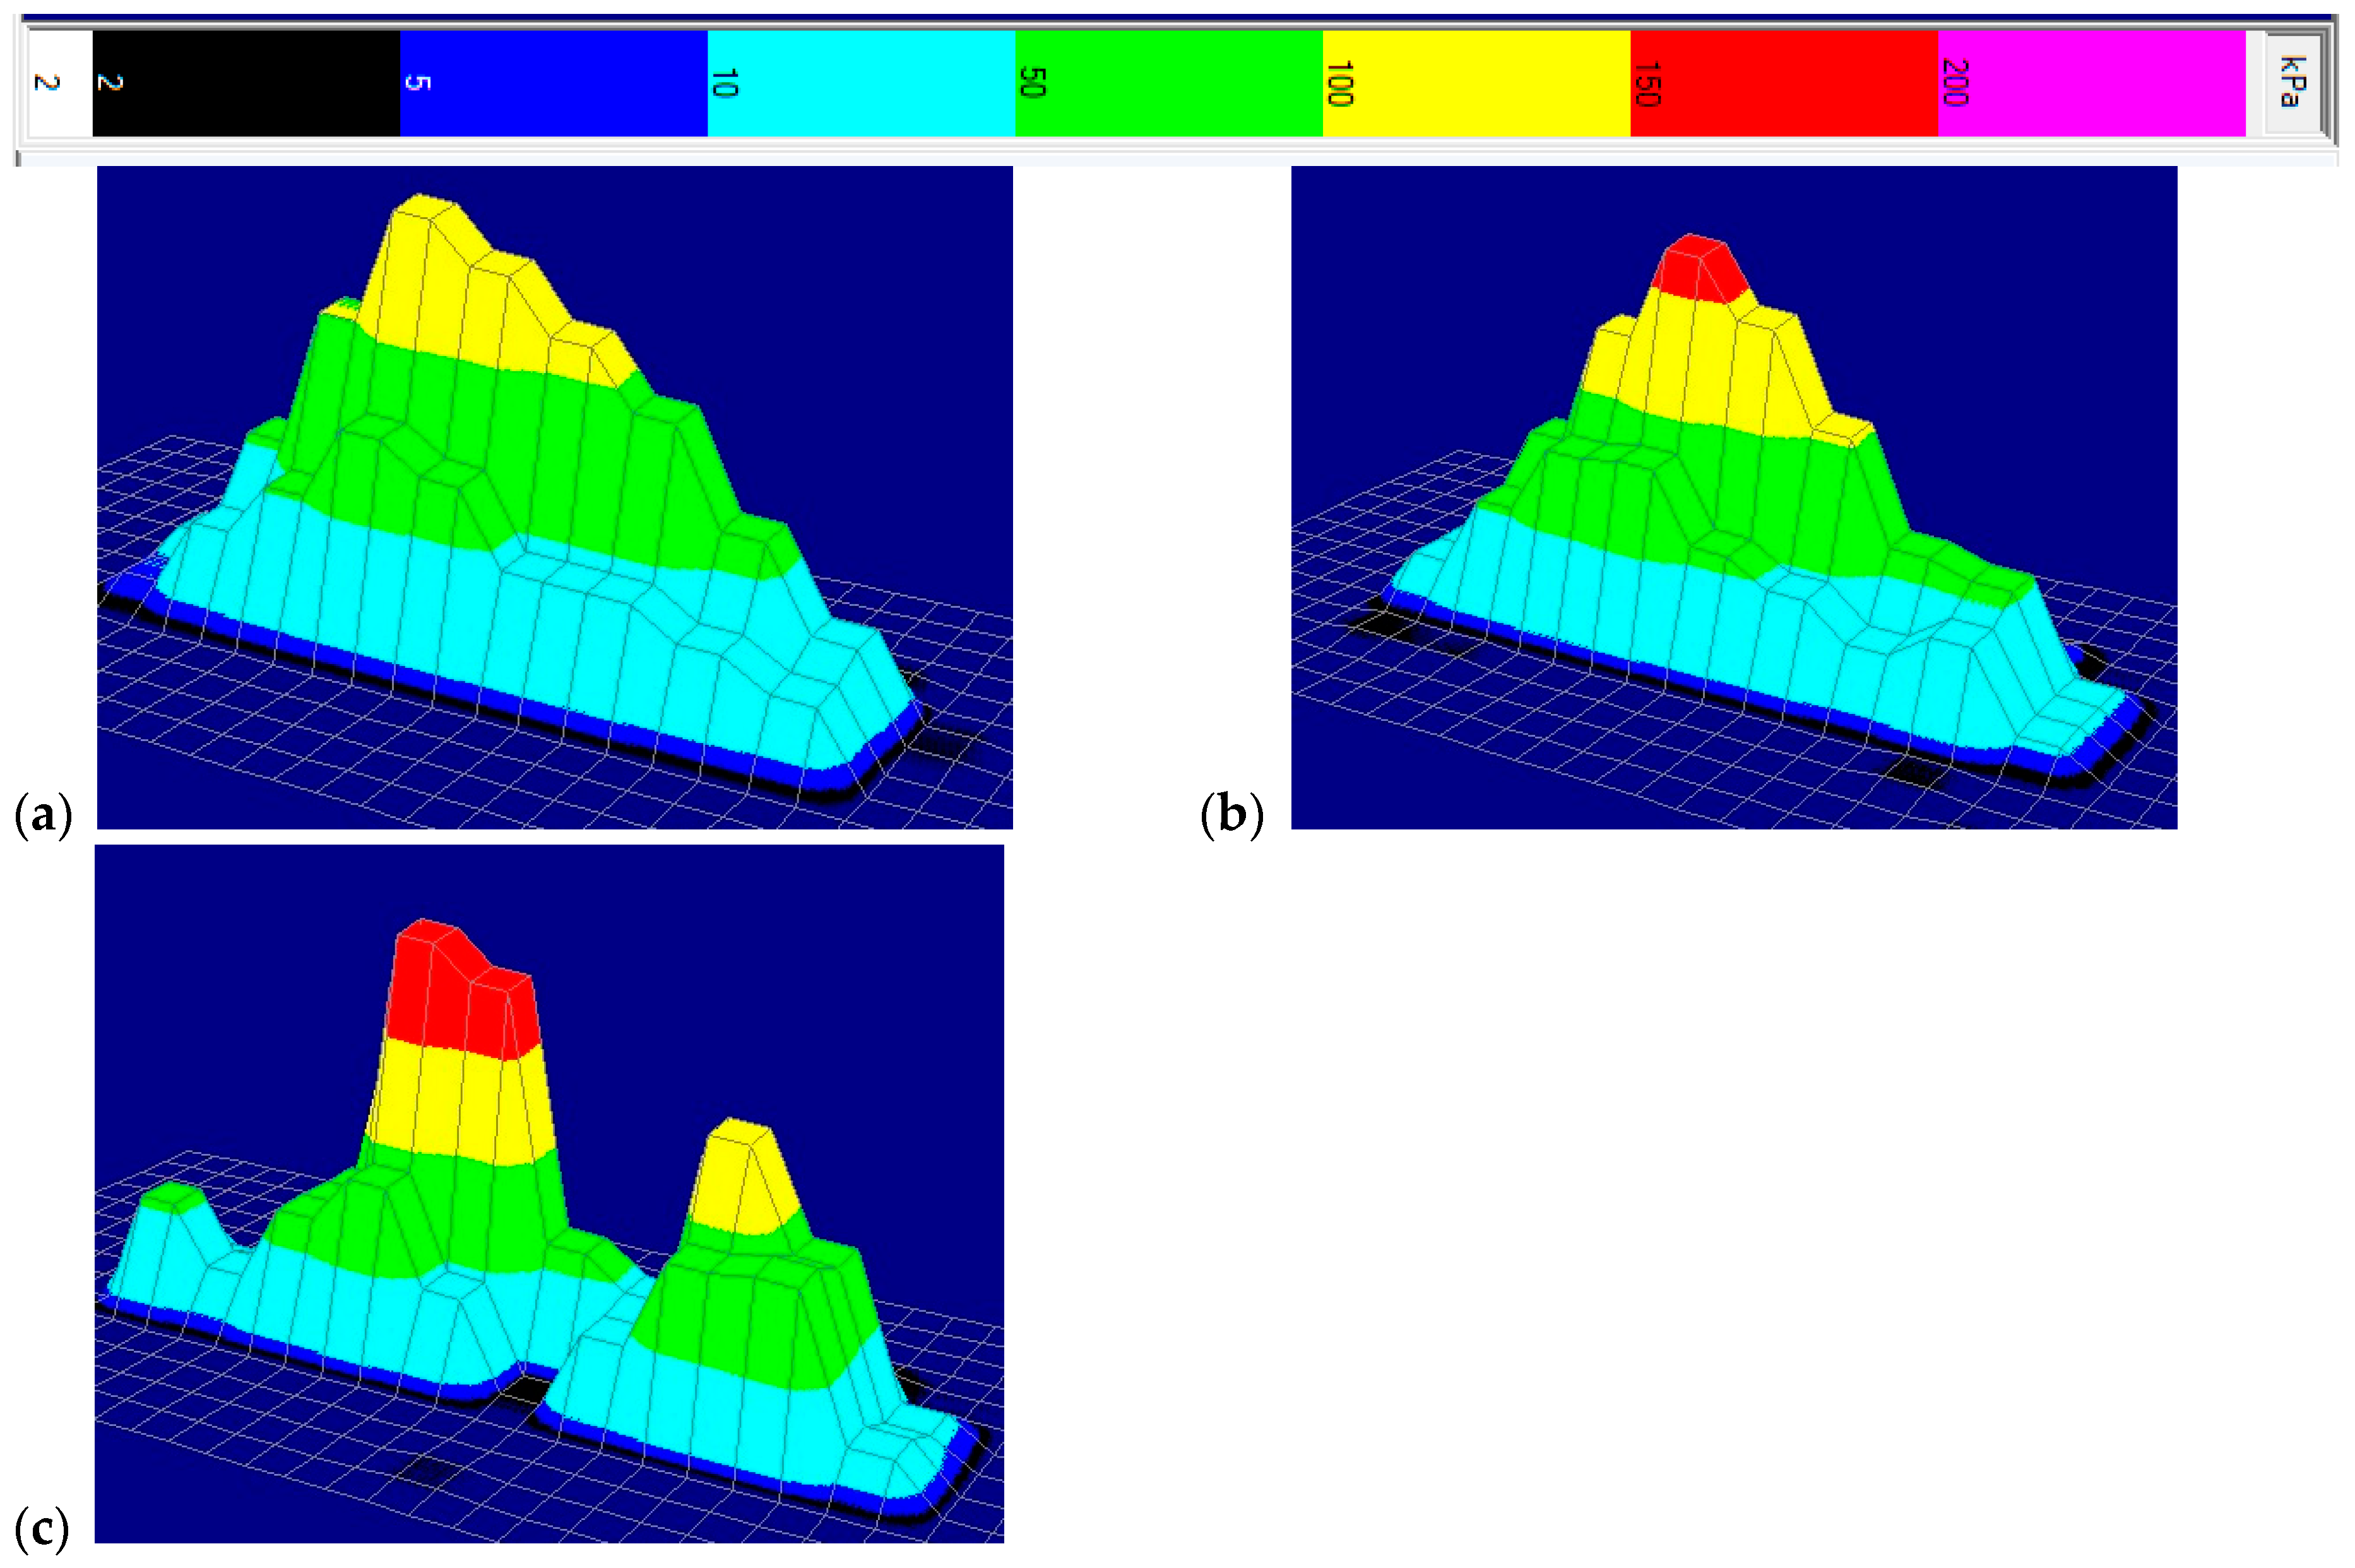
When examining the three-dimensional pressure topography of the carpal tunnel area of interest, a distinctive mountain-like structure is evident, primarily localized at the center of the palm for bare hands across all subjects (Figure 12). This suggests that the largest pressure point with bare hands occurs near or directly over the median nerve. A similar structure is observed for typical gloves at the hand–glove–handlebar interface; however, some subjects exhibit an exaggerated peak while others display a more rounded profile. An observed trend indicated that with prolonged cycling (20–30 s), there was a slight medial shift noted in the location of the peak pressure within the palm region for typical and bare hands for the majority of subjects. In contrast, utilization of the Shock·Tek™ gloves resulted in a distinct valley formation over the central region of the palm at the hand–glove–handlebar interface, albeit with occasional larger side peaks compared with those formed under bare hands.
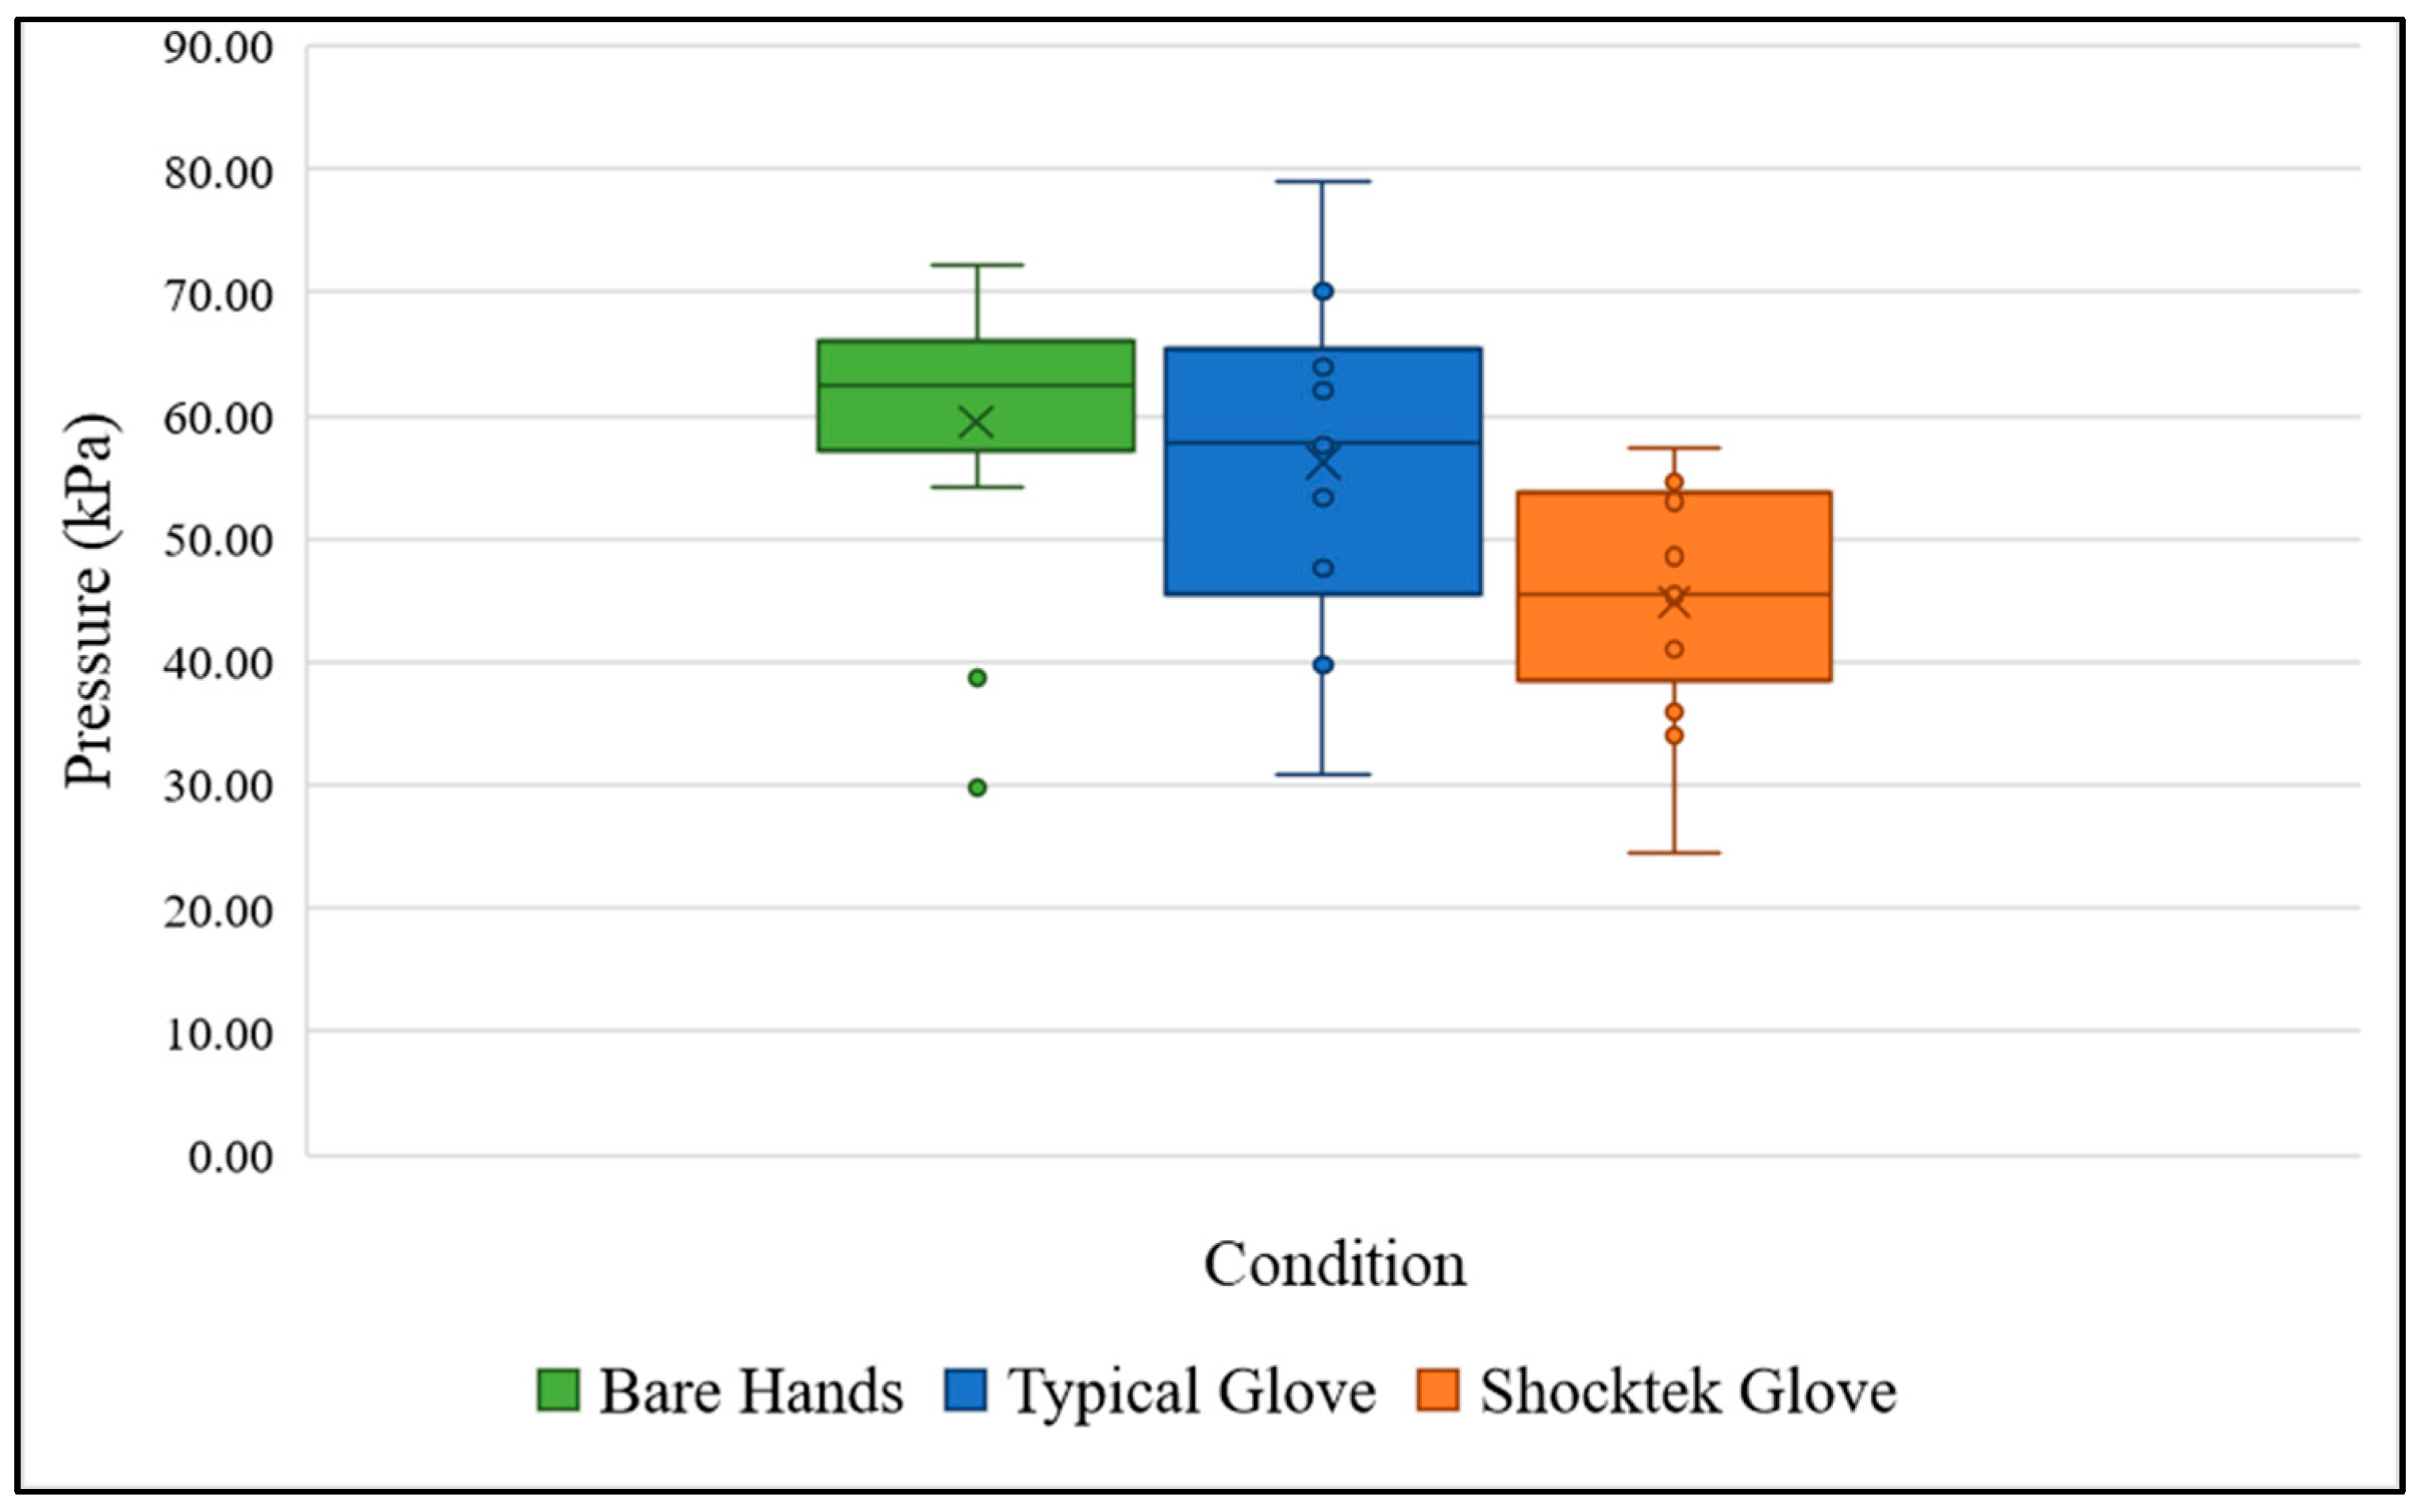
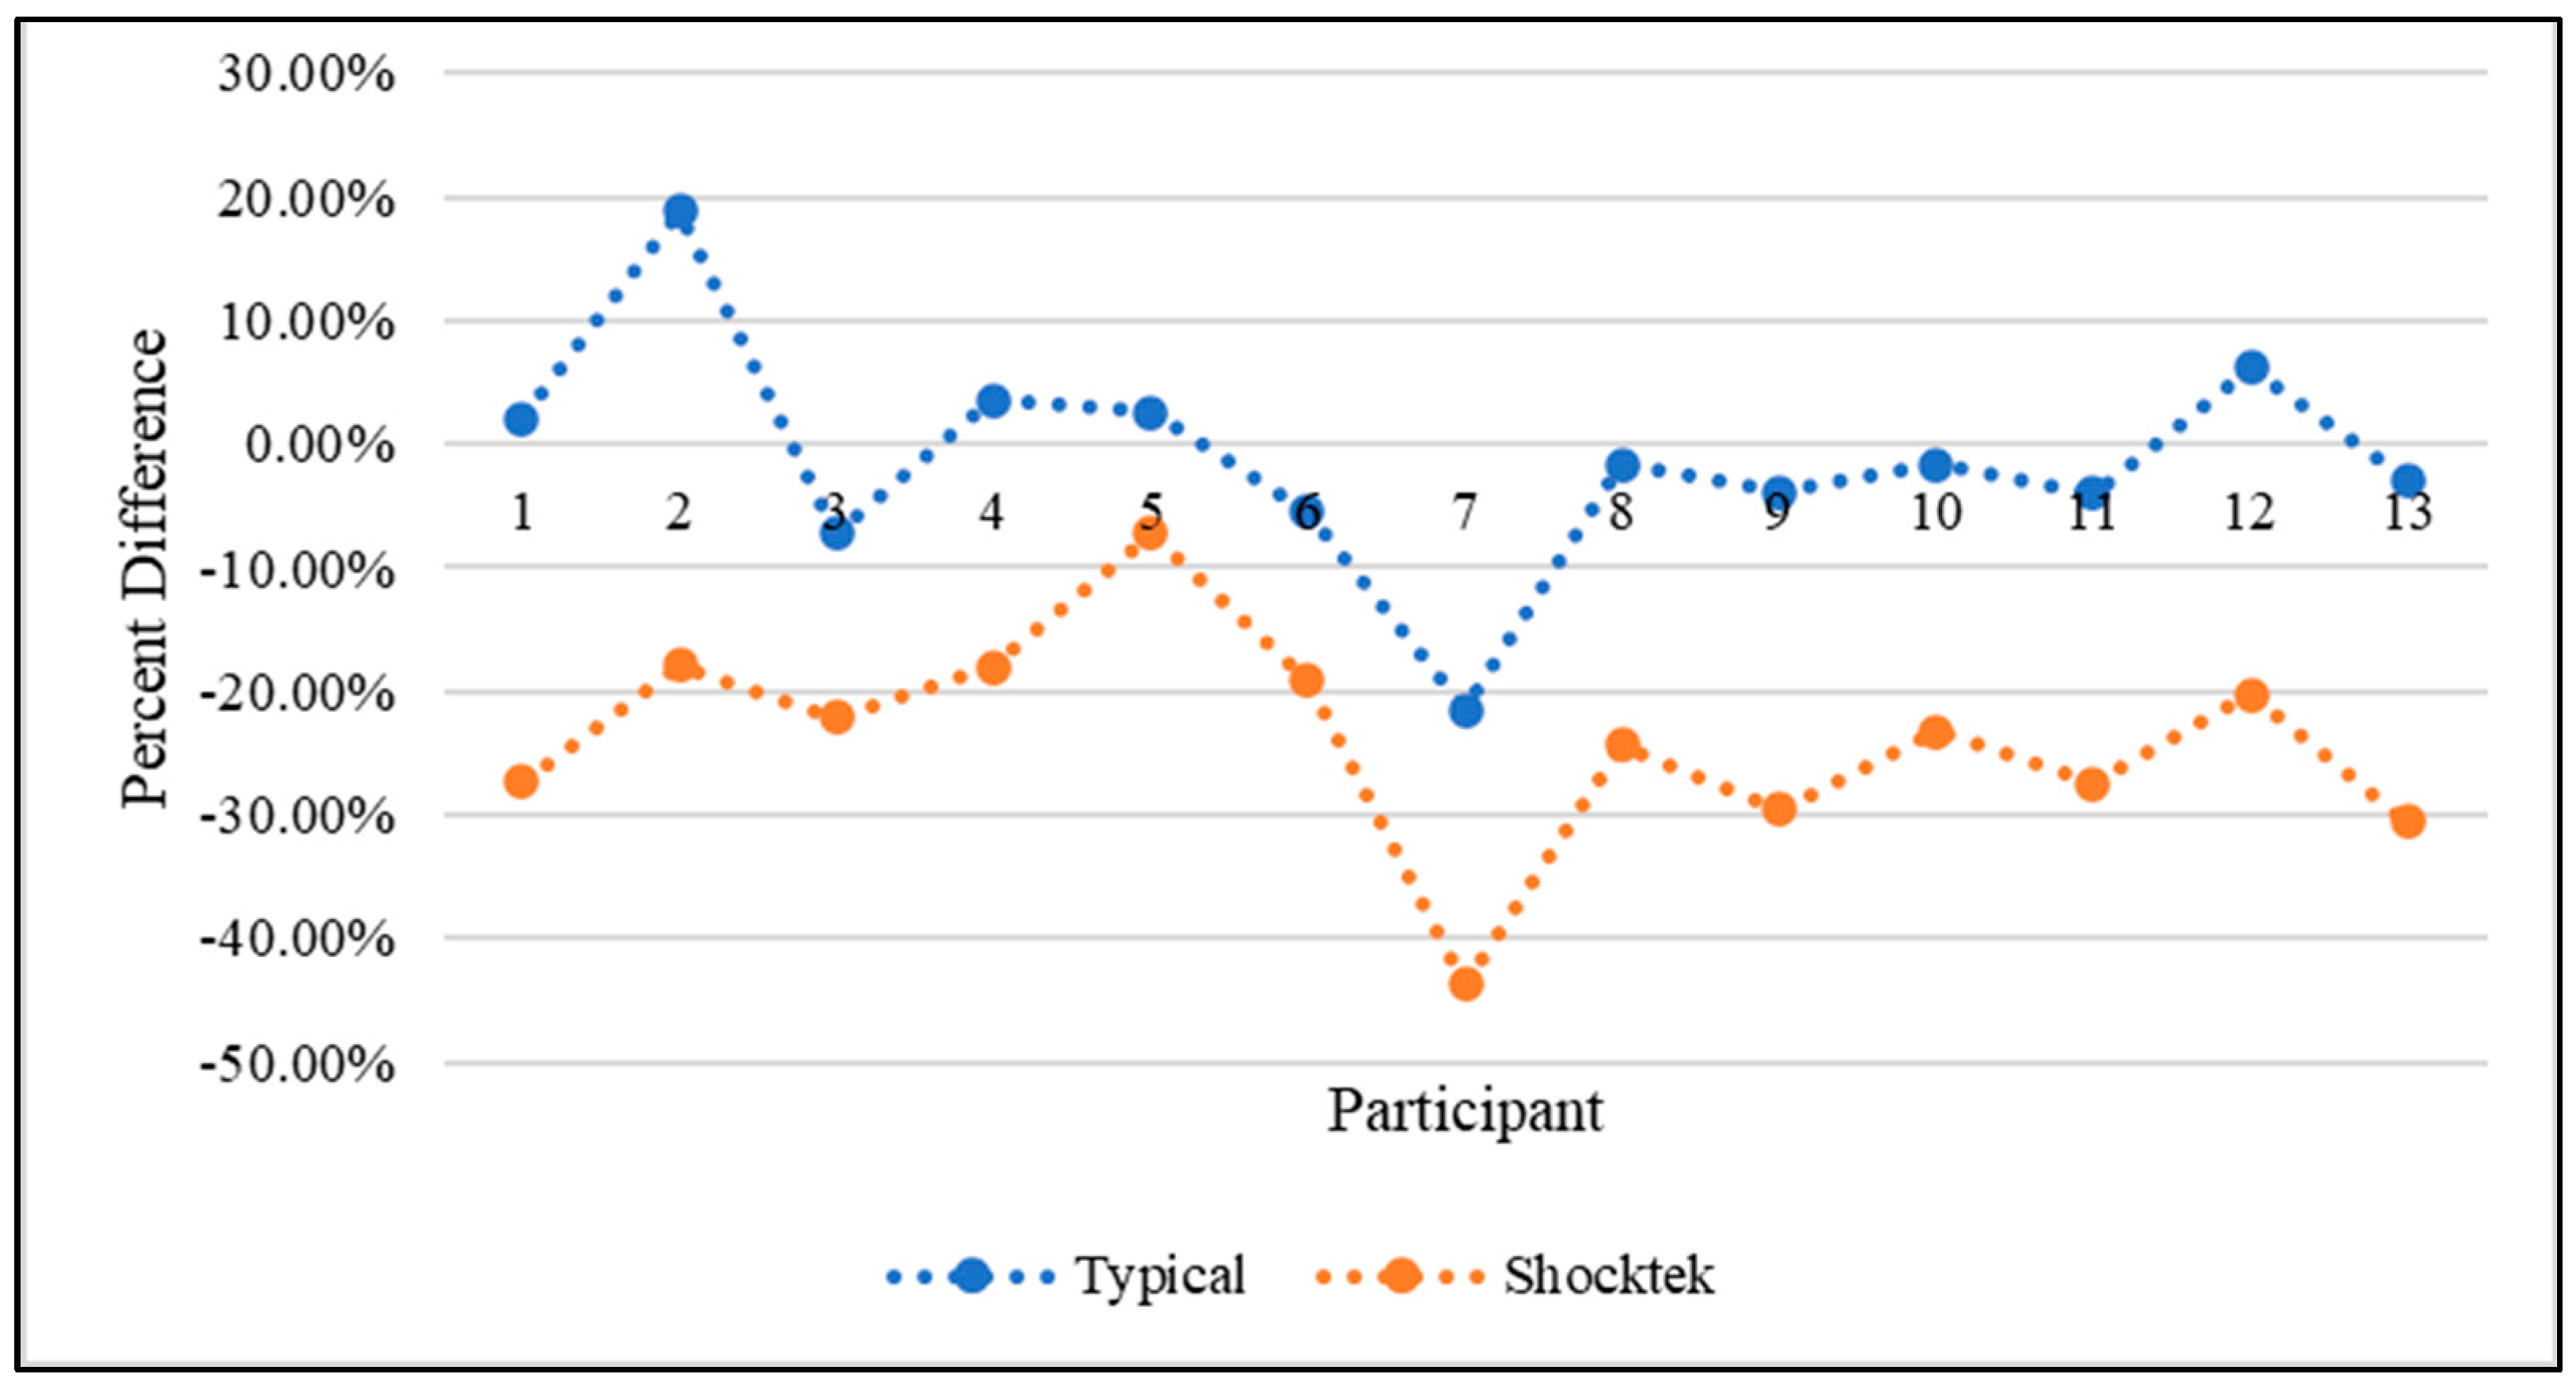
The mean pressure exerted across the carpal tunnel region for all subjects was 59.47 kPa (range: 29.78–72.10 kPa) for bare hands, constituting only 6.81% of the total pressure exerted across the entire hand on the handlebar, as discussed in the previous section. Despite variations in subjects’ weights and heights, the recorded pressures demonstrated a higher degree of consistency compared with those observed with typical gloves. This trend is illustrated in the box and whisker plots in Figure 13 and summarized in Table 3. While the mean pressure slightly decreases for typical gloves to an average value of 58.73 kPa, the range increases, spanning from 30.85 to 78.94 kPa. In contrast, the mean pressure diminishes for Shock·Tek™ gloves, averaging 44.87 kPa (range: 24.43–57.46 kPa), marking a 23.92% decrease in pressure in the carpal tunnel area of interest compared with bare hands. Figure 14 illustrates the percentage difference in the carpal tunnel area of interest between bare hands and each glove type. The data indicated that, for all subjects, the Shock·Tek™ gloves consistently resulted in a greater reduction in pressure compared with the typical gloves. Conversely, in most instances, the typical gloves exhibited either negligible or minimal impact on pressure within the carpal tunnel region.
Wilks’s lambda test revealed a significant interaction between the overall response and condition (F = 37.84; p ≤ 0.0001). The following paired t-test revealed a statistically significant interaction between the Shock·Tek™ gloves and both bare hands and typical gloves. However, no significant interaction was found between bare hands and typical gloves concerning the carpal tunnel area of interest. Detailed test statistics are provided in Table 4.

3.1.3. Median Nerve Area of Interest

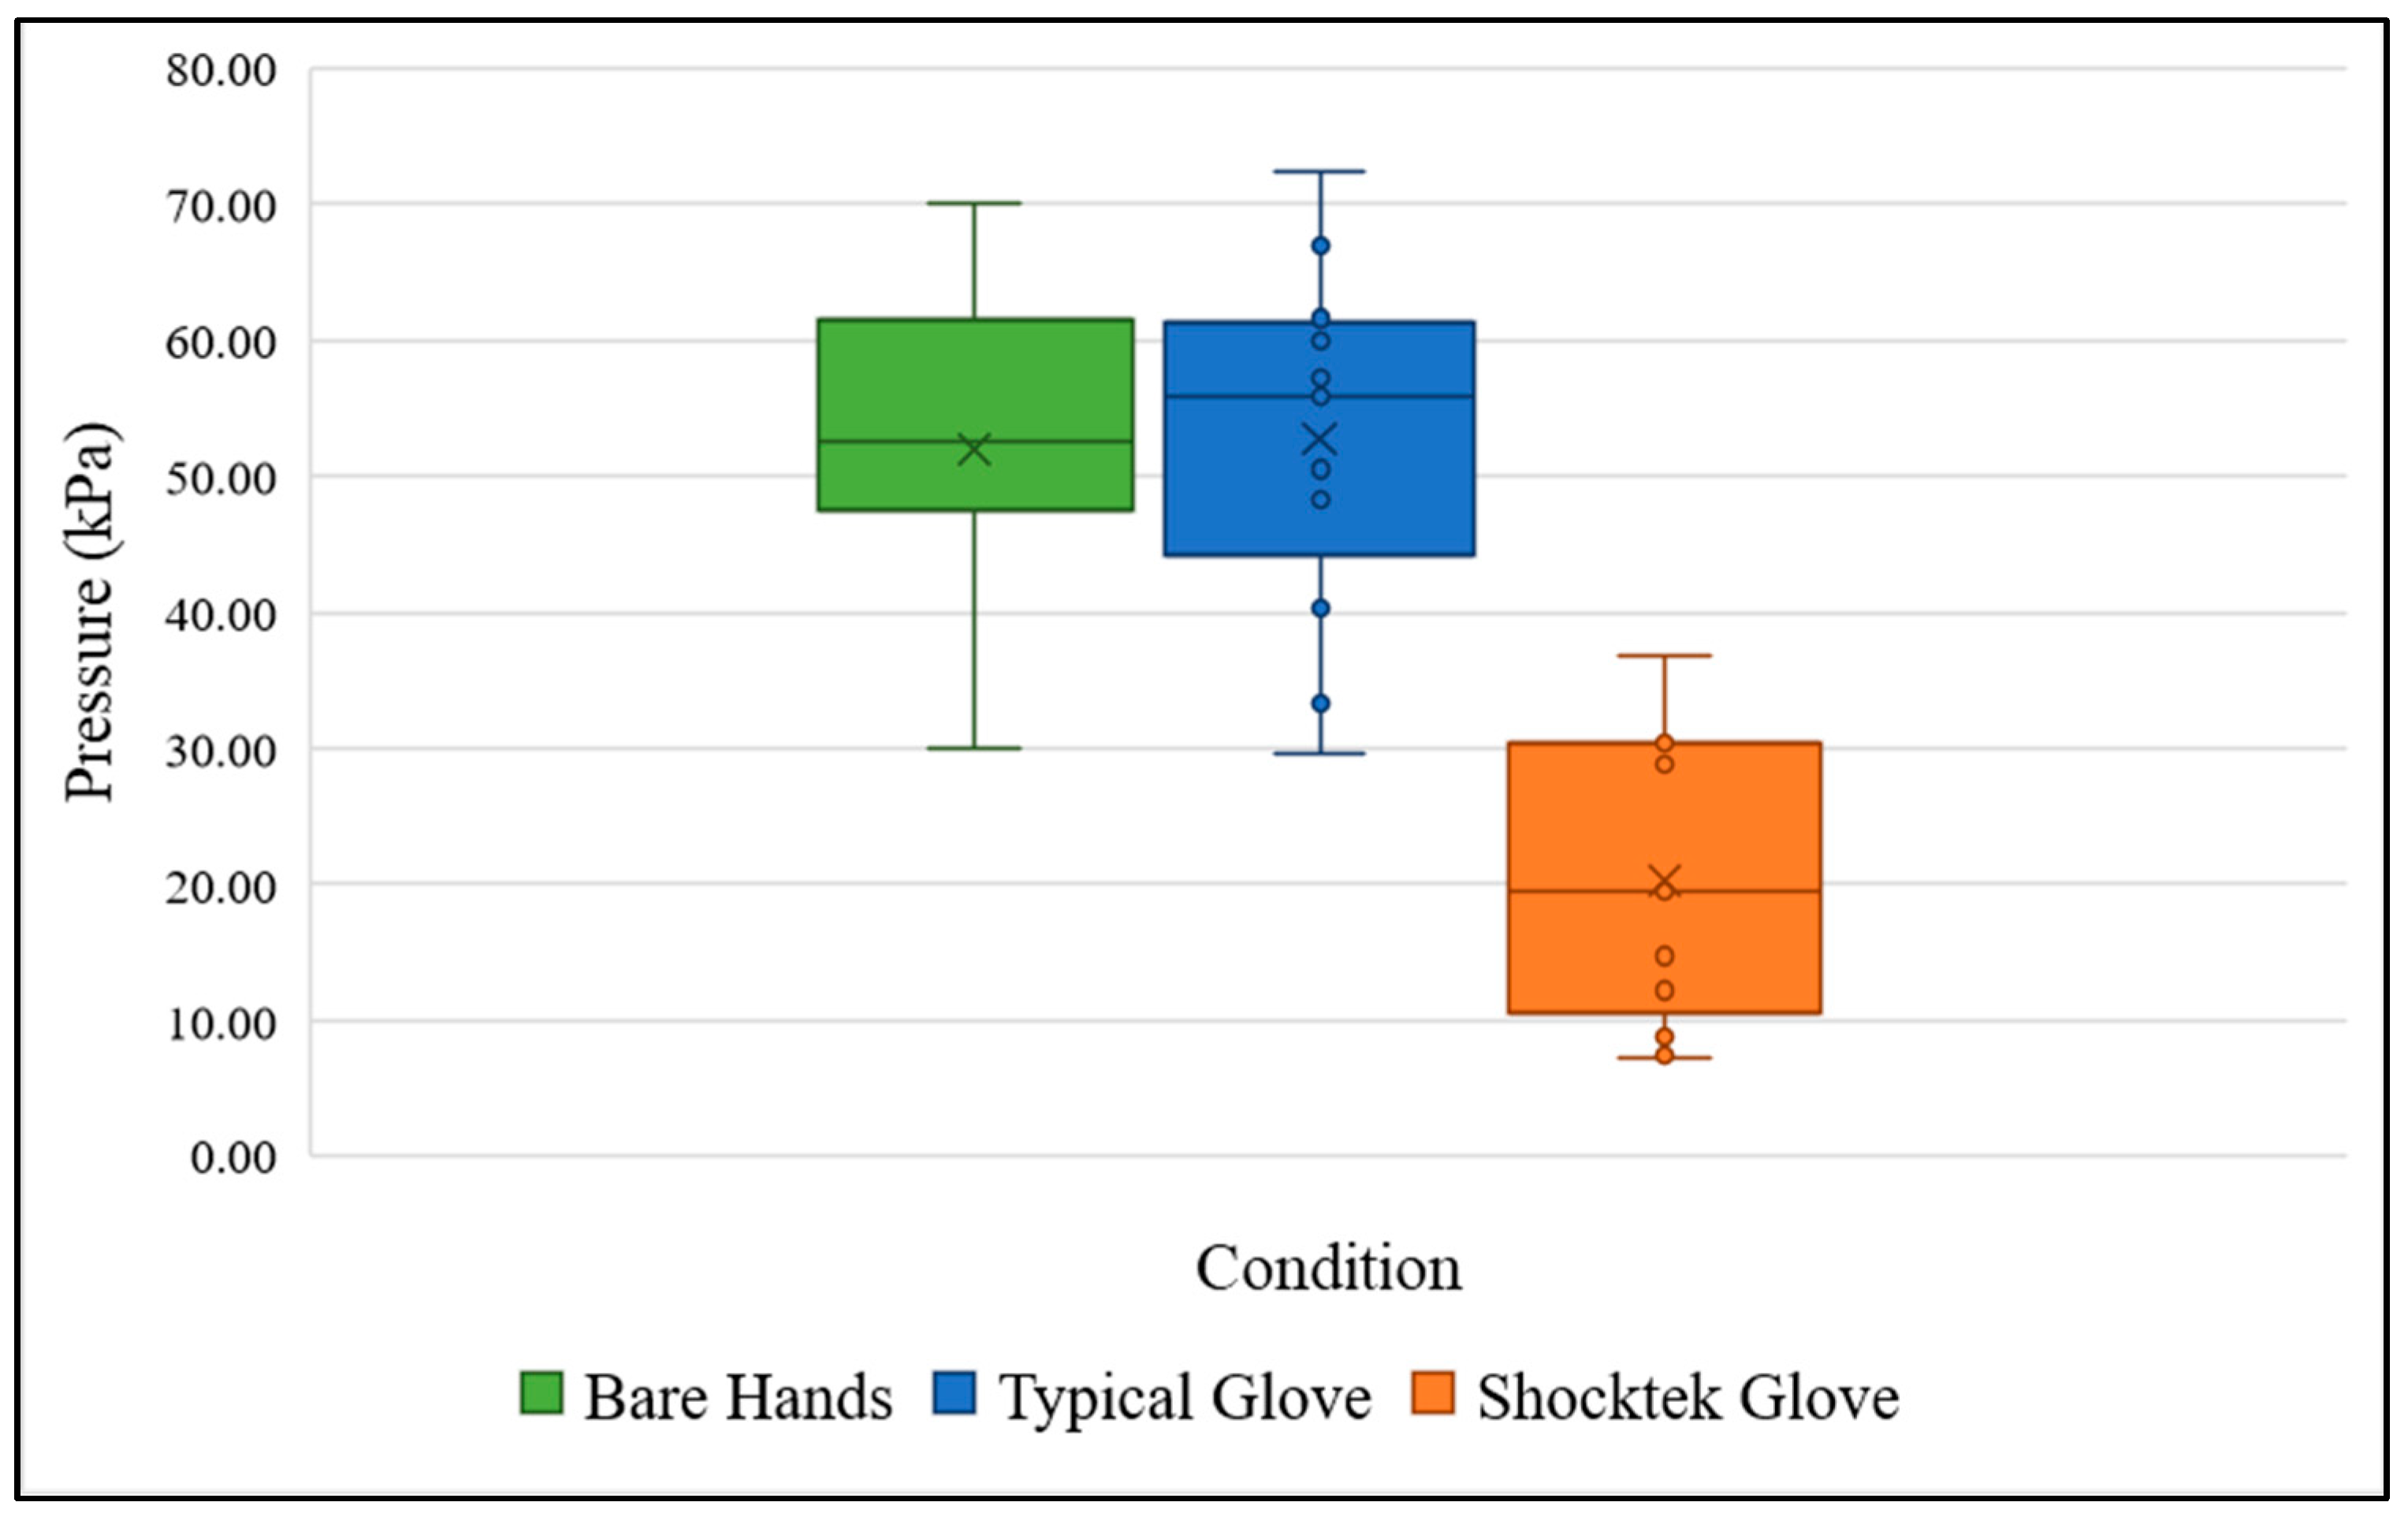
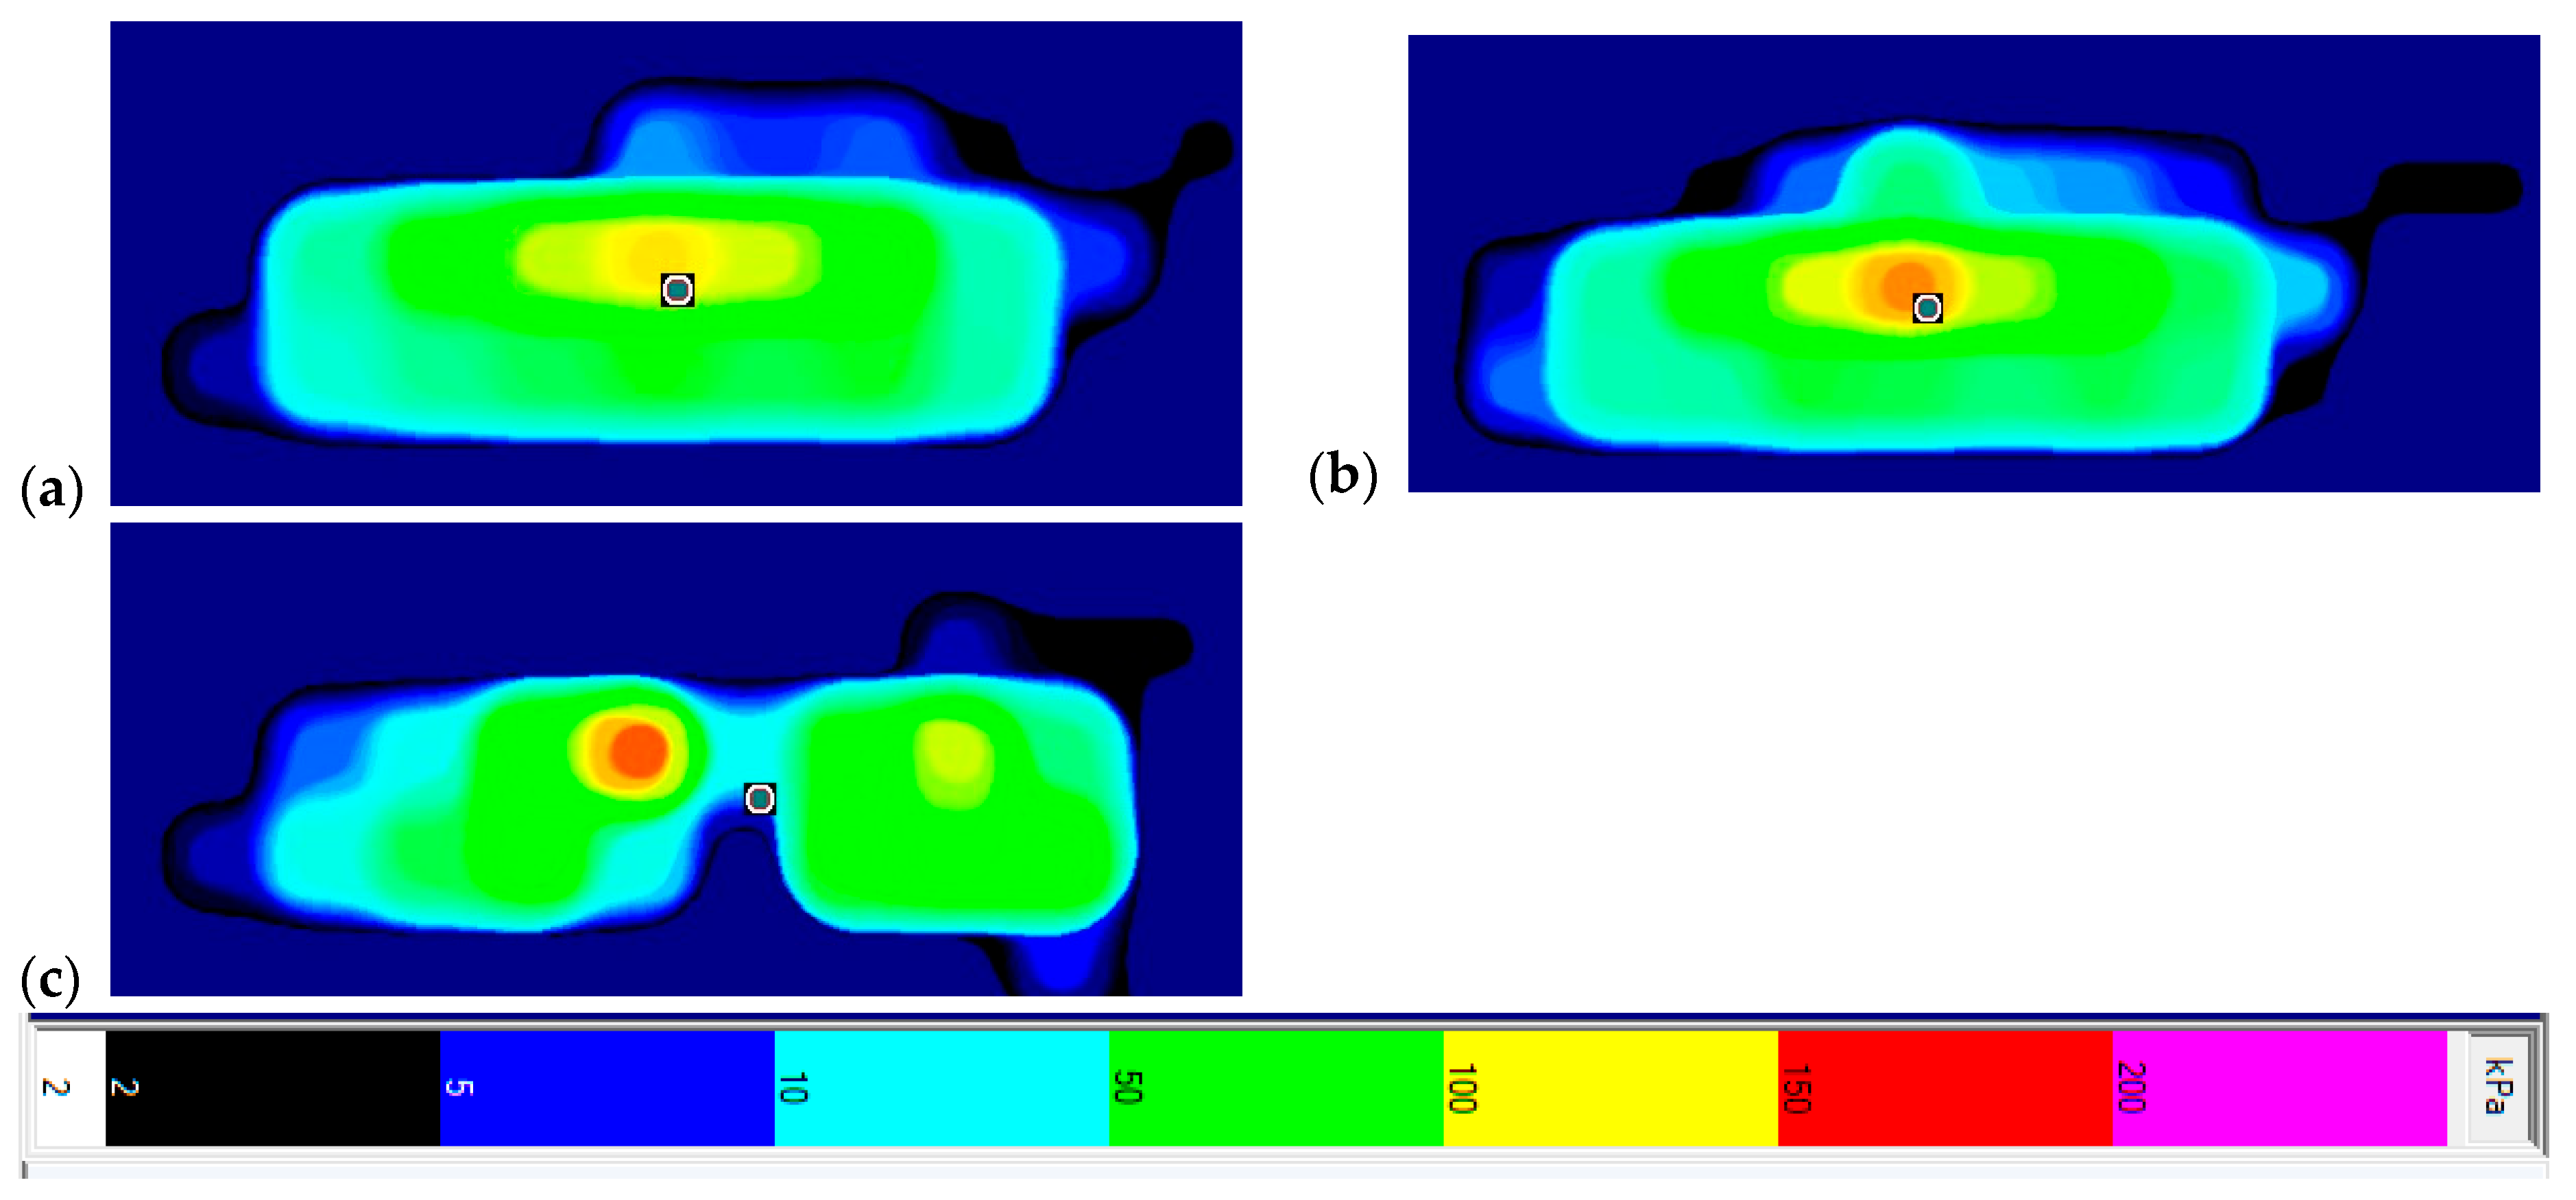
As previously discussed, the median nerve traverses through the palm of the hand between the thenar and hypothenar eminences and is positioned centrally within the carpal tunnel. This strategic location allows it to innervate various muscles and transmit sensory information to the thumb, index, middle, and half of the ring finger. Notably, as depicted in Figure 15, this region coincides with the peak-pressure zone observed for both bare hands and typical gloves. Within this area of interest, the average pressure across all subjects was 51.96 kPa (range: 30.02–70.12 kPa). The typical gloves demonstrated no significant impact on the pressure in the area of interest, with an average pressure of 52.72 kPa (range: 29.64–72.34 kPa). However, the Shock·Tek™ gloves did produce a significant impact on the difference in pressure, with an average pressure of 20.23 kPa (range: 7.26–36.83 kPa). A statistical summary of the data is in Table 5.
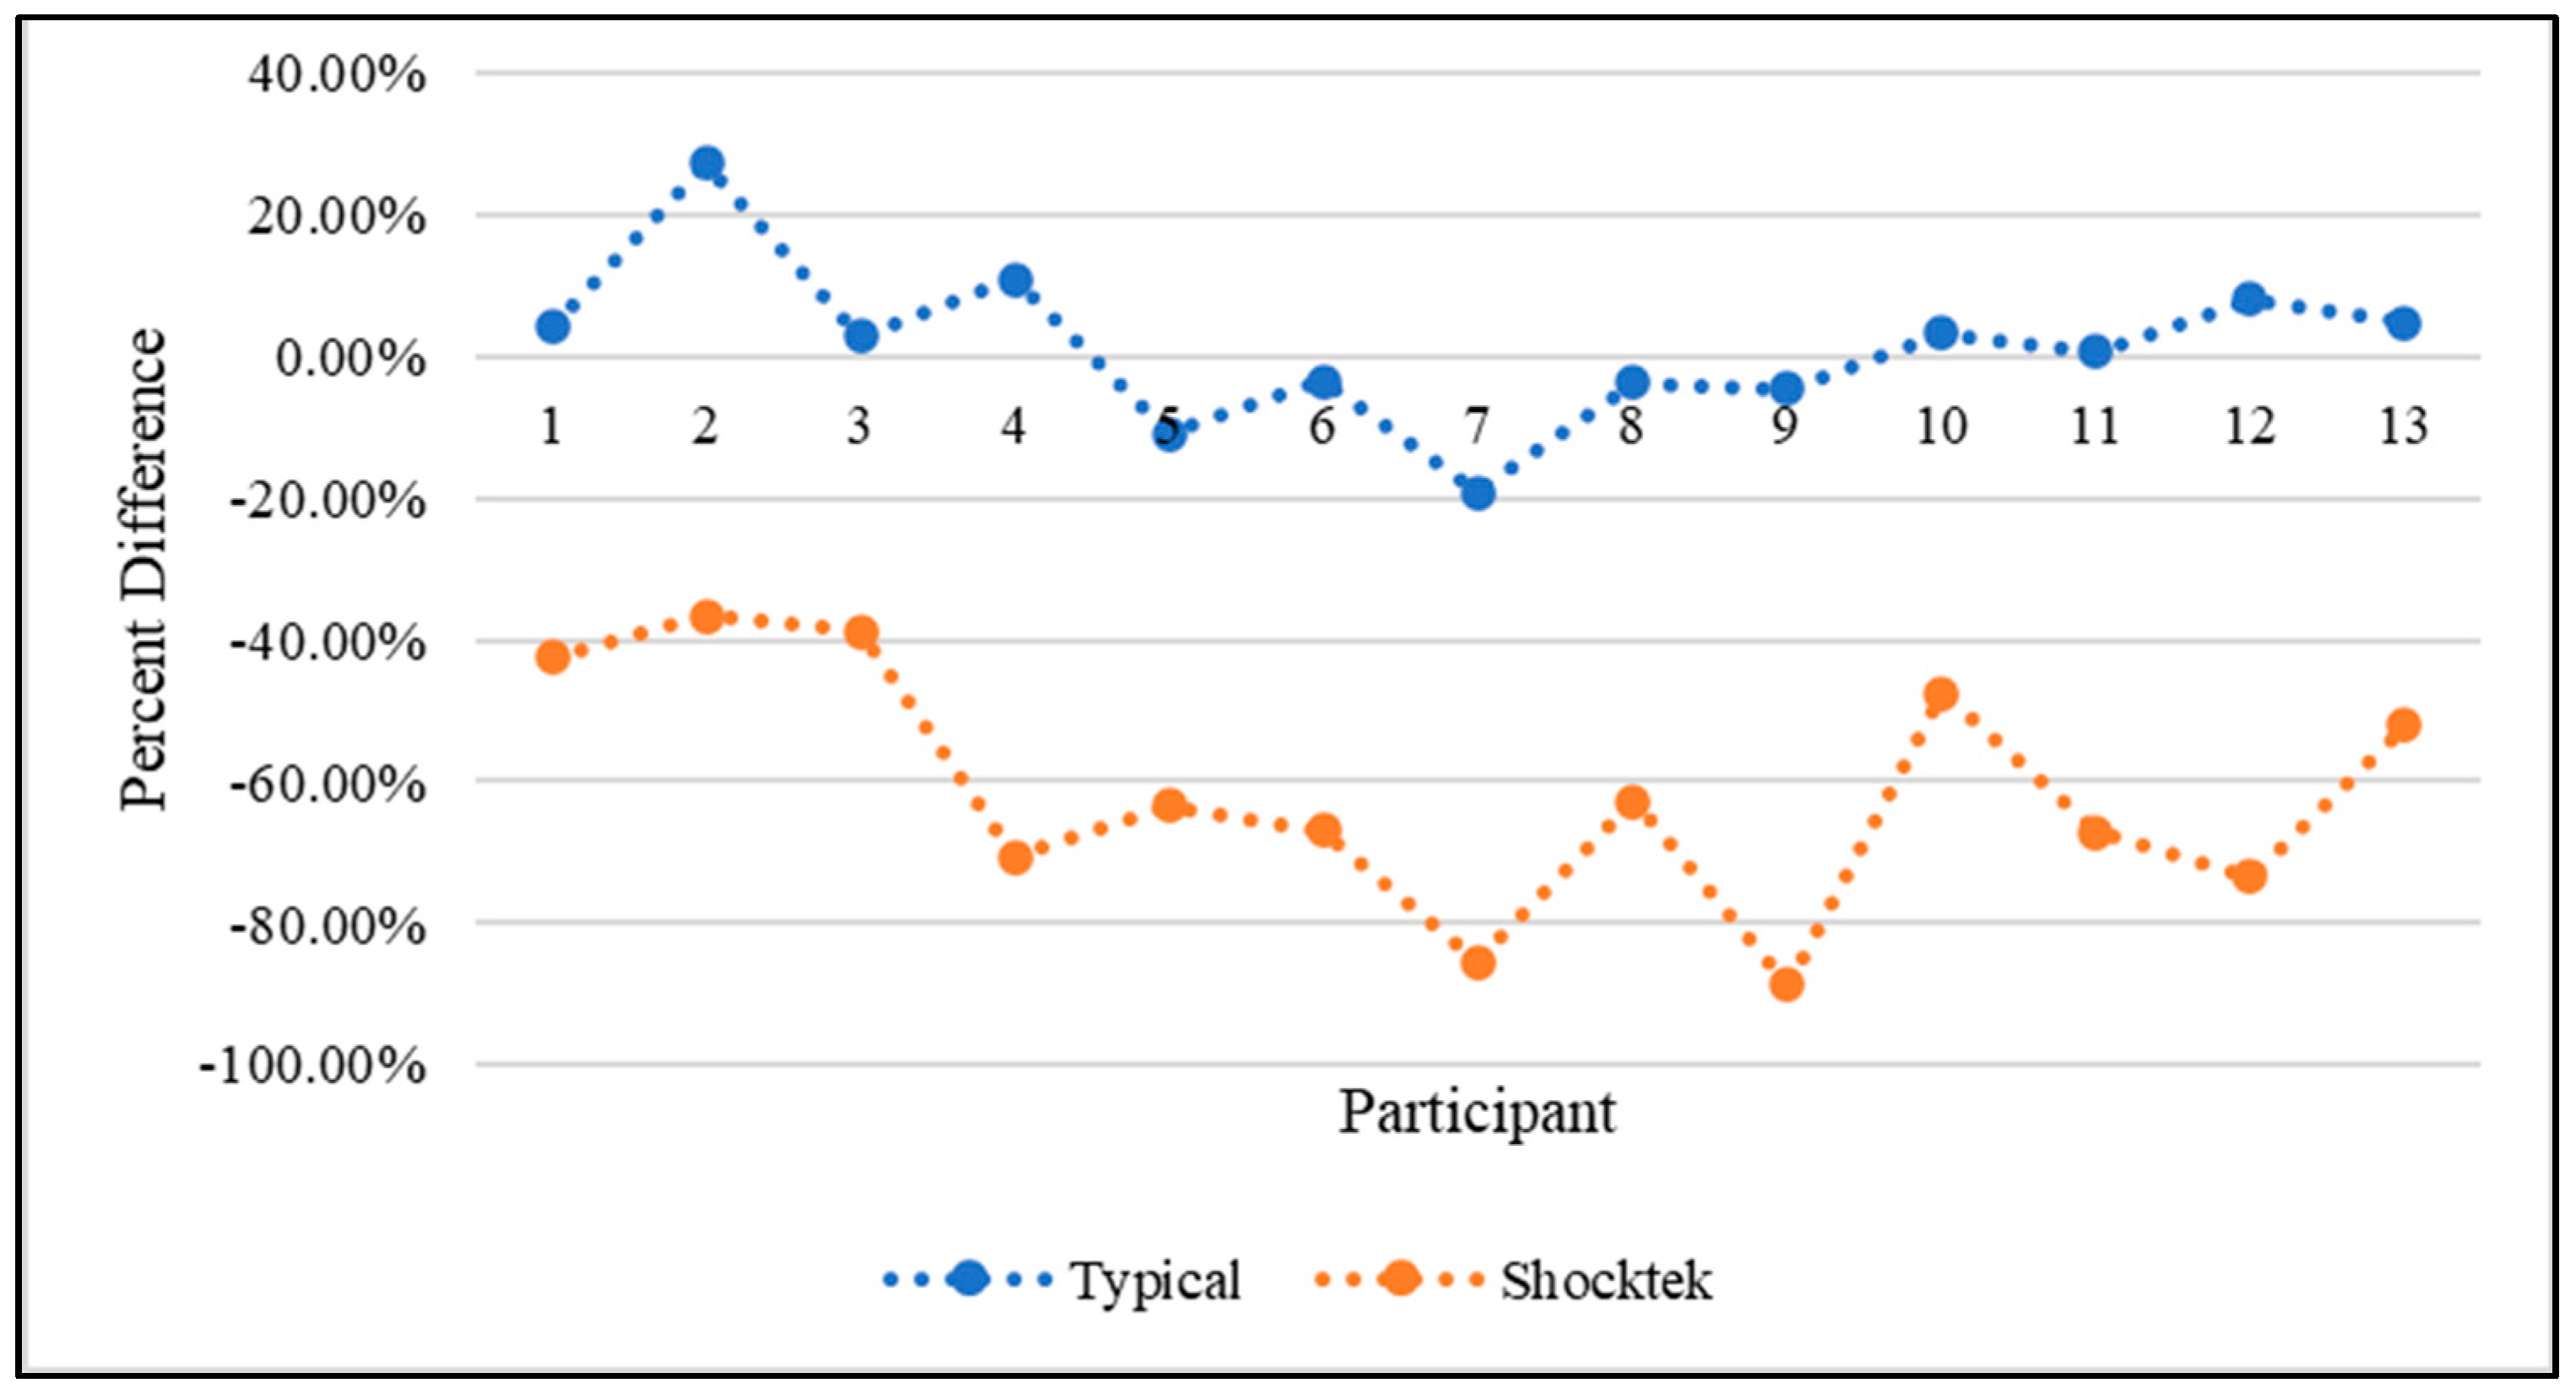
The Shock·Tek™ gloves exhibited an average pressure reduction of 61.17% compared with bare hands. Notably, two subjects experienced a pressure reduction of more than 80% when using the Shock·Tek™ gloves, as observed in Figure 16. Conversely, the typical gloves showed an average pressure increase of 1.54%. Moreover, one subject experienced a 27.27% pressure increase in the median nerve area while cycling with typical gloves, contrasting with a 36.52% decrease observed when using the Shock·Tek™ gloves.
Wilks’s lambda test revealed a significant interaction between the overall response and condition (F = 71.27; p < 0.0001), with a larger test statistic compared with the carpal tunnel region. Post hoc paired-sample comparisons indicated no significant difference between bare hands and typical gloves regarding the projected median nerve region. In contrast, significant differences were observed between the Shock·Tek™ gloves and both bare hands and typical gloves, as summarized in Table 6. The two-dimensional pressure topographies (Figure 17) illustrate the diminished pressure in the median nerve area. Both bare hands and the typical gloves exhibited the highest pressure at the center of the palm, coinciding with the center of pressure, while the rest of the palm displayed a gradient of decreasing pressure outward from the center. In certain cases, the typical gloves accentuated the sharpness of the peak pressure, while in others, they distributed the elevated pressure more evenly across the center.
For some subjects with more muscular hands, the peak pressure appeared on the thenar eminence. However, when the Shock·Tek™ gloves were employed, a cavity of lower pressure emerged within the area of interest. In some instances, the center of pressure remained relatively stable across the three conditions, while in others, it shifted medially when using the Shock·Tek™ gloves. Additionally, the peak pressure appeared to relocate toward the thenar or hypothenar eminence, as observed in the examples provided below.

3.2. Comparison of Pressures Between Males and Females (Exploratory Only)

While the sample size was insufficient to draw definitive conclusions regarding sex-related differences in surface pressure at the hand–glove–handlebar interface, exploratory sex-stratified analyses were performed to identify potential trends for further investigation. Wilks’s lambda test indicated significant response-by-condition effects when sex was added as a grouping variable, as summarized in Table 7. Because of the small subgroup sizes, these findings should be interpreted cautiously.
Follow-up pairwise/simple-effects contrasts were then used to compare glove conditions within each sex group. These exploratory contrasts are reported as F-statistics in Table 8 and Table 9. Multiple pairwise comparisons were interpreted using a Bonferroni-adjusted significance threshold; this adjustment did not change the pattern of statistically significant and non-significant findings. No significant difference was observed between bare hands and typical gloves for either sex group. In contrast, significant differences were observed between the Shock·Tek™ gloves and both bare hands and typical gloves.
These findings suggest that females may impart a higher load on the central area of their palm compared with males, thereby elucidating the greater benefit observed in the median nerve region among females. Meanwhile, males have a greater F-statistic when looking at the carpal tunnel area of interest seen in Table 9. This may be due to variations in muscular mass across the palms. The wider area of study when evaluating the carpal tunnel region may have captured the higher areas of muscle on the palm. A further study with a sufficient sample size is warranted to corroborate these findings and draw more definitive conclusions.

4. Discussion

CTS is a prevalent condition arising from compression or irritation of the median nerve within the wrist’s carpal tunnel. With symptoms ranging from numbness to weakness in hand muscles, CTS poses a substantial burden, affecting about 3.8% of the population. Cycling may exacerbate CTS symptoms due to prolonged pressure on the thenar region of the hand. Previous research has primarily examined the ulnar nerve, whereas the present pilot study focused on surface pressure over the projected median nerve/carpal tunnel region during stationary cycling.
As a pilot study, the objectives were to (1) evaluate the feasibility of using pressure mapping to quantify glove-related pressure redistribution during cycling; (2) identify key variables and potential confounding factors requiring improved control in future studies, including comfort/discomfort, posture, cycling experience, hand position, and anthropometric variability; and (3) provide preliminary estimates of pressure variability and effect magnitude between bare hands, conventional biking gloves, and Shock·Tek™ gloves to inform a larger confirmatory study. Therefore, the findings should be interpreted as exploratory and hypothesis-generating rather than confirmatory evidence of clinical efficacy.
The primary finding was that the Shock·Tek™ gloves reduced surface pressure over the projected median nerve/carpal tunnel region at the hand–glove–handlebar interface compared with bare hands and typical padded gloves during short-duration stationary cycling. The multivariate analysis highlighted a redistribution of pressure with the Shock·Tek™ gloves, with reduced surface pressure in the central portion of the palm. Given prior studies showing a relationship between palmar surface pressure and internal carpal tunnel pressure [17,18], these findings may provide useful preliminary evidence for future studies examining whether surface pressure redistribution corresponds to changes in tissue-level or intracarpal loading.
However, because the pressure sensor was positioned at the hand–glove–handlebar interface, the measured values reflect the combined effects of glove mechanical properties, contact area, padding distribution, material stiffness, and participant grip behavior. Therefore, these interface pressure measurements should not be interpreted as direct measurements of pressure within biological tissues, intracarpal tunnel pressure, or on the median nerve itself.
Although pressure was offloaded from the projected median nerve area with the Shock·Tek™ gloves, the corresponding increase in pressure on the thenar/hypothenar regions may increase loading in other areas of the palm, including regions relevant to the ulnar nerve and carpometacarpal joint [6,11]. In addition, some participants reported that the Shock·Tek™ gloves felt hard or rigid, which may have influenced grip strategy, voluntary load bearing, or unloading of uncomfortable regions. This could partly explain the reduction in central palm pressure and the corresponding increase in pressure toward the thenar/hypothenar regions. Because comfort/discomfort was not quantified in this pilot study, the relative contributions of glove design versus behavioral adaptation cannot be determined from the present data. Overall, these exploratory findings suggest that glove design can influence surface pressure distribution at the hand–glove–handlebar interface during stationary cycling. Further research is needed to determine whether these interface pressure changes persist under longer-duration and real-world cycling conditions and whether they are associated with clinically meaningful changes in symptoms or tissue-level loading.

4.1. Study Limitations

This study was conducted with a small sample of 13 subjects; therefore, all conclusions and statistical inferences should be considered preliminary. The use of repeated-measures MANOVA in this small pilot sample, particularly with exploratory sex-stratified analyses, may reduce the stability of the estimated covariance structure and limit statistical power. Therefore, the sex-stratified findings should be interpreted only as exploratory trends for future investigation rather than confirmatory evidence of sex-related differences.
Pressure was measured at the hand–glove–handlebar interface rather than directly on the skin, within the carpal tunnel, or on the median nerve. The “median nerve region” was anatomically estimated using external landmarks and sensor alignment rather than individually confirmed using ultrasound or other localization methods. In addition, comfort/discomfort, grip strategy, wrist posture, cycling experience, and anthropometric factors were not systematically controlled or modeled. The short, low-intensity stationary cycling protocol may also limit generalizability to outdoor recreational or sport cycling conditions.

4.2. Future Work

Future studies should
(1)
Include a larger, adequately powered sample and consider statistical approaches better suited to small or unbalanced repeated-measures data, such as linear mixed-effects models or separate repeated-measures ANOVAs with appropriate correction for multiple comparisons.
(2)
Test to ensure inclusion of controlled characterization of participant anthropometrics, hand position, posture, cycling experience, and sex-related differences.
(3)
Standardize comfort/discomfort ratings, such as with a visual analog scale (VAS) or Likert scale, to determine whether perceived glove comfort influences pressure redistribution.
(4)
Incorporate more precise localization of the median nerve region, consider direct or indirect measures of tissue-level loading where feasible, and examine whether the observed surface pressure patterns persist during long-duration or outdoor cycling conditions involving fatigue, vibration, terrain variation, and prolonged handlebar loading.

5. Conclusions

Our exploratory pilot study met all of our objectives, and preliminary trends seem to support our hypothesis. It showed that
  • Pressure mapping is an acceptable method to quantify glove-related pressure redistribution during cycling.
  • As expected, there seem to be confounding variables, including comfort/discomfort, posture, cycling experience, hand position, and anthropometric variability.
  • Preliminary estimates of pressure variability and effect magnitude between bare hands, conventional biking gloves, and Shock·Tek™ gloves showed a statistically significant variation between Shock·Tek™ gloves and both bare hands and conventional biking gloves.
As we hypothesized, the preliminary results suggest Shock·Tek™ gloves yielded a 61% reduction in pressure in the projected median nerve region at the hand–glove–handlebar interface during short-duration stationary cycling. This provides preliminary evidence that our hypothesis is confirmed and provides a method for using pressure mapping to quantify glove-related pressure redistribution during cycling.
Future confirmatory studies should incorporate a larger, adequately powered sample and consider confounding variables for improved control, such as participant anthropometrics, hand position, posture, cycling experience, rider comfort, and sex-related differences. Future studies should also include a more precise localization of the median nerve region, consider direct or indirect measures of tissue-level loading where feasible, and examine whether the observed surface pressure patterns persist during long-duration or outdoor cycling conditions involving fatigue, vibration, terrain variation, and prolonged handlebar loading.

Supplementary Materials

The following supporting information can be downloaded at: https://www.mdpi.com/article/10.3390/biomechanics6030077/s1: S1: Informed Consent, S2: Screening Questionnaire, S3: Participant Information Form, S4: Subject Information, S5: Data Collection Sheet.

Author Contributions

Conceptualization, W.R., G.W., Y.L. and J.B.; methodology, W.R., G.W., Y.L. and J.B.; software, G.W. and Y.L.; validation, W.R. and G.W.; formal analysis, W.R., G.W. and Y.L.; investigation, W.R., G.W. and Y.L.; resources, W.R., Y.L. and J.B.; data curation, G.W.; writing—original draft preparation, W.R. and G.W.; writing—review and editing, W.R., Y.L. and J.B.; visualization, G.W.; supervision, W.R. and Y.L.; project administration, G.W. All authors have read and agreed to the published version of the manuscript.

Funding

This research received no external funding.

Institutional Review Board Statement

This study was approved by the Institutional Review Board of Grand Valley State University (IRB; 24-113-H-GVSU).

Informed Consent Statement

Informed consent was obtained from all subjects involved in this study.

Data Availability Statement

The raw data supporting the conclusions of this article will be made available by the authors on request.

Acknowledgments

The authors thank Shock·Tek™ (Shock·Tek™, Inc.) for providing the Shock·Tek™ gloves used in this study. The authors also thank the study participants for their time and participation.

Conflicts of Interest

The authors declare no conflicts of interest.

References

  1. Genova, A.; Dix, O.; Saefan, A.; Thakur, M.; Hassan, A. Carpal Tunnel Syndrome: A Review of Literature. Cureus 2020, 12, e7333. [Google Scholar] [CrossRef] [Scilit]
  2. Dahlin, L.B.; Zimmerman, M.; Calcagni, M.; Hundepool, C.A.; van Alfen, N.; Chung, K.C. Carpal tunnel syndrome. Nat. Rev. Dis. Prim. 2024, 10, 37. [Google Scholar] [CrossRef] [Scilit]
  3. Rotaru-Zavaleanu, A.-D.; Lungulescu, C.V.; Bunescu, M.G.; Vasile, R.C.; Gheorman, V.; Gresita, A.; Dinescu, V.C. Occupational Carpal Tunnel Syndrome: A scoping review of causes, mechanisms, diagnosis, and intervention strategies. Front. Public Health 2024, 12, 1407302. [Google Scholar] [CrossRef] [Scilit]
  4. Viikari-Juntura, E.; Silverstein, B. Role of physical load factors in carpal tunnel syndrome. Scand. J. Work Environ. Health 1999, 25, 163–185. Available online: https://www.jstor.org/stable/40966886 (accessed on 14 May 2026). [CrossRef] [Scilit]
  5. Wertsch, J.; Melvin, J. Median nerve anatomy and entrapment syndromes: A review. Arch. Phys. Med. Rehabil. 1983, 63, 623–627. [Google Scholar]
  6. Sirisena, D.; Sim, S.; Lim, I.; Rajaratnam, V. Median and Ulnar Nerve Injuries in Cyclists: A Narrative Review. BioMedicine 2021, 11, 1–12. [Google Scholar] [CrossRef] [Scilit]
  7. Schwellnus, M.; Derman, E. Common injuries in cycling: Prevention, diagnosis and management. S. Afr. Fam. Pract. 2005, 47, 14–19. [Google Scholar] [CrossRef] [Scilit]
  8. Chiaramonte, R.; Pavone, P.; Musumeci, G.; Rosa, M.D.; Vecchio, M. Preventive strategies, exercises and rehabilitation of hand neuropathy in cyclists: A systematic review. J. Hand Ther. 2022, 35, 164–173. [Google Scholar] [CrossRef] [Scilit]
  9. Sharrak, S.; Das, J.M. Hand Nerve Compression Syndromes(Archived). In StatPearls; StatPearls Publishing: Treasure Island, FL, USA, 2026. Available online: http://www.ncbi.nlm.nih.gov/books/NBK547683/ (accessed on 25 June 2026).
  10. Scigliano, N.M.; Goetz, J.E.; Fleury, I.G.; Dibbern, K.N.; Petrachaianan, K.; Buckwalter, V.J.A. The effect of full-body weight-bearing on palmar pressure distribution in collegiate-level gymnasts. Sports Biomech. 2024, 23, 3301–3311. [Google Scholar] [CrossRef] [Scilit]
  11. Slane, J.; Timmerman, M.; Ploeg, H.-L.; Thelen, D.G. The influence of glove and hand position on pressure over the ulnar nerve during cycling. Clin. Biomech. 2011, 26, 642–648. [Google Scholar] [CrossRef] [Scilit]
  12. Akuthota, V.; Plastaras, C.; Lindberg, K.; Tobey, J.; Press, J.; Garvan, C. The Effect of Long-Distance Bicycling on Ulnar and Median Nerves: An Electrophysiologic Evaluation of Cyclist Palsy. Am. J. Sports Med. 2005, 33, 1224–1230. [Google Scholar] [CrossRef] [Scilit]
  13. Dąbrowska, A.; Paluch, Ł.; Pietruski, P.; Walecka, I.; Noszczyk, B. The elastography of distal ulnar nerve branches in cyclists. J. Hand Ther. 2024, 37, 53–59. [Google Scholar] [CrossRef] [Scilit]
  14. Fardelin, G.; Ricklund, N.; Bryngelsson, I.-L. Hand nerve function after mountain bike cycling. J. Sci. Cycl. 2022, 11, 23–32. [Google Scholar] [CrossRef] [Scilit]
  15. Ali, E.; Delamont, R.S.; Jenkins, D.; Bland, J.D.P.; Mills, K.R. Bilateral recurrent motor branch of median nerve neuropathy following long-distance cycling. Clin. Neurophysiol. 2013, 124, 1258–1260. [Google Scholar] [CrossRef] [Scilit]
  16. Patterson, J.M.M.; Jaggars, M.M.; Boyer, M.I. Ulnar and Median Nerve Palsy in Long-distance Cyclists: A Prospective Study. Am. J. Sports Med. 2003, 31, 585–589. [Google Scholar] [CrossRef] [Scilit]
  17. Cheng, Y.-S.; Zhou, B.; Kubo, K.; An, K.-N.; Moran, S.L.; Amadio, P.C.; Zhang, X.; Zhao, C. Comparison of two ways of altering carpal tunnel pressure with ultrasound surface wave elastography. J. Biomech. 2018, 74, 197–201. [Google Scholar] [CrossRef] [Scilit]
  18. Lundborg, G.; Gelberman, R.H.; Minteer-Convery, M.; Lee, Y.F.; Hargens, A.R. Median nerve compression in the carpal tunnel—Functional response to experimentally induced controlled pressure. J. Hand Surg. 1982, 7, 252–259. [Google Scholar] [CrossRef] [Scilit]
  19. Cobb, T.K.; An, K.-N.; Cooney, W.P. Externally applied forces to the palm increase carpal tunnel pressure. J. Hand Surg. 1995, 20, 181–185. [Google Scholar] [CrossRef] [Scilit]
  20. Soubeyrand, M.; Melhem, R.; Protais, M.; Artuso, M.; Crézé, M. Anatomy of the median nerve and its clinical applications. Hand Surg. Rehabil. 2020, 39, 2–18. [Google Scholar] [CrossRef] [Scilit]
  21. Boik, R.J. The Mixed Model for Multivariate Repeated Measures: Validity Conditions and an Approximate Test. Psychometrika 1988, 53, 469–486. [Google Scholar] [CrossRef] [Scilit]
Figure 1. Palm of tested gloves: (a) Glove A, with evenly distributed padding indicated as separate pads 1–4 of equal thickness, and (b) Glove B, which omits padding in the central hand area (outlined with red stitching) to facilitate median nerve offloading.
Biomechanics 06 00077 g001
Figure 2. Sensor placement on bike (sensor indicated by red arrows).
Biomechanics 06 00077 g002
Figure 3. Hand placement on sensor.
Biomechanics 06 00077 g003
Figure 4. Biking position.
Biomechanics 06 00077 g004
Figure 5. Visual Representation of Testing Cycle.
Biomechanics 06 00077 g005
Figure 6. Software-generated center of pressure (left) and marked center (right).
Biomechanics 06 00077 g006
Figure 7. Example of identified maximum in cycles analyzed.
Biomechanics 06 00077 g007
Figure 8. Carpal tunnel area of interest on Glove B and on output pressure data at the hand–glove–handlebar interface.
Biomechanics 06 00077 g008
Figure 9. Median nerve area of interest on Glove B and on output pressure data at the hand–glove–handlebar interface.
Biomechanics 06 00077 g009
Figure 10. Spread of pressure data for the summation of pressure across the 13 subjects.
Biomechanics 06 00077 g010
Figure 11. Percent difference in summation of pressure from bare hands to glove type.
Biomechanics 06 00077 g011
Figure 12. Sample one of three-dimensional pressure topographies from cycling trial: (a) bare hands, (b) typical gloves, and (c) Shock·Tek™ gloves. The thumb is located on the left, and the little finger is located on the right.
Biomechanics 06 00077 g012
Figure 13. Spread of pressure data for the carpal tunnel area of interest across the 13 subjects.
Biomechanics 06 00077 g013
Figure 14. Percent difference in carpal tunnel area of interest from bare hands to glove type.
Biomechanics 06 00077 g014
Figure 15. Spread of pressure data for the median nerve area of interest across the 13 subjects.
Biomechanics 06 00077 g015
Figure 16. Percent difference in median nerve area of interest from bare hands to glove type.
Biomechanics 06 00077 g016
Figure 17. Two-dimensional pressure topographies from cycling trial: (a) bare hands, (b) typical gloves, and (c) Shock·Tek™ gloves. The thumb is located on the left, and the little finger is located on the right. The blue dot on the figures represents the center of pressure.
Biomechanics 06 00077 g017
Table 1. Summary of pressure data for the summation of pressure across the 13 subjects.
Bare HandsTypical GlovesShock·Tek™ Gloves
Average (kPa)873.49968.54835.49
Standard deviation (kPa)214.44247.04209.94
Maximum (kPa)1314.331446.001269.67
Minimum (kPa)369.33427.00394.00
Percent difference-10.97%−3.99%
Table 2. F-statistic and p-values for the total pressure across the 13 subjects.
Fp
Bare hands vs. typical gloves45.96<0.0001
Bare hands vs. Shock·Tek™ gloves6.440.0161
Typical gloves vs. Shock·Tek™ gloves58.24<0.0001
Table 3. Summary of pressure data for the carpal tunnel area of interest across the 13 subjects.
Bare HandsTypical GlovesShock·Tek™ Gloves
Average (kPa)59.4758.7344.87
Standard deviation (kPa)12.2413.599.43
Maximum (kPa)72.1078.9457.46
Minimum (kPa)29.7830.8524.43
Percent difference in ave.-−1.15%−23.92%
Table 4. F-statistics and p-values for the carpal tunnel area of interest across the 13 subjects.
Fp
Bare hands vs. typical gloves0.360.5531
Bare hands vs. Shock·Tek™ gloves117.00<0.0001
Typical gloves vs. Shock·Tek™ gloves107.46<0.0001
Table 5. Summary of pressure data for the median nerve area of interest across the 13 subjects.
Bare HandsTypical GlovesShock·Tek™ Gloves
Average (kPa)51.9652.7220.23
Standard deviation (kPa)11.5212.6610.21
Maximum (kPa)70.1272.3436.83
Minimum (kPa)30.0229.647.26
Percent difference in ave.-1.54%−61.17%
Table 6. F-statistic and p-values for the median nerve area of interest across the 13 subjects.
Fp
Bare hands vs. typical gloves0.360.5538
Bare hands vs. Shock·Tek™ gloves213.96<0.0001
Typical gloves vs. Shock·Tek™ gloves293.04<0.0001
Table 7. Results from Wilks’s lambda test on the impact of sex.
MeasureGlobal TestComparison TypeF p
Summation of pressuresResponse × Sex × ConditionOverall2.360.0568
Response × ConditionFemale8.760.0003
Response × ConditionMale16.59<0.0001
Carpal tunnel regionResponse × Sex × ConditionOverall3.120.0181
Response × ConditionFemale10.85<0.0001
Response × ConditionMale131.13<0.0001
Median nerve regionResponse × Sex × ConditionOverall4.270.0035
Response × ConditionFemale41.14<0.0001
Response × ConditionMale53.75<0.0001
Table 8. F-statistics and p-values for the median nerve area of interest comparing males and females.
FemalesMales
FpFp
Bare hands vs. typical gloves0.000.97021.020.3272
Bare hands vs. Shock·Tek™ gloves140.81<0.000191.37<0.0001
Typical gloves vs. Shock·Tek™ gloves220.90<0.0001124.19<0.0001
Table 9. F-statistics and p-values for the carpal tunnel area of interest comparing males and females.
FemalesMales
FpFp
Bare hands vs. typical gloves0.160.68950.300.5919
Bare hands vs. Shock·Tek™ gloves37.03<0.0001163.81<0.0001
Typical gloves vs. Shock·Tek™ gloves31.71<0.0001147.62<0.0001
Disclaimer/Publisher’s Note: The statements, opinions and data contained in all publications are solely those of the individual author(s) and contributor(s) and not of MDPI and/or the editor(s). MDPI and/or the editor(s) disclaim responsibility for any injury to people or property resulting from any ideas, methods, instructions or products referred to in the content.