Abstract
Background/Objectives: Outcomes following Anterior Cruciate Ligament (ACL) reconstruction vary widely among patients, yet existing classification techniques often lack transparency and clinical interpretability. To address this gap, we developed a multi-modal framework that integrates gait dynamics with patient-specific characteristics to enhance personalized assessment of ACL reconstruction outcomes. Methods: Participants, both post-ACL reconstruction and healthy controls, were equipped with inertial measurement unit (IMU) sensors on bilateral wrists, ankles, and the sacrum during standardized locomotion tasks. Using the Phase Slope Index (PSI), we quantified causal relationships between sensor pairs, hypothesizing that (1) PSI-derived metrics capture discriminative biomechanical interactions; (2) task-specific differences in segment coordination patterns influence model performance; and (3) recovery duration modulates classifier confidence and the structure of high-dimensional data distributions. Classification models were trained using PSI features, and permutation-based sensor importance analyses were conducted to interpret task-specific biomechanical contributions. Results: PSI-based classifiers achieved 96.37% accuracy in distinguishing ACL reconstruction outcomes, validating the first hypothesis. Permutation importance revealed that jogging tasks produced more focused importance distributions across fewer sensor pairs while improving accuracy, confirming task-specific coordination effects (hypothesis two). Visualization via t-SNE demonstrated that longer recovery durations corresponded to reduced model confidence but more coherent feature clusters, supporting the third hypothesis. Conclusions: By integrating causal gait metrics and patient recovery profiles, this approach enables interpretable and high-performing ACL outcome prediction. Quantitative evaluation measures—including model confidence and t-SNE cluster coherence—offer clinicians objective tools for personalized rehabilitation monitoring and data-driven return-to-sport decisions.
1. Introduction
ACL reconstruction represents one of the most common orthopedic surgical interventions in sports medicine, with profound implications for athletes’ careers and long-term health outcomes. The prevalence of these injuries spans across competitive levels and sporting disciplines, creating significant challenges for rehabilitation specialists and orthopedic surgeons [1]. Beyond the immediate impact of extended absence from athletic participation, ACL injuries substantially increase patients’ susceptibility to developing early-onset osteoarthritis and related degenerative conditions [2]. With approximately 250,000 ACL reconstruction procedures performed annually in the United States [3], the cumulative effect encompasses not only individual health trajectories but also broader implications for athletic team dynamics, healthcare resource allocation, and the economic burden associated with long-term treatment and potential disability. The complexity of recovery patterns and variability in rehabilitation outcomes necessitates more sophisticated approaches to assessment and personalized treatment planning.
The evaluation of post-surgical outcomes and sport-readiness following ACL reconstruction has historically relied on conventional clinical protocols [4]. Sports medicine practitioners typically employ a battery of assessments including physical stability examinations, isometric and isokinetic strength testing, and various performance-based measures alongside subjective patient questionnaires [5]. Despite their widespread clinical implementation, these traditional evaluation frameworks demonstrate substantial limitations in detecting subtle biomechanical deficiencies that persist throughout rehabilitation [5]. A fundamental inadequacy of these approaches lies in their inability to capture the interconnected nature of whole-body movement adaptations—potentially overlooking compensatory mechanisms that may predispose athletes to re-injury or suboptimal performance upon return to sport [6]. These assessment limitations create significant challenges for one of the most critical decisions in ACL rehabilitation: determining when athletes are ready to return to sport. Return-to-sport decision-making following ACL reconstruction represents one of the most challenging aspects of clinical management, with significant consequences for both patient safety and athletic performance. Current protocols rely predominantly on time-based criteria and basic strength measurements, yet research indicates that 20–30% of athletes who meet these conventional clearance standards experience subsequent re-injury or suboptimal performance [7]. The lack of objective, standardized criteria for assessing movement quality creates inconsistency among clinicians, with some practitioners being overly conservative while others may clear athletes prematurely [8]. This variability in clinical decision-making contributes to both unnecessary prolonged rehabilitation periods and increased risk of secondary injuries. The disconnect between isolated clinical measures and integrated functional performance underscores the necessity for advanced analytical methodologies that better reflect the complex nature of human movement during athletic activities.
The integration of wearable sensing technology represents a paradigm shift in ACL reconstruction assessment methodology, with researchers deploying inertial measurement units (IMUs) to objectively quantify movement patterns throughout rehabilitation [9]. These compact sensor systems generate detailed biomechanical data streams during standardized mobility tasks, revealing subtle movement abnormalities that typically escape visual clinical assessment [10]. Studies extract comprehensive feature sets from these recordings, including temporal and frequency-domain parameters [11,12], which serve as inputs to machine learning algorithms that classify ACL reconstruction outcomes with significantly higher accuracy than traditional clinical assessments [13]. Multiple studies have demonstrated that sensor-derived classifications achieve superior sensitivity in detecting residual functional deficits compared to conventional testing protocols [14,15,16]. However, despite their enhanced discriminative capabilities, these computational approaches face substantial implementation challenges in clinical settings. The inherent complexity of machine learning models creates “black box” systems whose decision processes remain inscrutable to healthcare providers [17]. This lack of algorithmic transparency represents a critical barrier to clinical adoption, as practitioners require clear explanations to justify treatment modifications or return-to-sport recommendations based on computational outputs. The interpretability gap therefore limits the practical utility of these technically superior assessment methods in everyday clinical decision-making.
To overcome the machine learning “black box” limitations in ACL reconstruction assessment frameworks, we propose an innovative confidence-aware dimensionality reduction approach that synthesizes multi-modal movement analysis from IMU sensors with individual patient characteristics. Our methodology aims to enhance both classification performance and interpretability of recovery outcomes while offering extra insights into post-surgical movement adaptations. We hypothesized the following:
- Phase Slope Index metrics derived from multi-sensor IMU data streams effectively quantify the causal biomechanical relationships between paired body segments during locomotion tasks, providing discriminative features that substantially enhance the classification accuracy of ACL reconstruction outcomes.
- Different functional activities reveal distinct patterns of body segment coordination importance, with certain locomotion tasks presenting varying complexity levels for identifying reconstruction outcomes.
- Recovery duration as a patient-specific factor correlates with model confidence levels and influences high-dimensional data distribution properties, potentially revealing patterns in movement adaptation and recovery progression.
Our research makes several notable contributions to the field of ACL reconstruction assessment and rehabilitation monitoring. These advances address critical gaps in both the technical capabilities and clinical interpretability of movement analysis for surgical outcome evaluation, ultimately providing a more comprehensive framework for personalized rehabilitation planning and return-to-sport decision-making. The specific contributions include the following:
- Demonstrates the efficacy of Phase-Slope-Index-derived causal relationships between body segments as discriminative features for ACL reconstruction classification, achieving exceptional predictive performance (96.37% accuracy) using optimized machine learning algorithms.
- Uncovers task-specific patterns in sensor-pair importance across different locomotion activities, revealing that jogging protocols elicit more concentrated feature importance distributions compared to walking assessments—potentially providing more distinct biomechanical signatures for classification purposes.
- Establishes quantitative relationships between rehabilitation duration and algorithmic classification confidence, revealing that longer recovery periods correspond with reduced predictive certainty as patients’ movement patterns progressively normalize toward pre-injury states.
- Introduce an innovative visualization and analysis framework that integrates dimensionality reduction with confidence metrics, demonstrating that extended rehabilitation periods correlate with both improved cluster coherence in t-SNE projections and decreased model confidence in distinguishing ACL reconstruction outcomes—effectively creating a quantifiable methodology for tracking functional recovery trajectories and supporting evidence-based return-to-sport decisions
2. Methods
In this section, we provide a comprehensive overview of our research methodology, designed to tackle the issue of poor interpretability in ACL predictive modeling, and the overview of our approach workflow is shown in Figure 1. This section includes the design of our experimental protocol, details on participant demographics, the data preprocessing pipeline, and our proposed explainable framework.

Figure 1.
Five IMU sensors were placed on participants’ left and right wrists, left and right ankles, and sacrum (Figure 2) to capture walking and jogging movements. Data were segmented into 10 s windows, and Phase Slope Index (PSI) was used to compute causality matrices, forming feature sets for machine learning models predicting ACL reconstruction outcomes. We tested three hypotheses: (H1) PSI features enhance predictive performance; (H2) sensor-pair importance differs between walking and jogging, reflecting task-specific gait adaptations; and (H3) recovery duration correlates with model confidence and movement consistency, assessed via t-SNE visualization and cluster coherence metrics.

Figure 2.
We placed five IMU sensors on participants’ bodies (left wrist, right wrist, left ankle, right ankle, and sacrum) to capture movement during walking and jogging tasks.
2.1. Experimental Protocol and Participant Demographics
Our study recruited two groups of participants: individuals with a history of ACL injury and healthy controls. We recruited a total of 79 participants, comprising 74 ACL patients (31 with left knee injuries and 43 with right knee injuries) and 5 healthy individuals. The demographic information, including number of participants, sex, median months of recovery, median height (cm), and median weight (cm), for both groups are presented in Table 1. ACL participants were recruited through orthopedic sports medicine clinics and included individuals aged 18–35 years who had undergone primary ACL reconstruction surgery at least 4 months prior to testing, were cleared for treadmill activity by their treating physician, and had no concurrent lower extremity injuries or neurological conditions affecting gait. Healthy controls were recruited from the university community and required no history of ACL injury, lower extremity surgery, or current musculoskeletal complaints that could influence normal locomotion patterns.

Table 1.
Demographic data of participants.
The deliberate emphasis on ACL reconstruction patients (n = 74) compared to healthy controls (n = 5) reflects the primary clinical objective of this study: developing interpretable models for distinguishing between different ACL injury presentations and recovery trajectories rather than simply detecting injury presence. This composition aligns with real-world clinical scenarios where practitioners primarily evaluate patients who have already undergone reconstruction, focusing on laterality assessment, recovery progression, and return-to-sport readiness rather than initial injury detection. While the class imbalance limits direct healthy-versus-injured comparisons, it enables robust analysis of clinically relevant distinctions within the ACL population, including left-versus-right injury classification (n_left = 31 vs. n_right = 43) and recovery duration effects. The smaller healthy control group provides sufficient reference data for establishing baseline movement patterns and validating that our PSI-based features can distinguish reconstructed from normal gait, while the larger patient cohort ensures adequate statistical power for the primary clinical classifications of interest. This design prioritizes clinical utility over balanced classification, acknowledging that post-reconstruction assessment tools are more immediately applicable to sports medicine practice than general injury screening instruments.
Data collection was performed using a set of five Shimmer IMU sensors. These sensors were strategically placed on each participant’s body (left wrist, right wrist, left ankle, right ankle, and sacrum). These positions were selected to capture both proximal (sacrum as center of mass) and distal (wrists and ankles) movement patterns, enabling comprehensive assessment of inter-limb coordination and compensatory movement strategies that may not be detectable through isolated thigh or shank measurements alone. Each IMU sensor recorded both accelerometer and gyroscope data, providing comprehensive information about the participants’ movements. The data were collected at a sampling rate of 128 Hz to ensure detailed motion capture.
The experimental protocol consisted of two sequential tasks:
- Walking Task: Participants were instructed to walk on a treadmill at a constant speed of 3 mph (4.8 km/h) for a duration of 5 min. This task was designed to capture gait patterns during normal walking conditions.
- Jogging Task: Immediately following the walking task, participants transitioned to a jogging phase. They were asked to jog on the treadmill at a speed of 6 mph (9.7 km/h) for 3 min. This task aimed to assess movement patterns during more dynamic activity.
2.2. Data Preprocessing
2.2.1. Synchronization
The first step in our preprocessing pipeline was the synchronization of data across the five IMU sensors and the segmentation of walking and jogging sequences. Given the distinct nature of walking and jogging movements, we employed a manual identification method to identify the transition between these activities. For each participant, we visually inspected the data from one sensor, typically the left ankle sensor, to identify the point where a drastic change in motion patterns occurred. This drastic shift in signal patterns corresponded to the transition from walking at 3 mph to jogging at 6 mph. Once this change-point was visually identified, we recorded the corresponding timestamp. This timestamp was then used as a reference point to precisely slice and separate the walking and jogging data sequences for all five sensors. To mitigate potential observer bias in the manual identification process, we applied a standardized buffer of ±5 s around each identified transition point to ensure consistent segmentation across all participants. This approach helped account for potential variability in visual assessment while maintaining reliable separation between walking and jogging phases. We repeated this process for each participant in the study, ensuring consistent synchronization across all subjects.
2.2.2. Window Segmentation
Following the synchronization and separation of walking and jogging phases, we proceeded with window segmentation of the data. First, we downsampled the data from 128 Hz to 64 Hz. This reduction in sampling rate was implemented to balance computational efficiency with data fidelity, as 64 Hz still provides sufficient temporal resolution to capture relevant human movement patterns while significantly reducing data volume and processing time. We then extracted 10 s windows across the raw data sequences for both walking and jogging phases, with no overlap between adjacent windows. We chose a 10 s window duration as it provides an optimal balance: it is long enough to capture multiple gait cycles and periodic movement patterns, yet short enough to maintain high temporal resolution and detect potential anomalies or variations in movement. This windowing strategy also aligns well with common practices in human activity recognition and the gait analysis literature [18]. However, other window sizes could potentially affect the outcome and we will explore this in our future work.
2.2.3. Pairwise Causality Matrix
To capture the complex interactions between different sensor readings, we calculated the Phase Slope Index to form a pairwise causality feature matrix. This feature matrix captures the causal relationships between different sensor dimensions across multiple sensors. The process involves the following steps applied to each 10 s window of sensor data:
- Frequency-Domain Transformation: For each time window and sensor dimension, we begin by applying the Fast Fourier Transform (FFT) to convert the time-domain signal into the frequency-domain. This transformation allows us to analyze how the signal’s energy is distributed across different frequencies, offering insights beyond what is visible in the time domain.
- Cross-Spectral Density: After obtaining the frequency-domain representation of each signal, we calculate the cross-spectral density (CSD) between pairs of sensor dimensions. The CSD provides a measure of how the frequency components of the two signals are correlated, helping to identify shared patterns or relationships at different frequencies.
- Phase Spectrum Computation: Using the cross-spectral density, we derive the phase spectrum. The phase spectrum reveals how the timing (or phase) of the two signals aligns across various frequencies, giving us a deeper understanding of the synchrony or lag between the signals.
- PSI Calculation: Next, we compute the PSI by performing a linear regression on the phase spectrum. The slope of this regression gives us the PSI, which indicates the direction and strength of the phase relationship between the signals. During this step, we focus on different frequency bands (e.g., 8 Hz, 16 Hz, 32 Hz) to determine the optimal frequency range for our analysis.
- Pairwise Causality Matrix Construction: To capture the relationships between all sensor dimensions, we build a pairwise causality matrix. Each element of this matrix represents the PSI value for a particular sensor pair and dimension. The matrix is structured to be antisymmetric, meaning that the reverse direction of the relationship is represented by the negative of the PSI value.
- Feature Vector Extraction: The upper triangular part of the pairwise causality matrix is flattened to create a feature vector, representing the causal relationships between all pairs of sensor dimensions.
With 5 sensors placed on the participant, each providing two types of readings (accelerometer and gyroscope), and each reading having three axes (x, y, z), there are a total of 30 dimensions for each participant window. To capture the interactions between each pair of these 30 dimensions, we compute the PSI for all sensor pairs, resulting in 435 unique features. This process is applied to each 10 s window for all participants and activities (walking and jogging), resulting in a standardized, high-dimensional feature space that effectively captures the dynamics of body movements.
2.3. Predictive Modeling
To investigate our first hypothesis and evaluate the efficacy of our PSI-based features, we implemented and compared five machine learning models: Support Vector Machine (SVM), Naive Bayes, Random Forest, K-Nearest Neighbors (KNN), and Neural Network. These models were applied to two binary classification tasks: left injured vs. right injured and injured vs. healthy. We employed 5-fold cross-validation for both walking and jogging phases independently, with data windows randomly shuffled to ensure unbiased sampling. To determine the optimal frequency range for our feature extraction, we conducted experiments with three maximum frequency cutoffs: 8 Hz, 16 Hz, and 32 Hz. This evaluation process allowed us to identify the most effective model for each classification task, analyze performance variations between movement phases, and determine the optimal frequency range for injury classification using PSI-based features.
2.4. Model Interpretation Framework
2.4.1. Task-Specific Sensor Pair Importance Analysis
To investigate our second hypothesis regarding task-specific gait adaptations following ACL reconstruction, we developed a sensor pair importance analysis method. We first calculated permutation importance scores from the trained model and mapped these back to their corresponding sensor dimensions. These scores were then aggregated by sensor pairs (e.g., left ankle to right ankle) and visualized using heatmaps for both walking and jogging conditions separately. This approach allowed us to directly compare the importance of specific sensor pair combinations between the two tasks. By examining the differences in the heatmaps between walking and jogging, we could identify which sensor pairs played more crucial roles in classification for each task, thereby revealing task-specific gait adaptations.
2.4.2. Feature Space Visualization and Cluster Coherence Analysis
To investigate our third hypothesis regarding patient-specific factors and their relationship with model behavior, we developed a comprehensive analytical approach combining dimensionality reduction visualization with quantitative cluster coherence assessment. Initially, we applied t-SNE to transform our high-dimensional PSI feature matrix into a two-dimensional representation, facilitating visualization of class distributions (injured vs. healthy, left vs. right injured) and enabling identification of potential subgroups within the data. This reduced-dimension projection provided a visual framework for examining how different patient characteristics might influence movement patterns.
We then implemented a cluster coherence quantification methodology to objectively measure the compactness of individual patient representations in the t-SNE space. For each participant, we collected all corresponding data points in the embedding and calculated a coherence score using mean intra-cluster distance:
where represents the set of t-SNE points belonging to patient i. Lower coherence scores indicate tighter clustering, reflecting more consistent movement patterns across multiple measurement windows for that individual. This metric provided a quantitative measure of movement variability that could be directly compared across patients and correlated with clinical factors.
In parallel, we analyzed the model’s classification confidence patterns by examining the probability distributions of predictions. We partitioned the t-SNE space into high-confidence and low-confidence regions based on the maximum class probability scores from the model. For each patient, we determined the proportion of their data points falling into these confidence regions and examined relationships between patient-specific characteristics (particularly recovery duration) and confidence distribution.
To identify potential patterns related to injury laterality and recovery time, we compared cluster coherence metrics across different patient subgroups, including healthy vs. injured and left vs. right injured, and by recovery duration intervals. We further incorporated limb dominance as a variable in our analysis to explore whether injuries to dominant versus non-dominant limbs resulted in different movement consistency patterns. This multi-faceted analytical approach was designed to reveal potential relationships between objective movement characteristics, rehabilitation timeframes, and the model’s ability to distinguish between different ACL reconstruction outcomes.
3. Results
3.1. Predictive Modeling Evaluation
Our comparative algorithmic assessment, visualized in Figure 3, evaluated the classification capabilities of multiple machine learning approaches (Support Vector Machine, Naive Bayes, Random Forest, K-Nearest Neighbors, and Neural Network) across three distinct frequency thresholds (8 Hz, 16 Hz, and 32 Hz). We conducted this evaluation for dual classification objectives—differentiating between left and right ACL injuries and distinguishing between healthy and injured participants—during both controlled walking and jogging protocols. The evaluation revealed substantial performance variation, with classification accuracy generally exceeding 80% for laterality discrimination and 90% for injury detection across most algorithmic approaches.
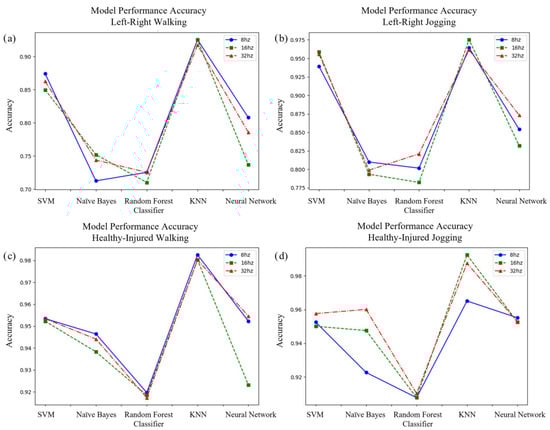
Figure 3.
Charts comparing the accuracy of SVM, Naive Bayes, Random Forest, KNN, and Neural Network classifiers in correctly labeling (a) left or right injury while walking, (b) left or right injury while jogging, (c) healthy or injured while walking, and (d) healthy or injured while jogging. The results show the KNN model using the 16Hz low-pass filtered data had the highest overall performance.
The K-Nearest Neighbors framework demonstrated superior performance metrics consistently throughout all experimental conditions. When classifying injury laterality during walking trials, this algorithm achieved approximately 93% accuracy when utilizing features from the 16 Hz frequency band. During jogging assessments for identical classification objectives, the performance improved marginally to approximately 95% accuracy. For the more fundamental task of discriminating between injured and healthy movement patterns, the KNN classifier exhibited exceptional performance, with approximately 98% accuracy during walking and nearly 99% accuracy during jogging protocols, both achieved with the 16 Hz frequency threshold. Although alternative algorithms—particularly SVM and Neural Network implementations—demonstrated competitive performance in specific contexts, especially for healthy–injured discrimination, their overall accuracy remained consistently below that of the KNN classifier and displayed greater variability across frequency thresholds. Our analysis identified the 16 Hz frequency band as optimal for PSI feature extraction across most classification scenarios, although performance differences between frequency thresholds were relatively minimal for the highest-performing algorithms.
To address potential class imbalance effects and provide comprehensive performance evaluation, we analyzed additional metrics beyond classification accuracy. The KNN classifier demonstrated robust performance across all evaluation criteria, achieving sensitivity of 92% and specificity of 94% for left–right injury classification during walking, improving to 95% sensitivity and 97% specificity during jogging. For healthy–injured discrimination, the model achieved sensitivity of 98% and specificity of 98% during walking, with a sensitivity of 99% and specificity of 99% during jogging protocols, maintaining high performance despite the pronounced class imbalance. The superior performance of KNN over more complex algorithms can be attributed to its suitability for our high-dimensional PSI feature space, where local neighborhood relationships effectively captured subtle biomechanical signatures. Neural Networks showed susceptibility to overfitting given our dataset size, while Random Forest exhibited inconsistent feature importance patterns across cross-validation folds. The KNN algorithm’s instance-based learning approach naturally aligns with the physiological principle that similar injury profiles should exhibit comparable movement signatures, making it particularly well-suited for biomechanical classification tasks where interpretability and proximity-based reasoning provide clinical value.
3.2. Locomotion-Dependent Feature Importance Distribution
Figure 4 visualizes the comparative significance of sensor pair relationships in classifying ACL reconstruction outcomes across different movement protocols. These visualization matrices were constructed by aggregating permutation importance metrics for individual feature dimensions and mapping them to their corresponding sensor combinations, providing insight into which inter-sensor relationships most significantly influence classification decisions.
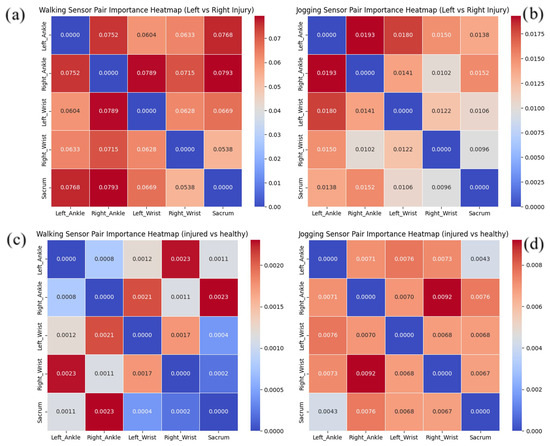
Figure 4.
Heatmap charts showing the relative importance of sensor pairs on predicting outcomes for (a) left or right injury while walking, (b) left or right injury while jogging, (c) healthy or injured while walking, and (d) healthy or injured while jogging.
For classification during walking (Figure 4a), the heatmap revealed a distribution pattern where five distinct sensor pairs exhibited substantial discriminative power with importance values exceeding 0.07, represented by intense red regions in the heatmap. This contrasts markedly with the jogging condition (Figure 4b), where the feature importance concentrated more selectively on just two sensor pairs with values above 0.0175. This differential distribution pattern suggests that during walking, the model relies on a broader array of biomechanical relationships to distinguish between left and right ACL injuries, whereas jogging elicits more focused, distinctive movement signatures.
A parallel pattern emerged in the healthy–injured differentiation analysis. During walking trials (Figure 4c), two sensor combinations demonstrated importance values surpassing 0.002, visualized as concentrated red regions. In comparison, the jogging condition (Figure 4d) exhibited even greater feature selectivity, with only a single sensor pair exceeding the significance threshold of 0.008. This consistent finding across both classification tasks indicates that jogging activities generate more distinctive biomechanical signatures with fewer but more informative movement relationships.
The observed concentration of feature importance during jogging aligns with and helps explain the enhanced classification performance noted previously. The heatmap visualizations demonstrate that walking requires a broader distribution of sensor relationships for classification, with multiple sensor pairs showing elevated importance values, while jogging exhibits more focused importance concentrated in fewer sensor pairs. This differential pattern indicates that jogging elicits more distinctive and concentrated biomechanical signatures compared to the more dispersed importance distribution observed during walking. The more focused distribution of discriminative features during jogging appears to facilitate more reliable pattern recognition, resulting in the superior classification accuracy achieved for both laterality determination and injury detection during this more dynamic activity.
3.3. High-Dimensional Feature Space Visualization
To interpret the complex relationships within our high-dimensional PSI feature matrix, we implemented t-distributed Stochastic Neighbor Embedding as a dimensionality reduction approach. This technique projected our feature space into a comprehensible two-dimensional representation while preserving the essential topological relationships between data points. Each point in these visualizations corresponds to a specific feature vector instance derived from a 10-s movement window. In Figure 5 and Figure 6, we present dual visualization schemes—the left columns display class distinctions through categorical coloring, while the right columns represent the KNN classifier’s prediction confidence through a continuous color gradient. For these visualizations, we utilized our optimal KNN classifier with the 16 Hz frequency threshold, as determined by our performance evaluation.
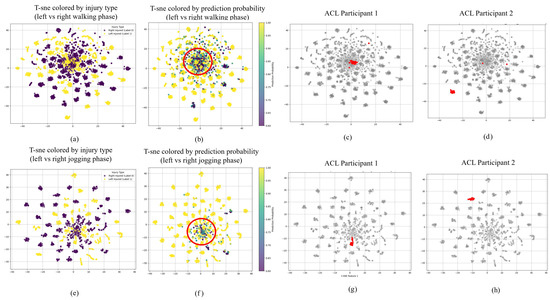
Figure 5.
t-SNE visualization of left vs. right ACL injury classification. Top row: walking phase; bottom row: jogging phase. Left panels (a,e) show class distinctions by injury type. Right panels (b,f) display model confidence through color gradients, with red circles indicating low-confidence regions. Patient-level analysis (c,d,g,h) highlights movement pattern variations between participants with different recovery characteristics.

Figure 6.
t-SNE visualization of healthy vs. injured classification. Top row: walking phase; bottom row: jogging phase. Left panels (a,e) display class distinctions between healthy and injured participants. Right panels (b,f) show model confidence through color gradients, with red circles highlighting low-confidence regions. Individual participant analyses (c,d,g,h) demonstrate how healthy participants and certain ACL patients exhibit distinctive clustering patterns.
The t-SNE projections for injury laterality classification (Figure 5) reveal notable patterns in both data distribution and algorithmic confidence. In both locomotion modalities, we identify regions of classification ambiguity, highlighted by circular areas in the confidence-colored visualizations, where the model exhibits reduced certainty in discriminating between left and right ACL injuries. These regions of uncertainty appear more pronounced in walking than jogging conditions. A comparative examination of the class-labeled visualizations across movement protocols reveals that jogging data manifest more distinct cluster formations with diminished inter-class overlap compared to walking data. This enhanced separation during jogging activities indicates that this more dynamic movement protocol generates more distinguishable biomechanical signatures, facilitating improved classification performance.
Parallel observations emerge in the healthy versus injured visualizations (Figure 6). The central regions of these t-SNE projections, particularly evident in the confidence-coded representations, contain instances where classification certainty diminishes. The jogging condition again demonstrates superior cluster differentiation compared to walking, with more distinct boundaries between healthy and injured movement patterns. This structural clarity during jogging further supports our earlier finding that more dynamic activities may elicit more discriminative movement patterns for classification purposes.
Examining individual participants within these t-SNE projections provides additional insights into recovery characteristics. For laterality classification, certain individuals (exemplified by ACL Participant 1 in Figure 5) consistently appear in low-confidence regions across both movement protocols, while others (such as ACL Participant 2) consistently occupy high-confidence areas. This pattern suggests that participants whose movements more closely approximate normal biomechanics present greater classification challenges. Similarly, in the healthy–injured classification space, healthy subjects more frequently appear in low-confidence regions, while many ACL reconstruction patients (represented by ACL Participant 3 in Figure 6) occupy high-confidence areas. We also observe a relationship between classification confidence and cluster coherence, with high-confidence individuals typically exhibiting more consolidated point distributions in the visualization space.
3.4. Recovery-Related Confidence Analysis
Demographic Distribution Patterns
To explore potential relationships between classification confidence and patient-specific characteristics, we conducted an in-depth analysis of demographic factors associated with varying levels of model certainty. We segmented the t-SNE projections into high-confidence and low-confidence regions based on prediction probability thresholds, then compared patient characteristics across these regions. For both locomotion modes, we aggregated demographic data including age, recovery duration, anthropometrics, and biological sex distribution separately for points in each confidence zone.
Table 2 presents the detailed demographic distribution for laterality classification data points. A consistent pattern emerged regarding rehabilitation timeline—data points in low-confidence regions were predominantly associated with extended recovery periods. In walking assessments, left-injured individuals with data in low-confidence zones had a mean recovery duration of 11.08 months, substantially longer than the 8.14-month average for those in high-confidence regions. This disparity was even more pronounced during jogging, where low-confidence left-injured data points corresponded to an average 12.59-month recovery, compared to just 7.52 months for high-confidence instances. This finding suggests that extended rehabilitation periods may produce movement signatures that increasingly approximate normal biomechanics, making laterality classification more challenging.
Table 2.
Summary statistics for the left–right classification windows.
This pattern persisted in healthy–injured discrimination, as detailed in Table 3. While recovery metrics were unavailable for healthy controls, ACL reconstruction participants demonstrated the same relationship between extended recovery and reduced classification confidence. During jogging evaluations, low-confidence injured instances corresponded to a mean recovery period of 12.31 months, significantly exceeding the 8.17-month average for high-confidence instances. This consistent relationship across both classification tasks supports the hypothesis that biomechanical adaptations evolve toward normalization with extended rehabilitation time.
Table 3.
Summary statistics for the healthy–injured classification windows.
3.5. Cluster Coherence Analysis
To quantify movement pattern consistency and its relationship with recovery factors, we developed a cluster coherence metric based on the spatial distribution of each participant’s data points in the t-SNE projection. The coherence value represents the average pairwise Euclidean distance between all data points belonging to a single participant, with lower values indicating more compact clustering and thus more consistent movement patterns. Figure 7 visualizes the relationships between coherence metrics and recovery characteristics through a pairwise scatter plot matrix.
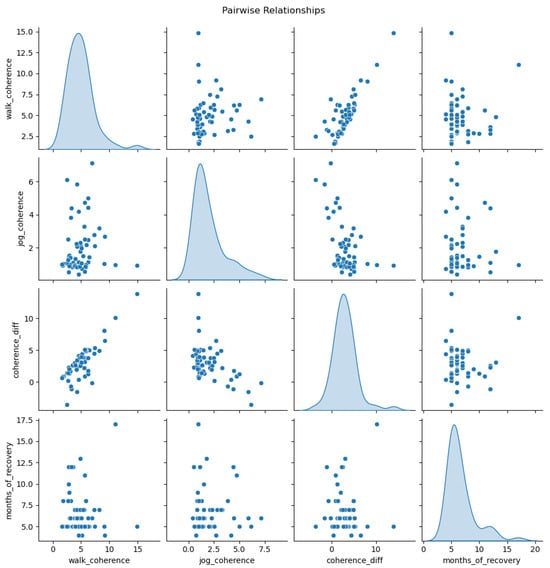
Figure 7.
Pairwise relationships between movement pattern coherence measures and recovery duration. The diagonal shows density distributions, while off-diagonal cells display scatterplots showing associations between coherence metrics (walking, jogging, and their difference) and months of recovery.
Our analysis revealed substantial differences in movement pattern consistency across participant categories and locomotion modalities. Healthy controls demonstrated markedly superior coherence compared to ACL reconstruction patients, with an average walking coherence of 2.69 and jogging coherence of 0.93. In contrast, injured participants exhibited significantly more dispersed movement patterns, with an average walking coherence of 7.04 and jogging coherence of 2.66. When examining laterality subgroups, left-injured participants demonstrated better movement consistency (walking: 3.99, jogging: 1.61) compared to right-injured participants (walking: 5.38, jogging: 2.21).
The coherence difference between walking and jogging activities also varied significantly across participant groups. Healthy subjects maintained the smallest differential, suggesting more consistent adaptability across locomotion tasks compared to ACL reconstruction patients. Among injured participants, those with left knee reconstructions demonstrated smaller coherence differences than right-injured counterparts, potentially indicating more effective biomechanical adaptation.
Notably, rehabilitation duration showed a significant correlation with movement pattern consistency. Participants with extended recovery periods demonstrated progressively improving coherence metrics across both locomotion modes, with the strongest correlation observed in walking conditions. This finding suggests that movement pattern consistency may serve as a quantitative indicator of rehabilitation progress, with longer recovery allowing for more stable biomechanical adaptations.
An additional analysis of hand dominance revealed an intriguing pattern in the limited subset of left-hand-dominant participants (n = 8). When comparing injury laterality relative to the dominant side, we observed that injuries to the non-dominant limb generally resulted in better movement pattern coherence than dominant-side injuries. This finding suggests potentially greater adaptation challenges when reconstructing the ACL in the dominant limb, though the limited sample size warrants cautious interpretation of this preliminary observation.
4. Discussion
This research introduces a novel confidence-aware dimensionality reduction approach for ACL reconstruction assessment through multi-modal analysis of gait dynamics and patient characteristics. We achieved three key findings: PSI-based features enabled 96.37% classification accuracy for ACL reconstruction outcomes, jogging tasks provided more discriminative movement signatures than walking, and extended rehabilitation periods correlated with decreased model confidence and improved movement pattern coherence. Our methodological framework offers significant contributions to understanding personalized rehabilitation trajectories following ACL reconstruction. This is achieved by combining advanced sensor-derived features with interpretable machine learning techniques. Similar to recent exploratory work in explainable AI for orthopedic assessment [19,20,21,22], our study demonstrates the potential of transparent algorithmic approaches to enhance clinical decision-making in rehabilitation contexts.
Our first hypothesis posited that PSI matrices derived from IMU sensor data would effectively capture inter-limb relationships crucial for classifying ACL reconstruction outcomes. This hypothesis was strongly validated, with our optimal K-Nearest Neighbors classifier achieving 96.37% accuracy across classification tasks. This exceptional performance exceeds results from comparable studies, such as the 94.95% accuracy reported by Kokkotis et al. [19] using SVM-based classification, and significantly outperforms conventional feature extraction approaches documented in related research [23,24]. While previous gait analysis methodologies have primarily utilized time-domain features (statistical moments, peak accelerations) and frequency-domain features (power spectral density, wavelet coefficients) to characterize movement patterns [12,25], our PSI-based approach demonstrates superior capacity to quantify the complex causal relationships between paired body segments during locomotion. This finding establishes PSI as being particularly effective for capturing subtle biomechanical adaptations between different ACL injury profiles. Our results confirm PSI’s value for sensor-based gait analysis in orthopedic rehabilitation assessment.
The second hypothesis, which proposed that different locomotion tasks would present varying levels of difficulty in identifying ACL reconstruction outcomes, was substantiated through our sensor pair importance analysis. The visualization matrices revealed a striking contrast between walking and jogging conditions—walking required a broader distribution of sensor pair relationships for accurate classification, whereas jogging exhibited a more concentrated importance pattern focused on fewer key sensor pairs. This finding is consistent with research by multiple groups [26,27,28,29] who have documented that more dynamic activities elicit more pronounced biomechanical adaptations compared to standard walking assessments. Our superior classification accuracy achieved during jogging trials aligns with observations by Pietrosimone et al. [30] and Capin et al. [31] regarding task-specific gait aberrations. While previous studies have qualitatively noted that biomechanical signatures become more distinctive during activities that place greater demands on the neuromuscular system, our permutation importance-based heatmaps provide, for the first time, a quantifiable measure to understand these task-specific differences. By visualizing the relative contribution of different sensor pair combinations between tasks, we offer a transparent mechanism to identify exactly which movement relationships become more discriminative during different locomotion activities, enabling more targeted rehabilitation approaches.
Our third hypothesis examining the relationship between recovery duration, model confidence, and movement pattern coherence received substantial support through multiple analytical approaches. The t-SNE visualizations revealed that participants with extended rehabilitation periods consistently generated movement patterns that machine learning models found more challenging to classify with high confidence, aligning with longitudinal studies of gait normalization [30,31,32]. The quantification of cluster coherence represents a novel contribution to ACL rehabilitation assessment, with marked differences in coherence metrics between healthy controls (walking: 2.69, jogging: 0.93) and ACL reconstruction patients (walking: 7.04, jogging: 2.66) providing quantitative evidence of rehabilitation-related movement pattern evolution. Particularly noteworthy were the laterality-specific differences in movement consistency, with left-injured participants demonstrating better coherence (walking: 3.99, jogging: 1.61) compared to right-injured counterparts (walking: 5.38, jogging: 2.21). These findings suggest that limb dominance significantly impacts movement adaptation following reconstruction [33,34,35], with our preliminary analysis of hand dominance revealing that injuries to non-dominant limbs might result in more consistent movement adaptations. The coherence gradient observed across participant categories—from healthy controls to left-injured to right-injured—coupled with the relationship between rehabilitation timeline and classification confidence, supports an emerging theoretical framework wherein movement patterns progressively normalize toward pre-injury configurations throughout recovery [12,36,37].
Our confidence-aware dimensionality reduction approach represents a significant advancement toward bridging the gap between advanced analytical methods and clinical application in ACL rehabilitation assessment. Unlike previous machine learning applications that prioritized classification accuracy over interpretability [17,19], our methodology specifically addresses the challenge of explainability in movement analysis by providing visual and quantitative representations of confidence-based clustering. The integration of model confidence with dimensionality reduction creates a novel framework for understanding recovery trajectories that could be applied across diverse musculoskeletal conditions [21,38]. By quantifying the relationship between rehabilitation duration and movement pattern normalization through coherence metrics, we provide objective criteria for treatment progression decisions that align with the emerging paradigm of precision rehabilitation medicine [28,29,30]. These innovations collectively advance the field toward more personalized rehabilitation approaches based on individual movement signatures rather than standardized protocols, potentially improving long-term outcomes for patients undergoing ACL reconstruction. Moreover, the clinical implications of our confidence-aware approach are substantial, as it provides objective criteria for return-to-sport decisions and enables personalized rehabilitation progression based on quantitative movement pattern analysis. This methodology could reduce re-injury rates by identifying patients who require extended rehabilitation despite appearing clinically ready for sport return.
Despite the promising innovations in our methodology, several important considerations must be acknowledged when interpreting and applying these findings to clinical practice. The cross-sectional nature of our study design limits our ability to establish causal relationships between rehabilitation duration and movement pattern normalization, with longitudinal approaches likely providing more definitive evidence of biomechanical adaptation trajectories [31,32]. Additionally, while our PSI-based feature extraction demonstrated excellent classification performance, alternative signal processing approaches might offer complementary insights into movement coordination patterns [12,25]. The insights gained from our cluster coherence analysis warrant validation through larger cohorts with more balanced representation of demographic and clinical characteristics. Future work could expand on this approach by implementing real-time visualizations and feedback systems, which have shown promise in interventional studies addressing gait asymmetries [27].
5. Conclusions
This study introduced a novel confidence-aware dimensionality reduction approach for ACL reconstruction assessment, achieving 96.37% classification accuracy using PSI-based features. We demonstrated that jogging tasks provide more discriminative movement signatures than walking, and that extended rehabilitation periods correlate with decreased model confidence and improved movement pattern coherence, offering quantitative evidence of recovery progression.
The confidence-aware dimensionality reduction framework presented in this study represents a significant advancement in explainable machine learning for orthopedic rehabilitation assessment. By integrating model confidence with dimensionality reduction visualization, we bridge the gap between advanced analytical methods and clinical application, making complex machine learning outputs more accessible and interpretable to healthcare providers. The quantitative relationship established between rehabilitation duration, classification confidence, and movement pattern coherence provides objective criteria for personalized treatment progression decisions. This approach addresses critical clinical needs by providing objective, quantitative measures for return-to-sport decisions and personalized rehabilitation progression, potentially reducing re-injury rates and improving long-term outcomes. Future work should expand on this approach through longitudinal studies tracking biomechanical adaptation trajectories from pre-surgery through to extended rehabilitation, potentially incorporating real-time visualization and feedback systems to address persisting movement asymmetries. This methodology has the potential to transform rehabilitation practices by enabling evidence-based, personalized treatment protocols tailored to individual movement signatures and recovery trajectories.
Author Contributions
Conceptualization, X.Z., D.K.K., J.M.H. and J.G.; methodology, X.Z., D.K.K., J.M.H. and J.G.; formal analysis, X.Z. and G.K.; investigation, X.Z. and J.G.; validation, X.Z.; visualization, X.Z.; data curation, J.M.H.; writing—original draft preparation, X.Z.; writing—review and editing, J.M.H., D.K.K. and J.G.; supervision, J.G.; project administration, J.G.; resources, J.M.H. All authors have read and agreed to the published version of the manuscript.
Funding
This research received no external funding.
Institutional Review Board Statement
Data were collected as part of a large-scale observational clinical research study conducted in accordance with the Declaration of Helsinki and approved by the Institutional Review Board at the University of Virginia (IRB#:17399).
Informed Consent Statement
Informed consent was obtained from all participants involved in the study.
Data Availability Statement
Dataset available on request from the authors.
Conflicts of Interest
The authors declare no conflicts of interest.
Abbreviations
The following abbreviations are used in this manuscript:
| ACL | Anterior Cruciate Ligament |
| IMU | Inertial Measurement Unit |
| PSI | Phase Slope Index |
| t-SNE | t-distributed Stochastic Neighbor Embedding |
| FFT | Fast Fourier Transform |
| CSD | Cross-spectral Density |
| SVM | Support Vector Machine |
| KNN | K-Nearest Neighbor |
References
- Lohmander, L.S.; Englund, P.M.; Dahl, L.L.; Roos, E.M. The long-term consequence of anterior cruciate ligament and meniscus injuries: Osteoarthritis. Am. J. Sport. Med. 2007, 35, 1756–1769. [Google Scholar] [CrossRef]
- Wang, L.J.; Zeng, N.; Yan, Z.P.; Li, J.T.; Ni, G.X. Post-traumatic osteoarthritis following ACL injury. Arthritis Res. Ther. 2020, 22, 1–8. [Google Scholar] [CrossRef]
- Cheung, E.C.; DiLallo, M.; Feeley, B.T.; Lansdown, D.A. Osteoarthritis and ACL reconstruction—Myths and risks. Curr. Rev. Musculoskelet. Med. 2020, 13, 115–122. [Google Scholar] [CrossRef]
- Abrams, G.D.; Harris, J.D.; Gupta, A.K.; McCormick, F.M.; Bush-Joseph, C.A.; Verma, N.N.; Cole, B.J.; Bach, B.R., Jr. Functional performance testing after anterior cruciate ligament reconstruction: A systematic review. Orthop. J. Sport. Med. 2014, 2, 2325967113518305. [Google Scholar] [CrossRef]
- Almangoush, A.; Herrington, L. Functional performance testing and patient reported outcomes following ACL reconstruction: A systematic scoping review. Int. Sch. Res. Not. 2014, 2014, 613034. [Google Scholar] [CrossRef]
- Criss, C.R.; Melton, M.S.; Ulloa, S.A.; Simon, J.E.; Clark, B.C.; France, C.R.; Grooms, D.R. Rupture, reconstruction, and rehabilitation: A multi-disciplinary review of mechanisms for central nervous system adaptations following anterior cruciate ligament injury. Knee 2021, 30, 78–89. [Google Scholar] [CrossRef] [PubMed]
- Joreitz, R.; Lynch, A.; Popchak, A.; Irrgang, J. Criterion-based rehabilitation program with return to sport testing following ACL reconstruction: A case series. Int. J. Sports Phys. Ther. 2020, 15, 1151. [Google Scholar] [CrossRef] [PubMed]
- Betsch, M.; Darwich, A.; Chang, J.; Whelan, D.; Ogilvie-Harris, D.; Chahal, J.; Theodoropoulos, J. Wide variability in return-to-sport criteria used by team physicians after anterior cruciate ligament reconstruction in elite athletes—A qualitative study. Arthrosc. Sports Med. Rehabil. 2022, 4, e1759–e1766. [Google Scholar] [CrossRef] [PubMed]
- Krishnakumar, S.; van Beijnum, B.J.F.; Baten, C.T.; Veltink, P.H.; Buurke, J.H. Estimation of kinetics using IMUs to monitor and aid in clinical decision-making during ACL rehabilitation: A systematic review. Sensors 2024, 24, 2163. [Google Scholar] [CrossRef]
- Picerno, P. 25 years of lower limb joint kinematics by using inertial and magnetic sensors: A review of methodological approaches. Gait Posture 2017, 51, 239–246. [Google Scholar] [CrossRef] [PubMed]
- Saboor, A.; Kask, T.; Kuusik, A.; Alam, M.M.; Le Moullec, Y.; Niazi, I.K.; Zoha, A.; Ahmad, R. Latest research trends in gait analysis using wearable sensors and machine learning: A systematic review. IEEE Access 2020, 8, 167830–167864. [Google Scholar] [CrossRef]
- Sejdić, E.; Lowry, K.A.; Bellanca, J.; Redfern, M.S.; Brach, J.S. A comprehensive assessment of gait accelerometry signals in time, frequency and time-frequency domains. IEEE Trans. Neural Syst. Rehabil. Eng. 2013, 22, 603–612. [Google Scholar] [CrossRef]
- Ye, Z.; Zhang, T.; Wu, C.; Qiao, Y.; Su, W.; Chen, J.; Xie, G.; Dong, S.; Xu, J.; Zhao, J. Predicting the objective and subjective clinical outcomes of anterior cruciate ligament reconstruction: A machine learning analysis of 432 patients. Am. J. Sports Med. 2022, 50, 3786–3795. [Google Scholar] [CrossRef]
- Augustsson, J.; Thomeé, R.; Karlsson, J. Ability of a new hop test to determine functional deficits after anterior cruciate ligament reconstruction. Knee Surg. Sports Traumatol. Arthrosc. 2004, 12, 350–356. [Google Scholar] [CrossRef]
- Herbst, E.; Wierer, G.; Fischer, F.; Gföller, P.; Hoser, C.; Fink, C. Functional assessments for anterior cruciate ligament reconstruction return to sport. Ann. Jt. 2017, 2, 1–8. [Google Scholar] [CrossRef]
- Marques, J.B.; Mc Auliffe, S.; Thomson, A.; Sideris, V.; Santiago, P.; Read, P.J. The use of wearable technology as an assessment tool to identify between-limb differences during functional tasks following ACL reconstruction. A scoping review. Phys. Ther. Sport 2022, 55, 1–11. [Google Scholar] [CrossRef]
- Rudin, C. Stop explaining black box machine learning models for high stakes decisions and use interpretable models instead. Nat. Mach. Intell. 2019, 1, 206–215. [Google Scholar] [CrossRef]
- Becker, R.M.; Keefe, R.F. A novel smartphone-based activity recognition modeling method for tracked equipment in forest operations. PLoS ONE 2022, 17, e0266568. [Google Scholar] [CrossRef] [PubMed]
- Kokkotis, C.; Moustakidis, S.; Tsatalas, T.; Ntakolia, C.; Chalatsis, G.; Konstadakos, S.; Hantes, M.E.; Giakas, G.; Tsaopoulos, D. Leveraging explainable machine learning to identify gait biomechanical parameters associated with anterior cruciate ligament injury. Sci. Rep. 2022, 12, 6647. [Google Scholar] [CrossRef] [PubMed]
- Slijepcevic, D.; Horst, F.; Lapuschkin, S.; Horsak, B.; Raberger, A.M.; Kranzl, A.; Samek, W.; Breiteneder, C.; Schöllhorn, W.I.; Zeppelzauer, M. Explaining machine learning models for clinical gait analysis. ACM Trans. Comput. Healthc. (HEALTH) 2021, 3, 1–27. [Google Scholar] [CrossRef]
- Kim, J.K.; Bae, M.N.; Lee, K.; Kim, J.C.; Hong, S.G. Explainable artificial intelligence and wearable sensor-based gait analysis to identify patients with osteopenia and sarcopenia in daily life. Biosensors 2022, 12, 167. [Google Scholar] [CrossRef] [PubMed]
- D’Ambrosi, R.; Corona, K.; Cerciello, S.; Guerra, G.; Mercurio, M.; Galasso, O.; Valli, F.; Abermann, E.; Fink, C. Combining an anterolateral complex procedure with anterior cruciate ligament reconstruction reduces graft reinjury without increasing the rate of complications: A systematic review and meta-analysis of randomized controlled trials. Am. J. Sports Med. 2025, 52, 2129–2147. [Google Scholar] [CrossRef]
- Mandalapu, V.; Homdee, N.; Hart, J.M.; Lach, J.; Bodkin, S.; Gong, J. Developing computational models for personalized ACL injury classification. In Proceedings of the 2019 IEEE 16th International Conference on Wearable and Implantable Body Sensor Networks (BSN), Chicago, IL, USA, 19–22 May 2019; pp. 1–4. [Google Scholar]
- Shi, H.; Huang, H.; Yu, Y.; Liang, Z.; Zhang, S.; Yu, B.; Liu, H.; Ao, Y. Effect of dual task on gait asymmetry in patients after anterior cruciate ligament reconstruction. Sci. Rep. 2018, 8, 12057. [Google Scholar] [CrossRef]
- Duong, T.T.H. Toward Real-Life Gait Analysis Using Wearable Sensors. Ph.D. Thesis, Stevens Institute of Technology, Hoboken, NJ, USA, 2023. [Google Scholar]
- Webster, K.E.; Wittwer, J.E.; O’Brien, J.; Feller, J.A. Gait patterns after anterior cruciate ligament reconstruction are related to graft type. Am. J. Sports Med. 2005, 33, 247–254. [Google Scholar] [CrossRef]
- Knobel, R.J.; Ito, N.; Arhos, E.K.; Capin, J.J.; Buchanan, T.S.; Snyder-Mackler, L. Patients walking faster after anterior cruciate ligament reconstruction have more gait asymmetry. Int. J. Sports Phys. Ther. 2021, 16, 169. [Google Scholar] [CrossRef]
- Dewig, D.R.; Mills, H.R.; Evans-Pickett, A.; Pietrosimone, B.G.; Blackburn, J.T. Aberrant gait biomechanics in individuals with ACL reconstruction are magnified during treadmill walking. J. Biomech. 2022, 134, 110989. [Google Scholar] [CrossRef]
- Devita, P.; Hortobagyi, T.; Barrier, J. Gait biomechanics are not normal after anterior cruciate ligament reconstruction and accelerated rehabilitation. Med. Sci. Sports Exerc. 1998, 30, 1481–1488. [Google Scholar] [CrossRef] [PubMed]
- Pietrosimone, B.; Blackburn, J.T.; Padua, D.A.; Pfeiffer, S.J.; Davis, H.C.; Luc-Harkey, B.A.; Harkey, M.S.; Stanley Pietrosimone, L.; Frank, B.S.; Creighton, R.A.; et al. Walking gait asymmetries 6 months following anterior cruciate ligament reconstruction predict 12-month patient-reported outcomes. J. Orthop. Res. 2018, 36, 2932–2940. [Google Scholar] [CrossRef] [PubMed]
- Capin, J.J.; Zarzycki, R.; Ito, N.; Khandha, A.; Dix, C.; Manal, K.; Buchanan, T.S.; Snyder-Mackler, L. Gait mechanics in women of the ACL-SPORTS randomized control trial: Interlimb symmetry improves over time regardless of treatment group. J. Orthop. Res. 2019, 37, 1743–1753. [Google Scholar] [CrossRef]
- Sharafoddin-Shirazi, F.; Letafatkar, A.; Hogg, J.; Saatchian, V. Biomechanical asymmetries persist after ACL reconstruction: Results of a 2-year study. J. Exp. Orthop. 2020, 7, 86. [Google Scholar] [CrossRef]
- Johnston, P.T.; McClelland, J.A.; Webster, K.E. Lower limb biomechanics during single-leg landings following anterior cruciate ligament reconstruction: A systematic review and meta-analysis. Sport. Med. 2018, 48, 2103–2126. [Google Scholar] [CrossRef]
- Orsi, A.D.; Canavan, P.K.; Vaziri, A.; Goebel, R.; Kapasi, O.A.; Nayeb-Hashemi, H. The effects of graft size and insertion site location during anterior cruciate ligament reconstruction on intercondylar notch impingement. Knee 2017, 24, 525–535. [Google Scholar] [CrossRef]
- Trigsted, S.M.; Post, E.G.; Bell, D.R. Landing mechanics during single hop for distance in females following anterior cruciate ligament reconstruction compared to healthy controls. Knee Surg. Sports Traumatol. Arthrosc. 2017, 25, 1395–1402. [Google Scholar] [CrossRef] [PubMed]
- Lepley, L.K. Targeting Quadriceps Weakness Following Anterior Cruciate Ligament Reconstruction. Ph.D. Thesis, University of Michigan, Ann Arbor, MI, USA, 2014. [Google Scholar]
- Thompson-Kolesar, J.A.; Gatewood, C.T.; Tran, A.A.; Silder, A.; Shultz, R.; Delp, S.L.; Dragoo, J.L. Age influences biomechanical changes after participation in an anterior cruciate ligament injury prevention program. Am. J. Sports Med. 2018, 46, 598–606. [Google Scholar] [CrossRef] [PubMed]
- Rupprechter, S.; Morinan, G.; Peng, Y.; Foltynie, T.; Sibley, K.; Weil, R.S.; Leyland, L.A.; Baig, F.; Morgante, F.; Gilron, R.; et al. A clinically interpretable computer-vision based method for quantifying gait in parkinson’s disease. Sensors 2021, 21, 5437. [Google Scholar] [CrossRef] [PubMed]
Disclaimer/Publisher’s Note: The statements, opinions and data contained in all publications are solely those of the individual author(s) and contributor(s) and not of MDPI and/or the editor(s). MDPI and/or the editor(s) disclaim responsibility for any injury to people or property resulting from any ideas, methods, instructions or products referred to in the content. |
© 2025 by the authors. Licensee MDPI, Basel, Switzerland. This article is an open access article distributed under the terms and conditions of the Creative Commons Attribution (CC BY) license (https://creativecommons.org/licenses/by/4.0/).