Article

The Effects of Muscle Fatigue on Lower Extremity Biomechanics During the Three-Step Layup Jump and Drop Landing in Male Recreational Basketball Players

Biomechanics Research Laboratory, Department of Kinesiology, San José State University, San José, CA 95192, USA
*
Author to whom correspondence should be addressed.
Biomechanics 2025, 5(4), 81; https://doi.org/10.3390/biomechanics5040081
Submission received: 8 August 2025 / Revised: 16 September 2025 / Accepted: 28 September 2025 / Published: 10 October 2025

Abstract

Background/Objectives: Understanding how muscle fatigue contributes to musculoskeletal injuries is critical in sports science. Although joint biomechanics during landing under fatigue has been studied before, limited research has focused on the layup phase under fatigue. This study examined the effects of fatigue on ankle, knee, and hip-joint biomechanics during layup and landing. We hypothesized that fatigue would increase peak vertical ground reaction force (GRF), peak knee extension angle, and peak joint moments. Methods: Fourteen healthy male participants performed 3-step layups and drop landings using their dominant leg on force plates. The fatigue protocol consisted of squat jumps, step-ups, and repeated countermovement jumps (CMJs), with fatigue defined as three consecutive CMJs below 80% of the participant’s pre-established maximum jump height. After a fatigue protocol, they repeated the tasks. Kinematic data were collected using an eight-camera Vicon system (100 Hz), and GRF data were recorded with two AMTI force plates (1000 Hz). Thirty-six reflective markers were placed on lower-limb anatomical landmarks, and data were processed using Visual 3D. Paired t-tests ( α = 0.05) were conducted using SPSS (V26.0) to compare pre- and post-fatigue outcomes. Results: Significant increases were found in peak GRF during landing (pre: 3.41 ± 0.81 BW [Body Weight], post: 3.95 ± 1.05 BW, p = 0.036), and peak negative hip joint work during landing (pre: 0.34 ± 0.18 J/kg, post: 0.66 ± 0.43 J/kg, p = 0.025). Conclusions: These findings indicate that fatigue may alter landing mechanics, reflected in increased ground reaction forces and negative hip joint work. These preliminary findings should be interpreted cautiously, and future studies with larger samples and additional neuromuscular measures under sport-specific conditions are needed to improve ecological validity.

1. Introduction

Fatigue is a risk factor for many lower-extremity injuries. The way athletes run, jump, and land is often affected when they are fatigued. It was suggested that lower-extremity biomechanics of healthy subjects were altered by muscle fatigue during various activities [1,2]. As many studies have reported, injuries often tend to occur at the end of a sporting event, when a participant is fatigued [3,4]. Moreover, it was suggested that fatigue is the most common cause for decreased proprioception in realistic athletic situations [5]. The most common lower-extremity injuries include knee contusions, anterior knee pain, and ankle sprains. Given the important role fatigue plays in sustaining knee injuries, training to resist muscle fatigue is overlooked in prevention programs [6].
Human neuromuscular system function is influenced by a couple of factors; one important component is muscle fatigue [7]. Muscle fatigue alters the muscle fibers’ capacity to absorb energy [8]. Many studies have investigated the effects of fatigue on lower-extremity kinematics and ground-reaction-force kinetic patterns. For example, muscle fatigue affects the dynamic stability of the knee, which is important in highly physically demanding sports [9].
Most of the previous studies focus on the effects of fatigue on two-leg landing; however, it was found that landing with a single leg seems to be a more challenging exercise since one leg must support the entire body and decelerate the whole-body center of mass [10,11]. The lack of ability to control the body on a single limb can result in many lower-extremity injuries. Acute fatigue can decrease single-leg postural control, decrease ankle-joint position sense, decrease isokinetic strength of hamstring and quadriceps muscles, and can affect isokinetic-hamstring-to-quadriceps ratios [12]. Therefore, this study intended to focus on single-leg tasks, including the landing and layup phases.
Previous study focused on peak ground reaction force, peak joint moment, peak joint angle, and joint mechanical work to investigate the impact of muscle fatigue on lower-limb joint mechanics [13]. Muscle fatigue is strongly related to lower-extremity injury occurrence as fatigue increases the vertical ground reaction force and reduces knee and trunk flexion angles [13]. However, previous research is mainly focused on the effects of fatigue on the knee joint during the landing phase. There is insufficient research focusing on the effects of muscle fatigue on ankle and hip-joint mechanics during layup and drop-landing activity [10]. It is important to understand how muscle fatigue affects other lower extremities, such as the ankle and hip joints. In addition, investigation of all the ankle, knee, and hip joint mechanics will provide a comprehensive view of the lower-extremity system’s biomechanical patterns in response to fatigue during jumping and landing. Therefore, the purpose of this study was to determine how muscle fatigue alters lower-extremity joint mechanics—specifically at the ankle, knee, and hip—during both the layup (propulsion) and drop-landing activities. We hypothesized that fatigue would significantly modify joint angles, moments, and work across all three joints, thereby revealing phase-specific biomechanical adaptations that extend beyond the landing phase alone.

2. Materials and Methods

2.1. Participants

We recruited 14 male recreational basketball players (age: 25.2 ± 3.3 years, height: 175.6 ± 0.1 cm, weight: 75.0 ± 12.1 kg). For this study, a recreational basketball athlete is defined as an individual who plays basketball at least once a week. These individuals needed to have at least two years of playing experience. All subjects signed informed written consent approved by the university’s institutional review board (IRB Protocol Tracking #23018) before participation. All participants had no lower-extremity injuries in the past 6 months.

2.2. Experimental Protocol and Data Collection

A 10-min self-directed warm-up was given to each participant. Participants performed practice warm-up movements before the vertical jump test. When the participants were ready, they performed five countermovement vertical jumps (CMJs). A CMJ was performed by initiating a rapid downward movement from a standing position, immediately followed by an explosive upward jump. The highest vertical jump height recorded before initiating the fatigue protocol was used as the reference for determining fatigue, which was defined as failing to reach 80% of this height in three consecutive jumps, as detailed below.
The procedures for both the 3-step layup jump tasks and the drop-landing tasks were explained and demonstrated to the participants as follows. After warming up, participants performed a 3-step maximum-effort approach jump in which the layup leg landed on the first force plate. The runway started at the edge of the rubber tile, and all participants approached in the direction shown in Figure 1. Participants were instructed to run in a straight line from the start of the runway, taking exactly three steps so that the final step fully contacted the first force plate. This ensured a consistent run-up distance and standardized contact across trials. Participants were not asked to reach a specific height or distance but were instructed to jump as high as possible in each trial, and their performance was qualitatively monitored based on visible effort and jump execution. The participants performed 5 trials with 1 min rest between the trials to minimize the fatigue effect during pre-fatigue assessment. Then, the participants performed drop landing from a 30 cm box, where they landed on the force plate with the dominant leg, which was identified by observing which leg the participant stepped forward with when gently pushed from a static standing position. The dominant leg was selected based on participants’ preferences. It depended on the frequency of the leg being used when jumping and landing. The participants performed 5 trials; this was the non-fatigue phase. Then, the participants went through the fatigue protocol [12]. During the fatigue protocol, participants performed 15 squat jumps, followed by 25 step-ups onto a 30 cm box, then completed countermovement jumps (CMJs) at a rate of 10 per minute. The maximum jump height was established beforehand. If participants maintained performance above 80% of this maximum after the protocol, the sequence was repeated. Fatigue was defined as failing to reach 80% of maximum height on three consecutive CMJs. After going through the fatigue protocol, they would perform 5 trials of the 3-step approach jump and drop-landing tasks, respectively. Each participant was able to practice the tasks until he felt comfortable performing them.
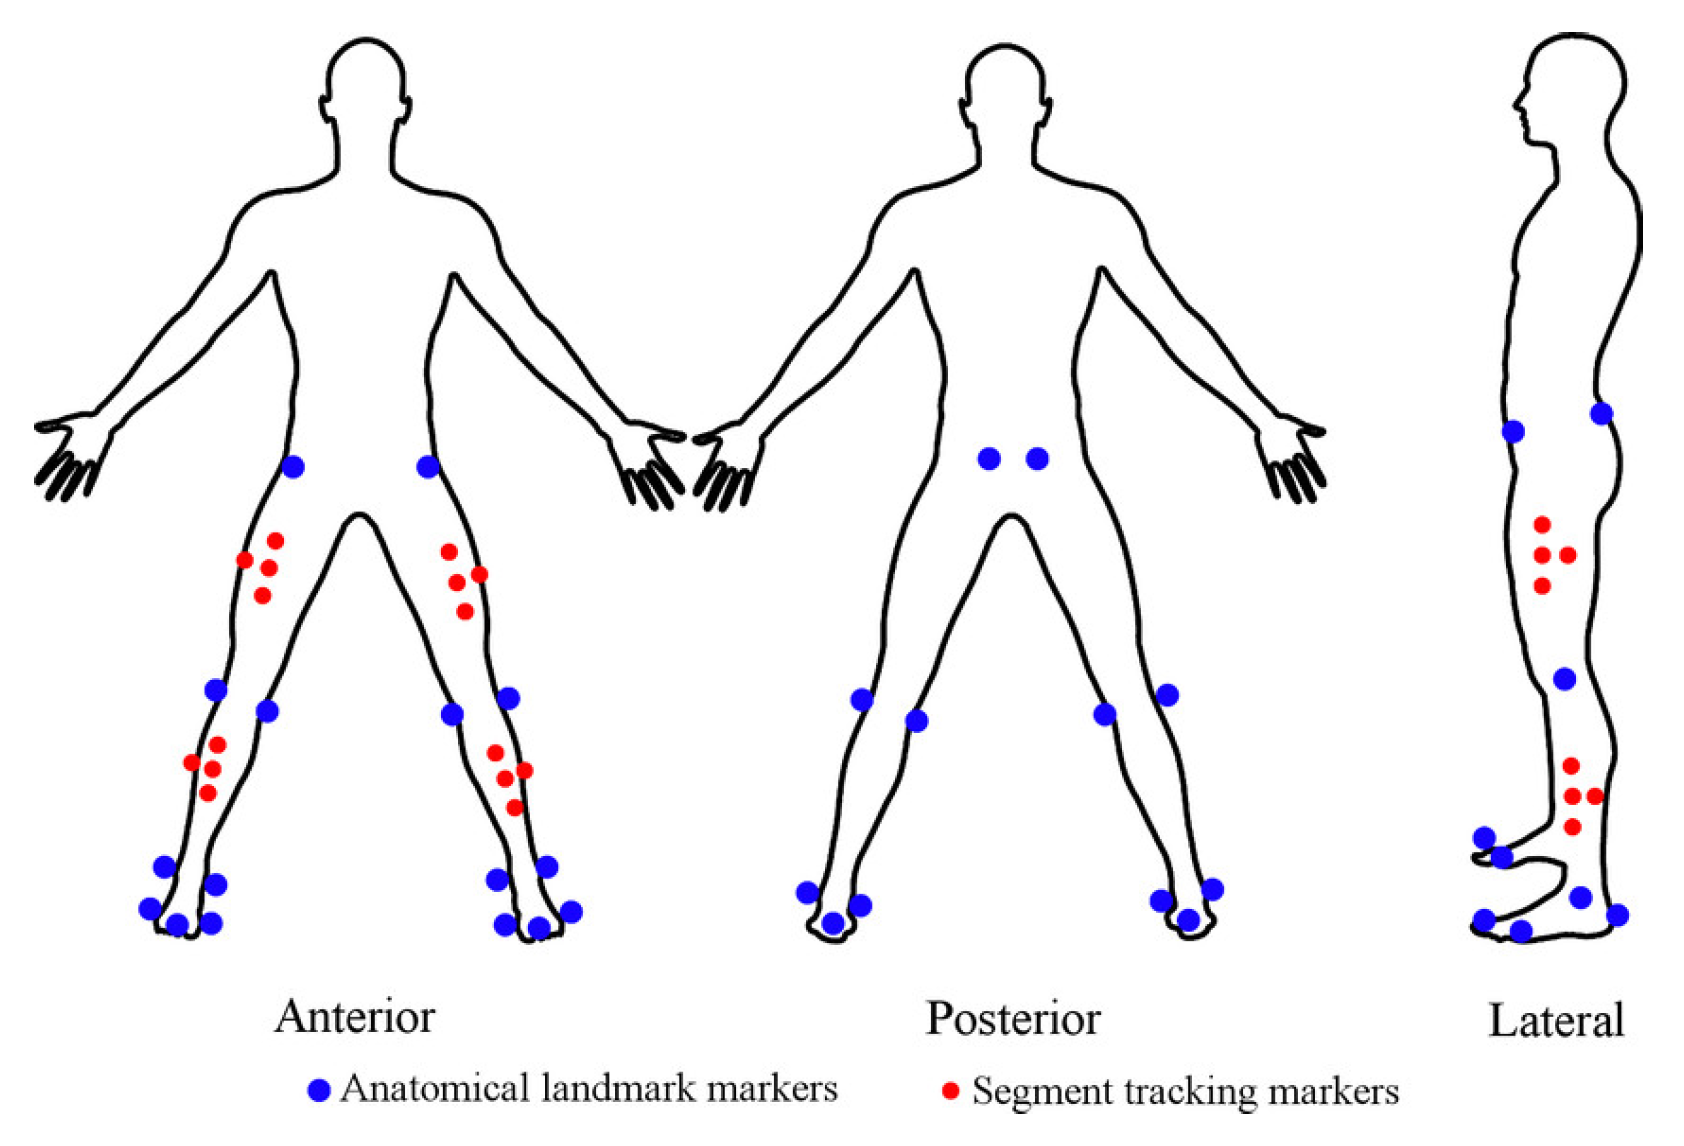
Kinematics were collected using an 8-camera three-dimensional (3D) motion capture system (Vicon, Oxford, UK). A total of 36 infrared retro-reflective markers were attached bilaterally to both lower extremities to define hip, knee, and ankle joints according to the plug-in gait marker set (Figure 2). Kinematic data were collected at 100 Hz [14,15]. Ground reaction forces (GRF) were measured with two 90 × 60 × 10 cm 3D force plates (AMTI, Watertown, MA, USA) at a sampling rate of 1000 Hz. The 3D kinematic and force plate data were synchronized using the Vicon system.

2.3. Data Analysis

The main outcome measurements for this study were the peak ankle plantar flexion and dorsi flexion angle, peak knee and hip flexion, and extension angle during layup and landing. All reflective marker data were filtered with a low-pass fourth-order Butterworth filter at 6 Hz, and analog data were filtered at 50 Hz, respectively [17,18,19,20,21,22,23,24]. This study also investigated the peak vertical ground reaction force (Newtons/BW). Additionally, the peak joint moment, work, and power for ankle, knee, and hip joints were also calculated in this study. The joint angle (degree), moment (Nm/kg), and power (W/kg) were calculated via an inverse dynamics model in Visual 3D (HAS Motion, Kingston, ON, Canada). Joint positive and negative mechanical work (J/kg) were calculated as the sum of all positive or negative net joint power integrated over time, respectively [24]. C3D and Excel files were exported from Visual 3D and subsequently processed in Python (v3.x) using Google Colaboratory (Google LLC, Mountain View, CA, USA).

2.4. Statistical Analysis

Since we had one group of subjects and they went through two testing conditions, paired t-test was used to determine the biomechanical differences ( α = 0.05) between pre- and post-fatigue outcome measures using SPSS software (V26.0, IBM, Armonk, NY, USA). All the joint moment, mechanical work, and power graphs were created using Python (v3.x) in Google Colaboratory.

3. Results

3.1. Joint Angle

For the joint kinematic outcomes, no significant difference was found between the fatigue conditions for peak ankle plantar flexion angle (p = 0.062), peak ankle dorsi flexion angle (p = 0.179), peak knee flexion angle (p = 0.460), peak hip flexion angle (p = 0.861), and peak hip extension angle (p = 0.950) during the layup phase (Table 1).
For joint kinematic outcomes during the landing phase, no significant difference was found between the fatigue conditions for peak ankle plantar flexion angle (p = 0.314), peak ankle dorsi flexion angle (p = 0.543), peak knee flexion angle (p = 0.297), peak knee extension angle (p = 0.124), peak hip flexion angle (p = 0.315), and peak hip extension angle (p = 0.337) (Table 1).

3.2. Joint Moment and Ground Reaction Force

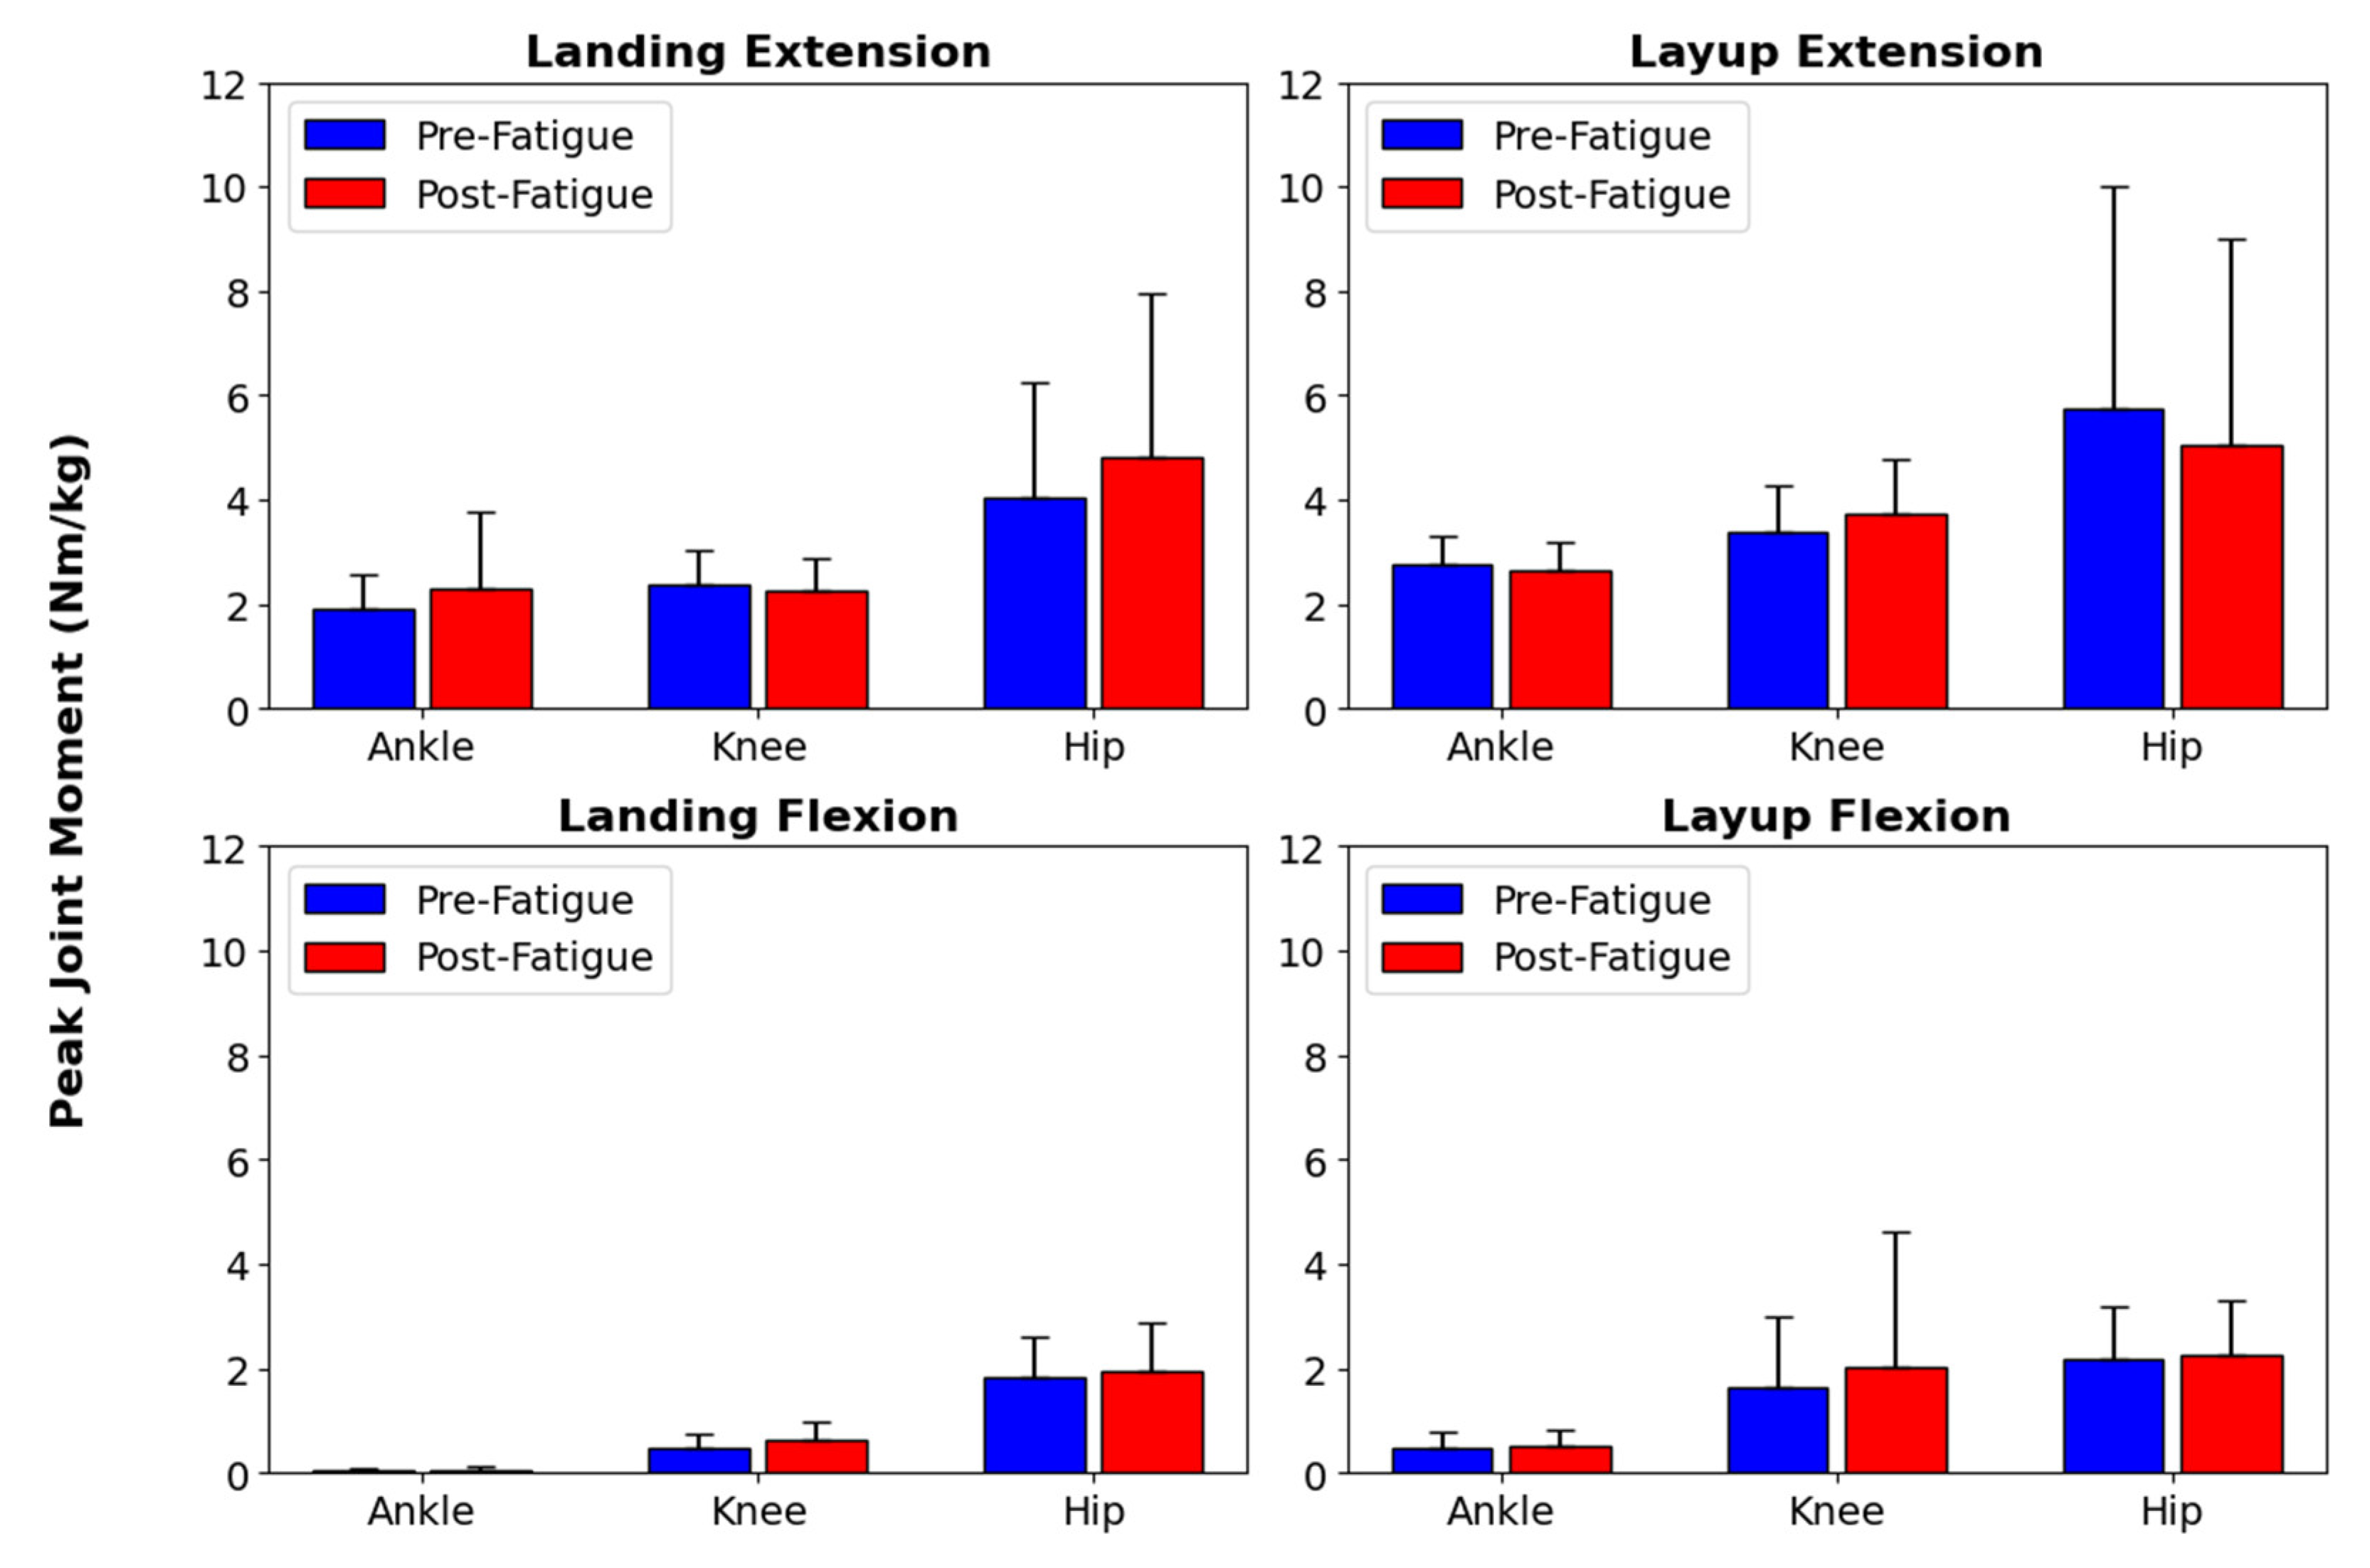
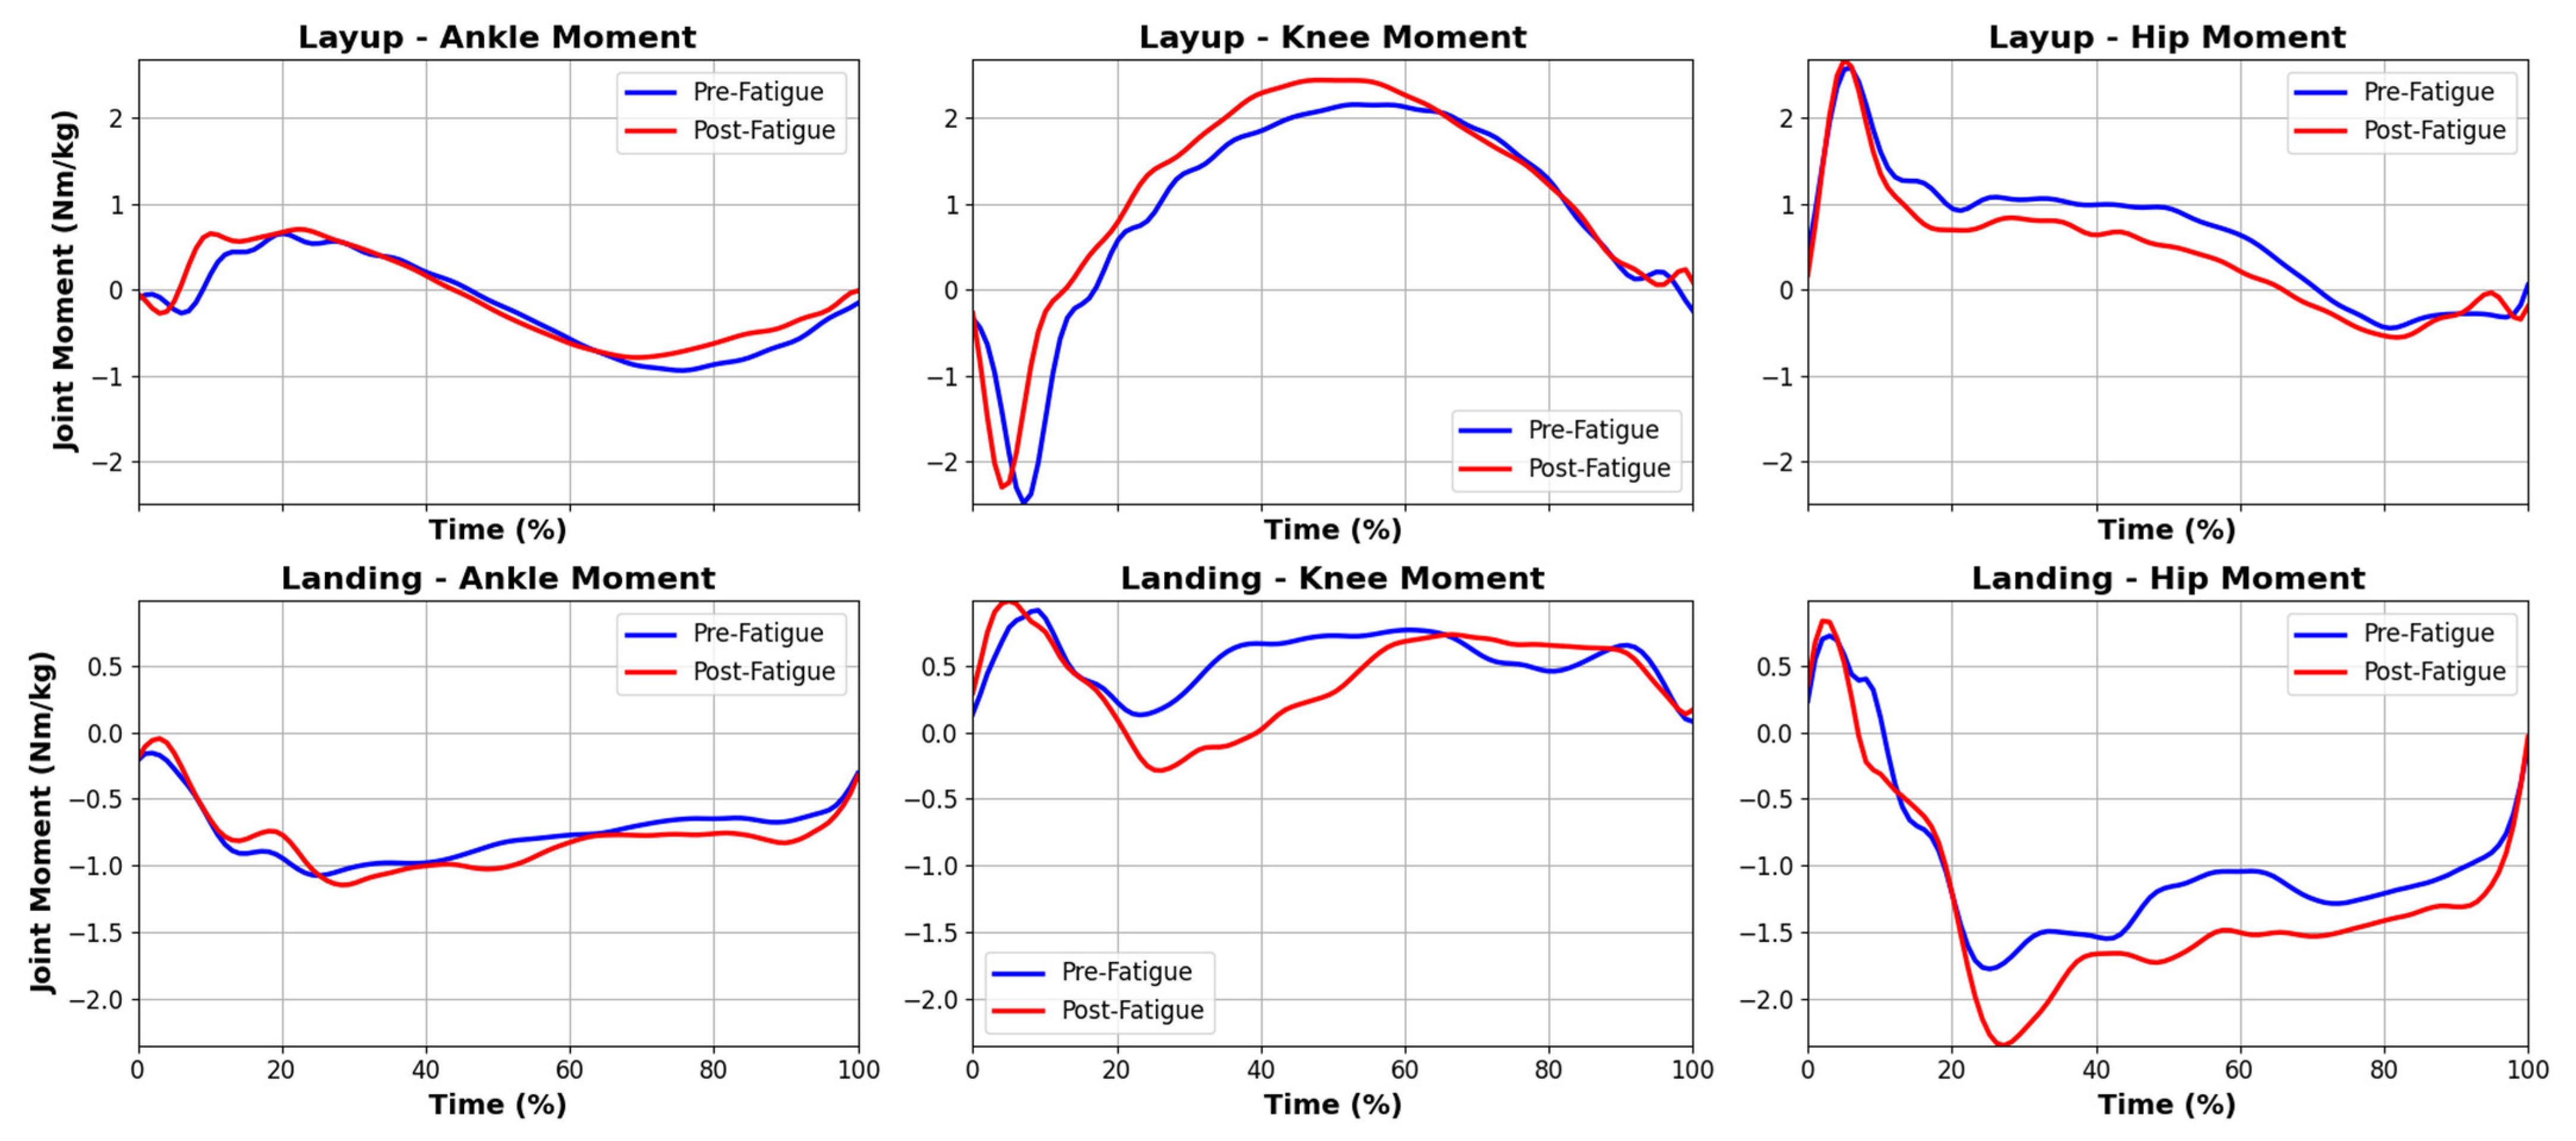
For the joint kinetic outcomes, a significant difference was found in peak ground reaction force between the pre-fatigue (3.41 ± 0.81) and post-fatigue (3.95 ± 1.05) conditions during the landing phase (p = 0.036, effect size d = 0.56). No other significant difference was found in peak ankle plantar flexion moment (p = 0.299), peak ankle dorsi flexion moment (p = 0.086), peak knee extension moment (p = 0.221), peak knee flexion moment (p = 0.219), peak hip extension moment (p = 0.269), and peak hip flexion moment (p = 0.481) during the landing phase (Table 2, Figure 3 and Figure 4).
For the layup phase, no significant difference was found between the fatigue conditions for the peak ground reaction forces (p = 0.452), peak ankle dorsi flexion moment (p = 0.627), peak ankle plantar flexion moment (p = 0.295), peak knee moment extension moment (p = 0.421), peak knee flexion moment (p = 0.327), peak hip extension moment (p = 0.414), and peak hip flexion moment (p = 0.374) (Table 2, Figure 3 and Figure 4).

3.3. Joint Power and Work

During the layup phase, no significant differences were found between the fatigue conditions in peak positive ankle joint power (p = 0.801), peak negative ankle joint power (p = 0.677), peak positive knee joint power (p = 0.527), peak negative knee joint power (p = 0.149), peak positive hip joint power (p = 0.611), and peak negative hip joint power (p = 0.602) (Table 3, Figure 5).
During the landing phase, no other significant differences were found in peak positive ankle joint power (p = 0.362), peak negative ankle joint power (p = 0.938), peak positive knee joint power (p = 0.081), peak negative knee joint power (p = 0.834), peak positive hip joint power (p = 0.116), and peak negative hip joint power (p = 0.413) (Table 3, Figure 5).
During the layup phase, no significant differences were found in peak positive ankle joint work (p = 0.585), peak negative ankle joint work (p = 0.346), peak positive knee joint work (p = 0.866), peak negative knee joint work (p = 0.193), peak positive hip joint work (p = 0.214), and peak negative hip joint work (p = 0.078) (Table 4, Figure 6).
During the landing phase, a significant difference was found in the peak negative hip joint work (p = 0.025, effect size d = 0.97) between pre-fatigue ( 0.34 ± 0.18) (J/kg) and post-fatigue ( 0.66 ± 0.43) (J/kg) conditions (Table 4, Figure 6). No other significant differences were found in the peak positive ankle joint work (p = 0.167), peak negative ankle joint work (p = 0.913), peak positive knee joint work (p = 0.236), and peak negative knee joint work (p = 0.498) (Table 4).

4. Discussion

The purpose of this study was to investigate the effects of muscle fatigue on jumping and drop-landing biomechanics among recreational basketball players. More specifically, this study aimed to address the research gap concerning the effects of fatigue on lower-extremity biomechanics during the layup phase. This study primarily found that participants exhibited a significant increase in peak vertical ground reaction force and a significant increase in peak negative hip joint work during the drop-landing phase after fatigue. These results highlight alterations in lower-extremity loading and energy absorption that occur when athletes perform under fatigued conditions. Such changes may reduce the efficiency of impact absorption and increase stress on the hip and surrounding structures, although the precise neuromuscular mechanisms remain beyond the scope of this dataset.
The observed increases in peak ground reaction force and negative hip joint work align with prior reports indicating that fatigue alters lower-body kinetics during landing [12]. Elevated ground reaction forces have been linked to stiffer landings and reduced capacity to dissipate impact energy [1,2,13,25]. In this sample, higher post-fatigue loading suggests altered landing mechanics that could place greater demands on the hip joint and surrounding musculature. Previous research has noted that less knee flexion during landing diminishes impact absorption capacity, thereby elevating the stress on ligaments and joints [18]. Likewise, increased ground reaction force has been associated with elevated anterior shear forces, which can influence knee joint stability [6]. Our findings, therefore, extend prior work by confirming that fatigue alters both impact absorption and energy transfer during the landing phase [1,2,25].
In addition to these primary findings, several secondary trends were observed. Participants experienced some percentage changes in other peak joint angles. For example, muscle fatigue increased the peak hip extension, as well as decreased the peak ankle dorsi flexion and peak hip flexion angle during the layup phase, although these did not reach statistical significance. These changes are crucial to ACL injuries [6,26,27]. No other significant differences were observed in the kinetic variables during the layup phase. Similarly, muscle fatigue was associated with higher peak knee extension and flexion moments during the layup phase, although again, these differences were not significant. In addition, participants also demonstrated trends toward higher peak positive and negative knee joint power, as well as lower peak positive and negative hip joint power when fatigued. These findings differ from previous research that displays how fatigue significantly reduced the peak negative power of ankle, knee, and hip joints and the peak absorption power of ankle and knee joints, whereas it increased the peak positive power of hip joints [28]. The inconsistencies between the current results and the prior literature may be attributable to differences in participant population, task execution, or laboratory setup.
By examining both the landing and layup phases, our results extend prior work that has primarily focused on the landing phase, highlighting that fatigue also compromises propulsion mechanics. This has particular implications for basketball performance, where single-leg landings and layups are frequent, high-intensity tasks. Under fatigued conditions, the reduced ability to absorb impact forces and generate stable propulsion may increase the risk of ankle sprains and knee ligament injuries, which are often reported toward the later stages of basketball games.
Several practical considerations arise from these findings. Weaknesses in hip abductors, hamstrings, or ankle mobility have been associated with altered movement strategies and increased injury susceptibility [29]. Athletes, trainers, and physicians should target the gluteal muscles, rectus femoris, biceps femoris, gastrocnemius, soleus, iliopsoas, sartorius, pectineus, and trunk control during training. Strengthening these muscles can help with the stability of knees and hips, which could reduce the risk of ACL injury [30]. In addition, these muscles are essential for high-speed movements, such as layups in basketball activities. Strength imbalances in these muscles can lead to altered movement patterns and injuries [31]. Furthermore, joint power and mechanical work are important indicators of neuromuscular control. Although speculative links to injury cannot be drawn directly from our data, these parameters remain relevant for understanding how athletes manage dynamic loads. An excessive joint mechanical work and joint power when performing a layup and landing from a jump can also increase the injury risk [2]. To reduce the risk of lower-body injuries during jump tasks, it was also suggested that falling could be used as a strategy when landing from a jump to prevent injuries [32]. Instead of a hard landing and absorbing all the force, falling with proper form might be able to avoid injuries. Emphasizing soft-landing techniques during training may also improve impact absorption strategies [33]. Therefore, trainers, coaches, and athletes should target the right muscles and incorporate proper jump techniques in training to reduce the risk of injury.
This study is not without limitations. First, this study did not include electromyography (EMG) to measure muscle activation patterns, preventing direct assessment of neuromuscular responses to fatigue. Second, the jumping and landing technique varies among participants. Although all participants were recreational basketball players, their skill level may be a limiting factor. Some participants had stiffer jumping and landing techniques, while others had softer techniques. Some participants chose to accelerate during the layup phase, while some chose to stay at a constant speed when approaching the force plate. Some participants were more experienced when landing. They would brace their core and perform a soft landing, while others would land with less control. In addition, participants’ footwear were not unified. Some participants were wearing running shoes, while others were wearing basketball shoes. Different footwear might lead to different jumping and landing mechanics. Moreover, the relatively large standard deviation in body mass indicates variability within the sample, which may have influenced biomechanical responses but also reflects the diversity of recreational basketball players. Furthermore, the laboratory environment did not replicate game-specific conditions: jumping in the biomechanics lab and contacting the force plate might have affected participants’ jumps. The lab setting was a straight line that could limit participants’ layup approach. Some athletes prefer to approach the basketball hoop at an angle. Therefore, approaching the force plate in a straight line could affect participants’ performance. In addition, if there were a basketball hoop where participants could aim for, participants might show different results. It was observed during data collection that some participants were jumping for distance, while some were jumping for height. If there were a hoop, then participants would all aim for the hoop when jumping. Overall, all jump attempts were maximum effort, although the lab setting may be another limiting factor in this study. Finally, the relatively low kinematic data sampling rate of 100 Hz for fast basketball layup and drop-landing movements may have influenced the results. These limitations underscore the need for future studies to replicate sport-specific environments and include larger, more homogeneous samples.

5. Conclusions

In conclusion, participants exhibited significantly higher peak vertical ground reaction forces and more negative hip joint work during drop landing following fatigue. These findings indicate that fatigue alters landing mechanics in ways that may affect load distribution across the lower extremities. Given the small sample size and limited scope, these results should be interpreted cautiously and warrant further investigation under sport-specific conditions.

Author Contributions

Conceptualization, B.Y. and L.J.; methodology, B.Y. and L.J.; software, B.Y.; validation, B.Y.; formal analysis, B.Y.; investigation, B.Y.; resources, L.J.; data curation, B.Y.; writing—original draft preparation, B.Y. and L.J.; writing—review and editing, L.J.; visualization, B.Y.; supervision, L.J.; project administration, B.Y. and L.J. All authors have read and agreed to the published version of the manuscript.

Funding

This research received no external funding.

Institutional Review Board Statement

This study was conducted in accordance with the Declaration of Helsinki, and was approved by the Institutional Review Board of the San José State University (protocol #23018).

Informed Consent Statement

Informed consent was obtained from all subjects involved in this study.

Data Availability Statement

The data presented in this study are available upon request from the corresponding author.

Acknowledgments

The authors would like to acknowledge Yang Hu and Yue Luo for their suggestions on the project.

Conflicts of Interest

The authors declare no conflicts of interest.

References

  1. Pinniger, G.J.; Steele, J.R.; Groeller, H. Does Fatigue Induced by Repeated Dynamic Efforts Affect Hamstring Muscle Function? Med. Sci. Sports Exerc. 2000, 32, 647–653. [Google Scholar] [CrossRef]
  2. Nyland, J.; Brand, E.; Fisher, B. Update on Rehabilitation Following ACL Reconstruction. Open Access J. Sports Med. 2010, 1, 151–166. [Google Scholar] [CrossRef]
  3. Dugan, S.A.; Frontera, W.R. Muscle Fatigue and Muscle Injury. Phys. Med. Rehabil. Clin. N. Am. 2000, 11, 385–403. [Google Scholar] [CrossRef]
  4. Östenberg, A.; Roos, H. Injury Risk Factors in Female European Football. A Prospective Study of 123 Players during One Season. Scand. J. Med. Sci. Sports 2000, 10, 279–285. [Google Scholar] [CrossRef]
  5. Qu, D.; Zhang, Z.; Yu, X.; Zhao, J.; Qiu, F.; Huang, J. Psychotropic Drugs for the Management of Cancer-Related Fatigue: A Systematic Review and Meta-Analysis. Eur. J. Cancer Care 2016, 25, 970–979. [Google Scholar] [CrossRef] [PubMed]
  6. Chappell, J.D.; Herman, D.C.; Knight, B.S.; Kirkendall, D.T.; Garrett, W.E.; Yu, B. Effect of Fatigue on Knee Kinetics and Kinematics in Stop-Jump Tasks. Am. J. Sports Med. 2005, 33, 1022–1029. [Google Scholar] [CrossRef] [PubMed]
  7. Van Der Does, H.T.D.; Brink, M.S.; Benjaminse, A.; Visscher, C.; Lemmink, K.A.P.M. Jump Landing Characteristics Predict Lower Extremity Injuries in Indoor Team Sports. Int. J. Sports Med. 2016, 37, 251–256. [Google Scholar] [CrossRef]
  8. Wan, J.-J.; Qin, Z.; Wang, P.-Y.; Sun, Y.; Liu, X. Muscle Fatigue: General Understanding and Treatment. Exp. Mol. Med. 2017, 49, 384. [Google Scholar] [CrossRef]
  9. Griffin, L.Y.; Agel, J.; Albohm, M.J.; Arendt, E.A.; Dick, R.W.; Garrett, W.E.; Garrick, J.G.; Hewett, T.E.; Huston, L.; Ireland, M.L.; et al. Noncontact Anterior Cruciate Ligament Injuries: Risk Factors and Prevention Strategies. J. Am. Acad. Orthop. Surg. 2000, 8, 141–150. [Google Scholar] [CrossRef] [PubMed]
  10. Simpson, J.D.; Stewart, E.M.; Macias, D.M.; Chander, H.; Knight, A.C. Individuals with Chronic Ankle Instability Exhibit Dynamic Postural Stability Deficits and Altered Unilateral Landing Biomechanics: A Systematic Review. Phys. Ther. Sport 2019, 37, 210–219. [Google Scholar] [CrossRef]
  11. Verschueren, J.; Tassignon, B.; Pluym, B.; Van Cutsem, J.; Verhagen, E.; Meeusen, R. Bringing Context to Balance: Development of a Reactive Balance Test within the Injury Prevention and Return to Sport Domain. Arch. Physiother. 2019, 9, 6. [Google Scholar] [CrossRef] [PubMed]
  12. Liederbach, M.; Kremenic, I.J.; Orishimo, K.F.; Pappas, E.; Hagins, M. Comparison of Landing Biomechanics between Male and Female Dancers and Athletes, Part 2: Influence of Fatigue and Implications for Anterior Cruciate Ligament Injury. Am. J. Sports Med. 2014, 42, 1089–1095. [Google Scholar] [CrossRef]
  13. Wong, T.L.; Huang, C.F.; Chen, P.C. Effects of Lower Extremity Muscle Fatigue on Knee Loading During a Forward Drop Jump to a Vertical Jump in Female Athletes. J. Hum. Kinet. 2020, 72, 5. [Google Scholar] [CrossRef]
  14. Xu, D.; Cen, X.; Wang, M.; Rong, M.; István, B.; Baker, J.S.; Gu, Y. Temporal Kinematic Differences between Forward and Backward Jump-Landing. Int. J. Environ. Res. Public Health 2020, 17, 6669. [Google Scholar] [CrossRef]
  15. Wang, L.; Ye, J.; Zhang, X. Ankle Biomechanics of the Three-Step Layup in a Basketball Player with Chronic Ankle Instability. Sci. Rep. 2023, 13, 18667. [Google Scholar] [CrossRef]
  16. Trounson, K.M.; Busch, A.; Collier, N.F.; Robertson, S. Effects of Acute Wearable Resistance Loading on Overground Running Lower Body Kinematics. PLoS ONE 2020, 15, e0244361. [Google Scholar] [CrossRef]
  17. Rácz, K.; Kiss, R.M. Marker Displacement Data Filtering in Gait Analysis: A Technical Note. Biomed. Signal Process Control 2021, 70, 102974. [Google Scholar] [CrossRef]
  18. Challis, J.H. A Procedure for the Automatic Determination of Filter Cutoff Frequency for the Processing of Biomechanical Data. J. Appl. Biomech. 1999, 15, 303–317. [Google Scholar] [CrossRef]
  19. Russell Esposito, E.; Choi, H.S.; Owens, J.G.; Blanck, R.V.; Wilken, J.M. Biomechanical Response to Ankle-Foot Orthosis Stiffness during Running. Clin. Biomech. 2015, 30, 1125–1132. [Google Scholar] [CrossRef] [PubMed]
  20. Russell Esposito, E.; Ranz, E.C.; Schmidtbauer, K.A.; Neptune, R.R.; Wilken, J.M. Ankle-Foot Orthosis Bending Axis Influences Running Mechanics. Gait Posture 2017, 56, 147–152. [Google Scholar] [CrossRef] [PubMed]
  21. Russell Esposito, E.; Blanck, R.V.; Harper, N.G.; Hsu, J.R.; Wilken, J.M. How Does Ankle-Foot Orthosis Stiffness Affect Gait in Patients with Lower Limb Salvage? Clin. Orthop. Relat. Res. 2014, 472, 3026–3035. [Google Scholar] [CrossRef]
  22. Jin, L.; Hahn, M.E. Modulation of Lower Extremity Joint Stiffness, Work and Power at Different Walking and Running Speeds. Hum. Mov. Sci. 2018, 58, 1–9. [Google Scholar] [CrossRef]
  23. Jin, L.; Hahn, M.E. Comparison of Lower Extremity Joint Mechanics between Healthy Active Young and Middle Age People in Walking and Running Gait. Sci. Rep. 2019, 9, 5568. [Google Scholar] [CrossRef]
  24. Jin, L.; Hahn, M.E. Lower Extremity Joint Kinetics during Walk-to-Run and Run-to-Walk Transitions. Biomechanics 2024, 4, 246–258. [Google Scholar] [CrossRef]
  25. Webster, K.E.; Santamaria, L.J.; McClelland, J.A.; Feller, J.A. Effect of Fatigue on Landing Biomechanics after Anterior Cruciate Ligament Reconstruction Surgery. Med. Sci. Sports Exerc. 2012, 44, 910–916. [Google Scholar] [CrossRef] [PubMed]
  26. Fagenbaum, R.; Darling, W.G. Jump Landing Strategies in Male and Female College Athletes and the Implications of Such Strategies for Anterior Cruciate Ligament Injury. Am. J. Sports Med. 2003, 31, 233–240. [Google Scholar] [CrossRef]
  27. Ortiz, A.; Olson, S.L.; Etnyre, B.; Trudelle-Jackson, E.E.; Bartlett, W.; Venegas-Rios, H.L. Fatigue Effects on Knee Joint Stability During Two Jump Tasks in Women. J. Strength Cond. Res./Natl. Strength Cond. Assoc. 2010, 24, 1019–1027. [Google Scholar] [CrossRef] [PubMed]
  28. Zhang, L.; Yan, Y.; Liu, G.; Han, B.; Fei, J.; Zhang, Y. Effect of Fatigue on Kinematics, Kinetics and Muscle Activities of Lower Limbs during Gait. Proc. Inst. Mech. Eng. H 2022, 236, 1365–1374. [Google Scholar] [CrossRef]
  29. Hietamo, J.; Pasanen, K.; Leppänen, M.; Steffen, K.; Kannus, P.; Heinonen, A.; Mattila, V.; Parkkari, J. Association between Lower Extremity Muscle Strength and Acute Ankle Injury in Youth Team-Sports Athletes. Phys. Ther. Sport. 2021, 48, 188–195. [Google Scholar] [CrossRef]
  30. Ishøi, L.; Krommes, K.; Husted, R.S.; Juhl, C.B.; Thorborg, K. Diagnosis, Prevention and Treatment of Common Lower Extremity Muscle Injuries in Sport-Grading the Evidence: A Statement Paper Commissioned by the Danish Society of Sports Physical Therapy (DSSF). Br. J. Sports Med. 2020, 54, 528–537. [Google Scholar] [CrossRef]
  31. Almousa, S.; Mullen, R.; Williams, K.; Bourne, M.; Williams, M. Identification of Potential Risk Factors for Lower Limb Injuries in Female Team-Sport Athletes: A Prospective Cohort Study. Sci. Med. Footb. 2024, 8, 126–137. [Google Scholar] [CrossRef] [PubMed]
  32. Li, L.; Baur, M.; Baldwin, K.; Kuehn, T.; Zhu, Q.; Herman, D.; Dai, B. Falling as a Strategy to Decrease Knee Loading during Landings: Implications for ACL Injury Prevention. J. Biomech. 2020, 109, 109906. [Google Scholar] [CrossRef] [PubMed]
  33. Puddle, D.L.; Maulder, P.S. Ground Reaction Forces and Loading Rates Associated with Parkour and Traditional Drop Landing Techniques. J. Sports Sci. Med. 2013, 12, 122. [Google Scholar] [PubMed]
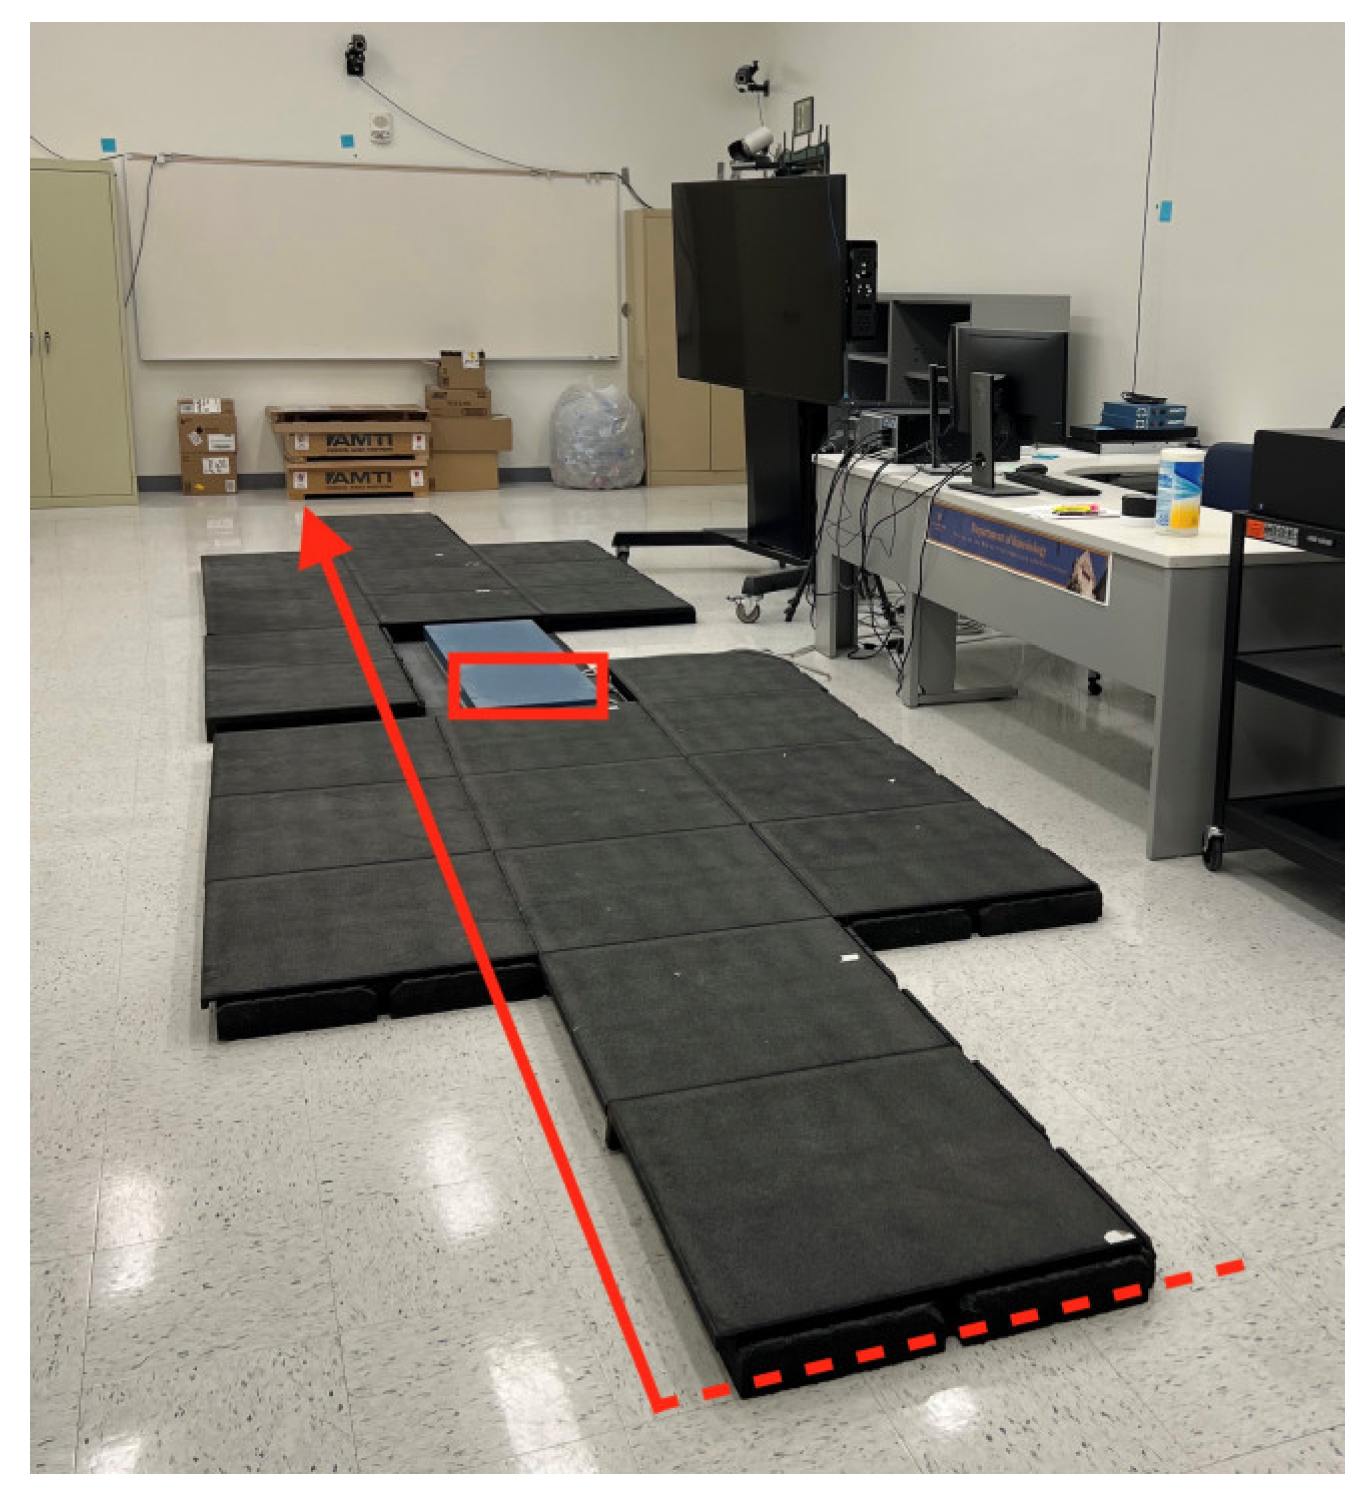
Figure 1. Biomechanics Research Laboratory at San José State University. Layup task setup: participants ran from the dashed line and performed a three-step layup along the red arrow path, with the contact force plate highlighted by the red rectangle.
Biomechanics 05 00081 g001
Figure 2. Lower-body plug-in gait model: blue markers define the required anatomical landmarks; red markers are used for tracking segments [16].
Biomechanics 05 00081 g002
Figure 3. Group average (n = 14) peak joint moment during drop landing and layup in pre-fatigue and post-fatigue conditions. For peak joint moment, we choose the absolute value for the bar graph generation. Ankle extension moment refers to plantar flexion moment; ankle flexion moment refers to dorsi flexion moment.
Biomechanics 05 00081 g003
Figure 4. Group average (n = 14) joint moment during drop landing and layup in pre-fatigue and post-fatigue conditions during ground contact period, time normalized to 100%.
Biomechanics 05 00081 g004
Figure 5. Group average (n = 14) joint power during drop landing and layup in pre-fatigue and post-fatigue conditions during ground contact period, time normalized to 100%.
Biomechanics 05 00081 g005
Figure 6. Group average (n = 14) peak joint work during drop landing and layup in pre-fatigue and post-fatigue conditions. The positive mechanical work (mechanical energy generation, muscle contracting concentrically) bar is going upward, while the negative mechanical work (mechanical energy absorption, muscle contracting eccentrically) is going downward. Statistically significant differences between pre- and post-fatigue conditions are marked with an asterisk (*).
Biomechanics 05 00081 g006
Table 1. Group average (n = 14) peak joint angle (degree) during drop landing and layup in pre-fatigue and post-fatigue conditions. Sample Mean (standard deviation).
Joint Angle (Degree)Fatigue Condition, Mean (SD), Percentage Difference, p-Value
Pre-FatiguePost-FatiguePercentage Difference (%)p-Value
Landing
Peak Ankle Dorsi Flexion5.36 (7.51)4.98 (6.82)7.350.543
Peak Ankle Plantar Flexion48.83 (6.10)47.27 (7.88)3.250.314
Peak Knee Flexion50.08 (11.98)51.33 (10.34)2.470.297
Peak Knee Extension8.00 (4.90)9.31 (5.04)15.140.124
Peak Hip Flexion30.18 (10.24)31.71 (12.87)4.940.315
Peak Hip Extension12.01 (7.07)10.93 (7.10)9.420.337
Layup
Peak Ankle Dorsi Flexion4.03 (6.13)3.39 (5.37)17.250.179
Peak Ankle Plantar Flexion55.90 (7.79)53.97 (5.46)3.510.062
Peak Knee Flexion56.75 (12.78)58.98 (12.46)3.850.460
Peak Knee Extension6.75 (6.01)9.28 (6.52)31.570.028
Peak Hip Flexion59.24 (8.23)59.00 (6.46)0.410.861
Peak Hip Extension1.62 (1.01)1.6 (1.26)1.240.950
Table 2. Group average (n = 14) peak vertical ground reaction forces (Body Weight) and peak joint moment (Nm/kg) during drop landing and layup in pre-fatigue and post-fatigue conditions. Sample Mean (standard deviation). Statistically significant differences between pre- and post-fatigue conditions are indicated in bold and marked with an asterisk (*).
Kinetic VariablesFatigue Condition, Mean (SD), Percentage Difference, p-Value
Pre-FatiguePost-FatiguePercentage Difference (%)p-Value
Landing
Peak Vertical Ground Reaction Forces3.41 (0.81)3.95 (1.10)14.670.036 *
Peak Ankle Dorsi Flexion Moment0.05 (0.04)0.06 (0.05)18.180.086
Peak Ankle Plantar Flexion Moment1.93 (0.65)2.31 (1.45)17.920.299
Peak Knee Flexion Moment0.47 (0.29)0.62 (0.34)27.520.221
Peak Knee Extension Moment2.38 (0.66)2.28 (0.60)4.290.423
Peak Hip Flexion Moment1.82 (0.78)1.93 (0.93)5.870.481
Peak Hip Extension Moment4.06 (2.20)4.81 (3.14)16.910.269
Layup
Peak Vertical Ground Reaction Force3.25 (0.51)3.13 (0.60)3.760.452
Peak Ankle Dorsi Flexion Moment0.47 (0.32)0.50 (0.34)6.190.627
Peak Ankle Plantar Flexion Moment2.78 (0.53)2.66 (0.52)4.410.295
Peak Knee Flexion Moment1.63 (1.36)2.02 (2.61)21.370.421
Peak Knee Extension Moment3.38 (0.88)3.72 (1.07)9.580.327
Peak Hip Flexion Moment2.19 (0.98)2.27 (1.05)3.590.374
Peak Hip Extension Moment5.73 (4.27)5.04 (3.95)12.810.414
Table 3. Group average (n = 14) peak joint power (W/kg) during drop landing and layup in pre-fatigue and post-fatigue conditions. Sample Mean (standard deviation).
Peak Joint Power (W/kg)Fatigue Condition, Mean (SD), Percentage Difference, p-Value
Pre-FatiguePost-FatiguePercentage Difference (%)p-Value
Landing
Peak Positive Ankle Power2.08 (1.40)2.98 (3.47)35.570.362
Peak Positive Knee Power2.77 (1.03)3.98 (2.67)35.830.081
Peak Positive Hip Power2.14 (1.06)2.58 (1.72)18.640.116
Peak Negative Ankle Power 9.95 (2.96) 9.86 (4.56)0.910.938
Peak Negative Knee Power 11.48 (5.92) 11.65 (5.28)1.470.834
Peak Negative Hip Power 11.27 (11.56) 12.47 (8.87)10.110.413
Layup
Peak Positive Ankle Power17.66 (5.48)18.04 (4.79)2.130.801
Peak Positive Knee Power14.95 (6.38)16.09 (7.00)7.350.527
Peak Positive Hip Power13.18 (11.33)12.36 (8.88)6.420.611
Peak Negative Ankle Power 4.15 (1.70) 4.27 (1.75)2.850.677
Peak Negative Knee Power 7.90 (2.86) 9.75 (5.20)20.960.149
Peak Negative Hip Power 12.64 (6.63) 10.96 (11.37)14.20.602
Table 4. Group average (n = 14) mechanical work (J/kg) during drop landing and layup in pre-fatigue and post-fatigue conditions. Sample Mean (standard deviation). Statistically significant differences between pre- and post-fatigue conditions are indicated in bold and marked with an asterisk (*).
Mechanical Work (J/kg)Fatigue Condition, Mean (SD), Percentage Difference, p-Value
Pre-FatiguePost-FatiguePercentage Difference (%)p-Value
Landing
Positive Ankle Joint Work0.18 (0.12)0.25 (0.17)32.560.167
Positive Knee Joint Work0.27 (0.16)0.30 (0.15)10.530.236
Positive Hip Joint Work0.23 (0.22)0.29 (0.24)23.080.031
Negative Ankle Joint Work 0.68 (0.26) 0.69 (0.23)1.460.913
Negative Knee Joint Work 0.72 (0.36) 0.63 (0.61)13.330.498
Negative Hip Joint Work 0.34 (0.18) 0.66 (0.43)640.025 *
Layup
Positive Ankle Joint Work1.13 (0.37)1.09 (0.31)3.600.585
Positive Knee Joint Work1.07 (0.44)1.04 (0.54)2.840.866
Positive Hip Joint Work0.83 (0.53)0.68 (0.30)19.870.214
Negative Ankle Joint Work 0.29 (0.13) 0.26 (0.11)10.910.346
Negative Knee Joint Work 0.65 (0.22) 0.73 (0.28)11.590.193
Negative Hip Joint Work 0.79 (0.46) 0.92 (0.53)15.200.078
Disclaimer/Publisher’s Note: The statements, opinions and data contained in all publications are solely those of the individual author(s) and contributor(s) and not of MDPI and/or the editor(s). MDPI and/or the editor(s) disclaim responsibility for any injury to people or property resulting from any ideas, methods, instructions or products referred to in the content.