Article

Effects of Unilateral Swing Leg Resistance on Propulsion and Other Gait Characteristics During Treadmill Walking in Able-Bodied Individuals

by
Sylvana Minkes-Weiland
1,2,*,
Han Houdijk
1,
Heleen A. Reinders-Messelink
2,3,
Luc H. V. van der Woude
1,3,4,
Paul P. Hartman
2 and
Rob den Otter
1
1
Department of Human Movement Sciences, University Medical Center Groningen, University of Groningen, 9713 AV Groningen, The Netherlands
2
Rehabilitation Center ‘Revalidatie Friesland’, 9244 CL Beetsterzwaag, The Netherlands
3
Center for Rehabilitation, University Medical Center Groningen, University of Groningen, 9713 AV Groningen, The Netherlands
4
Peter Harrison Center for Disability Sport, School of Sport, Exercise and Health Sciences, Loughborough University, Loughborough LE11 3TU, UK
*
Author to whom correspondence should be addressed.
Biomechanics 2025, 5(4), 71; https://doi.org/10.3390/biomechanics5040071
Submission received: 29 July 2025 / Revised: 28 August 2025 / Accepted: 10 September 2025 / Published: 23 September 2025
(This article belongs to the Section Gait and Posture Biomechanics)

Abstract

Background/Objectives: Swing leg resistance may stimulate propulsive force, required for forward progression and leg swing, in post-stroke patients. To assess the potential of swing leg resistance in rehabilitation, more knowledge is needed on how this unilateral manipulation affects gait. Therefore, we explored the bilateral effects of a unilateral swing leg resistance on muscle activity, kinematics, and kinetics of gait in able-bodied individuals. Methods: Fourteen able-bodied participants (8 female, aged 20.7 ± 0.8 years, BMI 23.5 ± 1.9) walked on an instrumented treadmill at 0.28 m/s, 0.56 m/s, and 0.83 m/s with and without unilateral swing leg resistance provided by a weight (0 kg, 0.5 kg, 1.25 kg, and 2 kg) attached to the leg through a pulley system. Propulsion and braking forces, swing time, step length, transverse ground reaction torques, and muscle activity in the gluteus medius (GM), biceps femoris (BF), rectus femoris (RF), vastus medialis (VM), medial gastrocnemius (MG), and soleus (SOL) were compared between conditions. Statistical analyses were performed using repeated measures ANOVAs, with a significance level of 5%. Results: Peak propulsive force and propulsive duration increased bilaterally, while peak braking force decreased bilaterally with unilateral swing leg resistance. In addition, the swing time of the perturbed leg increased with swing leg resistance. Muscle activity in the perturbed leg (GM, BF, RF, VM, MG) and the unperturbed leg (GM, BF, VM, MG, SOL) increased. Only in the BF (perturbed leg, late swing) and MG (unperturbed leg, early stance) did the muscle activity decrease with swing leg resistance. No adaptations in step length and transverse ground reaction torques were observed. Specific effects were enhanced by gait speed. Conclusions: Unilateral swing leg resistance can evoke effects that might stimulate the training of propulsion. A study in post-stroke patients should be conducted to test whether prolonged exposure to unilateral swing leg resistance leads to functional training effects.

1. Introduction

Walking ability in people after stroke is frequently impaired. One of the factors that is often affected is the ability to generate propulsive forces on the affected side [1]. Propulsion can be defined as the positive anterior component of the ground reaction force (GRF) during the second half of stance [2] and is essential for the forward progression in human gait. A decreased propulsive capacity is often seen in ambulant patients with stroke and is associated with a diminished gait speed, functional balance, long distance walking ability, and self-perceived participation [1,3]. Therefore, improving the propulsive capacity should be an important target in rehabilitation post stroke [4,5].
The provision of restraining forces during walking can be a potential training strategy that is easy, safe, and cheap to stimulate propulsion after stroke [6]. When a resistance force is applied to one leg, more power is required to actively progress the leg through swing, progress the body’s center of mass (CoM) forward, and maintain stability. Prolonged exposure to unilateral swing leg resistance can potentially stimulate propulsive capacity in post-stroke patients as it will require the larger bilateral output of several muscles. First, the calf muscles are known to be substantial contributors to the progression of the CoM and the contralateral leg through swing [7,8]. Therefore, a bilateral increase in calf muscle activity is expected with swing leg resistance. Secondly, as previous work showed [9], hip extensors in the unperturbed leg and hip flexors in the perturbed leg play a major role in the forward progression of the trunk and perturbed swing leg, respectively. Increased quadriceps activity in the perturbed leg during swing progresses the leg through swing, while increased hamstring activity in the unperturbed leg contributes to progression of the trunk. These different effects in the perturbed and unperturbed leg may be exploited to target specific gait problems.
Unilateral swing leg resistance can be provided with a pulley force applied to one leg [9,10]. Previous research in participants post stroke and/or healthy participants concerning unilateral swing leg resistance have shown adaptations in the swing phase duration, step length, and hip angles [9,10]. In addition, a study in participants post stroke showed the potential of unilateral swing leg resistance for improving spatial symmetry and gait velocity [10]. However, unilateral swing leg resistance could influence other gait parameters that may not be desirable. For example, the unilateral backward pull might cause larger transverse external moments that need to be at least compensated by the contralateral hip muscles and the upper body to maintain stability. Therefore, there is a need to map the effects of unilateral swing leg resistance on multiple gait characteristics for both the perturbed leg and the unperturbed leg more broadly.
The primary aim of this study was to explore the bilateral effects of unilateral swing leg resistance on (1) anterior–posterior GRF, (2) step parameters, (3) transverse torques, and (4) muscle activity in both the perturbed and unperturbed leg during walking. Previous studies [9,10], primarily focused on the spatial and temporal step parameters, hip angle, and activity in the rectus femoris and hamstrings. In contrast, the present study takes a broader approach by including multiple muscles, the anterior–posterior GRF, and responses in the transverse plane. In this study we included healthy able-bodied individuals to explore basic biomechanical responses, from which we can derive specific manipulations that might be suitable for future gait training interventions in people after stroke. As individuals after stroke often display a decreased gait speed, and propulsion is known to increase with speed [11], it is important to assess how these effects depend on speed. Therefore, the secondary aim was to explore whether the effects of unilateral swing leg resistance were mediated by gait speed.

2. Materials and Methods

2.1. Participants

Fourteen healthy able-bodied participants (6 male/8 female, age 20.7 ± 0.8 years, height 1.82 ± 0.84 m, body weight 76.4 ± 9.0 kg, BMI 23.5 ± 1.9) participated in this study. Participants were excluded if they suffered disorders of a physiological, orthopedic, neurological, or sensorimotor nature that could affect the gait pattern. Experimental procedures were approved by the ethics committee of the Department of Human Movement Sciences (UMCG, The Netherlands; 201800977) and performed according to the declaration of Helsinki for medical research involving human subjects [12]. All participants provided written informed consent prior to the procedure.

2.2. Experimental Protocol

Participants walked on an instrumented treadmill (MGait, Motek, Amsterdam, The Netherlands) under twelve conditions for two minutes each. Data were recorded during the two minute intervals, roughly corresponding to 44–89 gait cycles depending on the applied speed (0.28, 0.56, or 0.83 m/s) and resistance condition (0, 0.5, 1.25, or 2.0 kg). Restraining forces were applied to the ankle during walking using a pulley-based system that was placed behind the treadmill ([13]; see Figure 1). By attaching a weight to a rope that was transferred by the pulley wheels to the subject’s right ankle, various resistance forces were applied. In this study, we chose to provide four weight levels (0 kg, 0.5 kg, 1.25 kg, and 2.0 kg) and three speed levels (0.28 m/s, 0.56 m/s, and 0.83 m/s) to account for the range of speeds observed in patients training post stroke [14]. The selected weight levels were based on pilot testing and practical considerations. Our aim was to span a broad range of external resistance, from light to substantially challenging, while ensuring participant safety and feasibility during the treadmill walking. The maximum level of 2.0 kg was close to the upper limit that participants could comfortably tolerate, and the intermediate loads allowed for the systematic assessment of incremental resistance effects. The average added external power generated by the pulley, equal to the product of applied vertical force and gait speed, ranged between 0 and 16.6 W depending on the (speed and weight) conditions. The twelve conditions (four weight levels over the three speed levels) were offered to the participants in a randomized order. Five minute breaks were offered between the conditions as a pragmatic choice to prevent carry-over effects while maintaining a feasible total testing duration. No accommodation period for the specific speed and load settings was provided. During all conditions, participants wore a harness suspended from the ceiling to prevent them from falling onto the belt. No body weight support was provided through this harness. Participants walked in their own shoes and were instructed not to hold the handrails while walking. No further instructions were provided.

2.3. Data Collection

Ground reaction forces (GRF’s) and surface electromyography (EMG) were recorded for both the perturbed (right) leg and unperturbed (left) leg. The GRF’s were recorded at 1000 Hz using two force plates that were embedded into the treadmill. Surface EMG was recorded for the gluteus medius (GM), biceps femoris (BF), rectus femoris (RF), vastus medialis (VM), medial gastrocnemius (MG), and soleus (SOL) using a Trigno Avanti wireless system (Delsys, Natick, MA, USA; 1925 Hz) with a fixed inter-electrode distance of 10 mm. Electrode locations were determined and prepared based on the SENIAM guidelines [15].

2.4. Data Analysis

Custom-made software routines were used to analyze the data offline in Matlab (R2015b, MathWorks, Natick, MA, USA). All force plate data were recursively filtered using a 15 Hz second-order low-pass Butterworth filter. Swing time was defined as the time between toe-off and heel strike. Step length, defined as the difference in the anterior–posterior CoP positions at heel strike between legs, was calculated from the force plate data, similar to previous research [16].
The anterior–posterior GRF amplitude was normalized to body weight. Negative values represented braking while positive values represented propulsion [17,18]. The propulsive duration, propulsive peak force, and braking peak force were calculated for each step and each participant. The application of unilateral swing leg resistance could lead to an external rotation moment exerted on the body during a single limb stance. To capture this external rotation moment, data from the force plates was used. The force plates embedded within the treadmill generate moments around three axes based on calibration matrices.
The moment around the longitudinal axis was extracted for each condition and each participant to calculate the mean transverse ground reaction torque during a single stance. This ground reaction torque reflects the sum of the external torque exerted by the pulley and the change in the whole body momentum around the longitudinal axis during a single stance (Newton’s second law). Group-averaged force profiles were calculated for the anterior–posterior GRF data and the transverse torques for each condition separately. To establish temporal alignment over the conditions for the statistical analysis, the profiles were time-normalized for stance (60 data points) and swing (40 data points) based on the gait cycle of the perturbed leg.
The EMG data were high-pass filtered using a 10 Hz fourth-order high-pass Butterworth filter to attenuate movement artefacts, full wave rectified, and low-pass filtered using a 20 Hz fourth-order recursive Butterworth filter. The resulting smoothed rectified EMG envelopes of both the perturbed and unperturbed legs were time-normalized for stance (60 data points) and swing (40 data points) of the perturbed leg using the synchronized force plate data, and subsequently averaged over strides, similar to the anterior–posterior GRF. Next, the EMG amplitude was normalized with respect to the maximum amplitude observed during treadmill walking at 0.28 m/s without a restraining force, for each muscle and each participant separately.

2.5. Statistical Analysis

Repeated measures (RM) ANOVAs with weight (0 kg, 0.5 kg, 1.25 kg, and 2.0 kg) and speed (0.28 m/s, 0.56 m/s, and 0.83 m/s) were conducted to assess the main effect of weight and the interaction of weight and speed for each leg separately. Two statistical approaches were used. Several RM ANOVAs were conducted using SPSS (version 23.0, IBM Corporation, Armonk, NY, USA) to assess the effects on the discrete variables swing time, step length, duration of propulsion, propulsive peak force, braking peak force, and transverse torque. The Benjamini–Hochberg correction was used to correct for multiple testing [19].
For the cycle profiles of anterior–posterior GRF, GM, BF, RF, MG, and SOL, Statistical Parametric Mapping (SPM [20]) was used. Open source spm1d code (v.M0.1), by www.spm1d.org (accessed on 27 December 2022) was used to conduct the SPM RM-ANOVAs in Matlab (R2015b, MathWorks, Natick, MA, USA).
The assumptions for using repeated measures ANOVA were verified by visual inspection of the residual plots to check for normality and homogeneity of variance. Effect sizes (partial eta-squared) were reported for the main analyses. As it was outside the scope of our study, no post hoc tests were conducted.
All tests were conducted separately for both the perturbed and unperturbed leg with an alpha of 0.05. The main effects of weight were interpreted according to our primary research aim ‘to explore the immediate bilateral effects of unilateral swing leg resistance on (1) anterior-posterior GRF, (2) step parameters, (3) transverse torques, and (4) muscle activity for both the perturbed and unperturbed leg during walking’. To answer the secondary research question ‘to explore whether functional effects of unilateral swing leg resistance were mediated by gait speed’, the interactive effects of weight with speed were interpreted. In case of significant effects or supra-threshold clusters, the direction of the effects was determined by comparing the means within the clusters.

3. Results

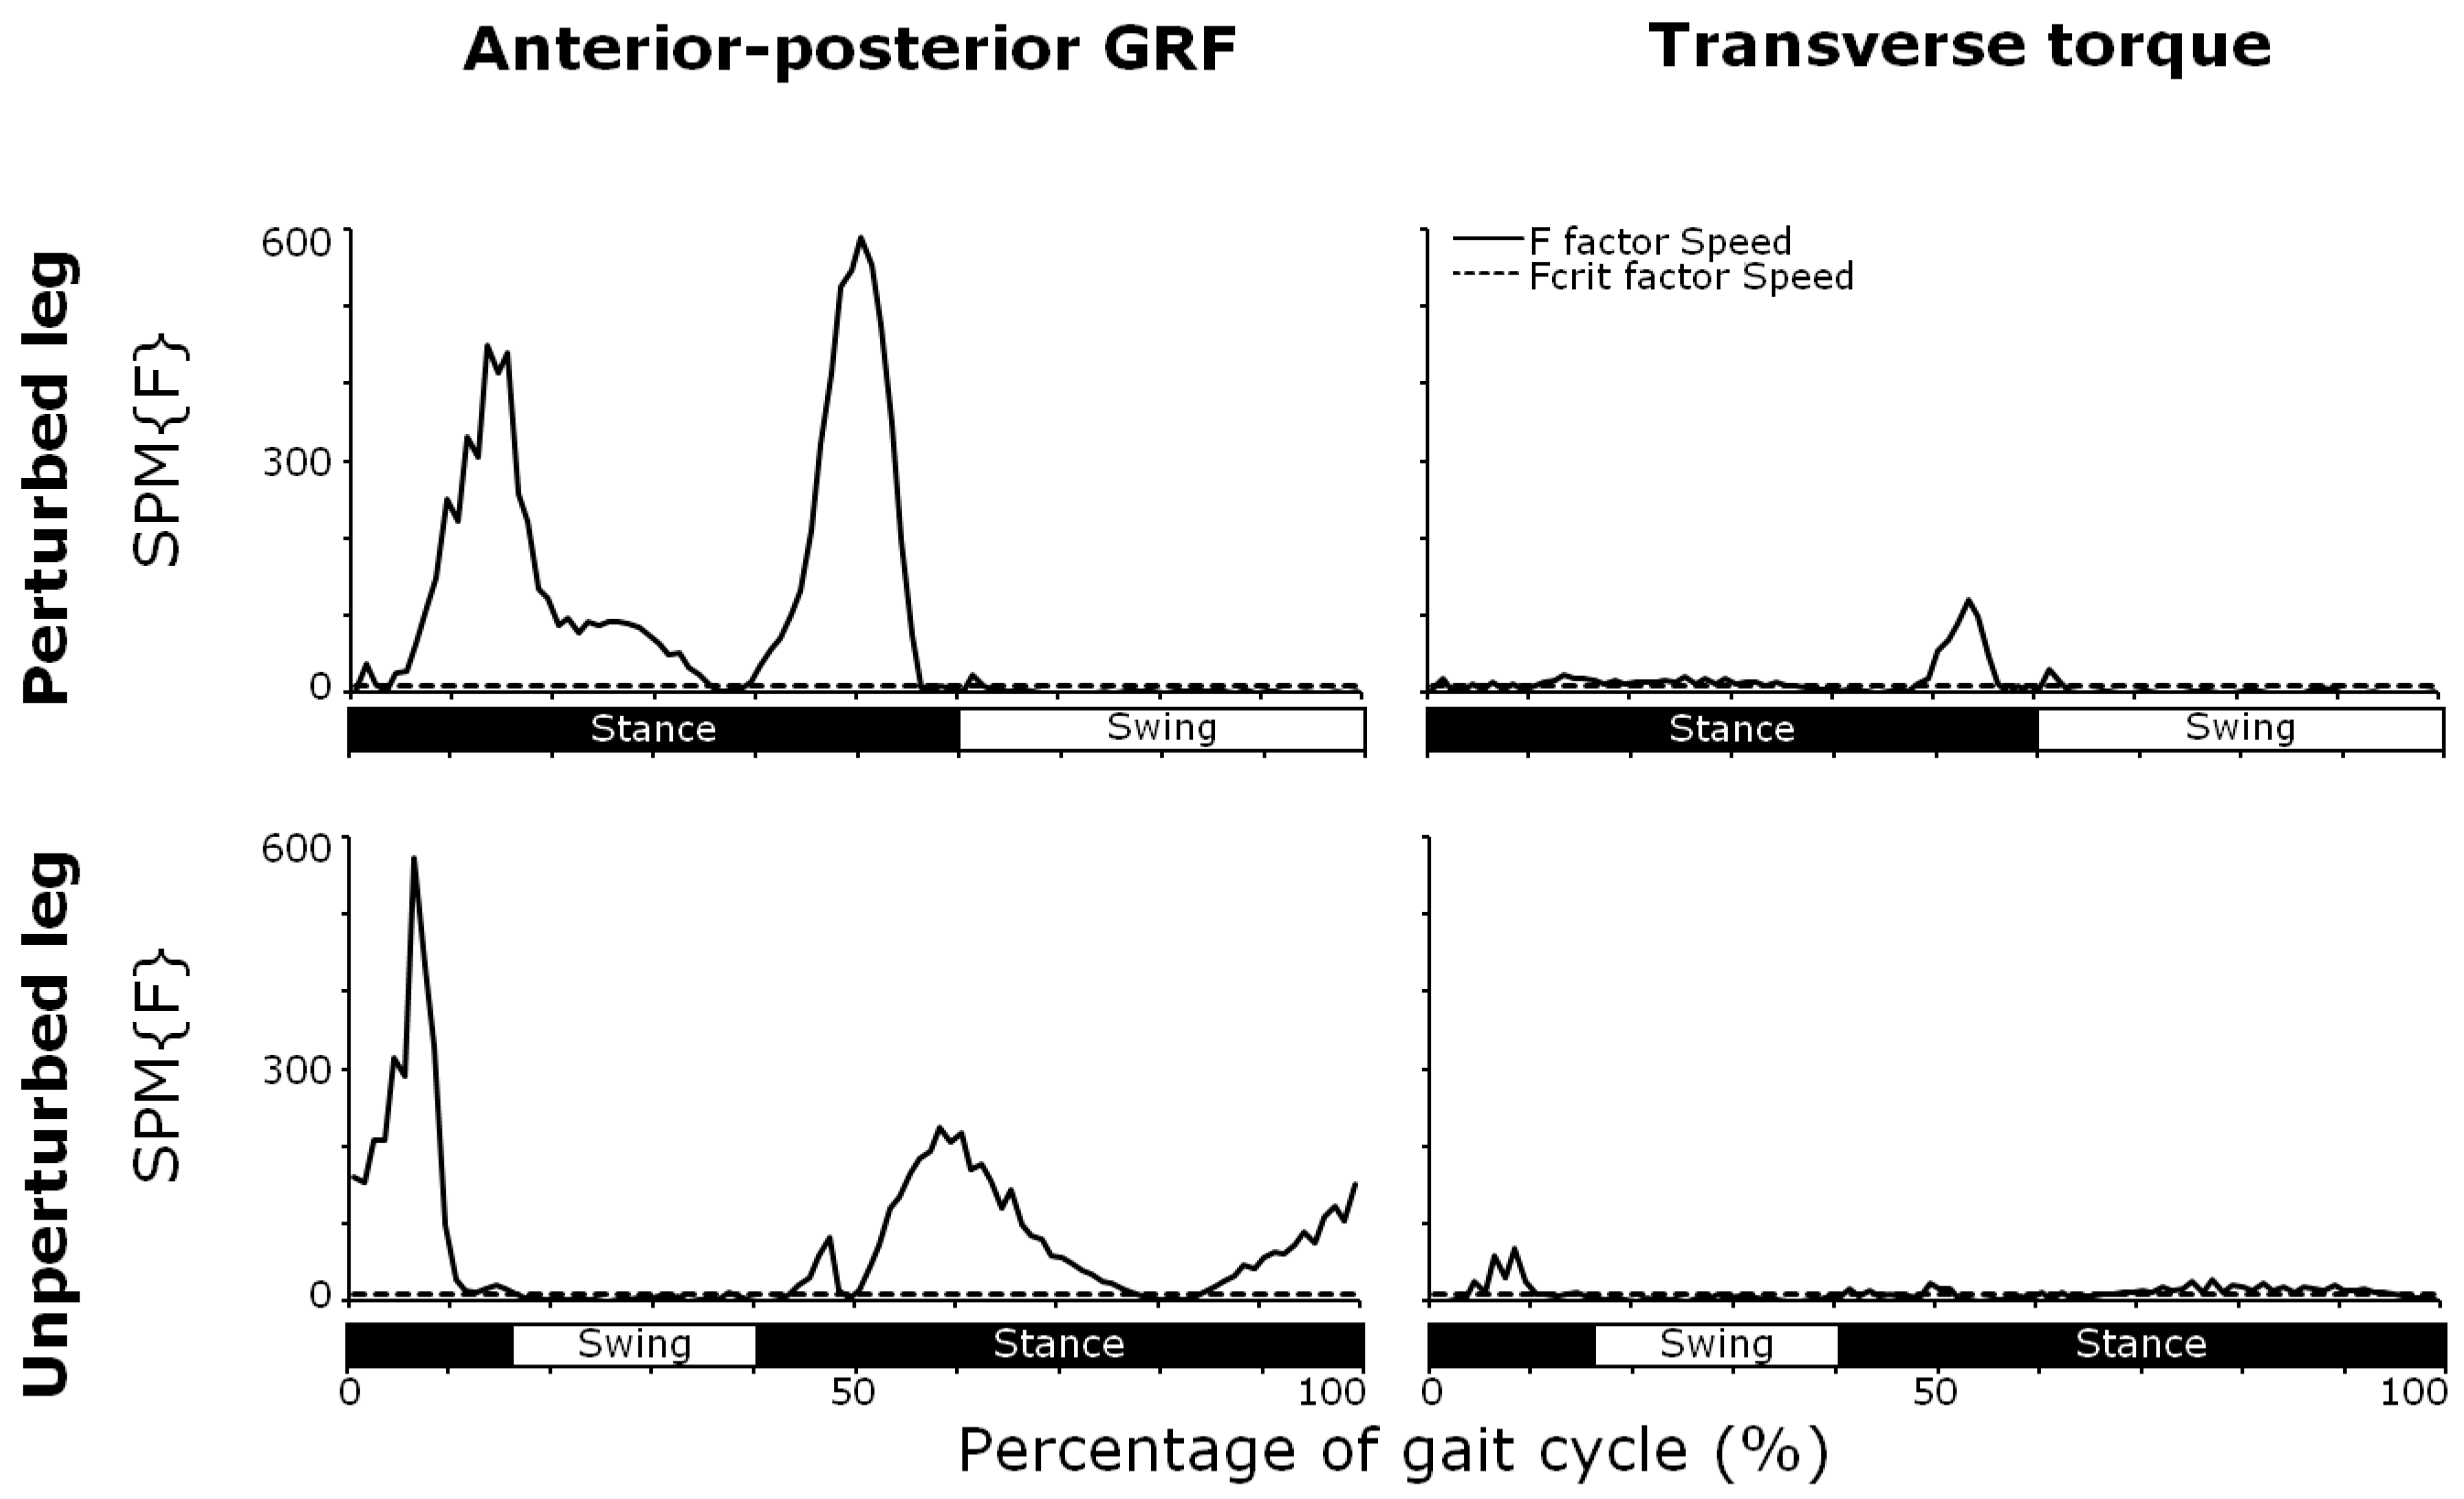
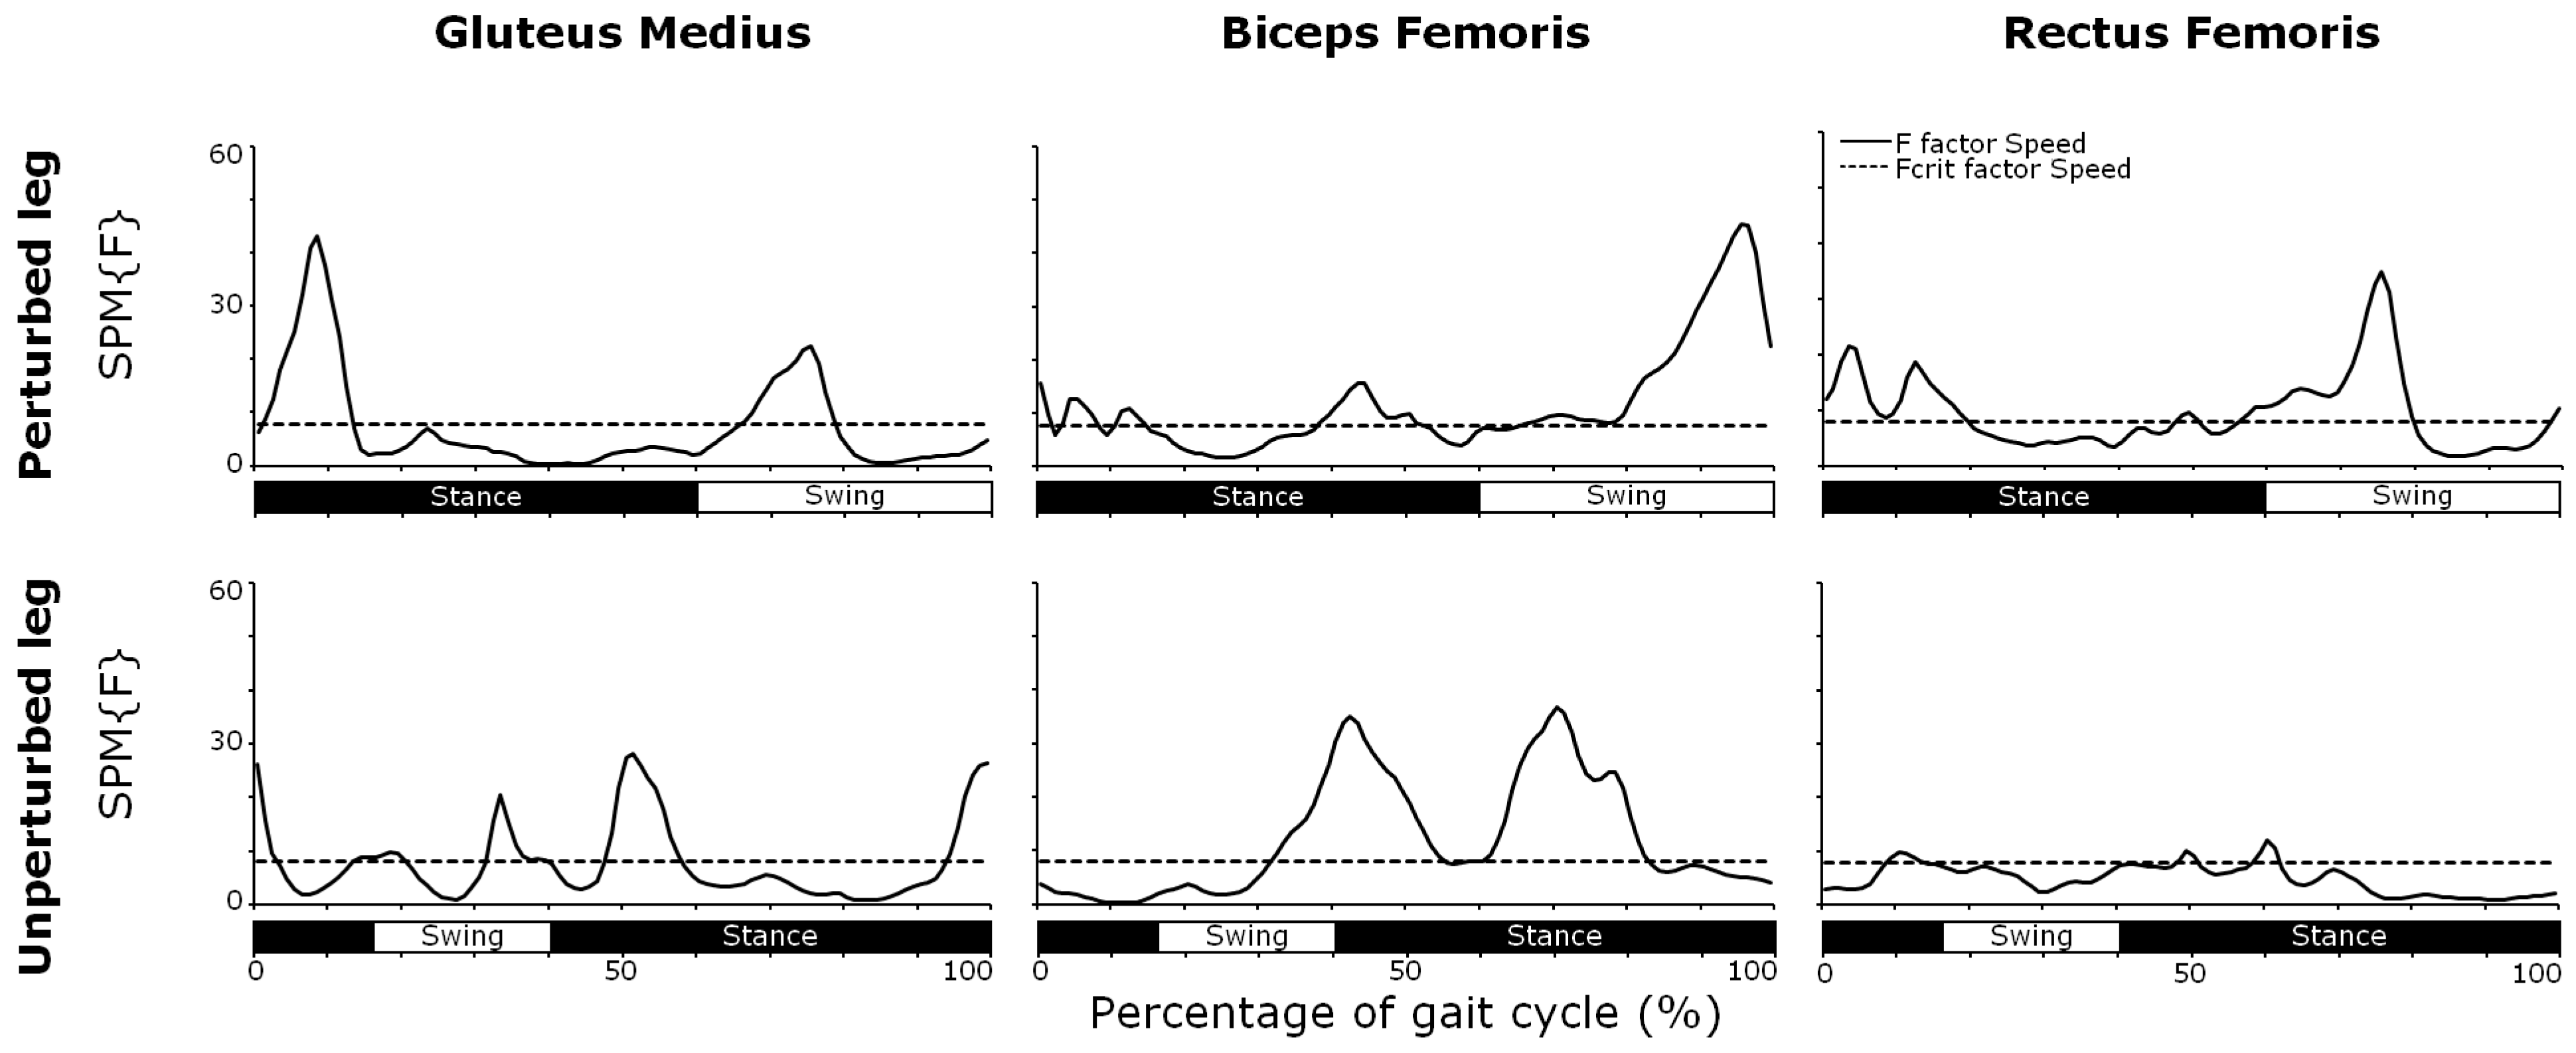
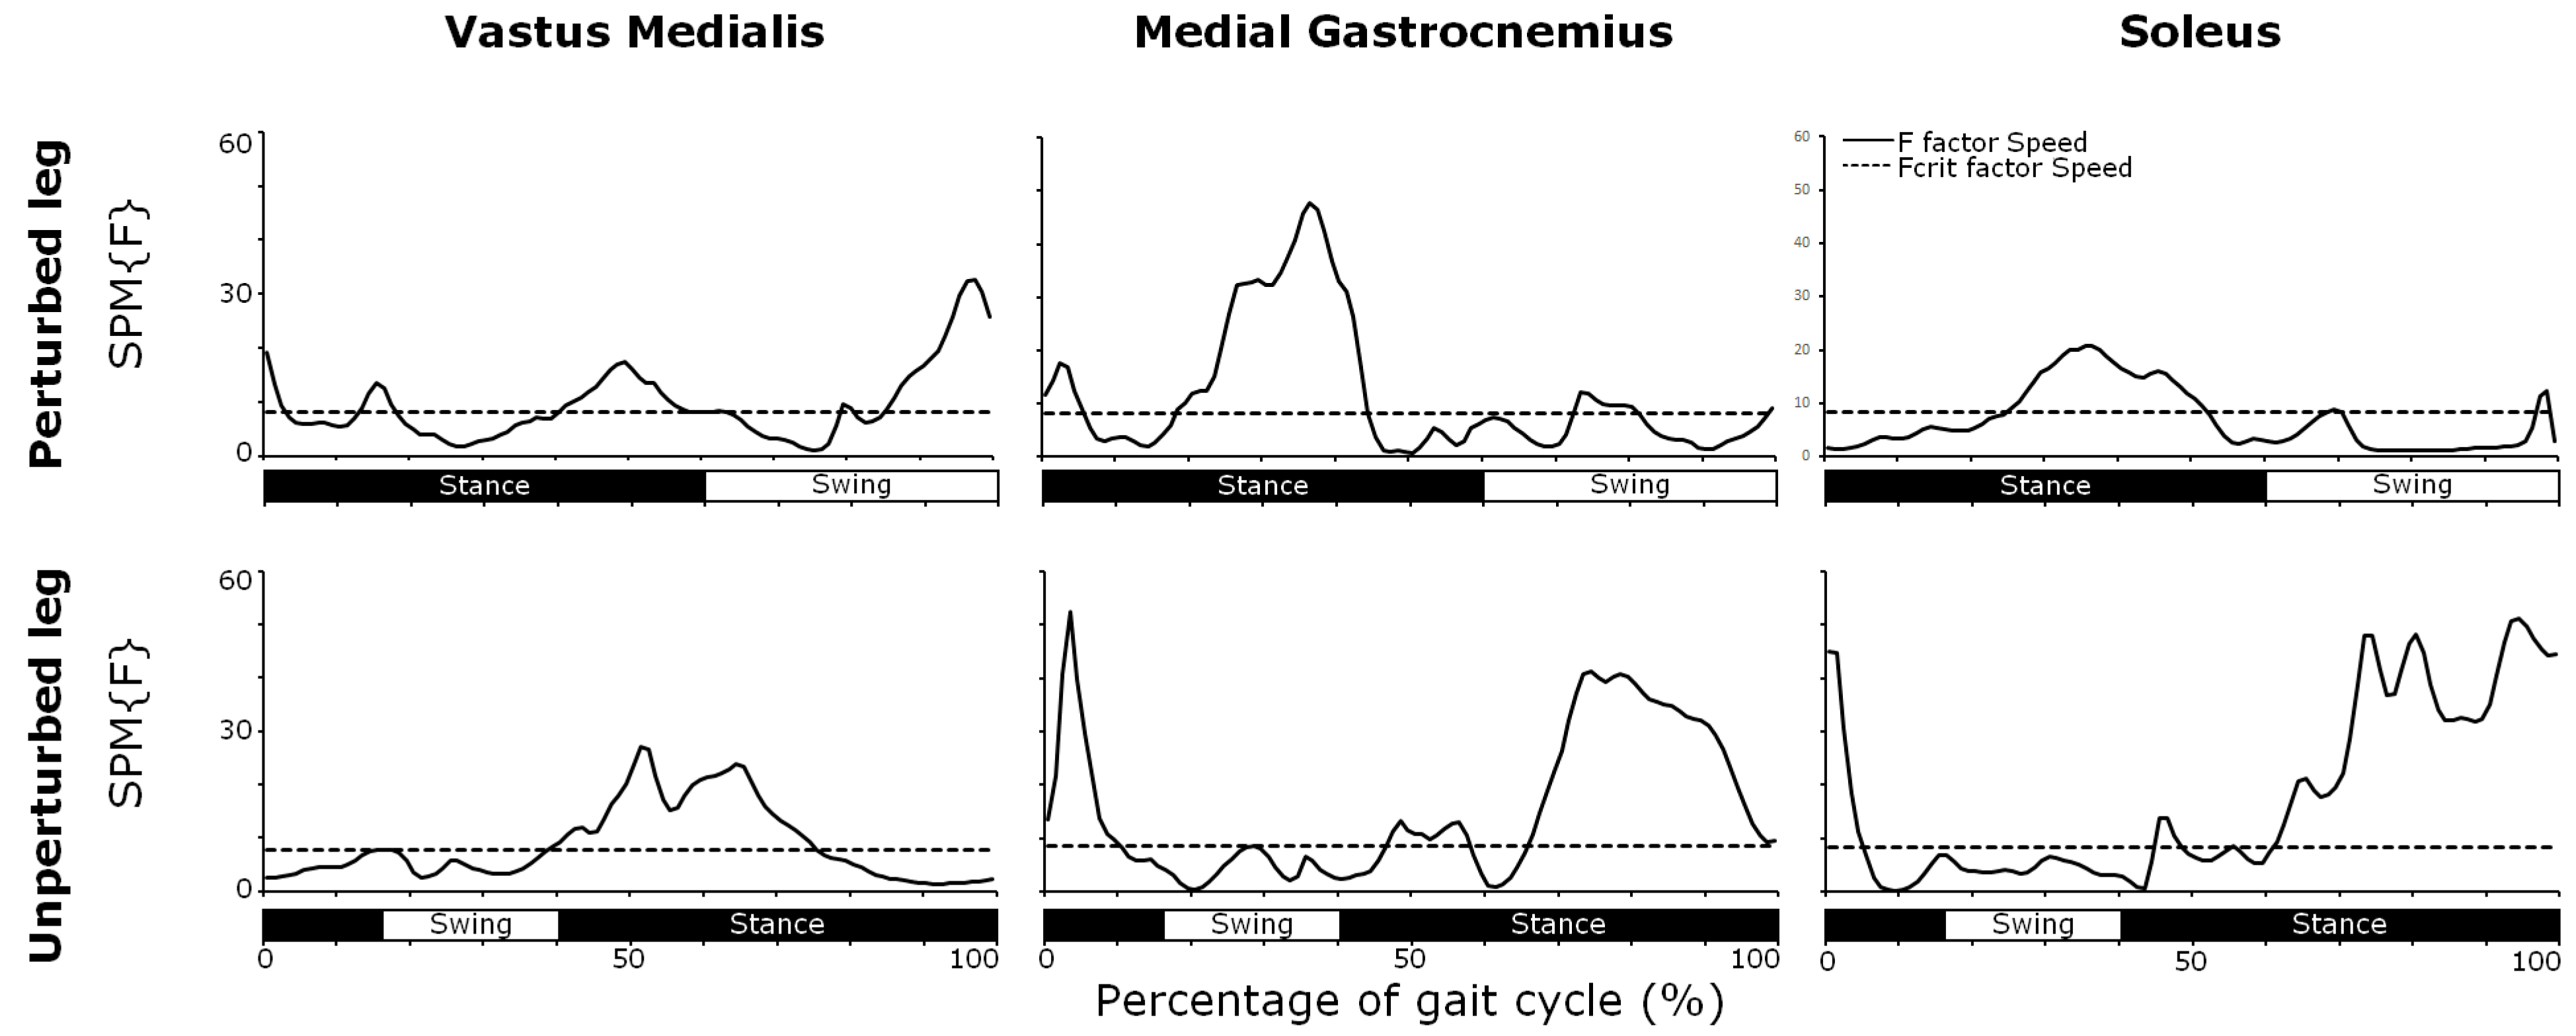
An overview of all SPM test results, including the main effects of speed, is presented in Table A1 and Table A2 in Appendix A. The main effects of speed are illustrated in Figure A1, Figure A2 and Figure A3 in Appendix A; however, similar to the post hoc tests, they are not discussed in the manuscript as this was beyond the scope of the current study.

3.1. Anterior–Posterior GRF

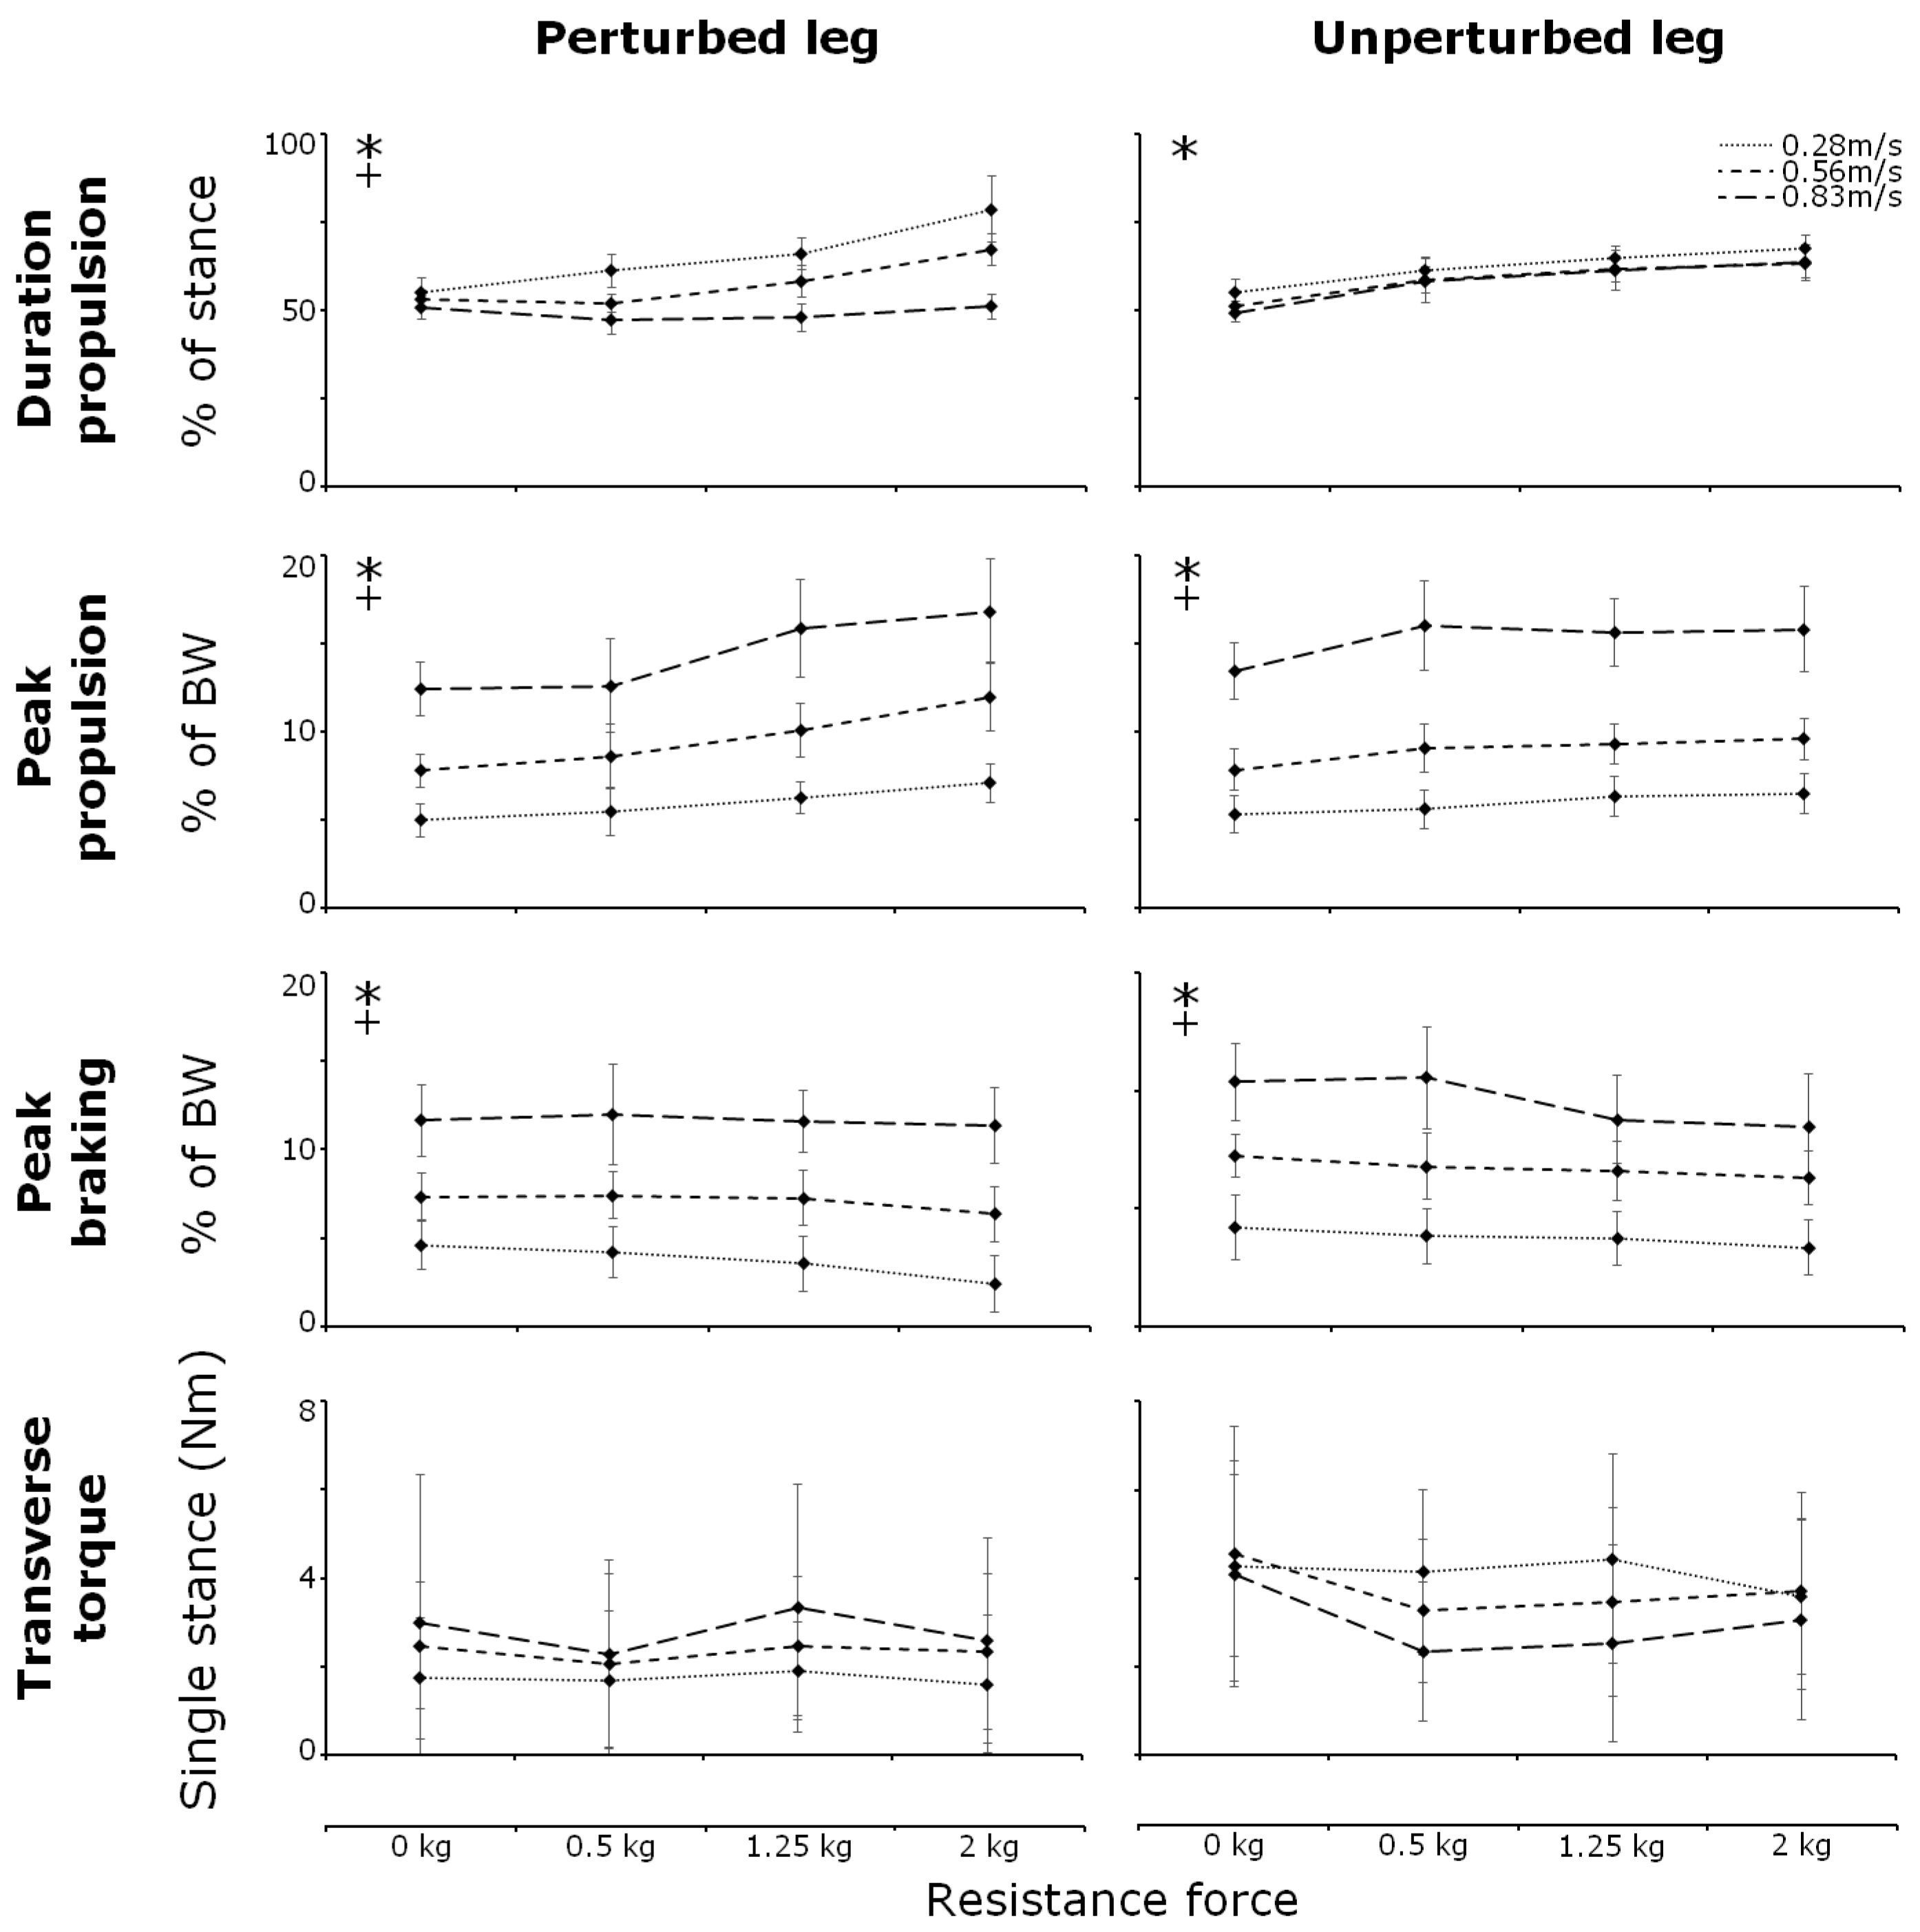
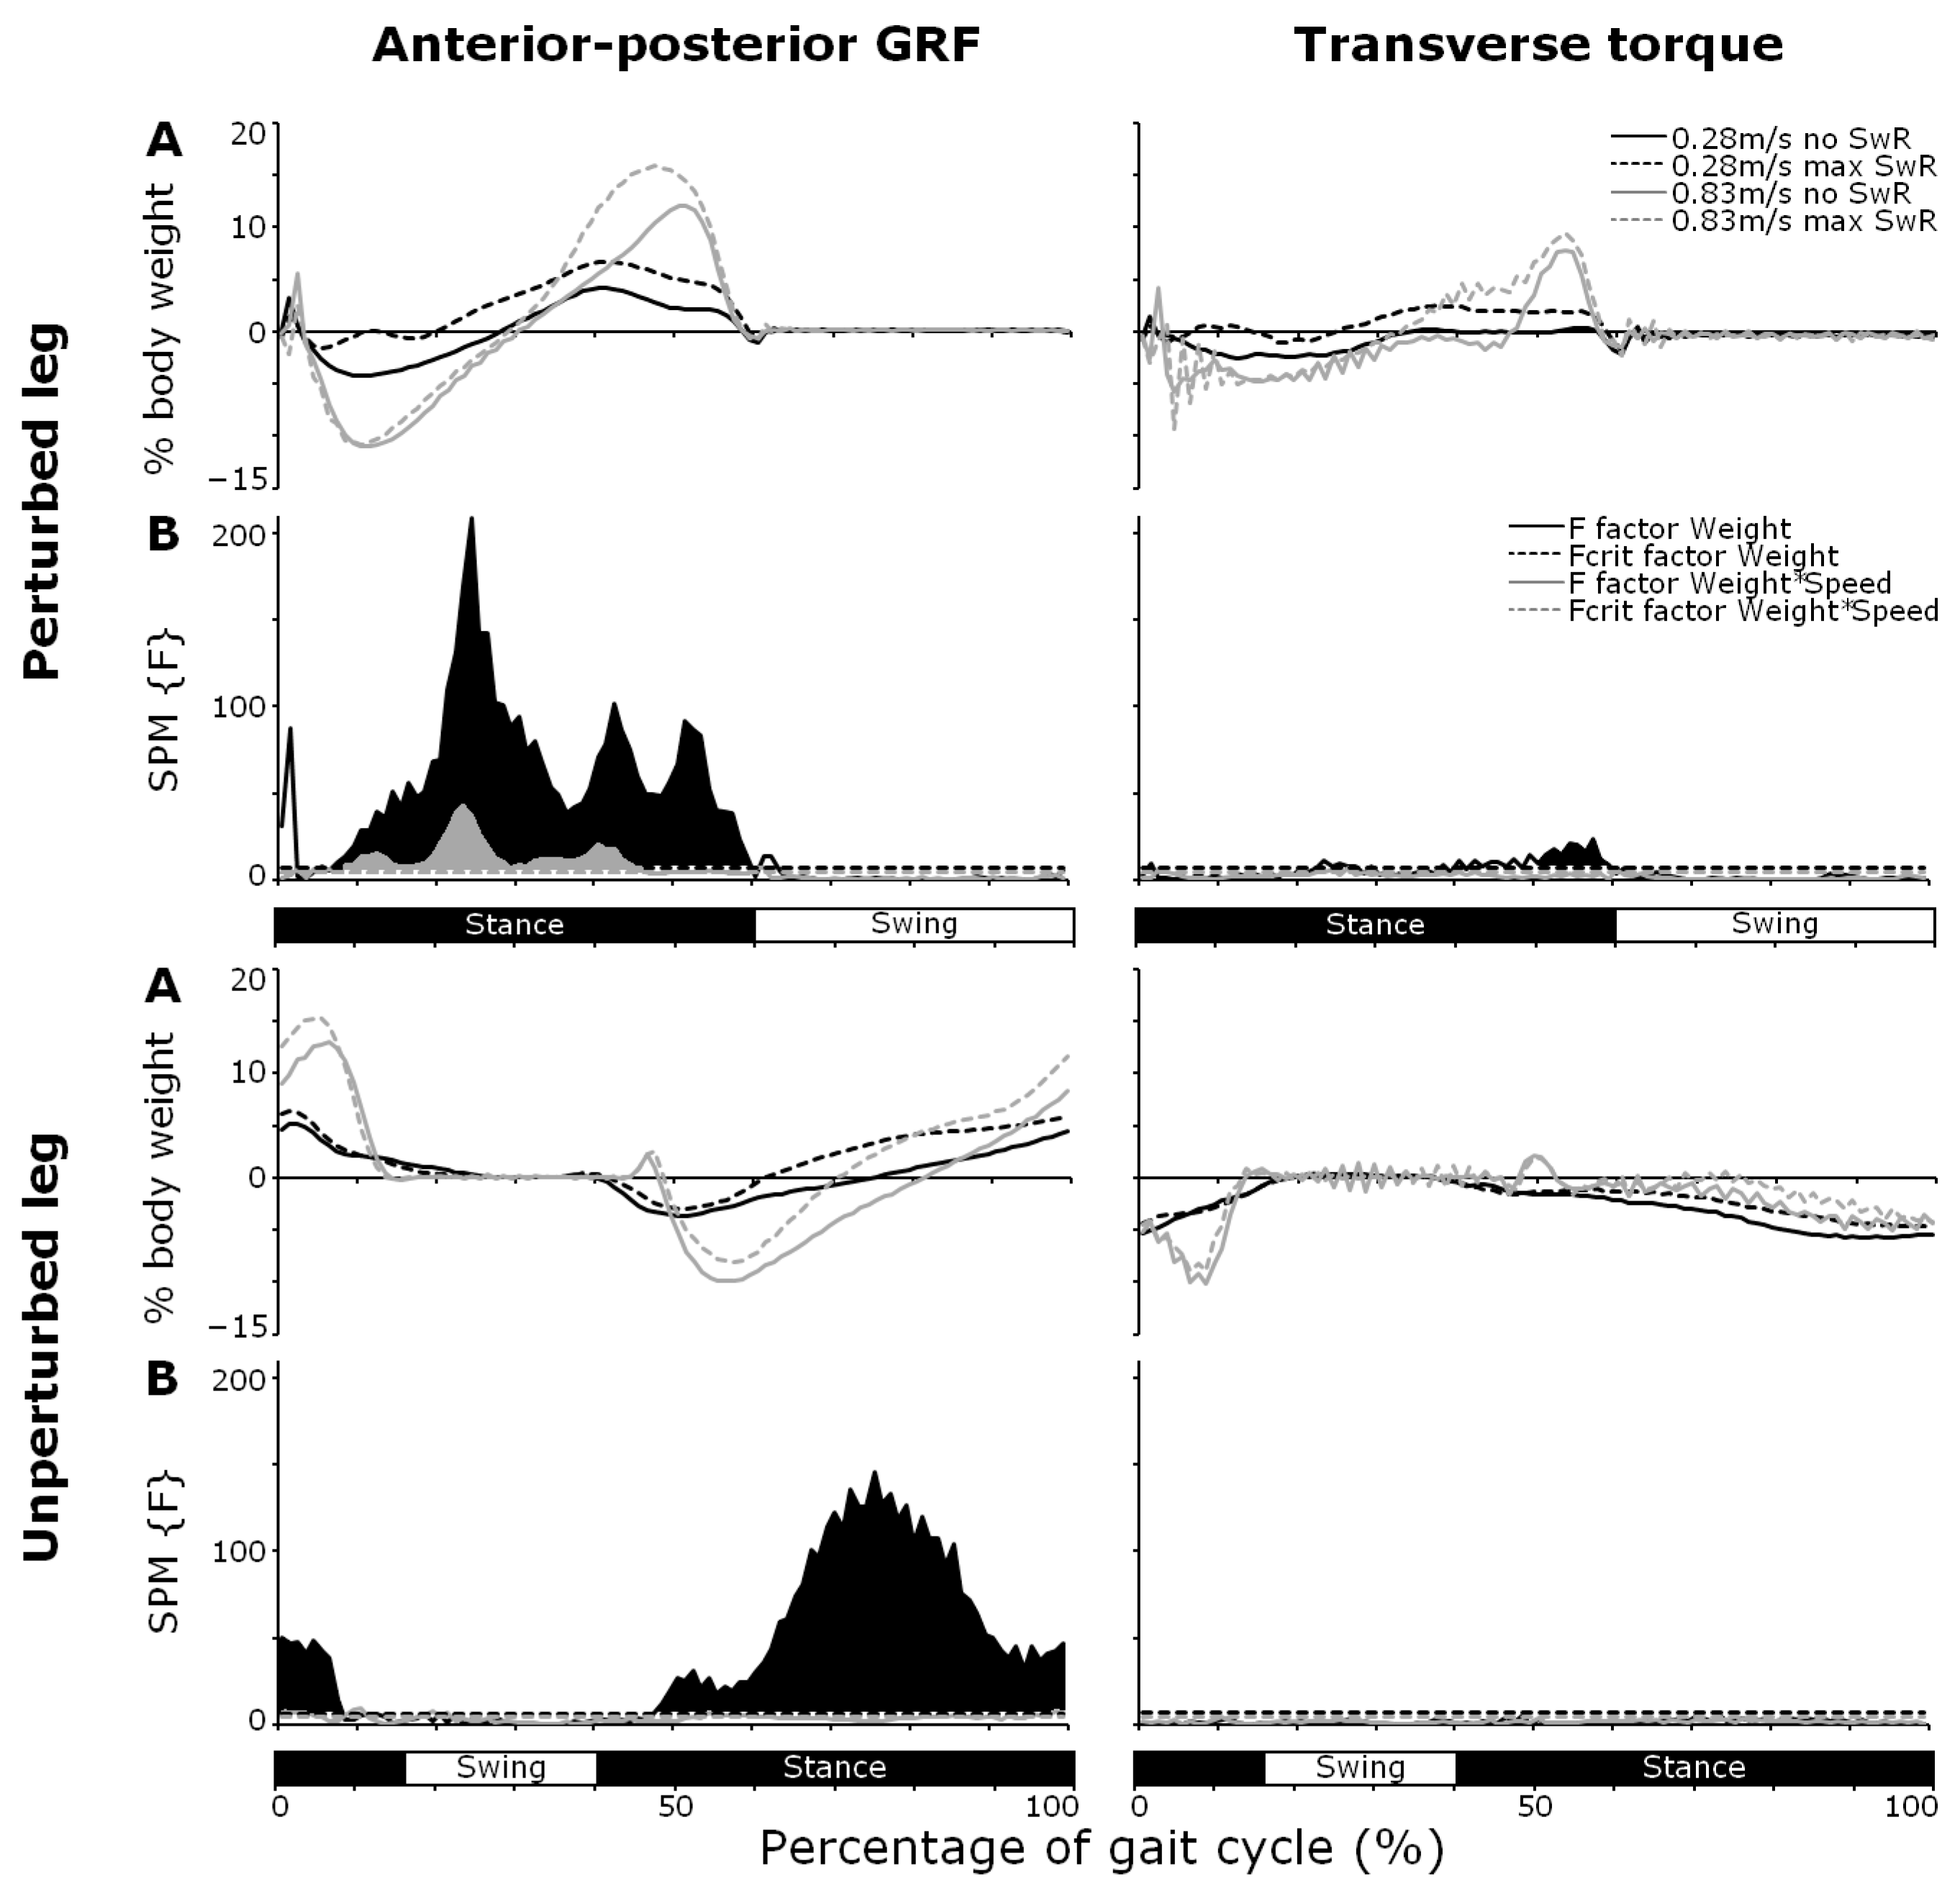
The braking peak force decreased in both the perturbed and unperturbed legs with unilateral swing leg resistance, while the propulsive peak force bilaterally increased with unilateral swing leg resistance (see Table 1 and Figure 2 and Figure 3). The significant weight–speed interactions indicated that these effects on the braking peak force in the perturbed leg were diminished with speed, while the effects on the braking peak force in the unperturbed leg and the propulsive peak force in both legs were enhanced at higher gait speeds (Figure 2).
The duration of the propulsive phase increased in both legs with unilateral swing leg resistance, as evidenced by a significant main effect of weight (Figure 2). A significant weight–speed interaction for the perturbed leg indicated that the effect of unilateral swing leg resistance on propulsive duration in the perturbed leg reduced with higher speeds.

3.2. Step Parameters

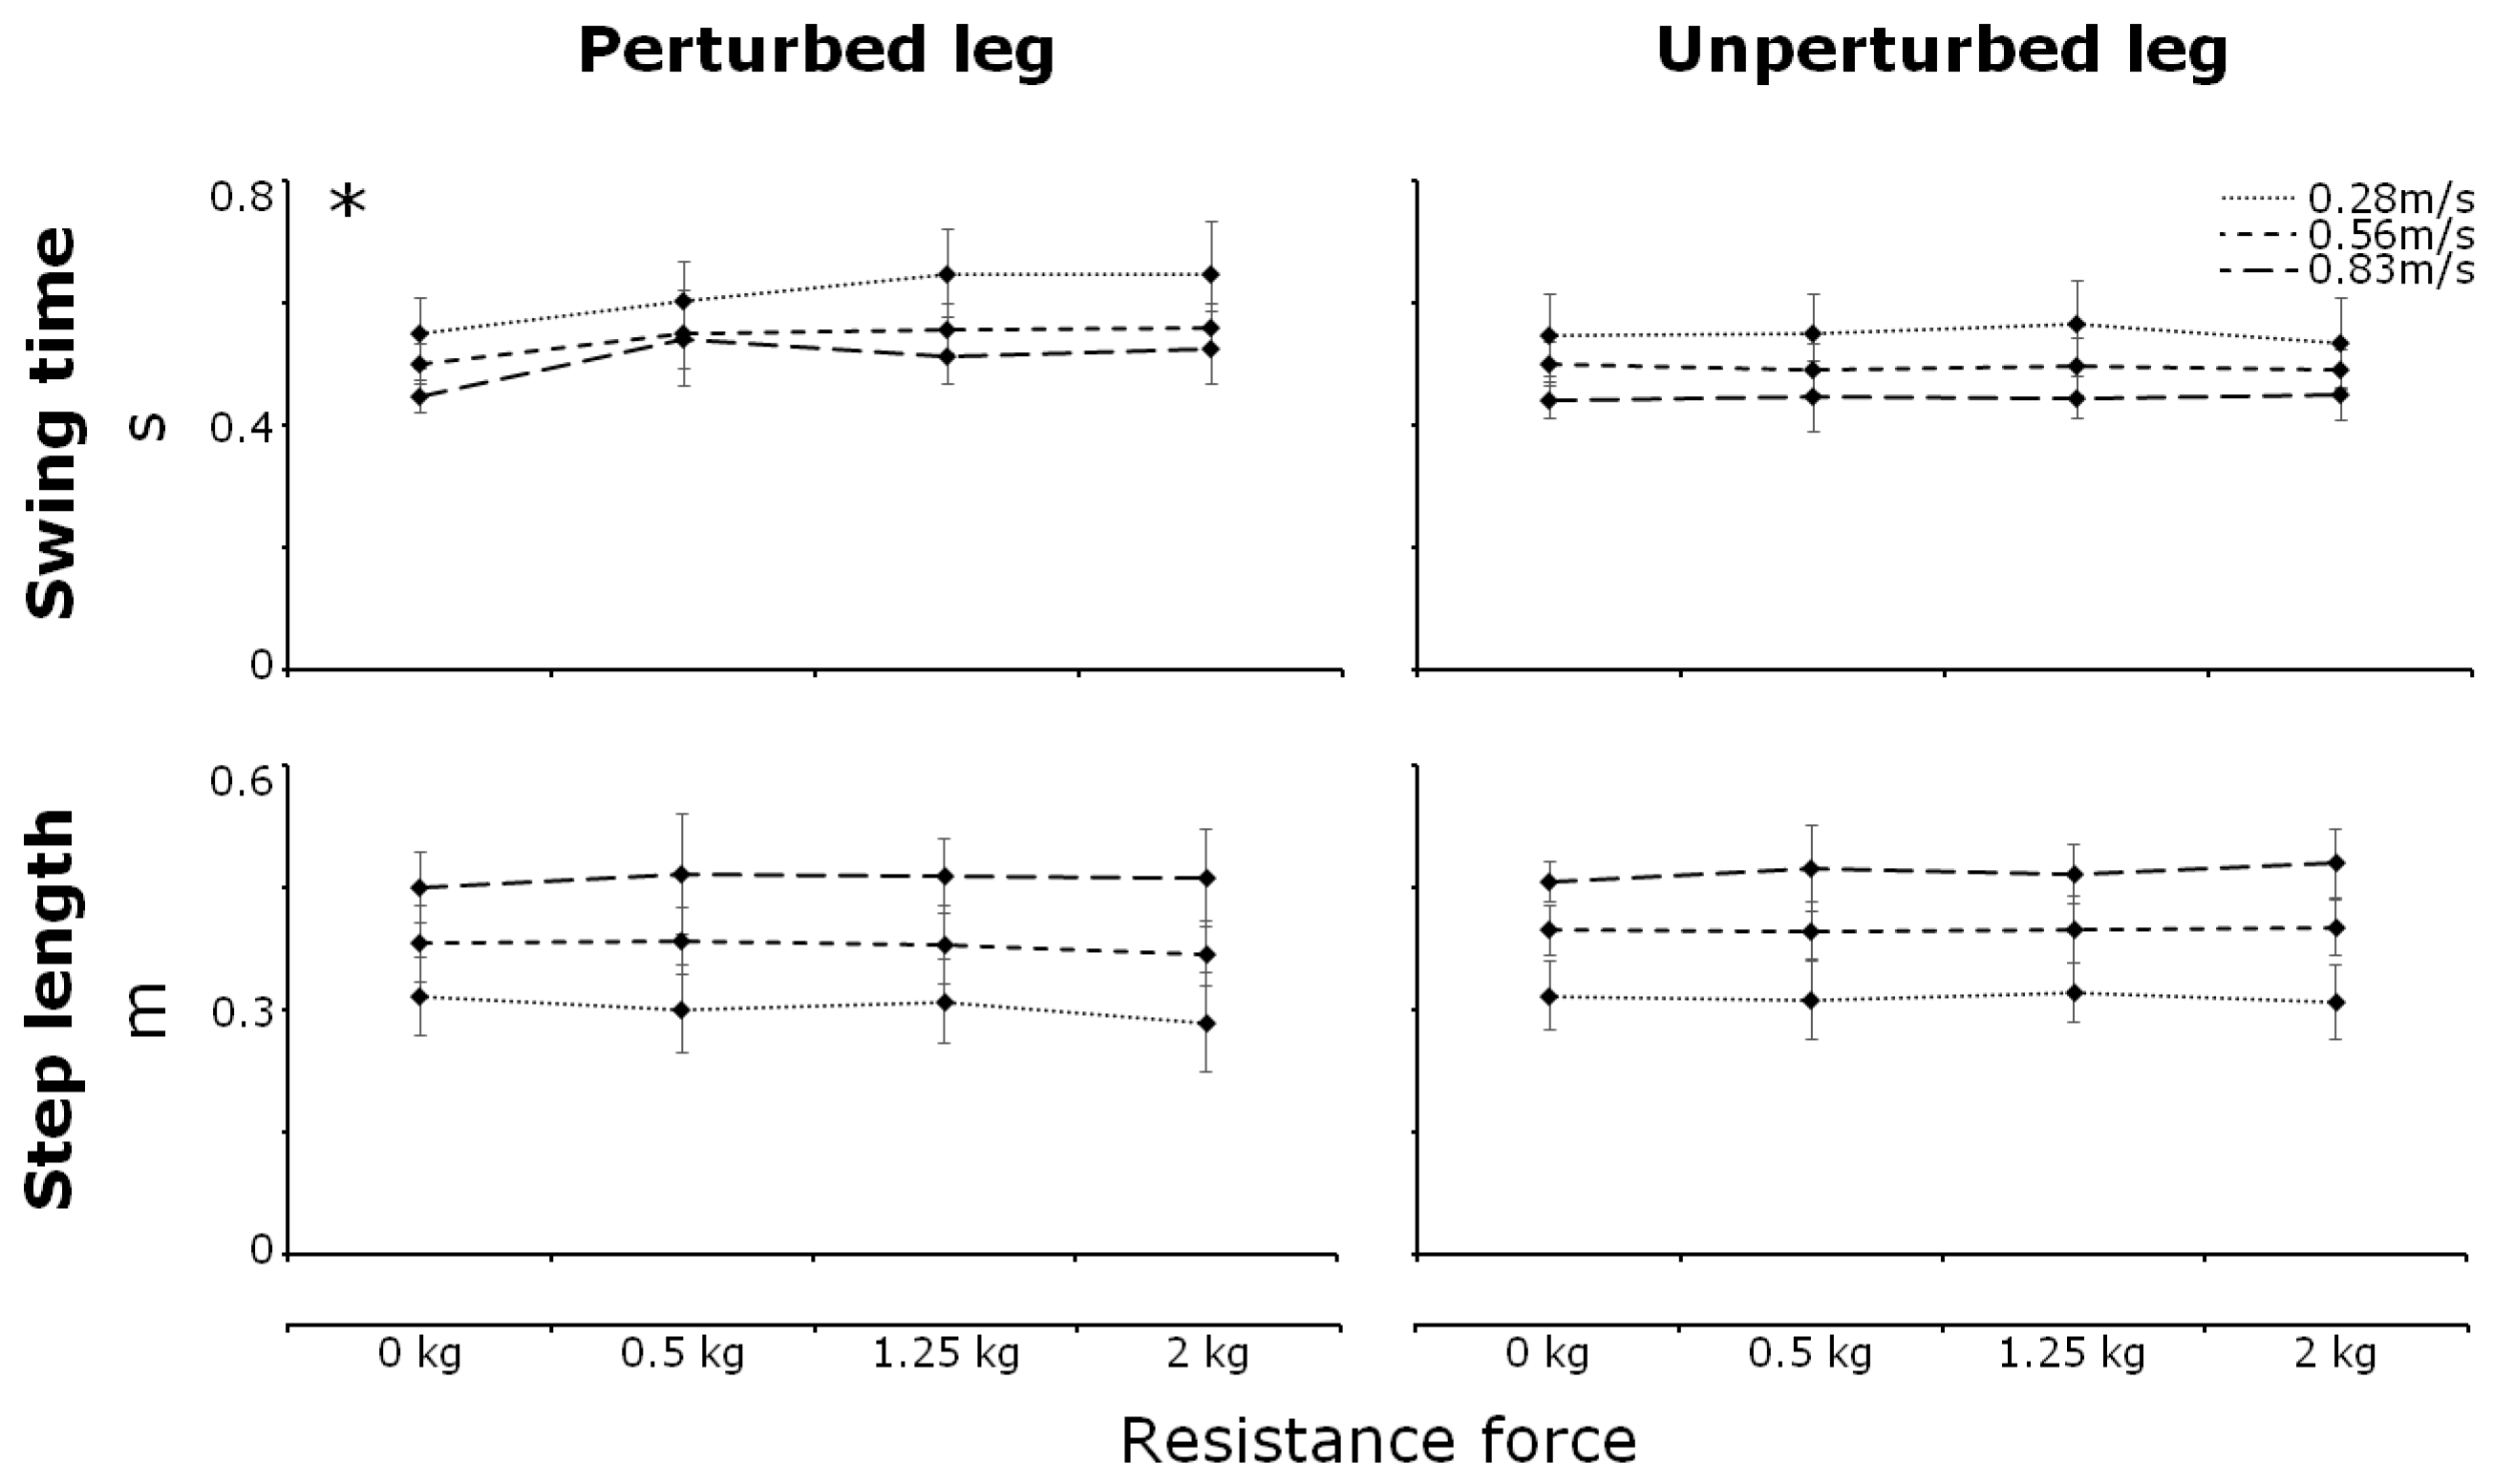
As presented in Table 1 and Figure 4, a significant main effect of the factor weight was that the swing time of the perturbed leg increased with leg resistance, as indicated by a significant main effect of weight (Figure 4). No effects on step length in both legs, swing time of the unperturbed leg, and/or significant weight–speed interactions on these parameters were found.

3.3. Transverse Torques

The RM ANOVAs showed no significant effects of unilateral swing leg resistance on the mean transverse torques during a single stance (see Figure 2 for means and standard deviations). As presented in Figure 3, the SPM analysis showed only one small supra-threshold cluster for the factor weight in the perturbed leg during late stance indicating a small increase in transverse torque with swing leg resistance.

3.4. Muscle Activity

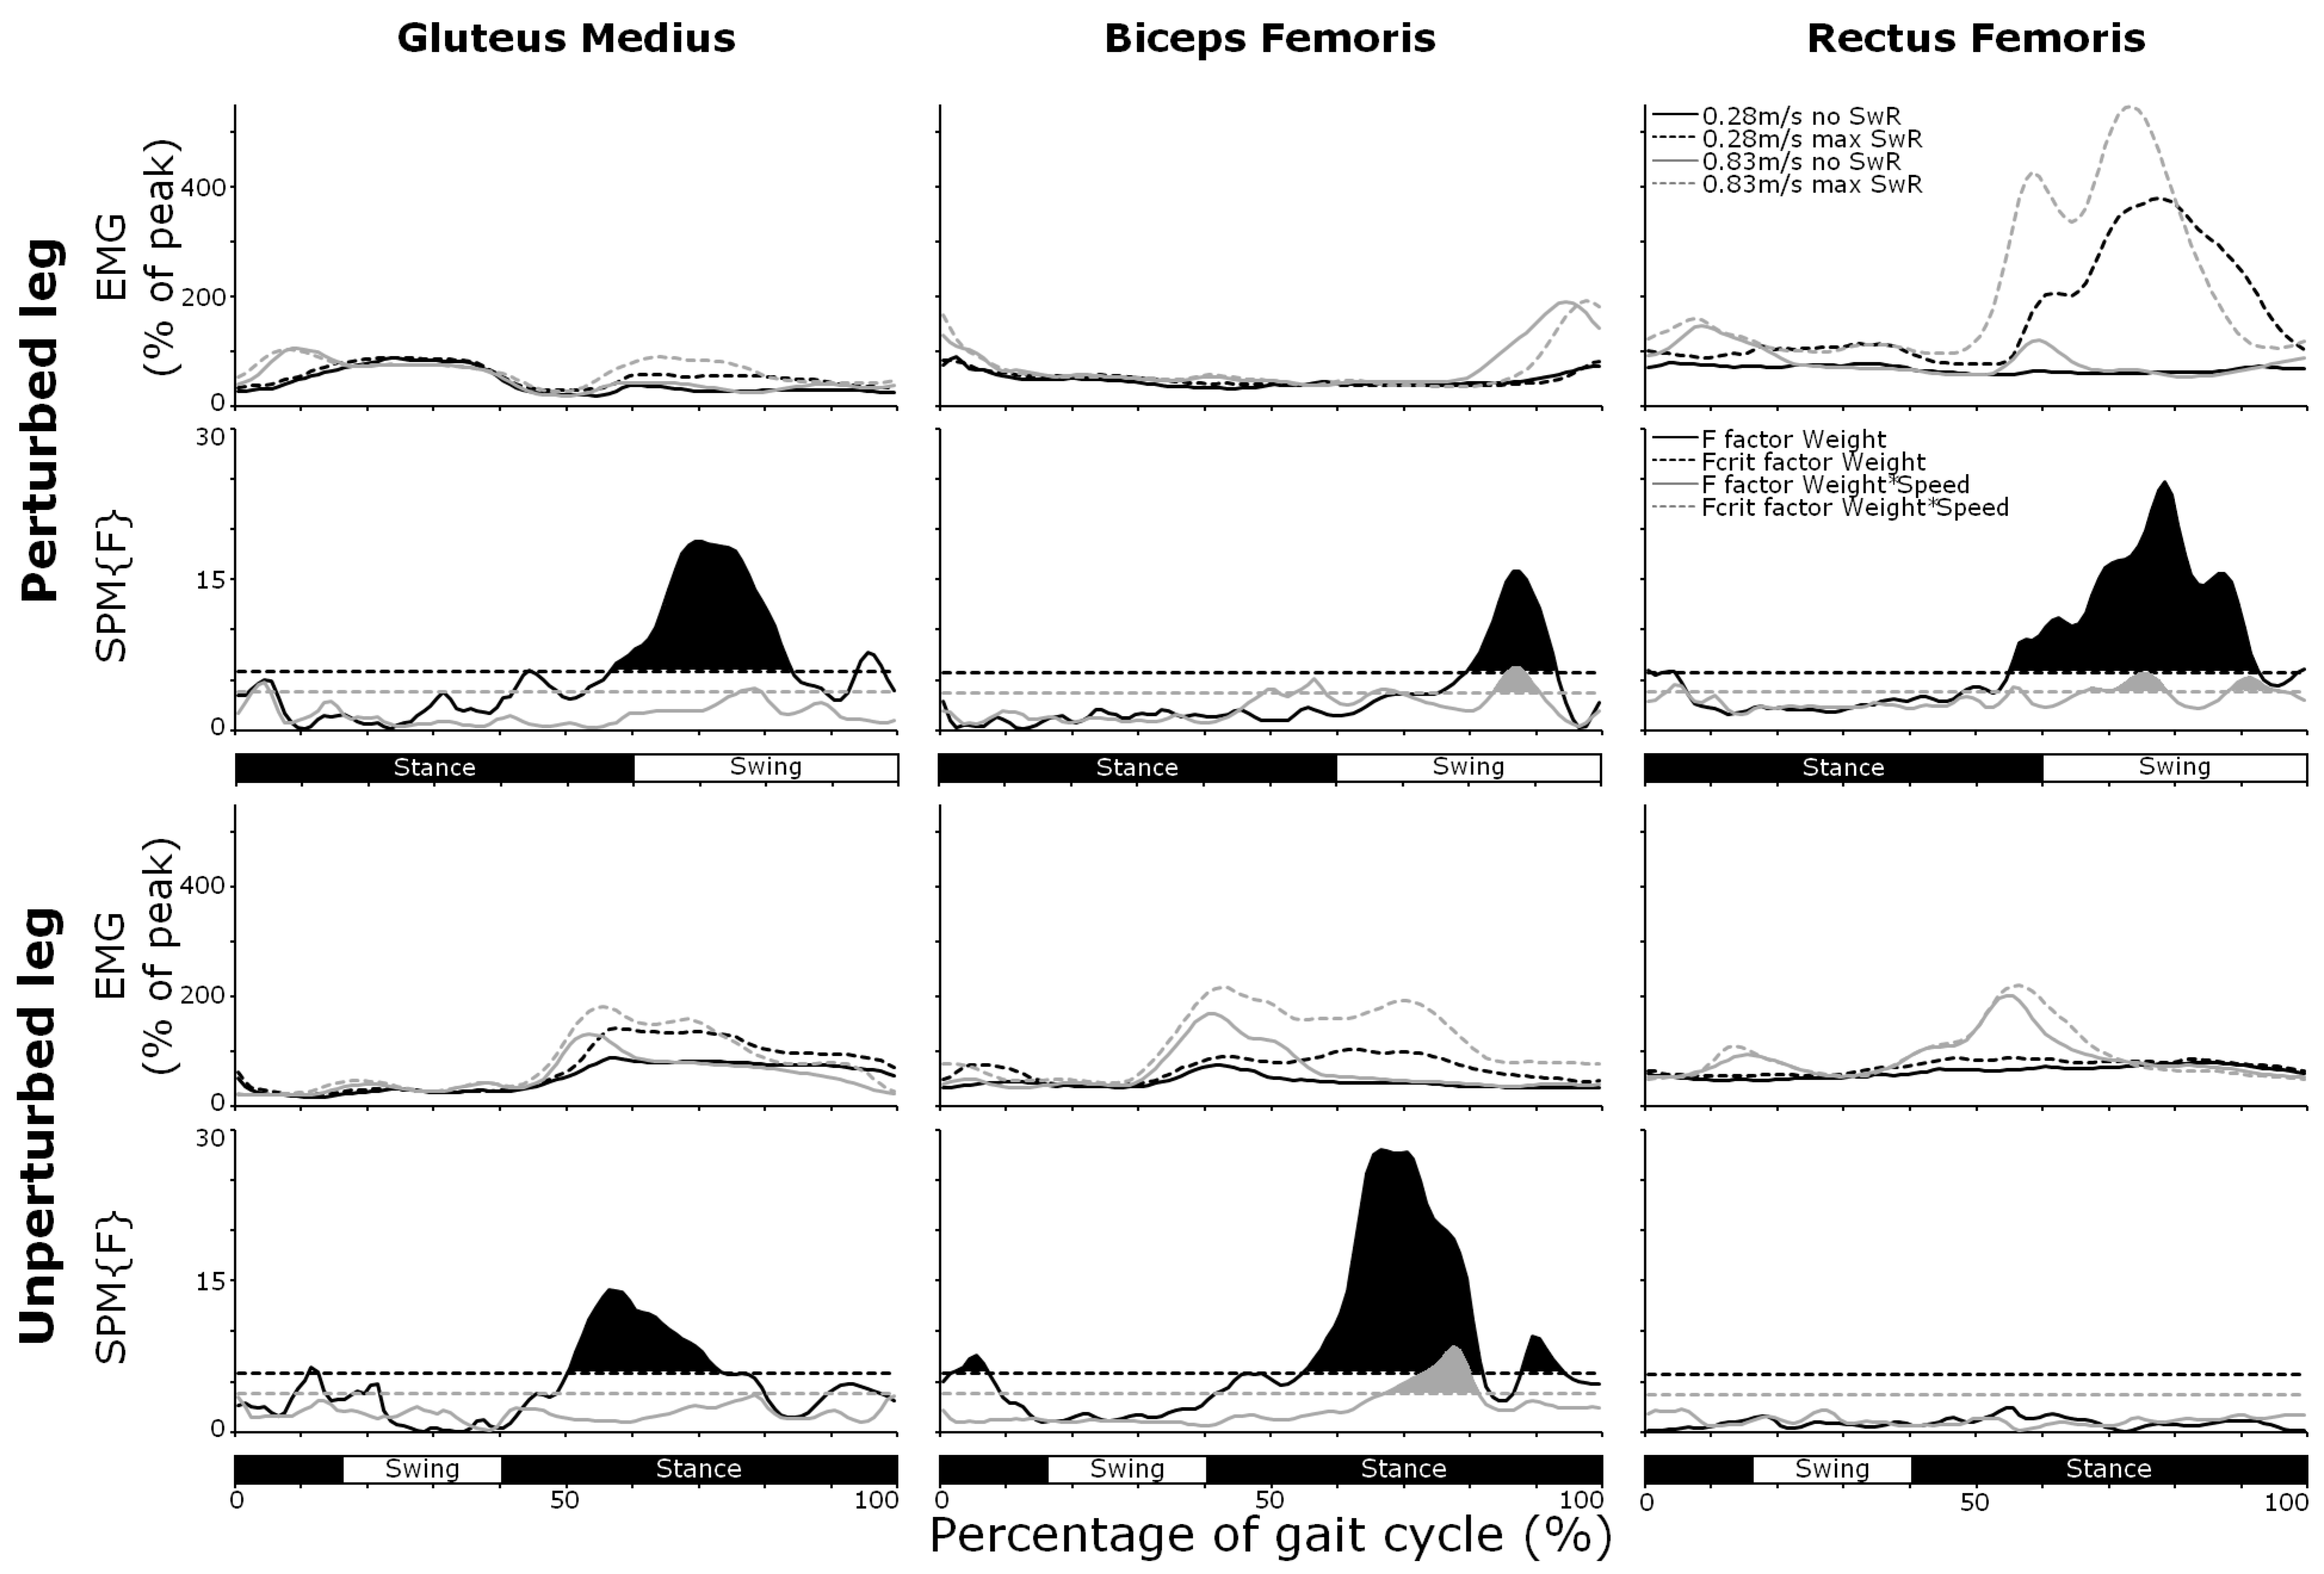
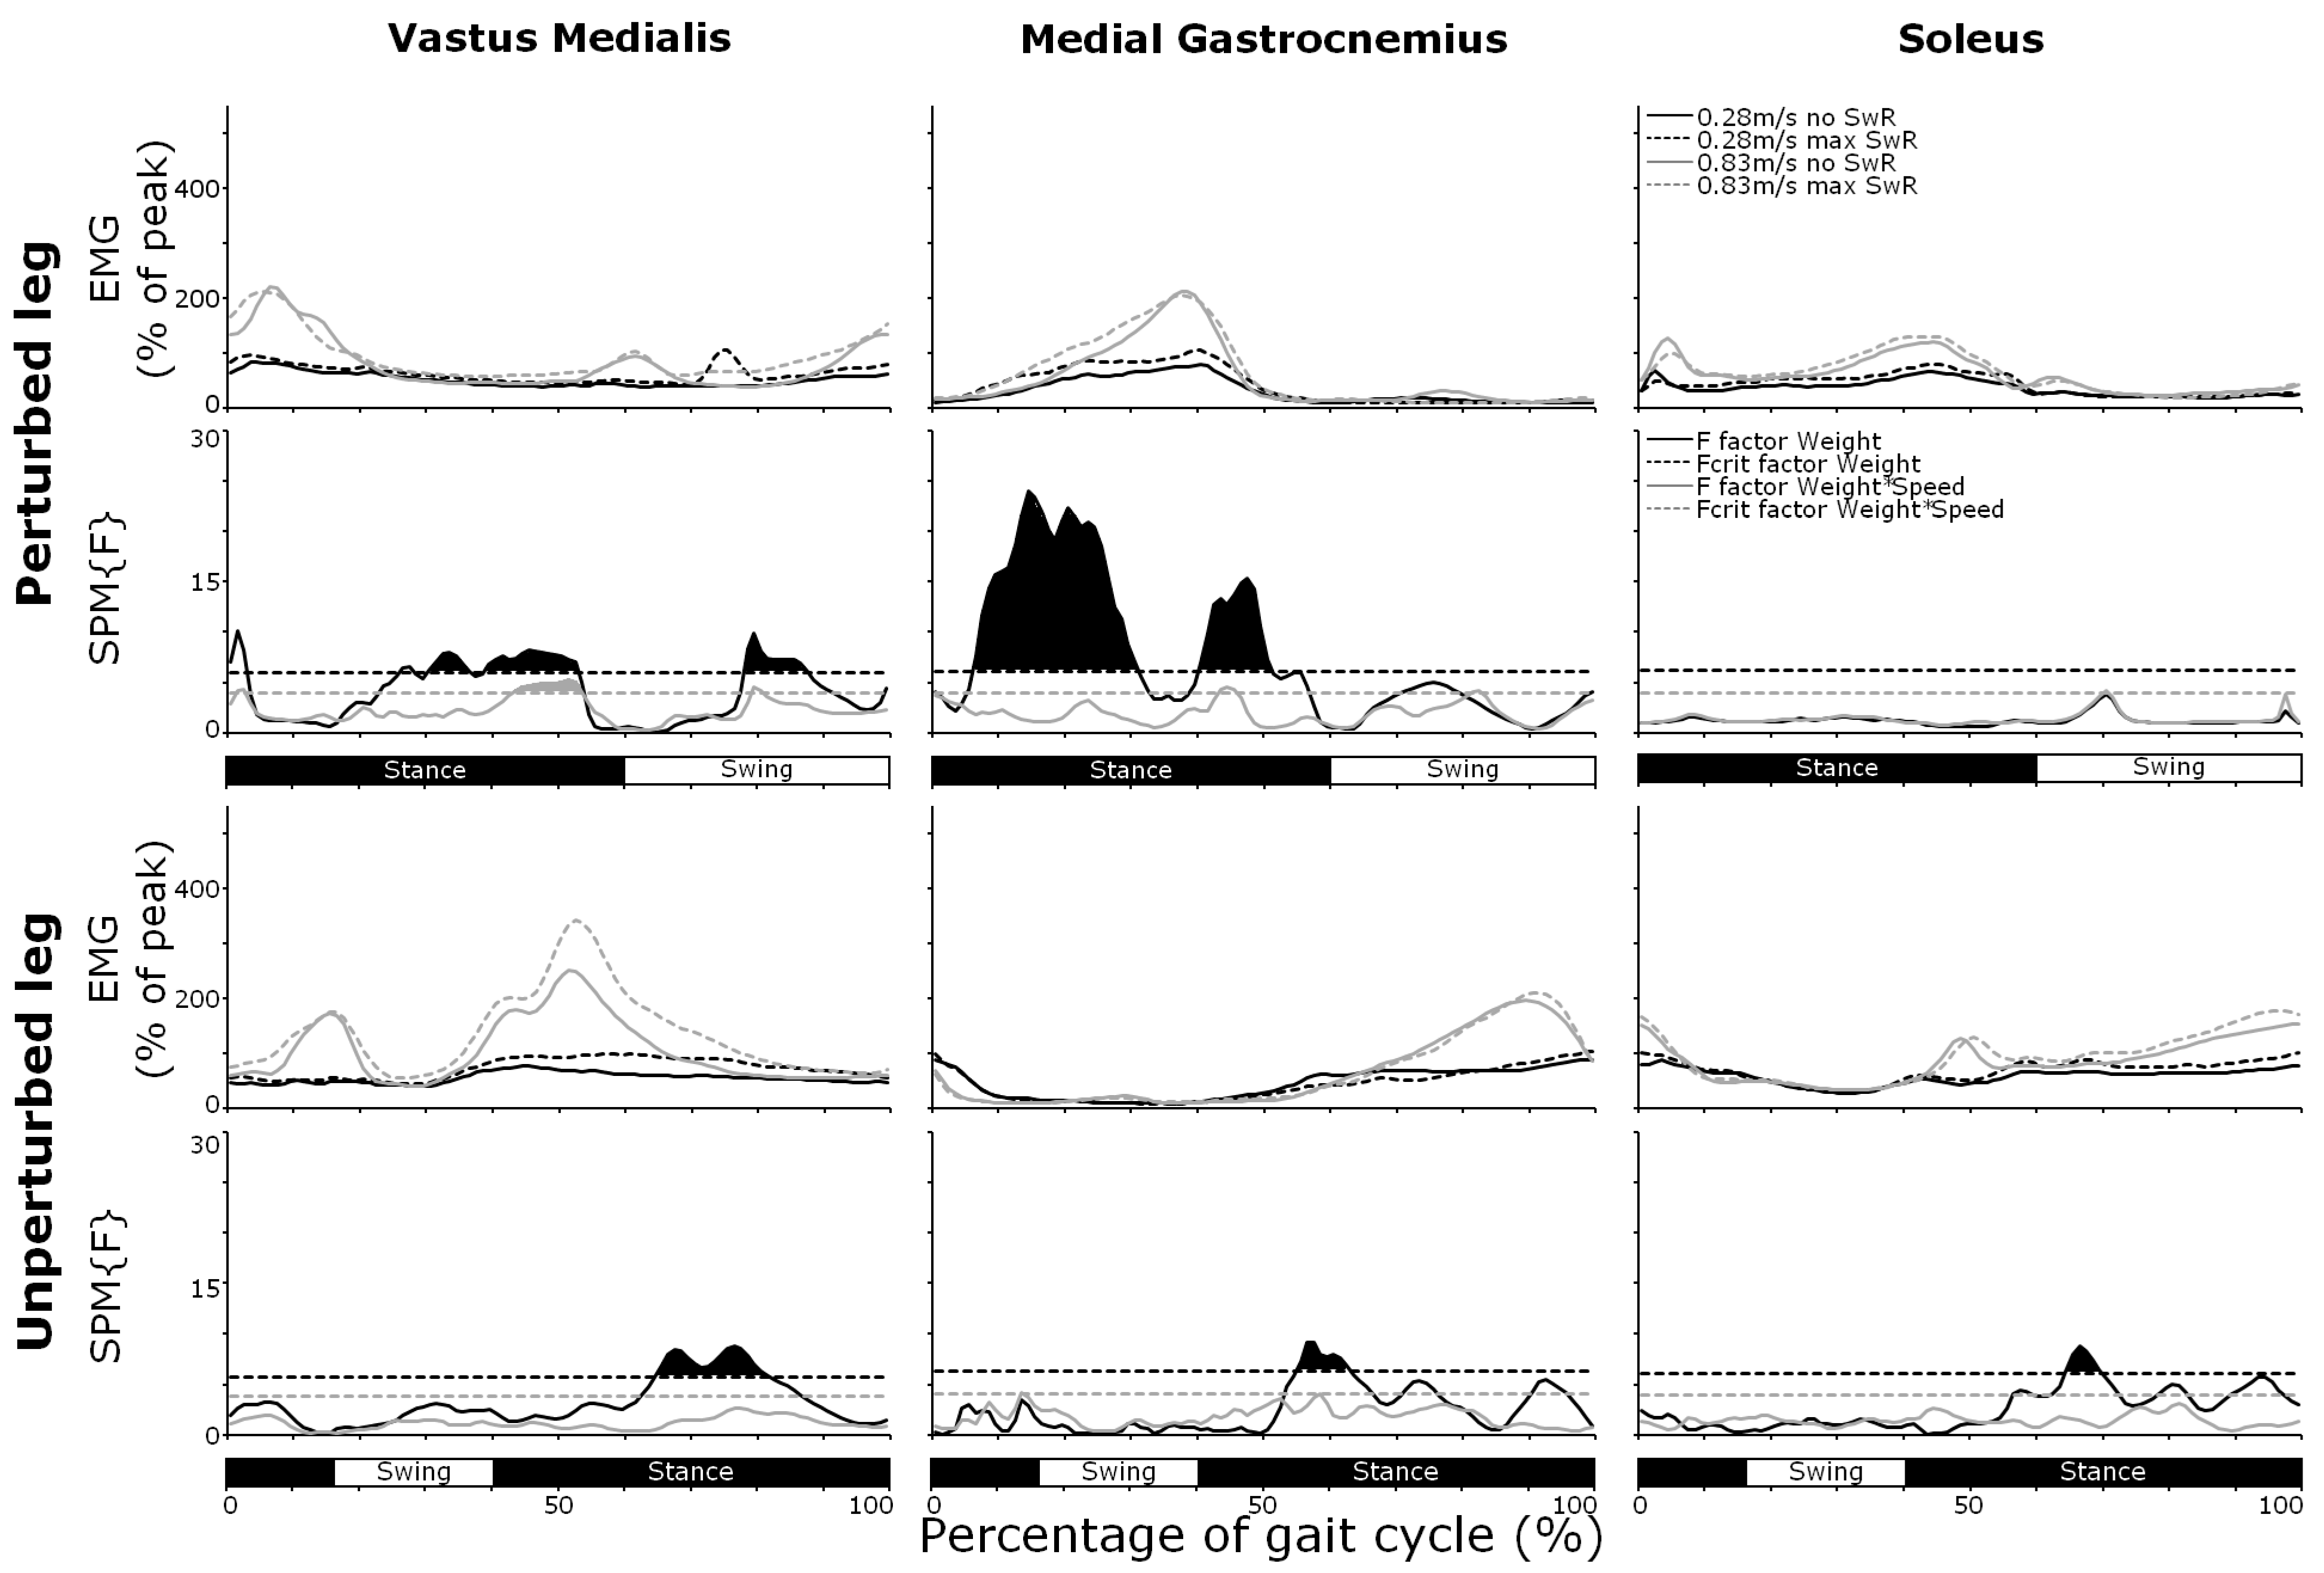
Group-averaged muscle activity profiles for both legs are presented in Figure 5 (GM, BF, and RF) and Figure 6 (VM, MG, and SOL). As can be observed, several supra-threshold clusters were found for the main effect of the factor weight, indicating that the muscle activity in selected muscles of the perturbed and unperturbed leg were affected by unilateral swing leg resistance. Muscle activation amplitudes increased within most of the supra-threshold clusters when swing leg resistance was provided. Only in BF (perturbed leg, late swing) and MG (unperturbed leg, early stance) did the muscle amplitudes decrease with unilateral swing leg resistance.
As presented in Figure 5 and Figure 6, several small significant supra-threshold clusters for the weight–speed interaction were found, indicating that the effect of the resistance force on the muscle activation amplitude was different over speeds. As can be observed in Figure 5, the effects of weight on BF (perturbed leg, late swing), RF (perturbed leg, mid-swing), VM (perturbed leg, late stance), and BF (unperturbed leg, mid-stance) were larger at higher speeds while the effect on RF (perturbed leg, late swing) was smaller at higher speeds.

4. Discussion

The primary aim of this study was to explore the immediate bilateral effects of unilateral swing leg resistance on (1) anterior–posterior GRF, (2) step parameters, (3) transverse torques, and (4) muscle activity. The secondary aim was to explore whether these effects were mediated by gait speed.
Similar to previous research [9], the swing time of the perturbed leg increased with swing leg resistance. This suggests that the perturbed passive swing movement requires active control. While the temporal asymmetry increased, our results suggest that spatial symmetry is maintained in able-bodied participants when walking with unilateral swing leg resistance as no effects on step length could be observed. This is in contrast to previous research showing that step length decreased in the perturbed leg and increased in the unperturbed leg with unilateral swing leg resistance [9]. One possible explanation is the walking speed: a previous study [9] tested at 1.34 m/s, whereas our participants walked at a maximum of 0.83 m/s, which may reduce the spatial effects and account for the lack of step length changes in our study.
We hypothesized that propulsion would increase during unilateral swing leg resistance to enable forward progression. The present results show that such effects were observed in both the perturbed and unperturbed leg; propulsion increased, and braking decreased bilaterally. The observed changes in muscle activation likely accommodated the increased demand for progression of the trunk and the perturbed swing leg. In the perturbed leg, a small increase in VM activity and a substantial increase in RF activity, during late stance and throughout swing, respectively, assists to progress the perturbed swing leg forward. In addition, the increase in MG activity in the perturbed leg during late stance contributes to the ankle push-off that assists in progression of the perturbed leg through swing [21]. In the unperturbed leg, the BF seems primarily responsible for the increase in propulsion. The substantial increase in BF activity in the unperturbed leg during stance extends the hip and drives the trunk forward. By extending the hip, the proportion of the GRF that is distributed anteriorly (the propulsive force) can be increased [2]. The decrease in BF activity in the perturbed leg during late swing is a direct effect of the resistance force that diminishes the need for active braking. Furthermore, a subtle increase in unperturbed SOL and MG activity could be observed primarily during single stance in the unperturbed leg, which ensures vertical support and may assist in the forward progression of the trunk [21].
The current results showed no extreme transverse ground reaction torques, suggesting that the body keeps deviations in the transverse plane to a minimum. This might be mitigated by the reciprocal activation of the GM in both legs that we observed. These bilateral muscles can work together to maintain stability during the perturbed swing phase to compensate for the external torsion (see Figure 5). In addition, adaptations in the upper body movement (transverse plane trunk rotations and arm swing) [22] and in step width (by decreasing step width, the transverse plane moment arm of the impeding force relative to the stance foot can be minimized) might be involved in regulating the transverse torques and hence in maintaining balance and stability as well. However, we did not collect the data to investigate these additional compensatory mechanisms.
Taken together, these findings in able-bodied individuals provide more knowledge on how unilateral swing leg resistance affects the ‘normal’ gait pattern that is not affected by certain health conditions and demonstrate that unilateral swing leg resistance can evoke effects that might stimulate the training of propulsion. An important question for clinical translation is whether swing leg resistance should be applied to the affected leg, the unaffected leg, or both. A follow-up study should be conducted to determine the effects of unilateral swing leg resistance in patients post stroke. If similar effects can be established in patients post stroke, it may be relevant to apply unilateral swing leg resistance to the affected or unaffected leg, depending on the specific patient needs. Our results show several effects in the perturbed leg that may be relevant for the training of the affected leg post stroke. First, as the perturbed leg showed a subtle increase in MG activity in late stance while walking with the resistance, unilateral swing leg resistance offered to the affected leg may stimulate push-off by the calf muscles in the affected leg in a task-specific context. This may be relevant post stroke as muscle weakness in the calf muscle is one of the main factors responsible for the decline in propulsive capacity [3]. Second, as the perturbed leg showed a substantial increase in RF activity during swing while walking with the resistance, unilateral swing leg resistance can potentially stimulate the muscle activity that can enable the forward progression of the swing leg. This may be relevant in training as swing leg progression is often limited post stroke [23]. Third, although this was not tested statistically, peak propulsion seems to be stimulated to a greater extent in the perturbed leg (Figure 3), suggesting that propulsion can be further increased when unilateral swing leg resistance is offered to the affected leg. On the other hand, the unperturbed leg showed a substantial increase in BF activity during stance. For specific patients who may not be able to restitute functional gait characteristics in the affected leg post stroke (i.e., calf muscle activity for push-off), it may be of functional importance to apply unilateral swing leg resistance to the unaffected leg so that the affected leg BF activity is stimulated. The present results urge further research into the effects of unilateral swing leg resistance in post-stroke patients to determine the potential of swing leg resistance in training situations.
Several effects of unilateral swing leg resistance were mediated by gait speed. In training settings, it may be relevant that the stimulation of peak propulsion in both legs can be further increased with gait speed.
The direct effects established here demonstrate how unilateral swing leg resistance affects the neuromechanics of normal gait. From this, potentially useful stimuli for training gait function after stroke could be derived. The clinical implications, however, are not straightforward. First, the increase in MG activity (early stance) in the perturbed leg, where generally no activity can be observed during normal walking, may be irrelevant to stimulate. Second, our data show the earlier onset of the propulsive phase during single stance (see Figure 4) that may be undesirable. The compensatory shift of propulsion from double support to single stance involves more work from the hip muscles (see the large increase in unperturbed BF activity with unilateral swing leg resistance in Figure 5) which is less energy efficient [24]. As individuals after stroke already experience an increased energy expenditure during walking [25], it may not be beneficial to stimulate this propulsive shift, since further elevating the energy cost could limit the feasibility and sustainability of such an intervention in rehabilitation practice. On the other hand, in certain training contexts, improving propulsion may outweigh the drawbacks of the higher energy demands, particularly if short bouts of targeted practice can induce beneficial neuromuscular adaptations. Further research is therefore needed to clarify how the balance between propulsion gains and energy cost influences the feasibility and effectiveness of swing leg resistance training in stroke rehabilitation.
The current study provides a broad view of the bilateral effects of unilateral swing leg resistance during treadmill walking with the selection of muscles, kinetic, and kinematic variables recorded. One limitation, however, is that we did not include measures of the step width, upper body kinematics, and joint angles. These elements may contribute to the understanding of compensatory strategies (e.g., altered joint angles or forward trunk lean) when walking under unilateral loading. Future studies should therefore incorporate upper body dynamics to provide a more complete understanding of whole-body adaptations to swing leg resistance. Additionally, this study was designed to capture the immediate effects of resistance during relatively short two minute bouts of walking under uncommon gait conditions. Since training likely involves longer-term motor learning and adaptation processes that exceed two minutes of practice, future studies should investigate both the prolonged exposure and retention effects to better understand the potential of unilateral resistance training on human gait in rehabilitation.

5. Conclusions

In conclusion, the present study demonstrates that unilateral swing leg resistance can evoke effects that might stimulate the training of propulsion. Within the current protocol, the applied resistance levels (0, 0.5, 1.25, or 2.0 kg) and walking speeds (0.28 m/s, 0.56 m/s, and 0.83 m/s) were well tolerated and did not induce signs of fatigue in our healthy young participants. A study in the target population should be conducted to investigate whether prolonged exposure to unilateral swing leg resistance leads to functional training effects.

Author Contributions

Conceptualization, S.M.-W., H.H., H.A.R.-M., L.H.V.v.d.W., P.P.H., and R.d.O.; data curation, S.M.-W., H.H., H.A.R.-M., L.H.V.v.d.W., P.P.H., and R.d.O.; formal analysis, S.M.-W., H.H., and R.d.O.; investigation, S.M.-W.; methodology, S.M.-W., H.H., H.A.R.-M., L.H.V.v.d.W., P.P.H., and R.d.O.; project administration, S.M.-W., H.A.R.-M., P.P.H., and R.d.O.; resources, S.M.-W.; software, S.M.-W., H.H., and R.d.O.; supervision, H.H., H.A.R.-M., L.H.V.v.d.W., and R.d.O.; visualization, S.M.-W.; writing—original draft, S.M.-W.; writing—review & editing, H.H., H.A.R.-M., L.H.V.v.d.W., P.P.H., and R.d.O. All authors have read and agreed to the published version of the manuscript.

Funding

This research received no external funding.

Institutional Review Board Statement

The study was conducted in accordance with the Declaration of Helsinki and approved by the Ethics Committee of the Department of Human Movement Sciences (UMCG, The Netherlands; protocol code 201800977, date of approval 14 February 2019).

Informed Consent Statement

Informed consent was obtained from all subjects involved in the study.

Data Availability Statement

The original contributions presented in this study are included in the article. Further inquiries can be directed to the corresponding author(s).

Acknowledgments

The authors wish to thank Lars Dijk and Eline Zaal for their help with the recruitment and data collection of participants. In addition, the authors wish to thank the technical support of the department of Human Movement Sciences of the University Medical Center Groningen, especially Emyl Smid and Anniek Heerschop, for their technical help and advice.

Conflicts of Interest

The authors declare no conflicts of interest.

Abbreviations

The following abbreviations are used in this manuscript:
BFBiceps Femoris
CoMCenter of Mass
EMGElectromyography
GMGluteus Medius
GRFGround Reaction Force
MGMedial Gastrocnemius
RFRectus Femoris
RMRepeated measures
SOLSoleus
VMVastus Medialis

Appendix A

A complete overview of the SPM (Statistical Parametric Mapping) test results are presented in Table A1 (for anterior–posterior GRF and the transverse torque) and Table A2 (for muscle activity).
Figure A1 (for anterior–posterior GRF and transverse torque), Figure A2 (for gluteus medius, biceps femoris, and rectus femoris) and Figure A3 (for vastus medialis, medial gastrocnemius, and soleus) present the main effects of speed of the different SPM analyses.
Table A1. Overview of the SPM results for anterior–posterior GRF and the transverse torque.
Perturbed LegUnperturbed Leg
FcritWeight (3,39)Speed (2,26)Weight*Speed (6,78)FcritWeight (3,39)Speed (2,26)Weight*Speed (6,78)
A-P GRFWeight: 6.8
Speed: 9.4
Weight*Speed: 4.3
0–1.9 *0.2–2.2 *1.4–2.3 *Weight: 6.4
Speed: 8.8
Weight*Speed: 4.1
0.0–7.7 **0.0–16.2 **0.0–5.1 *
4.7–5.4 *3.3–35.0 **3.6–46.3 ** 47.1–99.0 **36.7–37.6 *7.6–10.9 *
6.3–59.5 **38.5–56.0 **49.5–54.8 ** 43.0–48.5 **16.7–21.6 *
60.4–62.8 *57.9–58.1 *59.3–61.5 * 49.6–77.5 **51.6–52.8 *
60.4–62.0 * 83.8–99.0 **53.0–62.7 **
80.7–87.5 **
88.9–90.2 *
91.6–92.8 *
94.2–99.0 *
Transverse torqueWeight: 7.0
Speed: 9.7
Weight*Speed: 4.4
0.7–1.3 *0.3–1.5 *1.6–3.0 *Weight: 6.5
Speed: 8.9
Weight*Speed: 4.2
3.3–10.6 **9.8–10.2 *
22.1–27.2 **3.9–4.0 *23.2–24.5 * 13.3–14.3 *
28.8–29.1 *5.6–6.4 *25.4–26.6 * 40.3–41.8 *
37.7–38.4 *7.9–8.1 *28.0–28.0 * 42.3–43.6 *
39.4–40.8 *10.0–34.8 **59.7–60.4 * 48.3–51.6 **
41.2–48.0 **36.0–36.0 * 59.8–60.1 *
48.0–59.4 **47.9–56.1 ** 61.7–62.3 *
60.9–61.0 *60.1–62.4 ** 67.2–95.3 **
Note. This table displays the supra-threshold clusters with p-values (* = p < 0.05, ** = p < 0.001) together with the critical threshold values (Fcrit) for both main effects and their interaction effect.
Table A2. Overview of the SPM results for muscle activity.
Perturbed LegUnperturbed Leg
FcritWeight (3,39)Speed (2,26)Weight*Speed (6,78)FcritWeight (3,39)Speed (2,26)Weight*Speed (6,78)
GMWeight: 5.8
Speed: 7.8
Weight*Speed: 3.8
43.8–44.3 *0.7–12.9 **2.1–4.9 *Weight: 5.9
Speed: 8.0
Weight*Speed: 3.9
10.6–12.0 *0–2.7 *
56.1–83.8 **65.6–78.4 **75.7–78.9 * 49.7–73.1 **12.9–20.2 *
93.4–97.5 * 31.0–39.6 *
47.1–57.6 **
93.5–99.0 *
BFWeight: 5.7
Speed: 7.7
Weight*Speed: 3.8
78.8–92.7 **0.0–1.5 *48.4–50.6 *Weight: 5.9
Speed: 7.9
Weight*Speed: 3.8
1.2–6.8 *31.2–54.9 **66.7–80.8 **
2.8–7.8 *53.2–57.6 * 54.2–81.5 **59.3–82.6 **
10.0–14.3 *64.7–68.7 * 87.2–93.9 *
37.6–52.0 **83.0–90.1 *
65.0–99.0 **
RFWeight: 5.8
Speed: 7.8
Weight*Speed: 3.8
0.0–0.5 *0.0–19.3 **2.7–5.7 *Weight: 5.7
Speed: 7.7
Weight*Speed: 3.8
8.2–14.0 *
2.2–4.1 *47.1–50.4 *54.5–56.5 * 47.4–50.7 *
54.4–92.2 **55.7–79.3 **65.3–78.4 ** 58.0–61.8 *
98.0–99.0 *97.8–99.0 *87.4–96.1 *
VMWeight: 5.9
Speed: 8.0
Weight*Speed: 3.9
0.0–2.5 *0.0–2.6 *0.8–2.3 *Weight: 5.7
Speed: 7.7
Weight*Speed: 3.8
63.9–81.3 **14.9–15.2 *
25.5–27.8 *12.6–17.7 *42.4–53.2 ** 38.3–75.1 **
29.7–36.2 *40.0–58.5 **78.6–80.4 *
38.1–52.5 **59.3–63.1 *
77.5–87.2 **78.6–80.4 *
84.6–99.0 **
MGWeight: 6.0
Speed: 8.2
Weight*Speed: 3.9
5.5–30.7 **0.0–5.2 **42.6–45.4 *Weight: 6.3
Speed: 8.6
Weight*Speed: 4.0
54.3–62.7 **0.0–9.8 **12.9–13.2 *
39.6–50.9 **17.8–44.0 **80.6–82.4 * 46.0–57.5 **
72.0–80.9 ** 65.4–99.0 **
98.5–99.0 *
SOLWeight: 6.2
Speed: 8.4
Weight*Speed: 4.0
24.4–51.8 **69.6–70.3 *Weight: 6.1
Speed: 8.2
Weight*Speed: 3.9
63.8–69.4 *0.0–4.7 *
68.0–70.0 * 44.3–48.1 *
96.5–98.4 * 54.6–55.4 *
60.5–99.0 **
Note. This table displays the supra-threshold clusters with p-values (* = p < 0.05, ** = p < 0.001) together with the critical threshold values (Fcrit) for both main effects and their interaction effect.
Figure A1. Main effects of speed for anterior–posterior GRF and transverse torque. SPM F-values are presented for the main effect of speed (black lines) together with the critical threshold F-values (Fcrit; dashed lines). Data points that exceed the Fcrit represent the significant supra-threshold clusters.
Biomechanics 05 00071 g0a1
Figure A2. Main effects of speed for gluteus medius, biceps femoris, and rectus femoris. SPM F-values are presented for the main effect of speed (black lines) together with the critical threshold F-values (Fcrit; dashed lines). Data points that exceed the Fcrit represent the significant supra-threshold clusters.
Biomechanics 05 00071 g0a2
Figure A3. Main effects of speed for vastus medialis, medial gastrocnemius, and soleus. SPM F-values are presented for the main effect of speed (black lines) together with the critical threshold F-values (Fcrit; dashed lines). Data points that exceed the Fcrit represent the significant supra-threshold clusters.
Biomechanics 05 00071 g0a3

References

  1. Awad, L.N.; Reisman, D.S.; Kesar, T.M.; Binder-Macleod, S.A. Targeting paretic propulsion to improve poststroke walking function: A preliminary study. Arch. Phys. Med. Rehabil. 2014, 95, 840–848. [Google Scholar] [CrossRef]
  2. Hsiao, H.; Knarr, B.A.; Pohlig, R.T.; Higginson, J.S.; Binder-Macleod, S.A. Mechanisms used to increase peak propulsive force following 12-weeks of gait training in individuals poststroke. J. Biomech. 2016, 49, 388–395. [Google Scholar] [CrossRef] [PubMed]
  3. Nadeau, S.; Gravel, D.; Arsenault, A.B.; Bourbonnais, D. Plantarflexor weakness as a limiting factor of gait speed in stroke subjects and the compensating role of hip flexors. Clin. Biomech. 1999, 14, 125–135. [Google Scholar] [CrossRef]
  4. Mauritz, K.H. Gait training in hemiplegia. Eur. J. Neurol. 2002, 9, 23–29. [Google Scholar] [CrossRef]
  5. Roelker, S.A.; Bowden, M.G.; Kautz, S.A.; Neptune, R.R. Paretic propulsion as a measure of walking performance and functional motor recovery post-stroke: A review. Gait Posture 2019, 68, 6–14. [Google Scholar] [CrossRef]
  6. Awad, L.N.; Lewek, M.D.; Kesar, T.M.; Franz, J.R.; Bowden, M.G. These legs were made for propulsion: Advancing the diagnosis and treatment of post-stroke propulsion deficits. J. Neuroeng. Rehabil. 2020, 17, 139. [Google Scholar] [CrossRef] [PubMed]
  7. Hof, A.L.; Nauta, J.; van der Knaap, E.R.; Schallig, M.A.; Struwe, D.P. Calf muscle work and segment energy changes in human treadmill walking. J. Electromyogr. Kinesiol. 1992, 2, 203–216. [Google Scholar] [CrossRef] [PubMed]
  8. Meinders, M.; Gitter, A.; Czerniecki, J.M. The role of ankle plantar flexor muscle work during walking. Scand. J. Rehabil. Med. 1998, 30, 39–46. [Google Scholar] [CrossRef]
  9. Savin, D.N.; Tseng, S.C.; Morton, S.M. Bilateral adaptation during locomotion following a unilaterally applied resistance to swing in nondisabled adults. J. Neurophysiol. 2010, 104, 3600–3611. [Google Scholar] [CrossRef]
  10. Savin, D.N.; Morton, S.M.; Whitall, J. Generalization of improved step length symmetry from treadmill to overground walking in persons with stroke and hemiparesis. Clin. Neurophysiol. 2014, 125, 1012–1020. [Google Scholar] [CrossRef]
  11. Jonkers, I.; Delp, S.; Patten, C. Capacity to increase walking speed is limited by impaired hip and ankle power generation in lower functioning persons post-stroke. Gait Posture 2009, 29, 129–137. [Google Scholar] [CrossRef] [PubMed]
  12. World Medical Association. World Medical Association Declaration of Helsinki. Ethical principles for medical research involving human subjects. Bull. World Health Organ. 2001, 79, 373. [Google Scholar]
  13. Veeger, D.H.E.J.; Van der Woude, L.H.; Rozendal, R.H. The effect of rear wheel camber in manual wheelchair propulsion. J. Rehabil. Res. Dev. 1989, 26, 37–46. [Google Scholar]
  14. Blokland, I.; Gravesteijn, A.; Busse, M.; Groot, F.; van Bennekom, C.; van Dieen, J.; de Koning, J.; Houdijk, H. The relationship between relative aerobic load, energy cost, and speed of walking in individuals post-stroke. Gait Posture 2021, 89, 193–199. [Google Scholar] [CrossRef]
  15. Hermens, H.J.; Freriks, B.; Merletti, R.; Stegeman, D.; Blok, J.; Rau, G.; Disselhorst-Klug, C. European recommendations for surface electromyography. Roessingh Res. Dev. 1999, 8, 13–54. [Google Scholar]
  16. Swart, S.B.; den Otter, R.; Lamoth, C.J. Anticipatory control of human gait following simulated slip exposure. Sci. Rep. 2020, 10, 9599. [Google Scholar] [CrossRef]
  17. Donno, L.; Monoli, C.; Frigo, C.A.; Galli, M. Forward and backward walking: Multifactorial characterization of gait parameters. Sensors 2023, 23, 4671. [Google Scholar] [CrossRef]
  18. Turns, L.J.; Neptune, R.R.; Kautz, S.A. Relationships between muscle activity and anteroposterior ground reaction forces in hemiparetic walking. Arch. Phys. Med. Rehabil. 2007, 88, 1127–1135. [Google Scholar] [CrossRef]
  19. Benjamini, Y.; Hochberg, Y. Controlling the false discovery rate: A practical and powerful approach to multiple testing. J. R. Stat. Soc. Ser. B Methodol. 1995, 57, 289–300. [Google Scholar] [CrossRef]
  20. Pataky, T.C. Generalized n-dimensional biomechanical field analysis using statistical parametric mapping. J. Biomech. 2010, 43, 1976–1982. [Google Scholar] [CrossRef] [PubMed]
  21. Neptune, R.R.; Kautz, S.A.; Zajac, F.E. Contributions of the individual ankle plantar flexors to support, forward progression and swing initiation during walking. J. Biomech. 2001, 34, 1387–1398. [Google Scholar] [CrossRef] [PubMed]
  22. De Graaf, M.L.; Hubert, J.; Houdijk, H.; Bruijn, S.M. Influence of arm swing on cost of transport during walking. Biol. Open 2019, 8, bio039263. [Google Scholar] [CrossRef] [PubMed]
  23. Dean, J.C.; Bowden, M.G.; Kelly, A.L.; Kautz, S.A. Altered post-stroke propulsion is related to paretic swing phase kinematics. Clin. Biomech. 2020, 72, 24–30. [Google Scholar] [CrossRef]
  24. Oh, K.; Baek, J.; Park, S. Gait strategy changes with acceleration to accommodate the biomechanical constraint on push-off propulsion. J. Biomech. 2012, 45, 2920–2926. [Google Scholar] [CrossRef]
  25. Awad, L.N.; Palmer, J.A.; Pohlig, R.T.; Binder-Macleod, S.A.; Reisman, D.S. Walking speed and step length asymmetry modify the energy cost of walking after stroke. Neurorehabilit. Neural Repair 2015, 29, 416–423. [Google Scholar] [CrossRef]
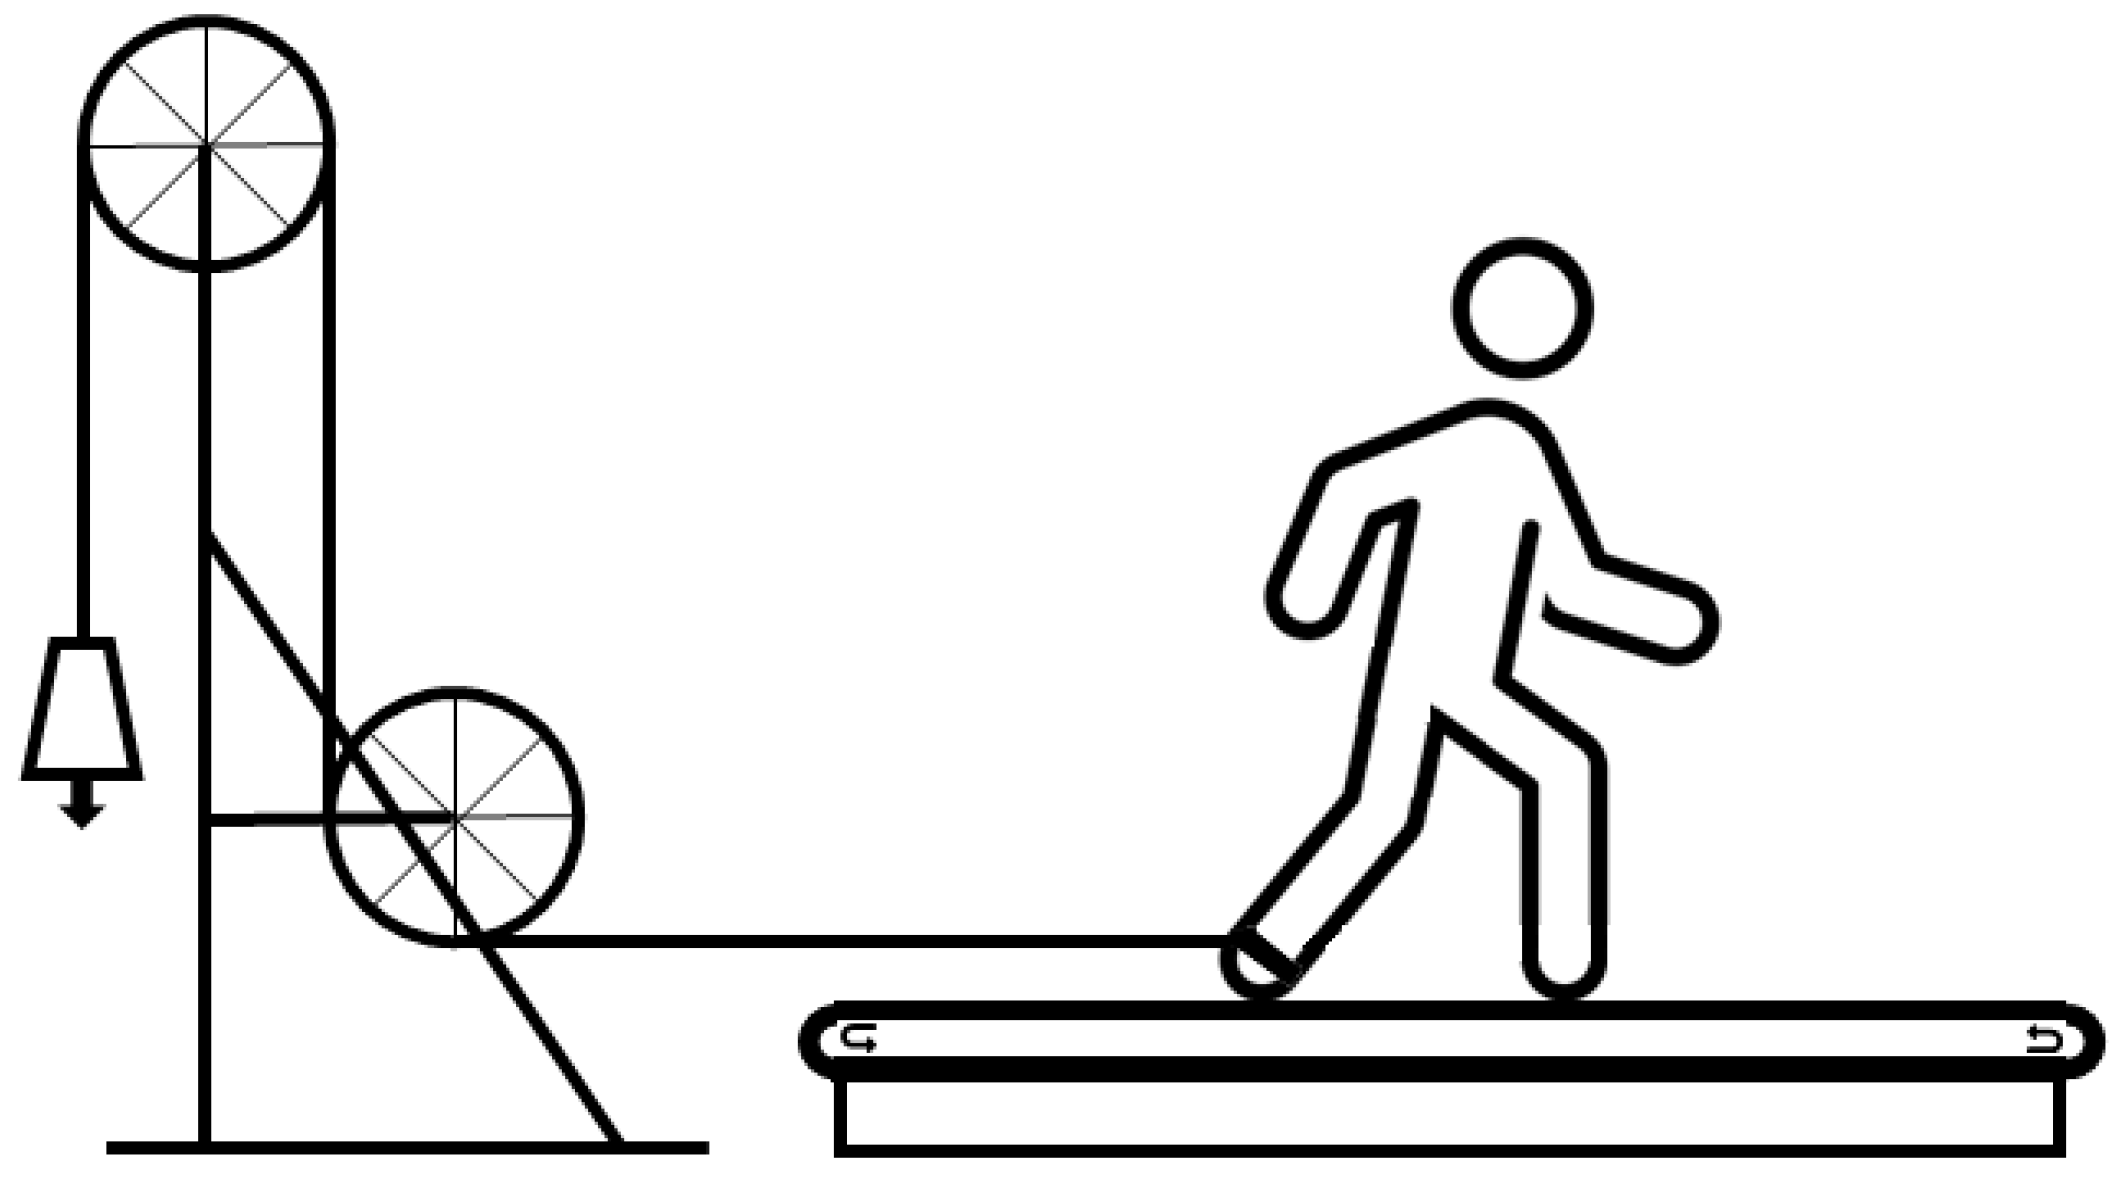
Figure 1. An illustration of the experimental setup. During walking, restraining forces are applied to the ankle using a pulley system positioned behind the treadmill. By attaching weights (0 kg, 0.5 kg, 1.25 kg, and 2 kg in this experiment) to a rope (6.14 m) that runs through the pulleys to the subject’s right ankle, different levels of resistance can be introduced.
Biomechanics 05 00071 g001
Figure 2. The duration of propulsion, peak propulsive force, peak braking force, and transverse torques during walking with and without swing leg resistance. Group-averaged means and standard deviations are presented during walking in all conditions consisting of four resistance forces (provided by attaching a weight of 0 kg, 0.5 kg, 1.25 kg, and 2 kg to the pulley-based system) and three speed levels (0.28 m/s, 0.56 m/s, and 0.83 m/s). * indicates a significant effect of the factor weight and + indicates a significant interaction effect of the factor weight with the factor speed.
Biomechanics 05 00071 g002
Figure 3. Profiles of the anterior–posterior GRF and transverse torque during walking with and without swing leg resistance together with the results of the SPM analysis. Group-averaged profiles for walking with (dashed lines) and without (solid lines) swing leg resistance (SwR) at 0.28 m/s (black lines) and at 0.83 m/s (grey lines) (A) combined with the SPM F-values of the factor weight (black lines) and the weight by symmetry interaction (grey lines) (B). Critical threshold F-values (Fcrit) are indicated in part (B) of the figure by dashed lines and significant supra-threshold clusters are indicated by a black fill (for the factor weight) or a grey fill (for the weight by symmetry interaction).
Biomechanics 05 00071 g003
Figure 4. Swing time and step length during walking with and without swing leg resistance. Group-averaged means and standard deviations are presented during walking in all conditions consisting of four resistance forces (provided by attaching 0 kg, 0.5 kg, 1.25 kg, and 2 kg to the pulley-based system) and three speed levels (0.28 m/s, 0.56 m/s, and 0.83 m/s). * indicates a significant effect of the factor weight.
Biomechanics 05 00071 g004
Figure 5. Profiles of gluteus medius, biceps femoris and rectus femoris during walking with and without swing leg resistance, together with the results of the SPM analysis. Group-averaged EMG profiles for walking with (dashed lines) and without (solid lines) swing leg resistance (SwR) at 0.28 m/s (black lines) and at 0.83 m/s (grey lines) combined with the SPM F-values of the factor weight (black lines) and the weight by symmetry interaction (grey lines). Critical threshold F-values (Fcrit) are indicated by dashed lines and significant supra-threshold clusters are indicated by a black fill (for the factor weight) or a grey fill (for the weight by symmetry interaction).
Biomechanics 05 00071 g005
Figure 6. Profiles of vastus medialis, gastrocnemius medialis, and soleus during walking with and without swing leg resistance, together with the results of the SPM analysis. Group-averaged EMG profiles for walking with (dashed lines) and without (solid lines) swing leg resistance (SwR) at 0.28 m/s (black lines) and at 0.83 m/s (grey lines) combined with the SPM F-values of the factor weight (black lines) and the weight by symmetry interaction (grey lines). Critical threshold F-values (Fcrit) are indicated by dashed lines and significant supra-threshold clusters are indicated by a black fill (for the factor weight) or a grey fill (for the weight by symmetry interaction).
Biomechanics 05 00071 g006
Table 1. Effects of swing leg resistance in the perturbed and unperturbed leg.
Perturbed LegUnperturbed Leg
WeightSpeedWeight*SpeedWeightSpeedWeight*Speed
F(3,39)ηp2F(2,26)ηp2F(6,78)ηp2F(3,39)ηp2F(2,26)ηp2F(6,78)ηp2
Peak braking14.3 **0.5211.4 **0.92.7 *0.218.9 **0.6179.5 **0.94.4 **0.3
Peak propulsion52.1 **0.8310.3 **1.03.3 *0.246.6 **0.8305.1 **1.04.7 **0.3
Duration propulsion90.8 **0.982.6 **0.933.0 **0.7128.9 **0.922.9 **0.61.00.1
Swing time 40.1 **0.838.8 **0.73.80.21.70.139.3 **0.71.60.2
Step length 3.40.2220.5 **0.91.60.10.80.1228.4 **0.91.70.1
Transverse ground reaction torque0.80.13.30.20.30.03.60.26.9 *0.32.50.2
Note. This table displays the univariate F-values of the repeated measures ANOVAs for both legs together with the partial eta-squared effect sizes (ηp2). Significant results that are discussed in the text are presented in bold (* = p < 0.05, ** = p < 0.001).
Disclaimer/Publisher’s Note: The statements, opinions and data contained in all publications are solely those of the individual author(s) and contributor(s) and not of MDPI and/or the editor(s). MDPI and/or the editor(s) disclaim responsibility for any injury to people or property resulting from any ideas, methods, instructions or products referred to in the content.