Article

Effect of Relative Isometric Strength on Countermovement Jump Performance in Professional and Semi-Professional Soccer Players

1
School of Health and Society, University of Salford, Salford M5 4WT, UK
2
Strength & Power Research Group, School of Medical and Health Sciences, Edith Cowan University, Joondalup 6027, Australia
*
Author to whom correspondence should be addressed.
Biomechanics 2025, 5(2), 32; https://doi.org/10.3390/biomechanics5020032
Submission received: 28 March 2025 / Revised: 21 April 2025 / Accepted: 1 May 2025 / Published: 4 May 2025
(This article belongs to the Collection Locomotion Biomechanics and Motor Control)

Abstract

:
As powerful actions commonly proceed goal scoring opportunities within soccer, enhancing powerful actions could be essential to optimize performance. There is a large body of evidence supporting the positive associations between maximal isometric mid-thigh pull force-generating qualities and jump performance. Objectives: The purpose of this study was to determine if relative maximal isometric force production can discriminate between higher- and lower-performing jumpers among professional and semi-professional soccer players. As such, it was hypothesized that stronger players would have a greater jump performance than weaker players. Methods: An observational cross-sectional research design was used to assess ballistic and isometric force production of the lower limbs across players from four professional and semi-professional soccer clubs during the pre-season period. Seventy-six professional male lower-league soccer players (mass: 82.5 ± 8.2 kg; height: 1.80 ± 0.07 m; age: 25.8 ± 4.3 years) performed three trials of the countermovement jump (CMJ) and isometric mid-thigh pull (IMTP) using force plates. Players were categorized as strong and weak using the group’s average IMTP relative peak force (33.41 N/kg). A series of one-way Bayesian independent t-tests were performed to determine the difference between strong and weak groups. Results: A large magnitude of difference was observed between strong and weak players for relative peak force (d [95% CI] = 2.53 [2.017–∞]), with strong evidence supporting the hypothesis (BF10 = 2.698 × 10+14). There was moderate evidence to support the hypothesis that strong players (n = 37) had a greater modified reactive strength index (mRSI) and relative average braking force in comparison to weaker players (n = 39). All other evidence was weak, with trivial-to-small differences (d = 0.10–0.42) for jump height, jump momentum, propulsive force, force at minimum displacement, time to take off, and countermovement depth. Conclusions: Maximal relative strength has implications on jump performance, albeit not on the jump outcome. Stronger players performed the CMJ more efficiently when observing the mRSI, with a shorter time to take off, while producing greater average relative forces during the braking phase. This could have potential implications in the sporting environment when performing jumping tasks, where they can achieve a similar outcome over a shorter duration.

1. Introduction

Movements such as jumping, sprint acceleration, maximal velocity running, deceleration, and change in direction are key aspects of athletic and sporting performance within soccer [1,2,3], with neuromuscular physical qualities, such as rapid force production, underpinning many of these characteristics [4,5,6,7,8,9]. Neuromuscular physical qualities such as ballistic and maximal force production are key physical attributes, with strong relationships identified with the performance of short acceleration, maximal-velocity sprinting, deceleration, and change in direction tasks [10,11,12,13,14,15]. The most common assessment for ballistic qualities is the countermovement jump (CMJ); when assessed using force plates, variables such as the peak propulsive force, peak braking force, and peak propulsive power have been shown to differentiate between soccer players with high and low deceleration abilities [14]. Furthermore, isometric mid-thigh pull (IMTP) peak force and rapid force production have been shown to be related to sprint acceleration performance [10]. Consequently, the testing and monitoring of neuromuscular qualities using force plates have become part of regular practice in soccer settings [16,17,18], with 50% of soccer practitioners reporting using and having access to force plate technology [18].
The requirement for soccer players to have well-developed physical qualities is well documented [19], especially when playing in higher tiers (i.e., leagues), where physical performance is greater. This is likely related to the outcome of sport-specific movements, where athletes at higher levels of competition display greater jump, sprint, and lower-body power characteristics at higher tiers [7,19,20,21,22]. Jump- and sprint-based tasks rely on the acceleration of one’s own mass, whereby the acceleration of the center of mass is determined by the relative force production (i.e., the force produced in relation to the mass of the object being accelerated), with the resulting velocity determined by the duration of acceleration (i.e., relative impulse) [23]. As maximal velocity and powerful actions are crucial for scoring situations in both men’s and women’s soccer [1,2,3], training to enhance relative force production in maximal and ballistic tasks is crucial. Moreover, for ballistic tasks, the jump outcome (i.e., jump height) is determined by the relative net propulsive impulse (i.e., the impulse produced greater than body mass during the propulsive phase of movement, divided by body mass). As most sporting actions, including jumping and sprinting, are influenced by external factors, for example, opposition movement and ball movement, the time to produce sufficient force is minimal; therefore, the ability of athletes to produce high forces quickly is imperative to maximize their performance outcome. Therefore, the ability to apply forces rapidly is crucial for athletes, as impulse is defined as Δforce × Δtime, and enhancing time is not an option; hence, improving rapid force production becomes a key training goal.
Monitoring jump performance using force plates has become common practice within soccer [18]; as such, appropriate metrics need to be identified. Common outcome metrics, including jump height, have been most consistently observed [17]; however, observing only jump outcomes leads to key aspects of jump performance being missed. As a jump requires the acceleration of body mass, any changes in body mass, either chronically across a season or seasons or acutely pre- to post-match, need to be observed [24]. As described, the relative net propulsive impulse determines the jump outcome; therefore, changes in jump kinetics and strategy should be monitored, specifically either the forces underpinning key phases of the jump [25], or the duration those forces are applied for, as both components could be altered based on athlete status.
Bayesian statistics have been suggested to offer a better fit for inference in sport science, where sample sizes are often low [26], offering a better probabilistic approach to determining differences within the field [27]. Mengersen et al. [27] reported similar sensitivity to detecting a difference while providing simplistic statements that allow for easy interpretation. A Bayesian approach treats parameters as independent variables that have a true but unknown value. These unknown values are described by a posterior probability distribution, reflecting the uncertainty in how well they are known based on the data [27], calculated by
Likelihood × prior
The likelihood is the probability of observing the data to obtain the parameters, while the prior is the probability of obtaining these independently of the data. Priors can be determined via previous experiments, historical data, and/or expert opinions, or priors can be uninformative to allow for inferences to be drawn from the observed data alone by using a default method [27]. Despite some suggestions of the potential to change the priors through p-hacking to ensure that a meaningful result is established, however, as long as the clarity of reporting is high, this enables the identification of malpractice [28]. Nevertheless, the use of Bayesian statistics within a sport science context enables a richer inferential and probabilistic capability than using conventional null hypothesis testing alone.
The large body of evidence highlighting the positive associations between maximal isometric force-generating qualities and jump performance [29,30,31] supports the notion that practitioners should aim to develop maximal relative force production qualities to enhance athletic and sporting performance. To date, there is limited information regarding professional and semi-professional soccer players to determine if stronger players (i.e., those who produce greater relative peak forces) do have improved jump performance. Considering the importance of powerful actions for goal scoring situations [1,2,3], practitioners should aim to improve athletes’ ability to accelerate their center of mass, and the easiest way for most practitioners to achieve this is to train strength [19]. Therefore, the purpose of this study was to determine if relative maximal isometric force production can discriminate between higher- and lower-performing jumpers, focusing on professional and semi-professional soccer players. It was hypothesized when using a Bayesian approach that stronger soccer players determined by the IMTP would exhibit greater performances in the CMJ in comparison to weaker soccer players. This would highlight the need for maximal force production to be a key training aim for practitioners working within professional and semi-professional soccer.

2. Materials and Methods

2.1. Experimental Setup

An observational cross-sectional research design was used to assess the ballistic and isometric strength of the lower limbs among professional and semi-professional soccer players. Each player completed a minimum of three, but up to five, repetitions of the CMJ and IMTP. All testing was completed within the first week of pre-season in June 2024, with no intense training in the 72 h prior to testing. Written and informed consent was sought from all players prior to testing, along with a participant readiness health questionnaire. Ethics approval was granted by the School of Health and Society at the University of Salford (ID 2216), conforming to the Declaration of Helsinki (2013).

2.2. Participants

Participants were recruited from the lower tiers of the English soccer league system (recruitment commenced on 4 March 2024; testing commenced on 27 June 2024 and was completed by 4 July 2024). Seventy-six professional/semi-professional soccer players participated in the present study (mass: 82.5 ± 8.2 kg; height: 1.80 ± 0.07 m; age: 25.8 ± 4.3 years). All players were required to be signed by clubs, be free from injury, and be able to participate in full training, with no training modifications.

2.3. Procedures

All testing was carried out at one of four sites in the Northwest of England using club training facilities. On arrival, participants completed a standardized RAMP warm up, which included low-intensity cardiovascular exercise (e.g., biking or jogging), dynamic stretches, and football-specific movements, including (but not limited to) squats, lunges, hops, and submaximal jumps. In all cases, warm up sessions were devised and administered by trained personnel from within the club’s strength and conditioning department. To mitigate order effects, tests were completed in a randomized sequence. Dual-sensor portable force plates sampling at 1000 Hz (Hawkin Dynamics Inc., Westbrook, ME, USA) were used for all testing, with both hardware and proprietary software found to be both valid and reliable [32,33]. Foam surrounds were placed around the force plates for participant safety during all jump testing, with force plates situated on a solid and even surface.
The IMTP was conducted in accordance with accepted protocols from Comfort et al. [34], with the posture replicating the start of the second pull phase of the clean. Three IMTP warm up trials were performed to act as familiarization, at relative percentages of maximal efforts, namely at 50%, 75%, and 90% max effort. Weightlifting straps were used to eliminate grip strength as a limiting factor. Participants were required to remain as still as possible for at least 1 s to allow for the calculation of system mass. Strong verbal encouragement included “push”, with consistent instruction provided for all participants (i.e., “push as hard and as fast as possible for 3 to 5 s.”). Up to 2 additional trials (minimum of 3; maximum of 5) were performed if a difference of >250 N was observed between trials; in this case, a 1 min rest period was provided. The CMJ was completed with arms akimbo. Participants were required to stand on the center of each force plate for a 1 s weighing period and were instructed to “jump as high and as fast as possible”, contextualized to the phase of the jump; for example, “jump as fast” refers to performing the countermovement, propulsive, and rebound phases as quickly as possible. Trials involving the displacement of the hands from their position on the hips were excluded from the data analysis, with a new trial performed after a 1 min rest.

2.4. Data Analyses

The vertical ground reaction force was low-pass-filtered at 50 Hz in accordance with recommendations [35], while take off was determined when the vertical force dropped below 25 N during the propulsive phase. All metrics were calculated automatically by the force plate proprietary software [32]; the selected metrics represent the person, outcome, driver, and strategy of the CMJ (Table 1). These four metric categories observe distinct features of jump performance: “person” refers to observing the participant’s body mass [24]; “outcome” refers to the absolute jump performance (e.g., jump height and jump momentum) and modified reactive strength index (mRSI), as a measure of jump efficiency determined by jump height divided by time to take off; “driver” metrics refer to the underpinning relative forces applied during the braking and propulsive phases of the jump [25]; and “strategy” metrics refer to how the jump was performed, including countermovement depth and time to take off. Metrics determined from the IMTP included relative gross peak force (N/kg).
The IMTP force–time data were analyzed using an onset threshold of an increase in force >3 standard deviations of the force during the 1 s period of quiet standing, with the highest force achieved identified as the gross peak force. The system mass determined from the CMJ was subtracted from this value to ensure that only net peak force was reported. Relative metrics for IMTP were calculating using the body mass observed from the CMJ (i.e., IMTP relative peak force = gross peak force divided by body mass). Athletes were grouped as “strong” and “weak” based on the average relative gross peak force for the cohort, 33.41 N/kg.

2.5. Statistical Analyses

All data are presented as mean ± standard deviation (SD), and the normality of the data was determined using Shapiro–Wilk’s test (p > 0.05). A series of Bayesian independent t-tests were performed using JASP (0.19.3, JASP Team [Computer software]). The t-tests were directional, hypothesizing that stronger players would have improved CMJ characteristics, using a half Cauchy distribution. Using a default prior distribution of 0.707, robustness regions were reported to determine whether any interpretations from the Bayes factors (BF10) were sensitive to the choice of prior distribution. Bayes factors (BF10) were interpreted as follows: BF10 = 1.00–3.00, weak; 3.00–10.00, moderate; 10.00–30.00 = strong, >30.00 = very strong evidence supporting the hypothesis (h1). The following thresholds were also used: BF10 = 1.00–0.33, weak; 0.33–0.10, moderate; and 0.09–0.03, strong evidence to support the null hypothesis (h0) [36]. To assist in the interpretation of the Bayes analysis, Hedge’s g effect sizes and 95% confidence intervals (95%CIs) were calculated and interpreted based on the recommendations of Hopkins [37]: 0.00–0.19 = trivial; 0.20–0.59 = small; 0.60–1.19 = moderate; and ≥1.20 = large.

3. Results

All data were found to be normally distributed via the Shapiro–Wilk test (p > 0.05). The average relative peak force of all samples was 33.41 ± 4.93 N/kg, which was used to group athletes into “strong” and “weak” groups. Strong players (n = 37) had an average relative peak force of 37.38 ± 3.39 N/kg, while weak players (n = 39) had an average relative peak force of 29.66 ± 2.69 N/kg. There was a large magnitude of difference between the strong and weak players for relative peak force (d [95% CI] = 2.53 [2.017–∞]), with strong evidence supporting the hypothesis (BF10 = 2.698 × 10+14).
The Bayes factors (BF10) and interpretation and Cohen’s d effect sizes for “strong” vs. “weak” comparisons are reported in Table 2.
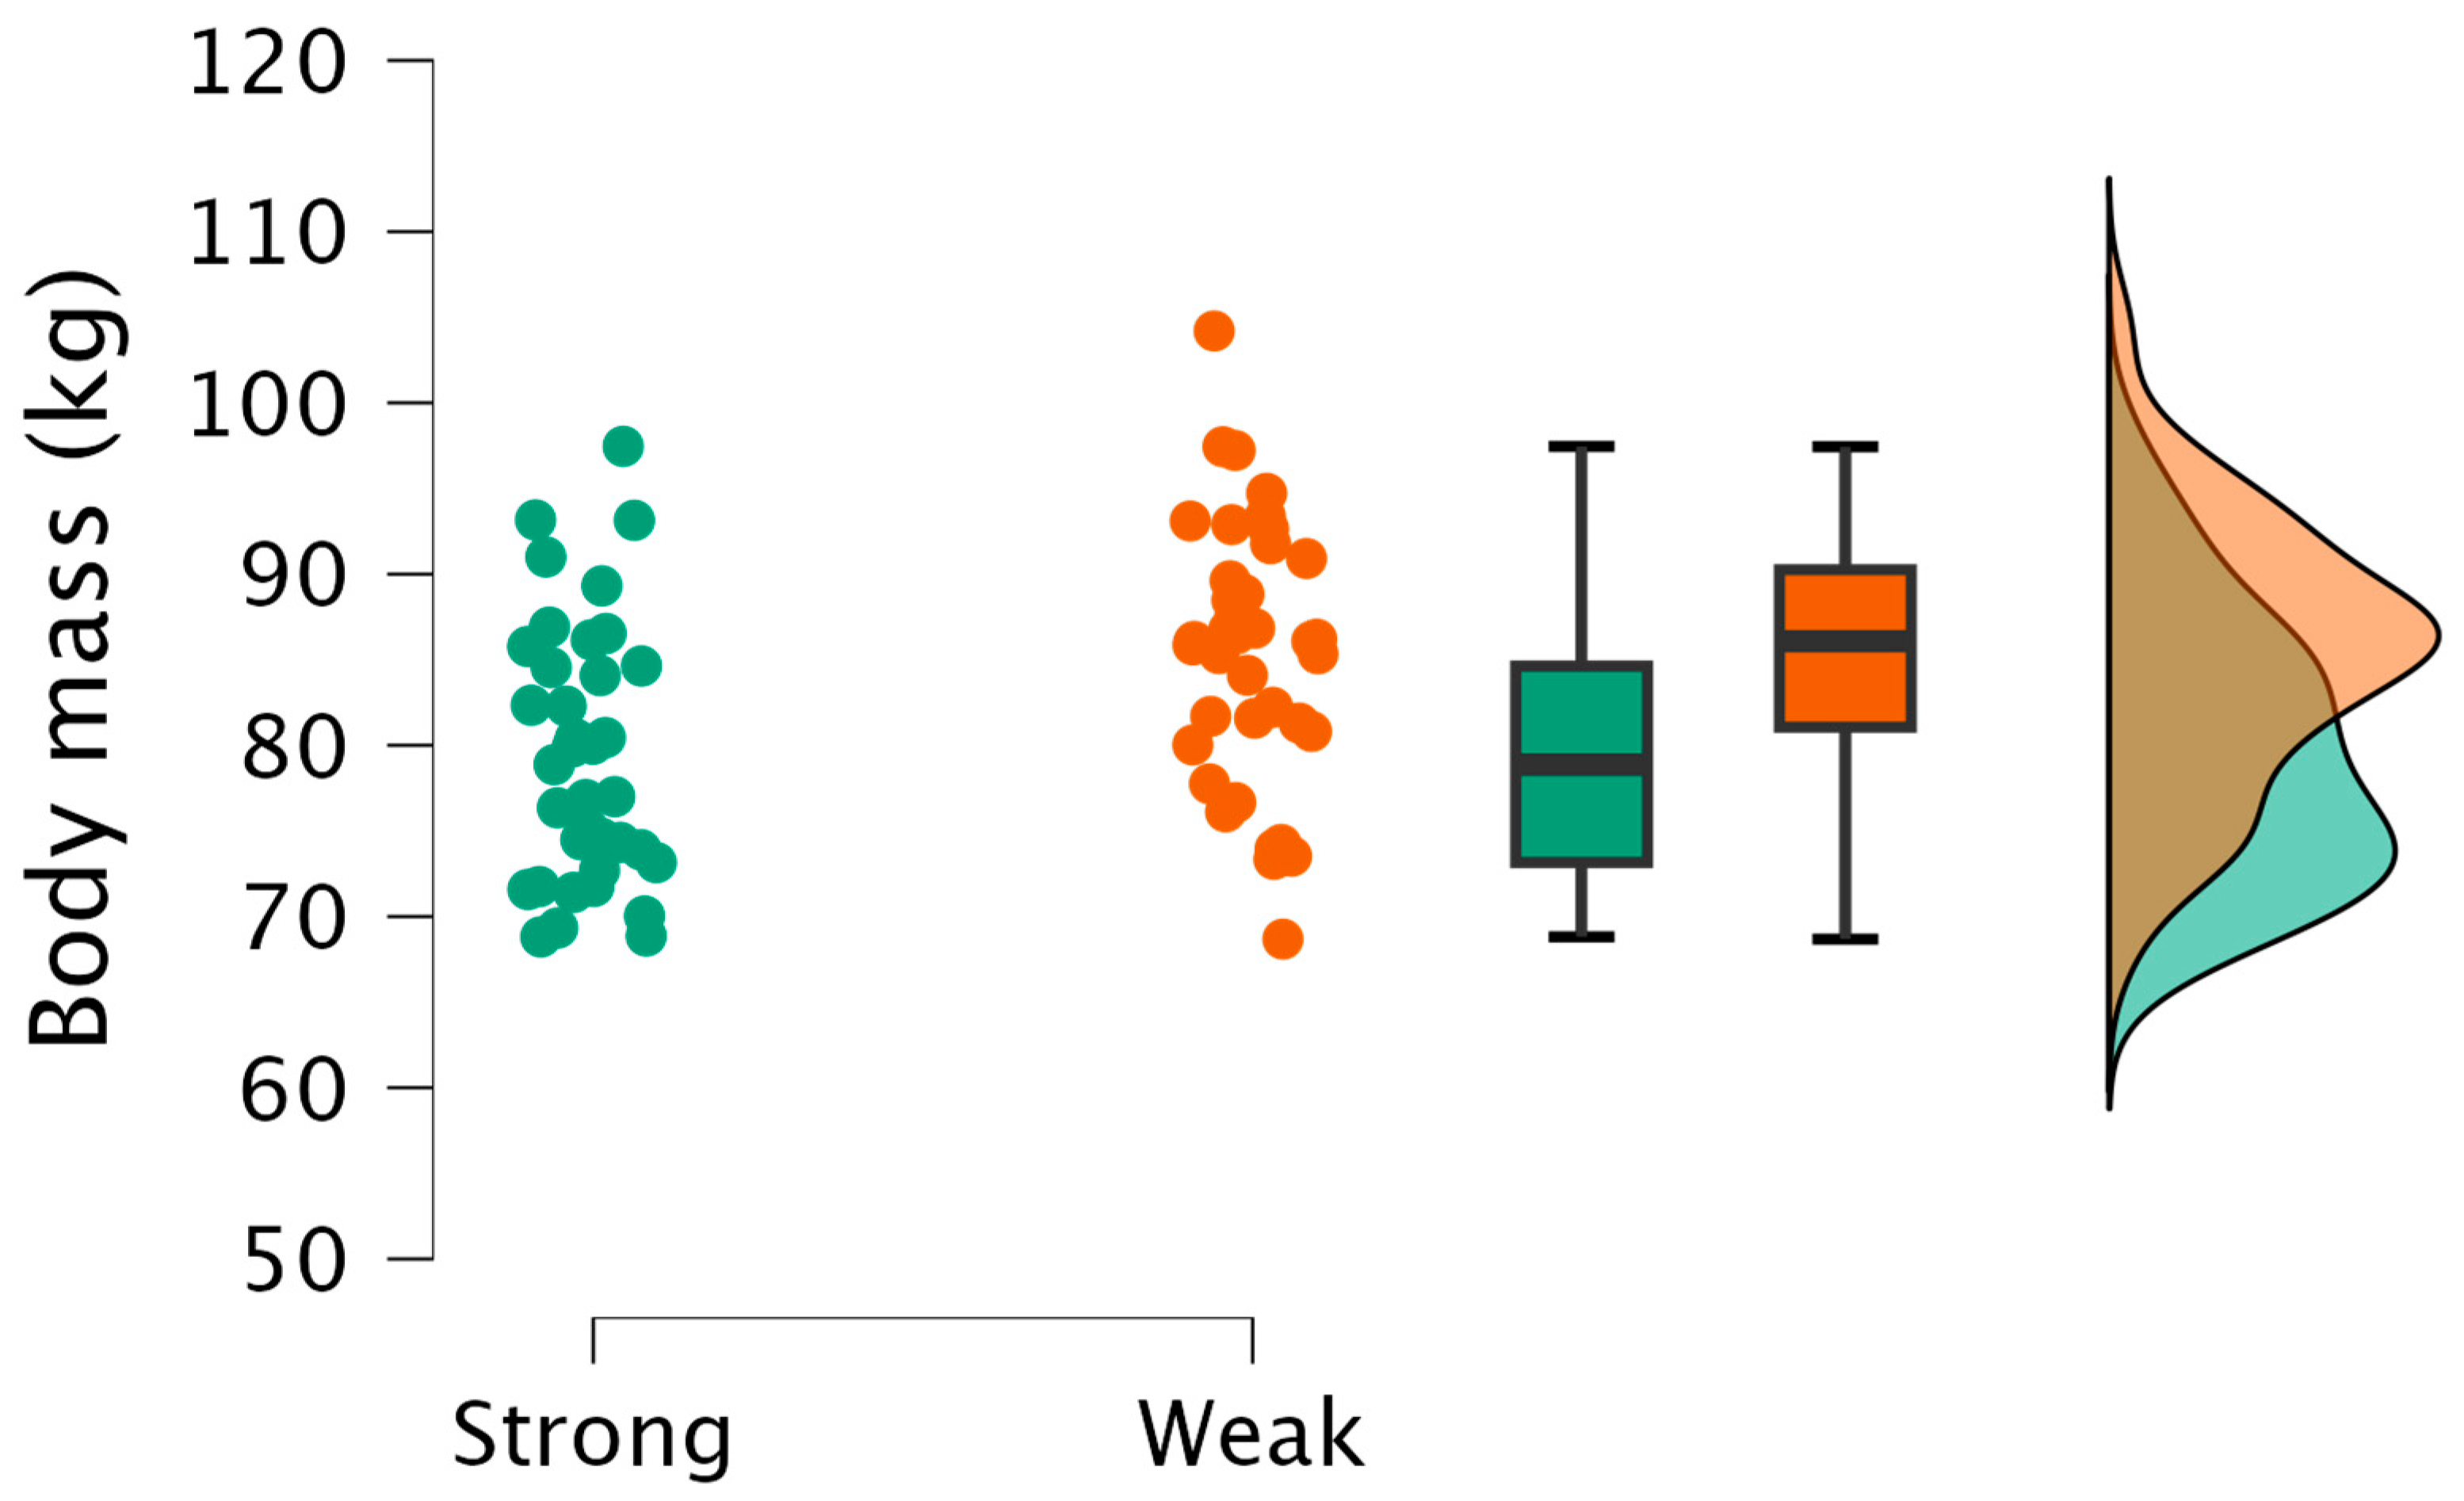
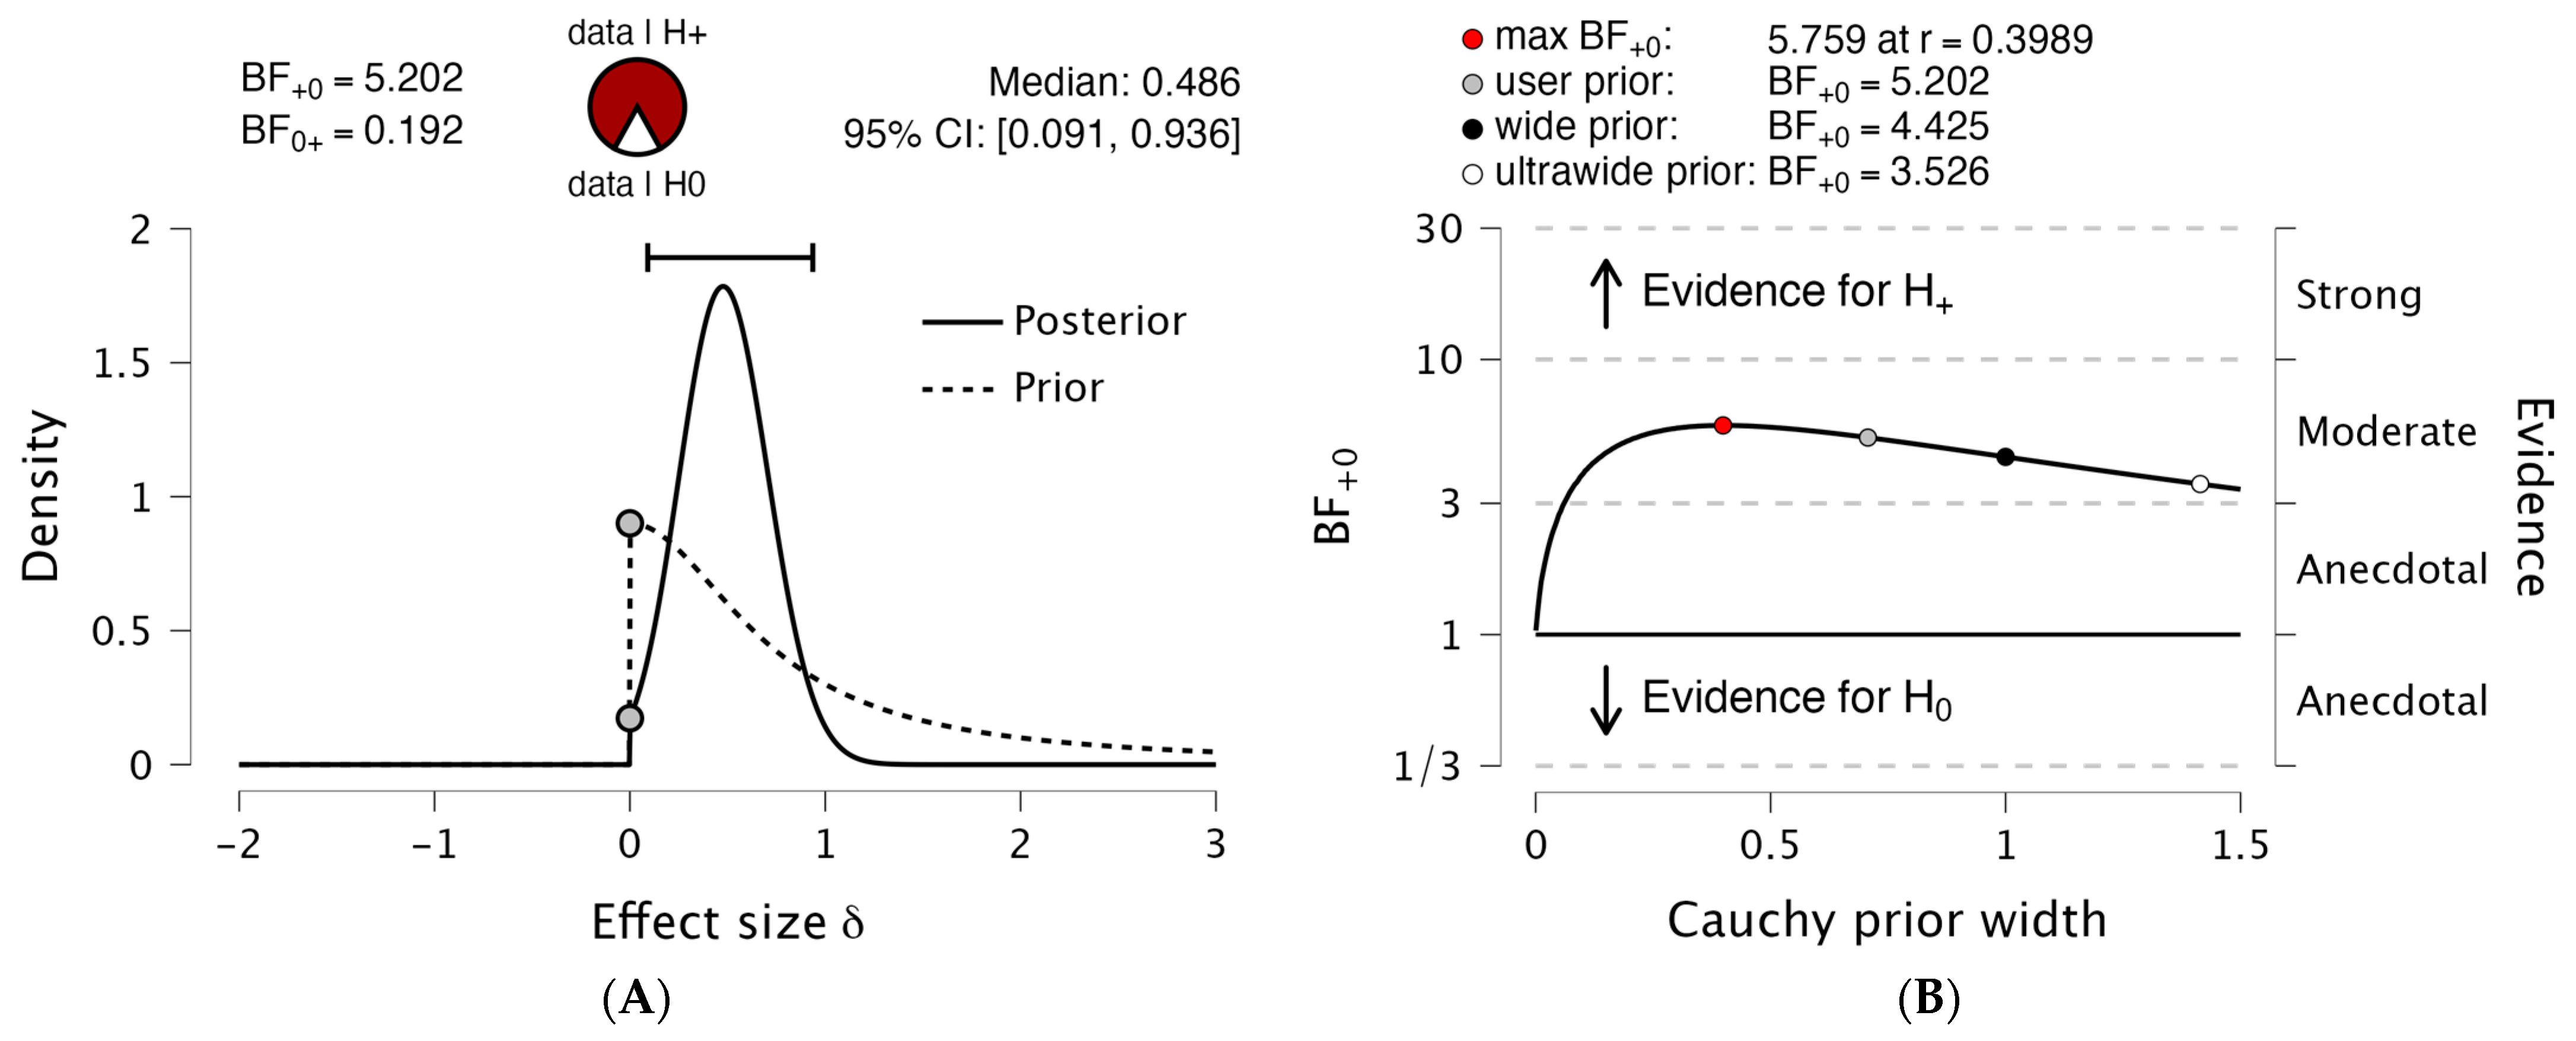
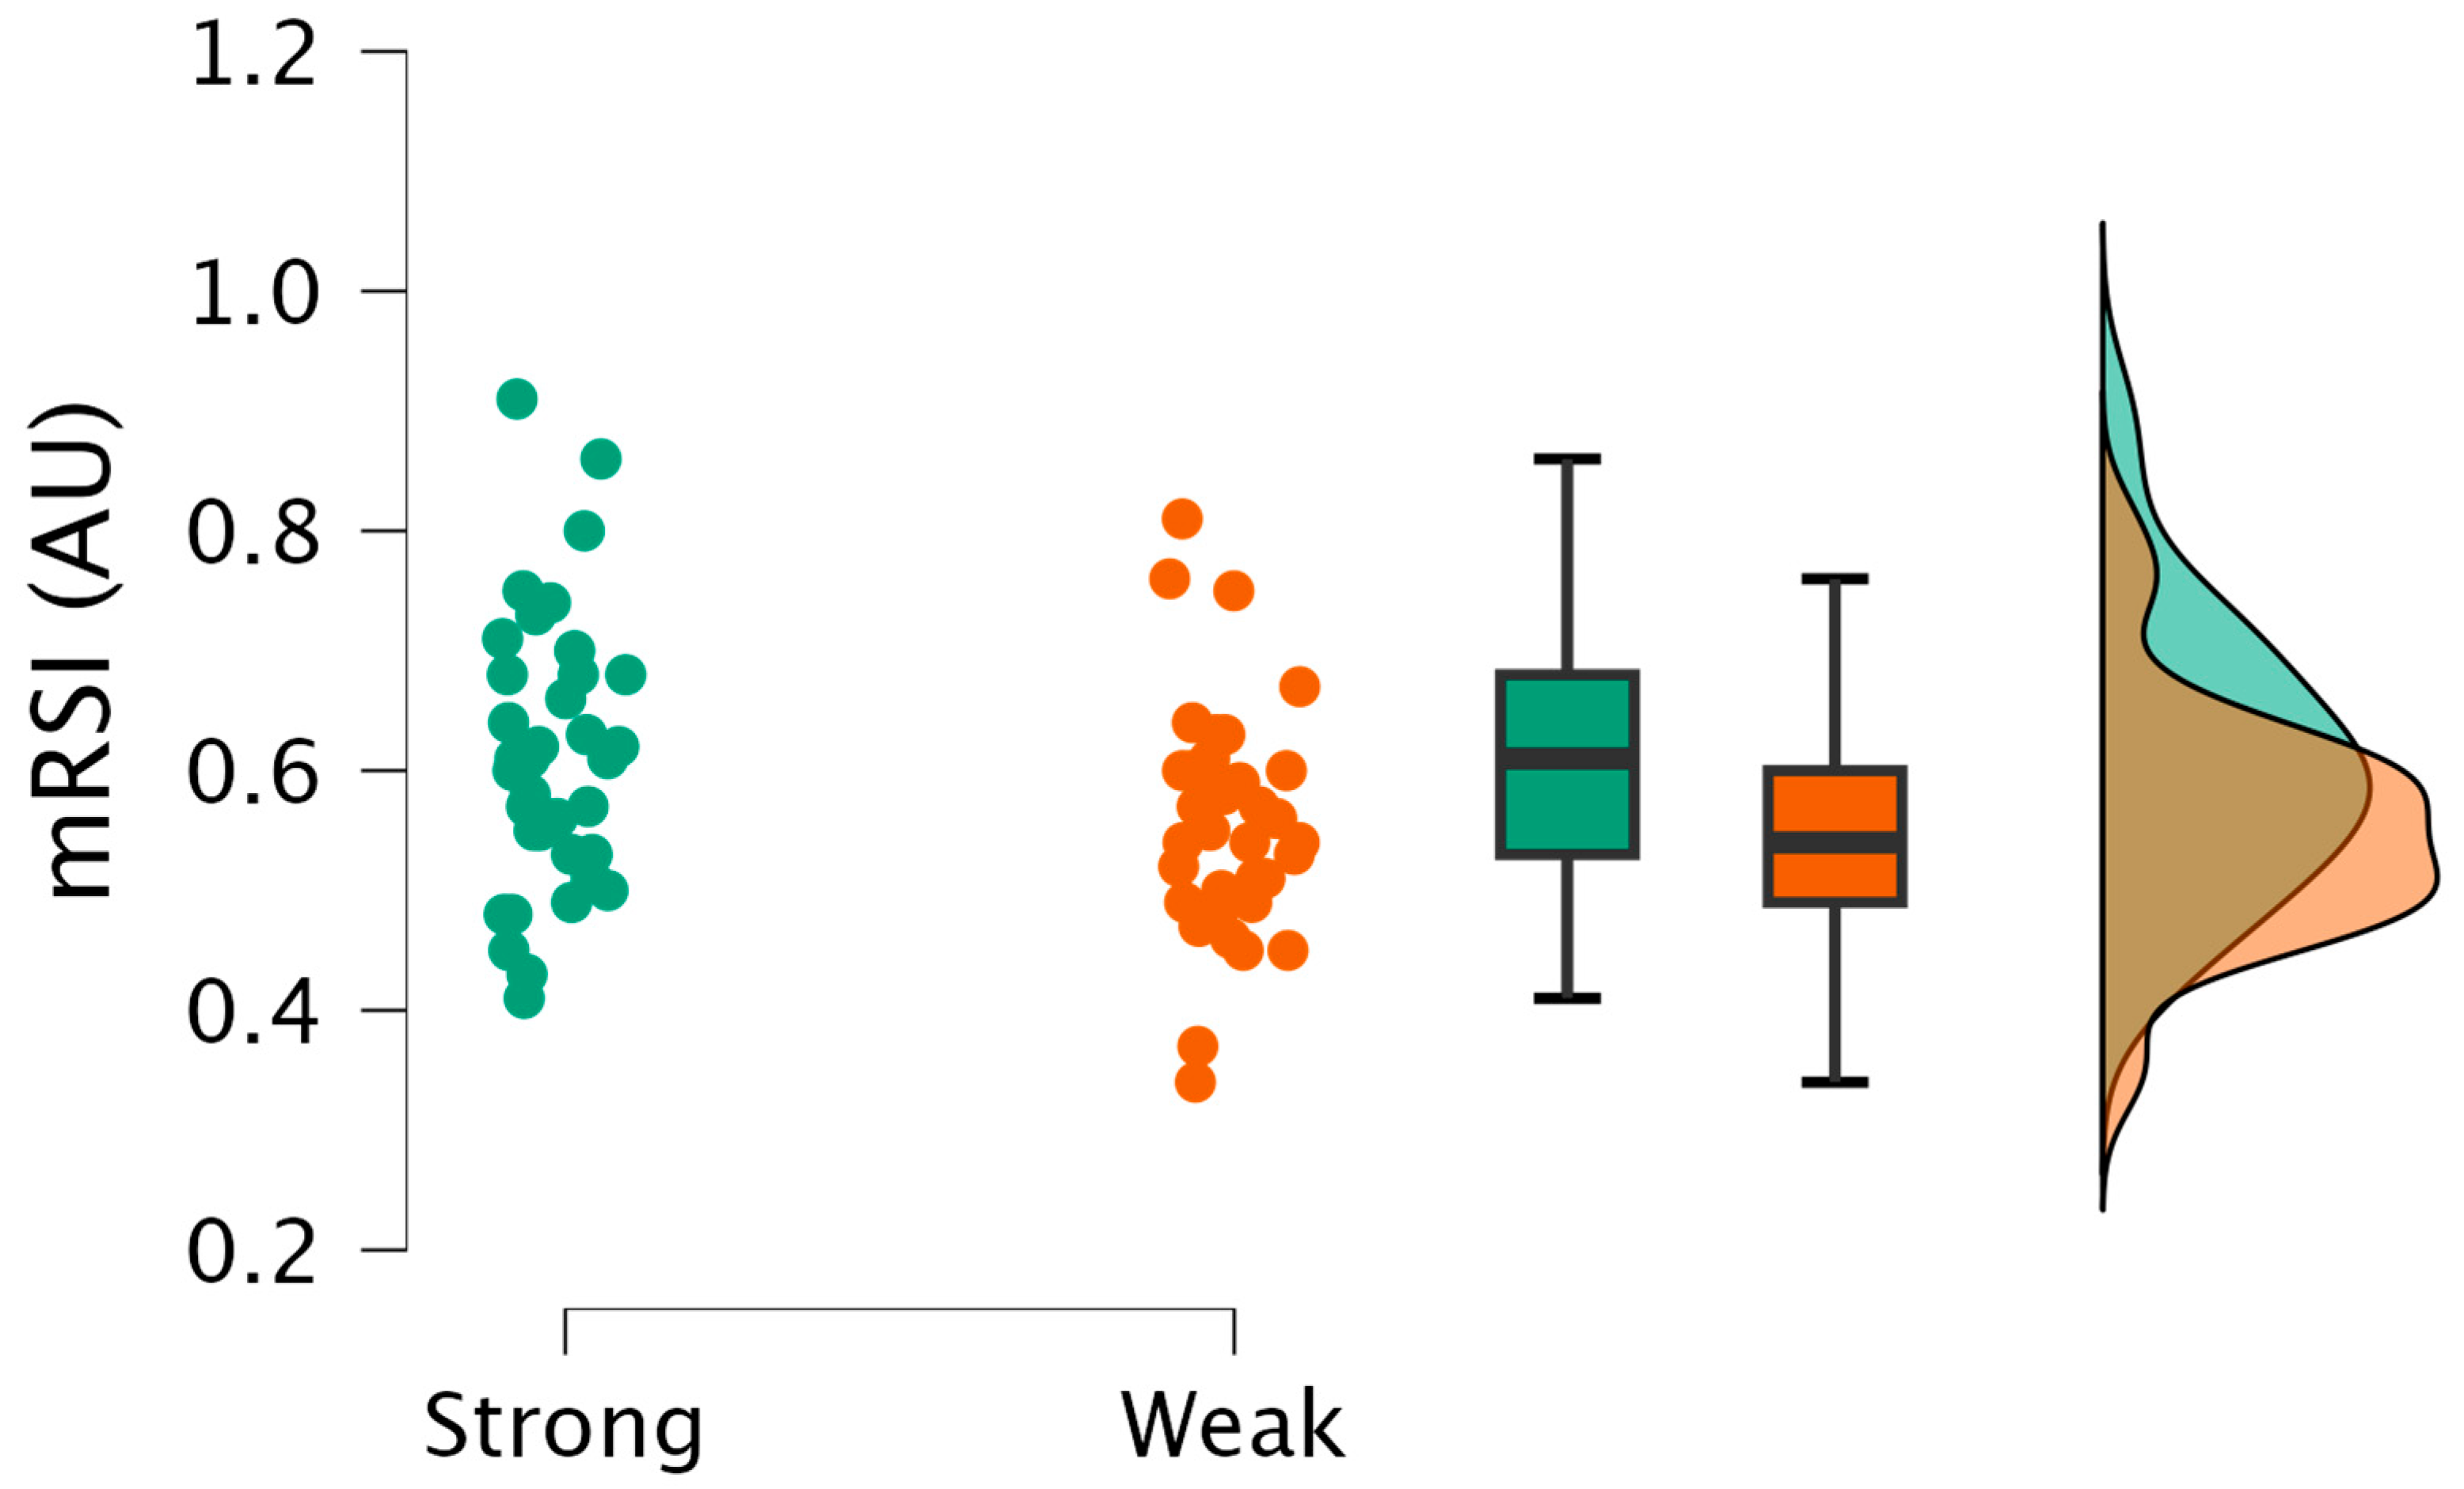
The Bayesian independent t-tests revealed strong evidence supporting the null hypothesis (h0) for body mass (Figure 1), although there was a moderate magnitude of difference based on Cohen’s d effect size between the stronger and weaker players (Figure 2). Moderate evidence was identified supporting the hypothesis (h1) that stronger players exhibited superior mRSI (Figure 3 and Figure 4) and relative average braking force (Figure 5 and Figure 6) in comparison to weaker players, albeit small in magnitude (Table 2). All other CMJ comparisons showed weak evidence of a trivial-to-small magnitude (Table 2). Robustness plots revealed consistent interpretations regardless of the prior used (Figure 1, Figure 2 and Figure 3).

4. Discussion

The purpose of the present study is to determine if relative maximal isometric force production can discriminate between higher- and lower-performing jumpers among soccer players. Maximal relative isometric force production did not differ with respect to jump outcome (i.e., jump height and jump momentum) between the stronger and weaker soccer players, with weak evidence of a small magnitude of difference (d = 0.33 and 0.42, respectively). However, observing underlying phase-specific metrics [25] provides further information on how the athletes performed the jump. For strategy metrics, there was weak evidence supporting the null hypothesis (h0) with a trivial magnitude (d = 0.10) for countermovement depth and weak evidence supporting the hypothesis (h1) with a small (d = 0.37) magnitude for time to take off. The modified reactive strength index (mRSI), which is a ratio-based metric comprising jump height divided by time to take off, identified moderate evidence to support the hypothesis (h1) to a moderate extent (d = 0.54), as mRSI could be considered an efficiency measurement of jump performance; therefore, stronger players could be considered more efficient when performing a similar jump outcome. Measures of force production are also crucial to determine the effectiveness of an individual’s jump performance; when looking at the different phases (e.g., braking and propulsion), moderate evidence to support the hypothesis (h1) with a moderate magnitude (d = 0.56) was observed for relative average braking force, indicating that stronger players applied more force over the braking phase in comparison to weaker players. This observation indicates that the braking phase is a key component of jump performance for stronger players in comparison to weaker players [38,39]. It is also crucial to observe the player when monitoring jump performance, as they are required to accelerate their own mass. There was strong evidence supporting the null hypothesis (h0), with a large magnitude (d = 0.78), that weaker players were heavier than stronger players; therefore, weaker players were able to perform the same jump outcome despite being heavier. This was achieved by the increased time to take off (despite there being only weak evidence) and enabled the weaker players achieve the same outcome via applying less force over a longer duration to achieve the same relative net impulse to accelerate their center of mass. It is noteworthy that the strong evidence supporting the null hypothesis (h0), with a large magnitude (d = 0.78), that weaker players were heavier than stronger players is contradictory; however, this can be explained as it was hypothesized in one direction that jump performance would be greater in the stronger group. As body mass did not differ with respect to other jump performance metrics (e.g., outcome, driver, and strategy), we support the null hypothesis, but the magnitude is large in the opposite direction and should be investigated further.
The improved CMJ efficiency (mRSI) and braking-phase kinetics seen among the stronger players within the present study are in agreement with what has previously been reported among collegiate male basketball players [40]. Krzyszkowski et al. [40] observed that “good jumpers”, based on mRSI, had superior braking RFD, with shorter time to take off and concentric-phase durations alongside enhanced outcomes achieved through greater jump heights [40], potentially highlighting the benefits of relative strength and the associated improvements in jump performance. Further similarities can also be observed when weaker individuals perform a strength training intervention [41], where driver eccentric-phase metrics, including relative peak and average eccentric force and relative force at minimum displacement, improve with increased lower-limb strength [41]. Note that the present manuscript used the terminology suggested by McMahon et al. [25], using certain terms (i.e., braking and propulsive) due to difficulties in exactly defining muscle action [42]. Despite terminology differences, both these studies demonstrate that the underpinning braking characteristics of a jump are defined by lower-body maximal strength, alongside greater jump performance.
Maximal strength is a key physical attribute, with strong relationships identified with a range of powerful actions [10,11,12,13,14,15], which often proceed goal scoring situations within soccer match play [1,2,3]. Jumping actions rely on the ability to accelerate one’s own mass; when Newton’s second law of motion (F = m × a, where F = force, m = mass, and a = acceleration) is rearranged, it is clear that the relative force equals acceleration (a = F ÷ m). Hence, improving an athlete’s ability to apply high levels of relative force should increase the acceleration of their center of mass. The findings of the present study only partly agree with this, as the jump outcomes between stronger and weaker players were similar. Therefore, stronger and weaker players must have had a similar resultant velocity (i.e., take off velocity), which determines jump height, but to achieve this similar velocity, the duration of application must have changed, as the weaker players were also heavier; therefore, to achieve the same jump height, they would have had to produce a greater propulsive net impulse due to their greater mass [41,43]. Within the present study, the weaker and heavier players were required to accelerate their mass for a longer duration to achieve the same outcome, whereas the stronger and lighter players needed a shorter duration to accelerate their mass and achieve the same outcome. This is a crucial aspect for sports performance, as within sport, most actions are time-constrained via the opposition or ball movement; therefore, being able to perform an identical jump outcome in a shorter duration could have sport performance benefits, such as beating players to the ball in jumping tasks (e.g., heading the ball).
The IMTP is a valid and reliable assessment for observing peak isometric force production of the lower limbs [31,44,45,46]. The IMTP assessment also possesses strong relationships with multiple measures of athletic performance, where the acceleration of the center of mass is crucial (i.e., jumping and sprinting) [10,29,30,31,47,48]. Specifically for soccer players, the IMTP is also able to differentiate between age groups and competition level among Spanish soccer players [19]. In comparison to the results of the present study, Soriano et al. [19] observed average relative peak forces for senior national and regional players of 38.6 and 38.9 N/kg, respectively. This highlights that English professional and semi-professional soccer players are relatively weak, with average relative peak force values of 33.41 N/kg, while the average relative peak force for the strong group was 37.38 N/kg, further supporting the idea that English soccer players are not strong. This could explain the lack of evidence supporting stronger players exhibiting improved jump performance. It would be prudent for future research to further investigate if stronger soccer players (>38 N/kg) have greater jump performance. This could be one benefit of a Bayesian statistical approach, as the need to pre-specify a sample, which is an essential initial step in traditional null hypothesis testing, is not required. If a higher threshold was used to classify players as strong for the present study, this would lead to an underpowered design. Bayesian analysis can also include a sequential Bayes factor plot, showing the evidential flow as a function of increasing sample size.
Absolute and relative strength can be enhanced with regular strength training [15,49]. Enhancing relative strength will enhance general athletic tasks (i.e., sprinting, jumping, decelerating, and changing direction), but this has also been shown to transfer to specific sport skills and sport performance [15,21,50,51,52]. This is likely underpinned by the enhanced force–time characteristics of an individual, including the rate of force development and external mechanical power with stronger athletes [15]. Improving strength has further benefits with regard to training, whereby stronger athletes may be able to achieve potentiation effects at an earlier rest interval and to a greater extent [15]. Utilizing strength–power complexes in training can be an effective use of time for practitioners, especially in time-constrained environments, such as team sports. Therefore, enhancing relative strength, particularly during the pre-season when there are fewer time constraints, could enhance the training effect within the season while minimizing the time required. Improving relative strength can also have non-direct influences on performance, with enhanced relative lower-limb strength reducing blood-serum creatine kinase following competitive soccer match play, suggesting reduced muscle damage [53] and potentially reducing the recovery time needed. Furthermore, enhanced lower-limb strength reduces the risk of injury [15,54], while improved squad-average IMTP peak forces have also been shown to result in the lowest annual injury rate among volleyball players [55].
Although novel, the present study is not without limitations. As testing was performed during the pre-season, it may not be representative of soccer players’ performance during competition. Therefore, future research should aim to determine IMTP relative peak force changes throughout the pre-season and in-season periods and determine if changes are also present in CMJ performance. Moreover, training load during the week prior to testing was not monitored for the present study and could have influenced the test performance. However, as all testing took place in the first week of pre-season with no intense training performed 72 h prior to testing, this effect could be limited. Although weak evidence supporting the hypothesis (h1) was observed for time to take off, it does not provide any indication of which phases stronger and weaker players spent different durations in (e.g., unweighting, braking, and propulsion). Strength training has been shown to increase countermovement depth, without impacting time to take off [39]. Although the change in displacement is not supported by the results of the present study, it does highlight the need to investigate phase duration differences in the future. The focus of the present study was maximal relative force production; however, as jumping tasks require force to be applied rapidly, the ability to express large percentages of peak force in short time periods could be of equal importance, especially as this neuromuscular quality is determined by relative strength [23]. Therefore, future research is required to determine if force at early time points and the ability to express high percentages of maximal force rapidly are related to jump performance.

5. Conclusions

Maximal relative strength has implications on jump performance, albeit not on the jump outcome. Stronger players were found to perform CMJ more efficiently when observing the mRSI, while producing greater average relative forces during the braking phase. The ability to brake effectively during the CMJ and reverse to an upwards propulsive movement efficiently is an essential skill for soccer players. Although the same outcome was achieved, the stronger players achieved this in a shorter duration (although only weak evidence supports this hypothesis [h1]). The mRSI exhibits moderate evidence to support this hypothesis (h1) for this efficient action with a moderate magnitude, highlighting that, for sporting performance, stronger players reach the same outcome faster and would be in an advantageous position in comparison to weaker individuals. For instance, in a heading situation, if a stronger player could be in the air to achieve the same outcome quicker, they would likely have greater success in overcoming air-resistance challenges, which could lead to goal scoring situations. Therefore, practitioners should aim to develop maximal relative isometric strength within soccer players to enhance their jump performance and for the previously mentioned benefits to increasing strength.

Author Contributions

Conceptualization, N.J.R. and J.F.; methodology, N.J.R.; formal analysis, N.J.R. and N.H.; investigation, N.J.R. and J.F.; writing—original draft preparation, N.J.R.; writing—review and editing, N.J.R., J.F., N.H., and P.C. All authors have read and agreed to the published version of the manuscript.

Funding

This research received no external funding.

Institutional Review Board Statement

The study was conducted in accordance with the Declaration of Helsinki and approved by the Institutional Review Board of University of Salford (protocol code 2216 and 8 July 2021).

Informed Consent Statement

Informed consent was obtained from all subjects involved in the study.

Data Availability Statement

Data are available on reasonable request to the corresponding author.

Conflicts of Interest

The authors declare no conflicts of interest.

Abbreviations

The following abbreviations are used in this manuscript:
IMTPIsometric Mid-Thigh Pull
CMJCountermovement Jump
mRSIModified Reactive Strength Index
BFBayes Factor

References

  1. Faude, O.; Koch, T.; Meyer, T. Straight sprinting is the most frequent action in goal situations in professional football. J. Sports Sci. 2012, 30, 625–631. [Google Scholar] [CrossRef] [PubMed]
  2. Martínez-Hernández, D.; Quinn, M.; Jones, P. Linear advancing actions followed by deceleration and turn are the most common movements preceding goals in male professional soccer. Sci. Med. Footb. 2023, 7, 25–33. [Google Scholar] [CrossRef] [PubMed]
  3. Martínez-Hernández, D.; Quinn, M.; Jones, P. Most common movements preceding goal scoring situations in female professional soccer. Sci. Med. Footb. 2024, 8, 260–268. [Google Scholar] [CrossRef] [PubMed]
  4. Stølen, T.; Chamari, K.; Castagna, C.; Wisløff, U. Physiology of Soccer. Sports Med. 2005, 35, 501–536. [Google Scholar] [CrossRef]
  5. Abe, T.; Fukashiro, S.; Harada, Y.; Kawamoto, K. Relationship between Sprint Performance and Muscle fascicle length in Female Sprinters. J. Physiol. Anthropol. 2001, 20, 141–147. [Google Scholar] [CrossRef]
  6. Alt, T.; Komnik, I.; Severin, J.; Nodler, Y.T.; Benker, R.; Knicker, A.J.; Brüggemann, G.-P.; Strueder, H. Swing phase mechanics of maximal velocity sprints—Does isokinetic thigh muscle strength matter? Int. J. Sports Physiol. Perform. 2020, 16, 974–984. [Google Scholar] [CrossRef]
  7. Comfort, P.; Bullock, N.; Pearson, S.J. A comparison of maximal squat strength and 5-, 10-, and 20-meter sprint times, in athletes and recreationally trained men. J. Strength Cond. Res. 2012, 26, 937–940. [Google Scholar] [CrossRef]
  8. Comfort, P.; Haigh, A.; Matthews, M.J. Are changes in maximal squat strength during preseason training reflected in changes in sprint performance in rugby league players? J. Strength Cond. Res. 2012, 26, 772–776. [Google Scholar] [CrossRef]
  9. Comfort, P.; Stewart, A.; Bloom, L.; Clarkson, B. Relationships between strength, sprint, and jump performance in well-trained youth soccer players. J. Strength Cond. Res. 2014, 28, 173–177. [Google Scholar] [CrossRef]
  10. Thomas, C.; Comfort, P.; Chiang, C.Y.; Jones, P.A. Relationship between isometric mid-thigh pull variables and sprint and change of direction performance in collegiate athletes. J. Trainology 2015, 4, 6–10. [Google Scholar] [CrossRef]
  11. Thomas, C.; Jones, P.A.; Rothwell, J.; Chiang, C.Y.; Comfort, P. An Investigation Into the Relationship Between Maximum Isometric Strength and Vertical Jump Performance. J. Strength Cond. Res. 2015, 29, 2176–2185. [Google Scholar] [CrossRef] [PubMed]
  12. Cronin, J.B.; Hansen, K.T. Strength and power predictors of sports speed. J. Strength Cond. Res. 2005, 19, 349–357. [Google Scholar] [CrossRef] [PubMed]
  13. Harper, D.; Cohen, D.D.; Rhodes, D.; Carling, C.; Kiely, J. Drop jump neuromuscular performance qualities associated with maximal horizontal deceleration ability in team sport athletes. Eur. J. Sport Sci. 2022, 22, 1005–1016. [Google Scholar] [CrossRef]
  14. Harper, D.; Cohen, D.D.; Carling, C.; Kiely, J. Can Countermovement Jump Neuromuscular Performance Qualities Differentiate Maximal Horizontal Deceleration Ability in Team Sport Athletes? Sports 2020, 8, 76. [Google Scholar] [CrossRef]
  15. Suchomel, T.J.; Nimphius, S.; Stone, M.H. The Importance of Muscular Strength in Athletic Performance. Sports Med. 2016, 46, 1419–1449. [Google Scholar] [CrossRef]
  16. McQuilliam, S.J.; Clark, D.R.; Erskine, R.M.; Brownlee, T.E. Global Differences in Current Strength and Conditioning Practice within Soccer. Int. J. Sports Sci. Coach. 2024, 19, 182–191. [Google Scholar] [CrossRef]
  17. Guthrie, B.; Jagim, A.; Jones, M.T. Ready or Not, Here I Come: A Scoping Review of Methods Used to Assess Player Readiness Via Indicators of Neuromuscular Function in Football Code Athletes. Strength Cond. J. 2023, 45, 93–110. [Google Scholar] [CrossRef]
  18. Weldon, A.; Duncan, M.J.; Turner, A.; Sampaio, J.; Noon, M.; Wong, D.P.; Lai, V.W. Contemporary practices of strength and conditioning coaches in professional soccer. Biol. Sport 2020, 38, 377–390. [Google Scholar] [CrossRef]
  19. Soriano, M.A.; Paredes, V.; Comfort, P.; Jiménez-Ormeño, E.; Areces-Corcuera, F.; Giráldez-Costas, V.; Gallo-Salazar, C.; Alonso-Aubín, D.A.; Menchén-Rubio, M.; McMahon, J.J. “You Are Not Wrong About Getting Strong:” An Insight Into the Impact of Age Group and Level of Competition on Strength in Spanish Football Players. Int. J. Sports Physiol. Perform. 2024, 19, 629–636. [Google Scholar] [CrossRef]
  20. Baker, D.G.; Newton, R.U. Comparison of lower body strength, power, acceleration, speed, agility, and sprint momentum to describe and compare playing rank among professional rugby league players. J. Strength Cond. Res. 2008, 22, 153–158. [Google Scholar] [CrossRef]
  21. Gabbett, T.; Kelly, J.; Pezet, T. Relationship between physical fitness and playing ability in rugby league players. J. Strength Cond. Res. 2007, 21, 1126–1133. [Google Scholar] [CrossRef] [PubMed]
  22. McMahon, J.; Murphy, S.; Rej, S.; Comfort, P. Countermovement-Jump-Phase Characteristics of Senior and Academy Rugby League Players. Int. J. Sports Physiol. Perform. 2017, 12, 803–811. [Google Scholar] [CrossRef] [PubMed]
  23. Comfort, P.; McMahon, J.J.; Lake, J.; Ripley, N.J.; Triplett, N.T.; Haff, G.G. Relative strength explains the differences in multi-joint rapid force production between sexes. PLoS ONE 2024, 19, e0296877. [Google Scholar] [CrossRef]
  24. Spencer, R.; Sindall, P.; Hammond, K.M.; Atkins, S.J.; Quinn, M.; McMahon, J.J. Changes in Body Mass and Movement Strategy Maintain Jump Height Immediately after Soccer Match. Appl. Sci. 2023, 13, 7188. [Google Scholar] [CrossRef]
  25. McMahon, J.; Suchomel, T.; Lake, J.; Comfort, P. Understanding the Key Phases of the Countermovement Jump Force-Time Curve. Strength Cond. J. 2018, 40, 96–106. [Google Scholar] [CrossRef]
  26. Bernards, J.R.; Sato, K.; Haff, G.G.; Bazyler, C.D. Current Research and Statistical Practices in Sport Science and a Need for Change. Sports 2017, 5, 87. [Google Scholar] [CrossRef]
  27. Mengersen, K.L.; Drovandi, C.C.; Robert, C.P.; Pyne, D.B.; Gore, J.C. Bayesian estimation of small effects in exercise and sports science. PLoS ONE 2016, 11, e0147311. [Google Scholar] [CrossRef]
  28. Lakens, D. Comment: What p-hacking really looks like: A comment on Masicampo and LaLande (2012). Q. J. Exp. Psychol. 2015, 68, 829–832. [Google Scholar] [CrossRef]
  29. Dos’Santos, T.; Thomas, C.; Comfort, P.; McMahon, J.J.; Jones, P.A. Relationships between Isometric Force-Time Characteristics and Dynamic Performance. Sports 2017, 5, 68. [Google Scholar] [CrossRef]
  30. Lum, D.; Haff, G.G.; Barbosa, T.M. The Relationship between Isometric Force-Time Characteristics and Dynamic Performance: A Systematic Review. Sports 2020, 8, 63. [Google Scholar] [CrossRef]
  31. Merrigan, J.J.; Stone, J.D.; Hornsby, W.G.; Hagen, J.A. Identifying Reliable and Relatable Force–Time Metrics in Athletes—Considerations for the Isometric Mid-Thigh Pull and Countermovement Jump. Sports 2020, 9, 4. [Google Scholar] [CrossRef] [PubMed]
  32. Badby, A.J.; Mundy, P.D.; Comfort, P.; Lake, J.P.; McMahon, J.J. The Validity of Hawkin Dynamics Wireless Dual Force Plates for Measuring Countermovement Jump and Drop Jump Variables. Sensors 2023, 23, 4820. [Google Scholar] [CrossRef] [PubMed]
  33. Merrigan, J.J.; Stone, J.D.; Galster, S.M.; Hagen, J.A. Analyzing Force-Time Curves: Comparison of Commercially Available Automated Software and Custom MATLAB Analyses. J. Strength Cond. Res. 2022, 36, 2387–2402. [Google Scholar] [CrossRef] [PubMed]
  34. Comfort, P.; Dos’Santos, T.; Beckham, G.K.; Stone, M.; Guppy, S.; Haff, G. Standardization and Methodological Considerations for the Isometric Midthigh Pull. Strength Cond. J. 2019, 41, 57–79. [Google Scholar] [CrossRef]
  35. Harry, J.R.; Blinch, J.; Barker, L.A.; Krzykowski, J.; Chowning, L. Low-Pass Filter Effects on Metrics of Countermovement Vertical Jump Performance. J. Strength Cond. Res. 2022, 36, 1459–1467. [Google Scholar] [CrossRef]
  36. van Doorn, J.; van den Bergh, D.; Böhm, U.; Dablander, F.; Derks, K.; Draws, T.; Etz, A.; Evans, N.J.; Granau, Q.F.; Haaf, J.M.; et al. The JASP guidelines for conducting and reporting a Bayesian analysis. Psychom. Bull. Rev. 2021, 28, 813–826. [Google Scholar] [CrossRef]
  37. Hopkins, W. A scale of magnitudes for effect statistics: A New View of Statistic. 2002. Available online: https://www.sportsci.org/resource/stats/effectmag.html (accessed on 4 May 2024).
  38. Cormie, P.; McGuigan, M.R.; Newton, R.U. Influence of strength on magnitude and mechanisms of adaptation to power training. Med. Sci. Sports Exerc. 2010, 42, 1566–1581. [Google Scholar] [CrossRef]
  39. Cormie, P.; McGuigan, M.R.; Newton, R.U. Adaptations in athletic performance after ballistic power versus strength training. Med. Sci. Sports Exerc. 2010, 42, 1582–1598. [Google Scholar] [CrossRef]
  40. Krzyszkowski, J.; Chowning, L.D.; Harry, J.R. Phase-Specific Predictors of Countermovement Jump Performance That Distinguish Good From Poor Jumpers. J. Strength Cond. Res. 2022, 36, 1257–1263. [Google Scholar] [CrossRef]
  41. Cormie, P.; McGuigan, M.R.; Newton, R.U. Changes in the eccentric phase contribution to improved stretch-shortening cycle performance after training. Med. Sci. Sports Exerc. 2010, 42, 1731–1744. [Google Scholar] [CrossRef]
  42. Hahn, D. On the phase definitions of counter movement jumps. Scand. J. Med. Sci. Sports 2023, 33, 359–360. [Google Scholar] [CrossRef] [PubMed]
  43. Linthorne, N. Analysis of standing vertical jumps using a force platform. Am. J. Phys. 2001, 69, 1198–1204. [Google Scholar] [CrossRef]
  44. Grgic, J.; Scapec, B.; Mikulic, P.; Pedisic, Z. Test-retest reliability of isometric mid-thigh pull maximum strength assessment: A systematic review. Biol. Sport 2022, 39, 407–414. [Google Scholar] [CrossRef]
  45. Guppy, S.N.; Brady, C.; Comfort, P.; Haff, G.G. The Isometric Mid-Thigh Pull: A Review & Methodology—Part 1. Prof. Strength Cond. 2018, 51, 13–19. [Google Scholar]
  46. Guppy, S.N.; Brady, C.; Comfort, P.; Haff, G.G. The Isometric Mid-Thigh Pull: A Review & Methodology—Part 2. Prof. Strength Cond. 2018, 51, 21–29. [Google Scholar]
  47. Nuzzo, J.L.; McBride, J.M.; Cormie, P.; McCaulley, G.O. Relationship between countermovement jump performance and multijoint isometric and dynamic tests of strength. J. Strength Cond. Res. 2008, 22, 699–707. [Google Scholar] [CrossRef]
  48. Wang, R.; Hoffman, J.R.; Tanigawa, S.; Miramonti, A.A.; La Monica, M.B.; Beyer, K.S.; Church, D.D.; Fukuda, D.H.; Jeffrey, S.R. Isometric Mid-Thigh Pull Correlates with Strength, Sprint and Agility Performance in Collegiate Rugby Union Players. J. Strength Cond. Res. 2016, 30, 3051–3056. [Google Scholar] [CrossRef]
  49. Suchomel, T.; Nimphius, S.; Bellon, C.R.; Stone, M.H. The Importance of Muscular Strength: Training Considerations. Sports Med. 2018, 48, 765–785. [Google Scholar] [CrossRef]
  50. Gabbett, T.J.; Jenkins, D.G.; Abernethy, B. Correlates of tackling ability in high-performance rugby league players. J. Strength Cond. Res. 2011, 25, 72–79. [Google Scholar] [CrossRef]
  51. Gabbett, T.J.; Seibold, A.J. Relationship between tests of physical qualities, team selection, and physical match performance in semiprofessional rugby league players. J. Strength Cond. Res. 2013, 27, 3259–3265. [Google Scholar] [CrossRef]
  52. Gabbett, T.J.; Stein, J.G.; Kemp, J.G.; Lorenzen, C. Relationship between tests of physical qualities and physical match performance in elite rugby league players. J. Strength Cond. Res. 2013, 27, 1539–1545. [Google Scholar] [CrossRef] [PubMed]
  53. Owen, A.; Dunlop, G.; Rouissi, M.; Chtara, M.; Paul, D.J.; Zouhal, H.; Wong, D.P. The relationship between lower-limb strength and match-related muscle damage in elite level professional European soccer players. J. Sports Sci. 2016, 33, 2100–2105. [Google Scholar] [CrossRef] [PubMed]
  54. Lauersen, J.B.; Bertelsen, D.M.; Andersen, L.B. The effectiveness of exercise interventions to prevent sports injuries: A systematic review and meta-analysis of randomised controlled trials. Br. J. Sports Med. 2014, 48, 871–877. [Google Scholar] [CrossRef] [PubMed]
  55. Sole, C.J.; Kavanaugh, A.A.; Reed, J.P.; Israetel, M.A.; Devine, L.E.; Ramsey, M.W.; Sands, W.A.; Stone, M.E. The Sport Performance Enhancement Group: A Five-Year Analysis of Interdisciplinary Athlete Development. In Proceedings of the 8th Annual Coaches and Sport Science College, Johnson City, TN, USA, 13–14 December 2013; pp. 28–30. [Google Scholar]
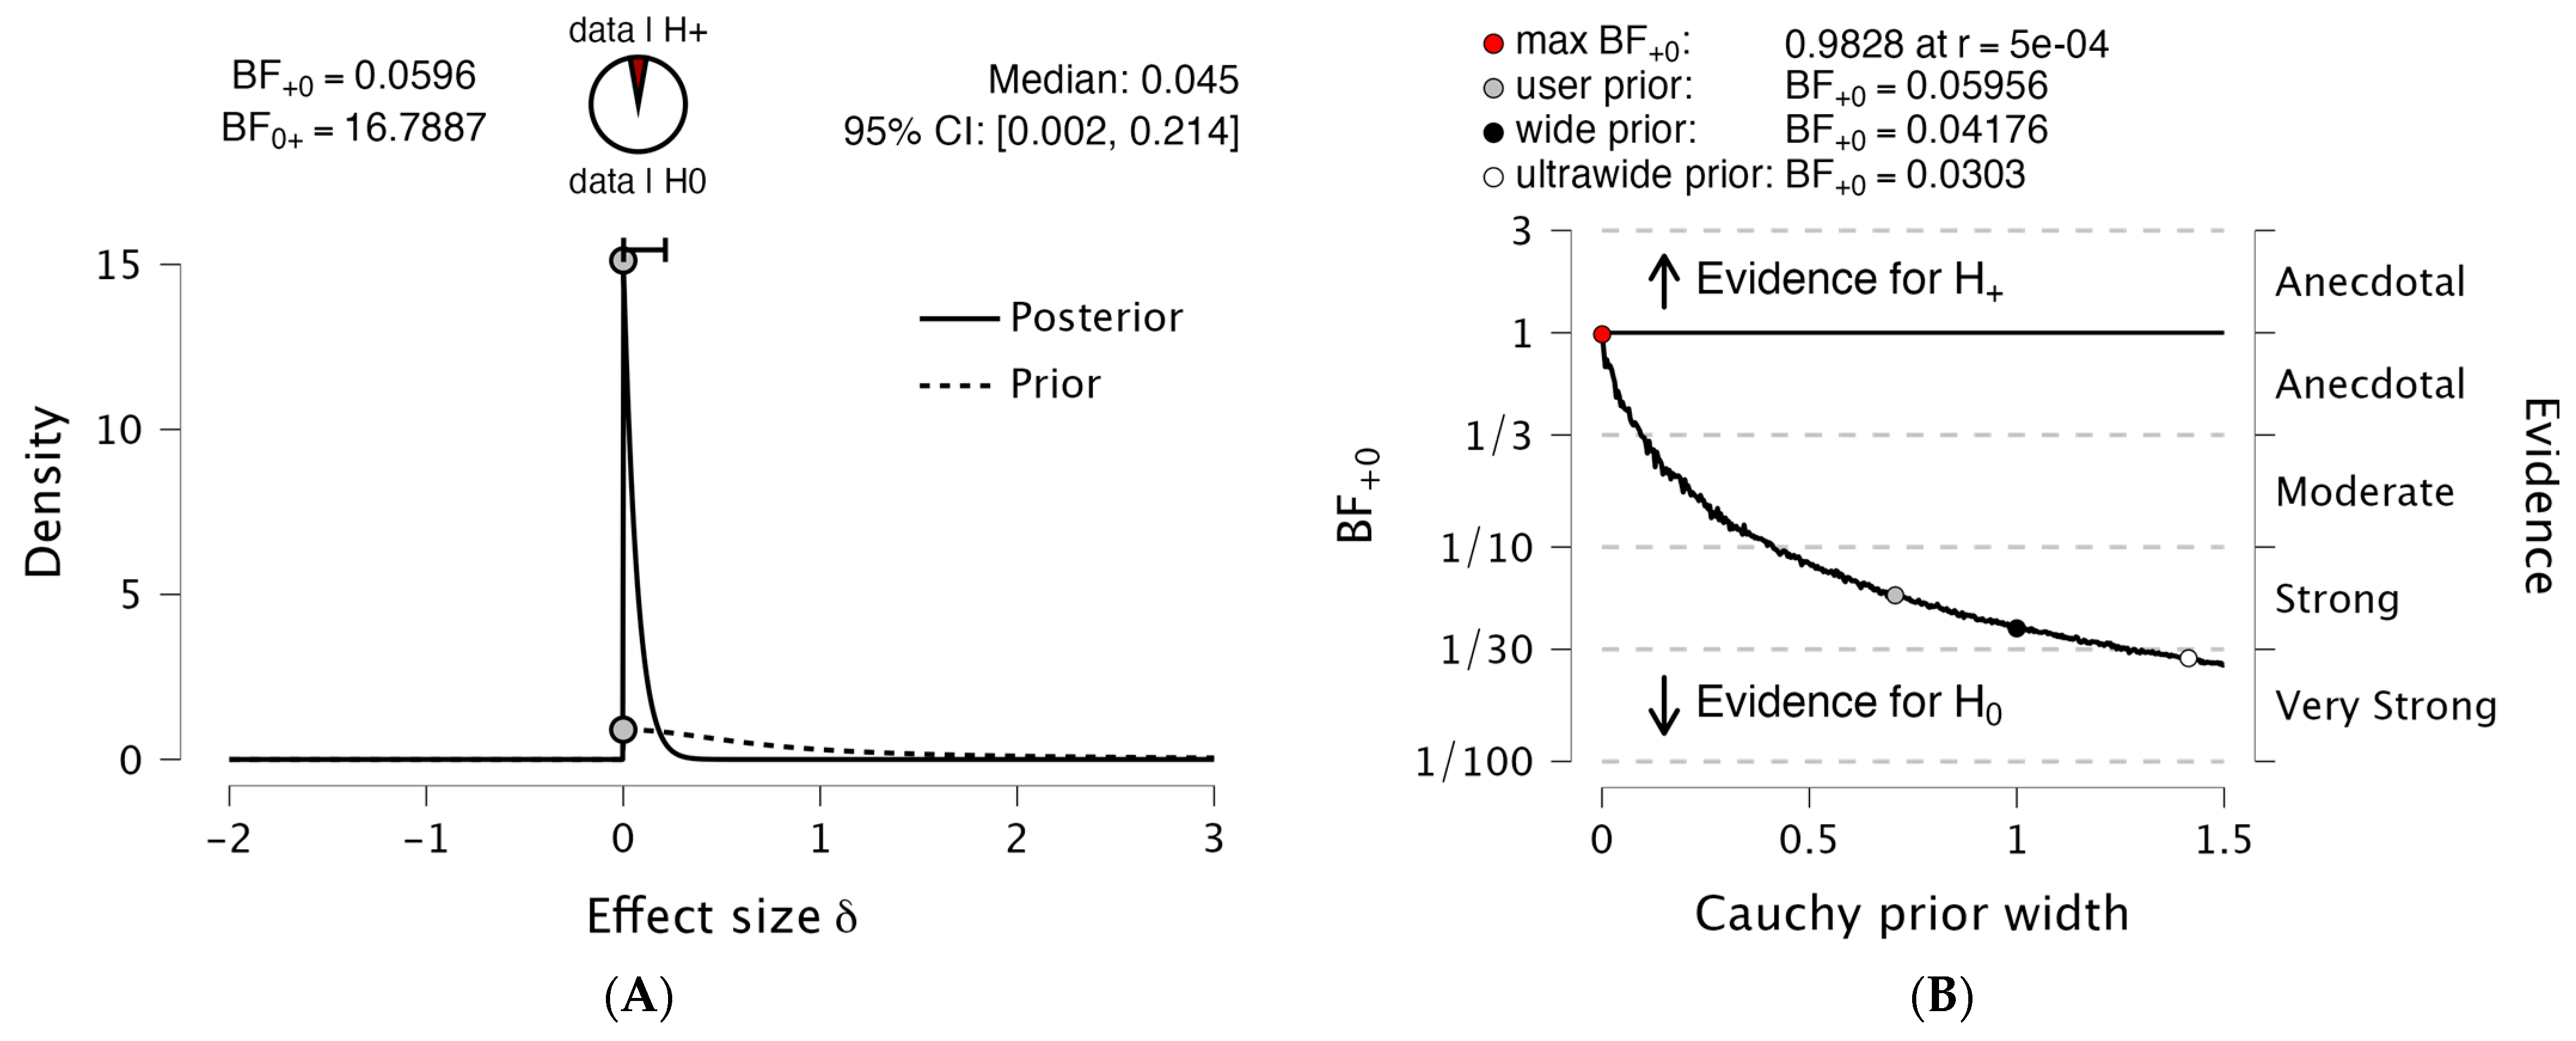
Figure 1. (A) Bayesian independent-sample t test for the parameter body mass (kg). The probability wheel on top visualizes the evidence that the data provide for the two rival hypotheses. The two gray dots indicate the prior and posterior density at the test value. The median and the 95% central credible interval of the posterior distribution are shown in the top right corner. (B) The Bayes factor robustness plot presenting the maximum BF+0 is attained when setting the prior width r to 0.38. The plot indicates BF+0 for the user-specified prior (r = 1/2), wide prior (r = 1), and ultrawide prior.
Biomechanics 05 00032 g001
Figure 2. Raincloud plot with individual data points for body mass (kg) for strong and weak groups and box and whisker plots presenting median, interquartile range, and normal distribution.
Biomechanics 05 00032 g002
Figure 3. (A) Bayesian independent-sample t test for the parameter mRSI. The probability wheel on top visualizes the evidence that the data provide for the two rival hypotheses. The two gray dots indicate the prior and posterior density at the test value. The median and the 95% central credible interval of the posterior distribution are shown in the top right corner. (B) Bayes factor robustness plot presenting that the maximum BF+0 is attained when setting the prior width r to 0.38. The plot indicates BF+0 for the user specified prior (r = 1/2), wide prior (r = 1), and ultrawide prior.
Biomechanics 05 00032 g003
Figure 4. Raincloud plot with individual data points for modified reactive strength index (mRSI) for strong and weak groups and box and whisker plots presenting median, interquartile range, and normal distribution.
Biomechanics 05 00032 g004
Figure 5. (A) Bayesian independent-sample t test for the parameter relative average braking force. The probability wheel on top visualizes the evidence that the data provide for the two rival hypotheses. The two gray dots indicate the prior and posterior density at the test value. The median and the 95% central credible interval of the posterior distribution are shown in the top right corner. (B) Bayes factor robustness plot presenting that the maximum BF+0 is attained when setting the prior width r to 0.38. The plot indicates BF+0 for the user-specified prior (r = 1/2), wide prior (r = 1), and ultrawide prior.
Biomechanics 05 00032 g005
Figure 6. Raincloud plot with individual data points for relative average (Avg.) braking force (N/kg) for strong and weak groups and box and whisker plots presenting median, interquartile range, and normal distribution.
Biomechanics 05 00032 g006
Table 1. Countermovement jump metrics selected for Bayesian analysis.
CategoryMetric
PersonBody mass (kg)
OutcomeJump height (m)
Jump momentum (kg.m/s−1)
mRSI (AU)
DriverRelative force at minimum displacement (N/kg)
Relative average braking force (N/kg)
Relative average propulsive force (N/kg)
Relative peak propulsive force (N/kg)
StrategyCountermovement depth (m)
Time to take off (s)
mRSI = modified reactive strength index.
Table 2. Mean ± SD, Bayesian independent t-test (BF10) and Cohen’s d effect size difference for “strong” vs. “weak” players.
MetricMean ± SDBF10Bayes InterpretationCohen’s d Effect Size (95% CI)
Body mass (kg)Strong: 79.44 ± 7.65 Weak: 85.93 ± 7.660.060Strong Evidence h0−0.78 (−1.23 to −0.30)
Jump height (m)Strong: 0.39 ± 0.05 Weak: 0.38 ± 0.061.040Weak evidence h10.33 (−0.13 to 0.78)
Jump momentum (kg.m/s−1)Strong: 220.44 ± 25.38 Weak: 231.57 ± 27.110.091Weak evidence h0−0.42 (−0.87 to 0.04)
mRSI (AU)Strong: 0.61 ± 0.12 Weak: 0.55 ± 0.095.202Moderate evidence h10.54 (0.08 to 1.00)
Relative force at minimum displacement (N/kg)Strong: 27.73 ± 3.67 Weak: 26.11 ± 4.131.819Weak evidence h10.41 (−0.05 to 0.86)
Relative average braking force (N/kg)Strong: 20.80 ± 2.39 Weak: 19.37 ± 2.656.017Moderate evidence h10.56 (0.10 to 1.02)
Relative average propulsive force (N/kg)Strong: 22.67 ± 2.28 Weak: 21.83 ± 2.381.272Weak evidence h10.36 (−0.10 to 0.81)
Relative peak propulsive force (N/kg)Strong: 28.53 ± 3.71 Weak: 27.21 ± 4.470.992Weak evidence h00.32 (−0.14 to 0.77)
Countermovement depth (m)Strong: −0.28 ± 0.06 Weak: −0.29 ± 0.070.346Weak evidence h00.10 (−0.35 to 0.55)
Time to take off (s)Strong: 0.66 ± 0.09 Weak: 0.70 ± 0.111.376Weak evidence h1−0.37 (−0.82 to 0.09)
95% CIs = 95% confidence intervals; BF10 = Bayes factor; h1 = supporting the hypothesis; h0 = supporting the null hypothesis.
Disclaimer/Publisher’s Note: The statements, opinions and data contained in all publications are solely those of the individual author(s) and contributor(s) and not of MDPI and/or the editor(s). MDPI and/or the editor(s) disclaim responsibility for any injury to people or property resulting from any ideas, methods, instructions or products referred to in the content.