Article

Reliability and Validity of the Articulation Motion Assessment System Using a Rotary Encoder

1
Graduate School of Health Science, Kyoto Tachibana University, Yamashina-ku, Kyoto 607-8175, Japan
2
CARETECH Plus, Nagoya 462-0847, Japan
3
Graduate School of Human Development and Environment, Kobe University, Kobe 657-8501, Japan
4
Faculty of Fiber Science and Engineering, Kyoto Institute of Technology University, Matsugasaki, Sakyo-ku, Kyoto 606-8585, Japan
5
Cognitive and Molecular Research Institute of Brain Diseases, Kurume University, Kurume, Fukuoka 830-0011, Japan
*
Author to whom correspondence should be addressed.
Biomechanics 2025, 5(1), 2; https://doi.org/10.3390/biomechanics5010002
Submission received: 18 October 2024 / Revised: 12 December 2024 / Accepted: 3 January 2025 / Published: 5 January 2025
(This article belongs to the Special Issue Inertial Sensor Assessment of Human Movement)

Abstract

:
This study aimed to validate the effectiveness of the Articulation Motion Assessment System (AMAS), a joint kinematic evaluation system, for clinical applications. AMAS enables synchronised measurement using neurophysiological indicators, overcoming laboratory setting limitations. We compared AMAS-based ankle joint kinematic evaluations, particularly the sagittal and frontal plane angles, with two-dimensional (2D) motion analysis to determine the validity and reliability of AMAS. Both AMAS and 2D motion analysis reliably detected significant differences in angles within the sagittal and frontal planes. Correlation analysis revealed a significant moderate-to-strong correlation between the AMAS and the conventional method of 2D motion analysis, proving the measurement validity of the AMAS (ρ = 0.53–0.77 for sagittal plane angles; ρ = 0.46–0.72 for frontal plane angles). The average root mean squared error (RMSE) was significantly lower in AMAS (10.90 ± 2.93° for sagittal plane angles; 13.44 ± 1.09° for frontal plane angles) than in the inertial sensor-based three-dimensional (3D) motion analysis. Reliability analysis revealed high reliability of measurements (intraclass correlation coefficients (ICC) ≥ 0.76). However, the Bland–Altman analysis identified a slightly lower fixed bias, which was observed as a characteristic of each measurement system. The AMAS accurately detects ankle joint angles without being constrained by measurement environment limitations. Synchronised measurements using neurophysiological indicators potentially contribute to understanding ankle joint control mechanisms and developing rehabilitation strategies.

1. Introduction

Human walking is a uniquely acquired upright bipedal gait used to complete daily activities [1]. Walking maintains functional independence [2] and quality of life [3]. Typical clinical evaluation indexes of gait performance include gait speed, which is affected by gait pattern [4,5]. The control of the ankle joint is essential in regulating changes in walking speed by altering the gait pattern; however, age-related neurodegeneration interferes with this motor control, causing motor impairments and other neurological symptoms [6,7,8]. Therefore, assessing ankle joint control is crucial for rehabilitation, including attaining or restoring walking ability. The ankle joint control coordinates the relative timing of ankle joint torque exertion and angular displacement during changes in walking velocity [9]. It encompasses the multifaceted elements of the so-called movement in kinematics and its underlying neural mechanisms in neurophysiology. This results in numerous degrees of freedom due to anatomical, biomechanical, and neurophysiological redundancies within the interaction between the body and environment [10,11]. However, evaluating ankle joint control has been limited to one aspect of biomechanics [12,13] and neurophysiology [14] using electroencephalography and electromyography. Therefore, analysing the motor control of the ankle joint should include correlating neural activity with motor behaviour to understand the precise objectives of the central nervous system and the mechanisms by which it modulates the final output of motor actions [15,16]. Therefore, motor control should be comprehensively understood based on a unified theoretical framework [17].
Muscle synergies [18] involve the cooperative activities of multiple muscles and degrading and controlling movement. Additionally, neuromuscular control of the lower extremity by the upper motor centre (hereafter referred to as ‘lower-extremity muscle control’) [19] interacts with the body and the environment and influences muscle synergies. Understanding that lower-extremity muscle is being controlled by a nervous system-based motor control mechanism [20,21] will help clarify the neural mechanisms of movement disorders to capture the control mechanisms of various motor components [22,23,24]. Cortical–muscular coherence, a neurophysiological index for capturing neural mechanisms in lower-extremity muscle control, correlates brain activity with muscle activity [19]. It is a biomarker for movement disorders used in rehabilitation therapy [25]. However, in clinical application, cortical–muscular coherence on the affected side must be classified accurately by determining its relationship to movements hampered by ageing or disability to better understand its impact on movement disorders [26]. Therefore, neurorehabilitation for ankle joint control warrants elucidating human walking ability using the neurophysiological indices of lower-extremity muscle control. Due to its anatomical structure, ankle motion is a simultaneous and complex multi-axis movement [27], with significant individual differences and some even result in altered motion on the forefoot plane [28,29]. Therefore, we hypothesised that a new lower-extremity muscle control evaluation method combining kinematic and neurophysiological indices may capture ankle joint control, which is essential for gait.
This hypothesis requires measurements of synchronous joint motion, muscular activity, and brain activity. Therefore, a new system is necessary to measure ankle joint control kinematic and conventional neurophysiological indices and determine the relationship between each index. Electroencephalography (EEG) and electromyography (EMG) use non-invasive scalp or skin electrodes for neurophysiological analysis, which can be monitored remotely [30]. A 3D motion analysis using optical motion capture with markers is the gold standard for the kinematic analysis of walking and lower limb motion [31], despite the 3D motion analysis being expensive, requiring dedicated space [32], being time-consuming, and highly dependent on the evaluator’s skill and experience. Since it involves manually identifying specific anatomical indicators captured by multiple videos [33], the measurement technique, environment, specifications, and number of cameras affect the accuracy of joint angle measurements [34]. A 2D motion analysis, which shows moderate correlation and high concordance with a 3D motion analysis [35], can help identify kinematics [36] and is used in foot kinematic analysis [37]. However, capturing optical motions using these markers requires video cameras and a restricted measurement environment.
Inertial sensor-based 3D motion analysers offer a simple method for outdoor measurement without a video camera. However, they have measurement errors due to magnetic field effects [38,39]. A measurement method without magnetic sensors has been proposed; however, the magnetic sensor information is required during initial calibration [40] with an environment free from magnetic field effects. Therefore, establishing an evaluation method integrating kinematic and neurophysiological indices remains challenging in terms of convenience and versatility in clinical applications.
We developed a rotary encoder-based ankle joint angle measurement system and an articulation motion assessment system (AMAS) to address the aforementioned clinical problems. This rotary encoder converts the mechanical displacement of rotation into an electrical signal and processes it to detect position, speed, and angle. It measures motor displacement in patients with Parkinson’s [41] and in wearable exoskeleton robots supporting human movement [42]. Without video cameras or magnetic sensors, this system analyses the kinematics of dorsiflexion, plantar flexion, inversion, and eversion of the ankle. Additionally, AMAS synchronises with existing bio-signal processing devices that capture neurophysiological indicators, such as EEG and EMG. Synchronised ankle kinematic and neurophysiological analysis facilitates exploring the indices of these functional couplings for motor control. This enables elucidating mechanisms of ankle joint control, which is essential for walking.
This study aimed to establish the ankle motion task as a simple method of motion analysis using the newly developed AMAS and confirmed the validity and reliability of this system via a comparative validation with existing evaluations.

2. Materials and Methods

2.1. Participants

This study included 14 participants (12 men and two women; age 22 ± 1 years; height 1.70 ± 0.06 m; weight 65.07 ± 14.81 kg) enrolled between December 2022 and February 2023. The inclusion criteria were an absence of cognitive problems, motor sensory dysfunction in the lower extremities, and visual impairment. Fourteen healthy adults (twelve males and two females) participated in and completed the entire study. This study was explained verbally and in writing, and the participants provided written informed consent before participating. This study was approved by the Research Ethics Committee of Kyoto Tachibana University (Approval No. 22-13) and conducted in accordance with the Declaration of Helsinki.

2.2. Protocol

Each measurement device was attached to the participant before any measurements were collected (Figure 1a). This study used AMAS, Inertial Measurement Unit (IMU), and a 2D motion analysis to measure voluntary movements in the sagittal and frontal plane of the ankle joint. Voluntary movements often face redundancy issues [11], making it challenging to capture motor control due to the many degrees of freedom involved, especially in free and coarse movements [43,44]. Analytical methods have been employed to minimise these degrees of freedom and constrain the analysis to a single plane in two dimensions [45,46,47]. A 2D motion analysis is a widely used technique in clinical practice as an alternative to a 3D motion analysis, a costly and environmentally restricted technique [35,36,37]. It is also suitable for validation because it increases the measurement’s simplicity and reproducibility by limiting it to a single plane [48]. The present study was designed to compare the developed AMAS with the IMU, which has been used in recent years, using a 2D motion analysis as a reference and an alternative method in biomechanics and rehabilitation.
All the tasks were performed with the participant sitting on a chair with a backrest one step above the floor. The measurement tasks consisted of automatic voluntary movements of dorsiflexion, plantar flexion, inversion, and eversion of the ankle on one side. They were performed in two ranges of motion, the maximum range of motion and the mild range of motion, according to the participant’s subjective judgement. For each automatic voluntary movement, the following conditions were assigned according to the participant’s subjective movement speed: ‘movement at a comfortable speed’ and ‘movement at a slow speed’. These conditions were set to verify whether it was possible to measure a wide range of participants with mild to severe disabilities since the range of joint motion was assumed to be smaller and patients with motor dysfunction exhibited slow movement. Each participant was required to complete five consecutive measurement tasks. The measurement task sequence was randomised using a random number table. Each measuring device was calibrated simultaneously in the midfoot position. Only the heel is in contact with the floor, while the area distal to the heel is raised off the ground to maintain freedom of ankle motion. Because biomechanical and neurophysiological studies have shown that ankle motion was not lateralised [49,50], the kicking foot was determined to be the dominant foot and was used as the measurement limb. All the participants’ dominant feet were determined to be the right foot. Measurements were taken using a video camera. The centre of the video camera lens was aligned to the centre of the foot; therefore, the height was adjusted using a tripod, and the camera was positioned 1 cm from the front and rear and 1 m from the right side.
The synchro light at the start of the IMU measurement and sensor mat light input to the AMAS were used to synchronise the data. The data’s starting point was then temporally synchronised by the sensor mat signal input after initiating the AMAS measurement, and the video camera captured the sensor mat light. Synchronously measured data were corrected to align the data points, where time-series data of joint angles were recorded over five consecutive trials. All data acquired were used in this analysis, corrected for the 50 Hz sampling rate.

2.3. Instrumentation
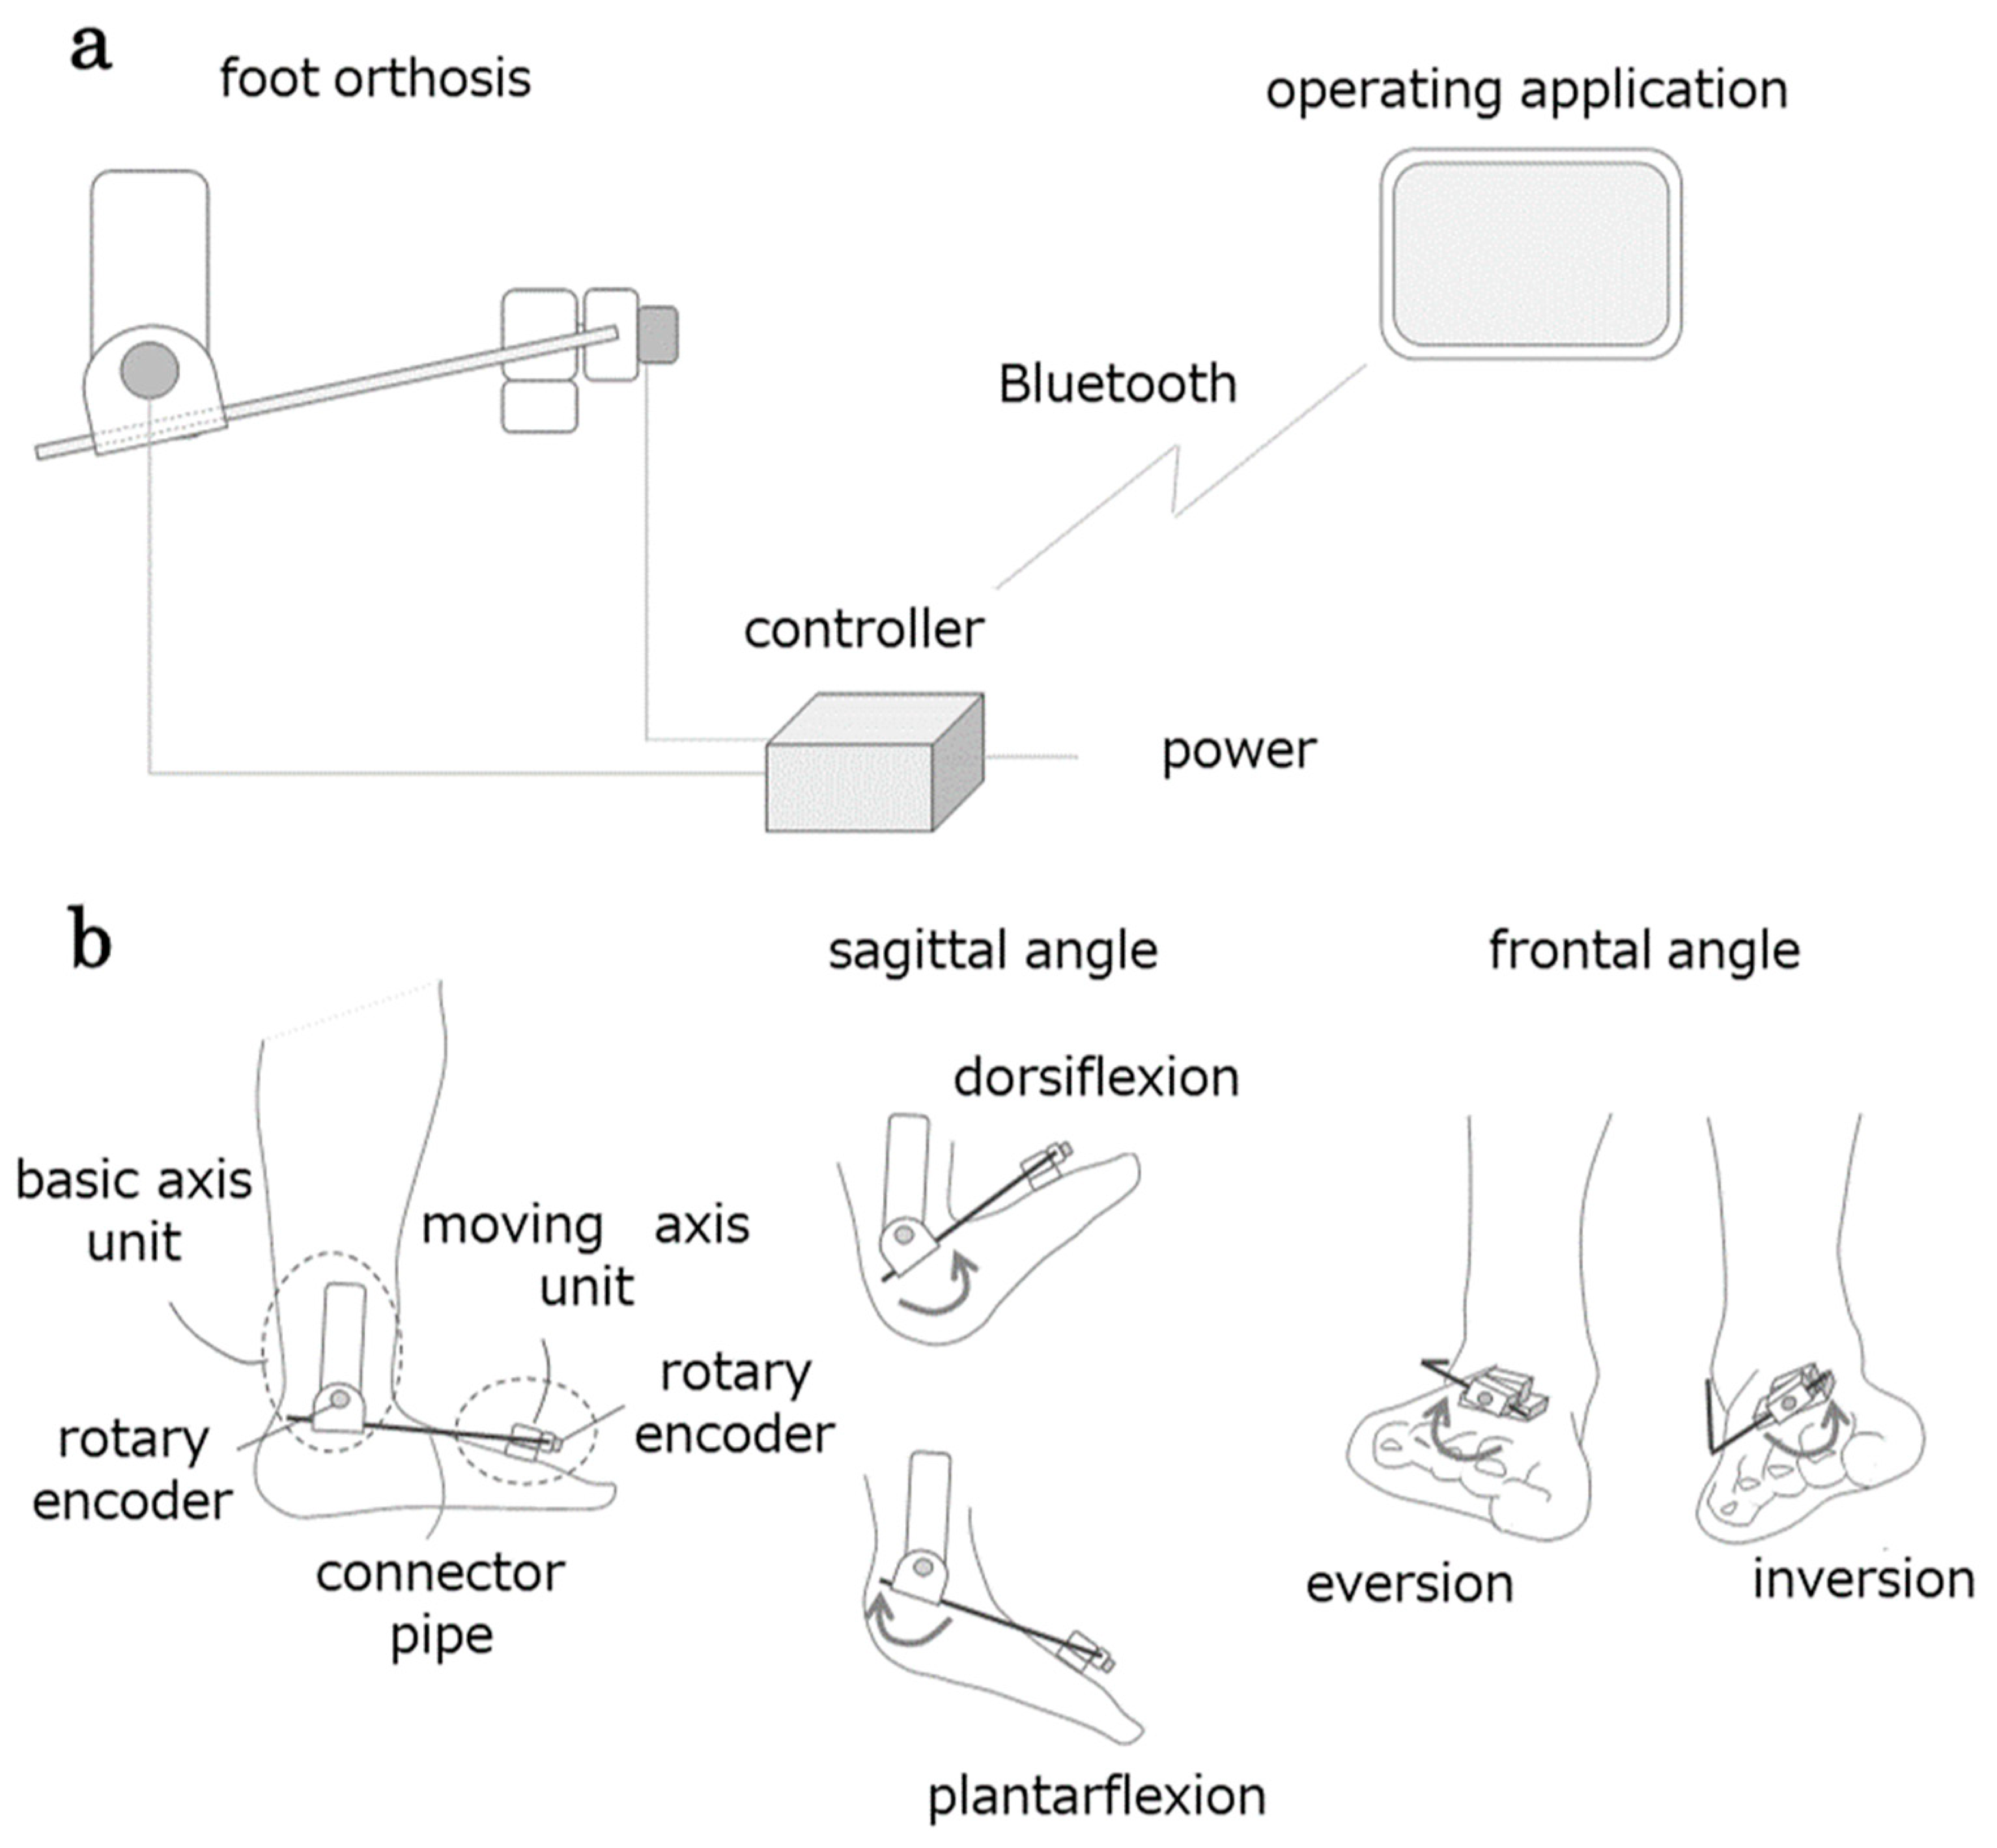
An AMAS, reflective marker, and IMU sensor were attached to one of the participant’s legs (Figure 1b).

2.3.1. AMAS

This joint angle measurement device simultaneously measures the plantarflexion/dorsiflexion and inversion/eversion angles during ankle joint motion and consists of an ankle joint orthosis, controller, and operation application (Figure 2a).
The ankle joint unit (Figure 2b) comprises two units with a built-in rotary encoder (manufactured by Supertech Electronic, Rixin Street, Chiayi City, Taiwan). One unit was attached to the outer lower leg, which served as the fundamental axis, and the other unit was attached to the dorsal foot (metatarsal head), which served as the moving axis.
A pipe connects both units, and plantar dorsiflexion movement is transmitted to the basic axis-side unit via the connecting pipe, causing the rotary encoder to rotate. Similarly, the basic shaft-side unit supported the connecting pipe, and the inversion/eversion motion of the ankle was transmitted to the rotary encoder of the mobile shaft-side unit. The controller transmits the signal from the rotary encoder, resulting in ankle motion, to the application (tablet). The application converts the signals into angles and displays the changes in plantarflexion/dorsiflexion and inversion/eversion angles in real time. The angle data were saved as a CSV file. The system simultaneously extracts the dorsiflexion/plantarflexion and inversion/eversion angles (degrees) of the ankle. The sampling rate was 50 Hz.

2.3.2. A 2D Motion Analysis

The reference motion capture was performed using the free 2D motion analysis software Image J Version 1.54h (NIH, Bethesda, MD, USA) for a 2D motion analysis with reflective markers. The following nine anatomical landmarks were selected according to previous studies: fibular head; tibial tuberosity; posterior medial surface of the lower leg; medial anterior surface of the medial and lateral phalanges; lateral malleolus; first and fifth metatarsal heads; posterior calcaneus (CAL); and, directly above that, CAL [51]. Reflective markers were attached to the skin using double-sided tape at selected landmarks. Two 30 bits per second digital high-definition video cameras (Panasonic, Tokyo, Japan) were used to capture images from the anterior and posterior sides for the frontal plane task and the right lateral side for the sagittal plane task during the measurement task. The video captured by the video camera was clipped at 30 Hz using the free video playback software GOM Player 2.3.104.5374 (Gretech, Soul, Korea). Each data point was then extracted and corrected every 0.14 s. The captured data were used to calculate joint angles from 2D coordinates using the free 2D motion analysis software ImageJ. The dorsiflexion/plantarflexion angle of the ankle in the sagittal plane is the angle between the straight line connecting the fibular head and external capsule and the straight line connecting the fifth metatarsal head and external capsule. The inversion/eversion angle of the ankle viewed from the anterior is the angle between the lower leg axis consisting of the centre of the medial and lateral phalanges and the tibial coarse surface and the plantar axis consisting of the first and fifth metatarsal heads, based on the ‘Methods for Indication and Measurement of Range of Motion of Joints’. The angle of inversion/eversion of the ankle viewed from the posterior is the angle between the line passing from the centre of the lower leg through the centre of the Achilles tendon and the line connecting the two markers at the rear of the heel.
The joint angles (degrees) were extracted from the 2D motion analysis of sagittal plane videos, with the dorsiflexion direction being positive and the plantar flexion direction being negative. The joint angles (degrees) were extracted from the 2D motion analysis of the frontal plane video, with the inversion direction being positive and the eversion direction being negative.

2.3.3. Inertial Measurement Unit (IMU)

Two MyoMotion sensors (Noraxon USA Inc., Scottsdale, AZ, USA) were used as IMU. The tibial sensor was wrapped around the lower leg using an attached belt, and the dorsal foot sensor was attached to double-sided tape. The sampling rate was 100 Hz.
From the IMU, dorsiflexion/plantarflexion and the ankle’s internal/external return angles (degrees) were extracted using sensors placed across the ankle joint.

2.4. Data Analysis

The statistical software SPSS (version 27.0; IBM Corporation, Armonk, NY, USA) was used for statistical analysis, where the p-value was set at 5%. Corresponding t-tests were used to determine the time (s) difference between comfortable and slow conditions in the measurement task. All data were subjected to the Kolmogorov–Smirnov test of normality. The feature extraction of the AMAS, the regression model’s performance, and the measurement method’s reliability and agreement were statistically validated [52]. For assessing validity, comparisons between conditions were performed using the mean angles measured by each system and analysed with paired t-tests. In addition, the correlation coefficients between the AMAS and IMU were calculated from the time-series data of joint angles of the 2D motion analysis. Root mean squared error (RMSE) (1) was calculated as the performance index of the regression model using Equation (1) [53]:
RMSE = ( X ( t ) Y ( t ) ) 2 n
X is the joint angle measured by the 2D motion analysis as the reference value, and Y is calculated by substituting the measured joint angle by AMAS or IMU, squaring the difference for n data and taking the square root.
The maximum value of each of the five repeatedly extracted angular data was used to evaluate reliability. A two-way mixed model by a single ICC examiner was used [54]. Bland–Altman analysis was performed to confirm the presence of systematic errors in the overall data to evaluate the agreement between the measurement methods and the characteristics of the measurement methods using the margin of error (LOA) (2) [55].
LOA = 1 n 𝒾 = 1 n d 𝒾   ± 1.96 × 1 n 1 𝒾 = 1 n ( d 𝒾 d ¯ ) 2

3. Results

The time taken for each condition in the measurement task was 9.22 ± 2.99 s (AVE ± SD) in the comfortable condition and 13.64 ± 6.60 s (AVE ± SD) in the slow condition, with a significant difference (t = −8.28, p < 0.001) and 95% confidence interval (CI): ([−5.49) to [−3.35]). It was confirmed that the joint angle data per measurement task extracted by each measuring device were non-normal using a normality test (p < 0.01).

3.1. Validity

3.1.1. Comparisons Between Conditions

In the sagittal plane angles, the comparison between the maximum and mild conditions revealed significant differences across all systems: a 2D motion analysis (t(13) = 9.523, p < 0.001); AMAS (t(13) = 10.498, p < 0.001); and IMU (t(13) = 2.708, p = 0.018). In contrast, for subjective motor speed, significant differences were found in a 2D motion analysis (t(13) = 4.142, p = 0.001) and AMAS (t(13) = 5.287, p < 0.001), but not in IMU (t(13) = 1.758, p = 0.102).
In the frontal plane angles, the comparison between the maximum and mild conditions showed significant differences in the 2D motion analysis performed from the front (t(13) = 6.597, p < 0.001), the 2D motion analysis performed from the back (t(13) = 4.661, p < 0.001), and AMAS (t(13) = 6.166, p < 0.001). However, no significant differences were observed in IMU (t(13) = 2.076, p = 0.058). In contrast, for subjective motor speed, significant differences were observed only in the 2D motion analysis performed from the back (t(13) = 2.816, p = 0.015). No significant differences were observed in the 2D motion analysis performed from the front (t(13) = 0.189, p = 0.853), AMAS (t(13) = −1.139, p = 0.275), or IMU (t(13) = 1.440, p = 0.173).

3.1.2. Criterion Validity

Spearman’s correlation analysis was used to compute the correlation coefficients between the 2D motion analysis, AMAS, and IMU. In the sagittal plane angle, the correlation coefficient for the AMAS was ρ = 0.45 to 0.72 (Table 1). In the frontal plane angle, the correlation coefficient with the 2D motion analysis performed from the front was ρ = 0.39 to 0.72 (Table 2), and that with the 2D motion analysis performed from behind was ρ = −0.05 to 0.52 (Table 3). The correlation coefficient with the 2D motion analyses performed from the sagittal and front indicated a more than moderate correlation, while those with the 2D motion analysis from behind indicated a low correlation.
In the sagittal plane angle, the correlation coefficient for the IMU was ρ = 0.16 to 0.54 (p < 0.01). In the frontal plane angle, the correlation coefficient with the 2D motion analysis performed from the front was ρ = −0.08 to 0.10, and that with the 2D motion analysis performed from behind was ρ = −0.09 to 0.35 (Table 3). The correlation coefficient with the 2D motion analysis performed from the sagittal indicated a more than low correlation, while those with the 2D motion analyses from the front and behind indicated low correlations.

3.1.3. Root Mean Squared Error (RMSE)

The mean and standard deviation of RMSEs with each measurement device (AMAS and IMU) for the 2D motion analysis were calculated. The RMSE of the AMAS in the sagittal and frontal plane angle was lower than that of the IMU (Table 1, Table 2, Table 3 and Table S1). The RMSEs of the AMAS and IMU significantly differed in the t-test (p < 0.01).

3.2. Reliability

The ICC [56] was used to evaluate reliability. Five repetitions were treated as a fixed effect, and the ICC (3,k) measured how consistently the same evaluator could measure the participant’s ankle movement angle under the same conditions. The angle measured per ankle movement task by the AMAS was above the ICC (3,1) of 0.76 under all conditions (Table 4).
Furthermore, ICC(3,5) was more significant than 0.91 under all conditions (Table 5).

3.3. Consistency

Bland–Altman plots were constructed between the AMAS and IMU against 2D motion analysis performed from the front with high values for the lateral and correlation coefficients in the ankle dorsiflexion/plantarflexion and inversion/eversion tasks. The vertical axis (DIFF) is the difference between the 2D motion analysis and AMAS or IMU, and the horizontal axis (MMEAN) is the mean between the 2D motion analysis and AMAS or IMU. LOA represents the range within which the difference between two measurements is acceptable as an error. Bland–Altman plots of sagittal plane angles in the dorsiflexion/plantarflexion task did not converge within the LOA for both instruments (Figure 3a).
The AMAS had a mean value of 1.26, with an LOA of 23.58 to −21.07. However, the IMU had a mean of −1.82 and an LOA of 30.00 to −36.54. The Bland–Altman plots of the frontal plane angle in the inversion/eversion task did not converge within the LOA for either instrument (Figure 3b).
The mean difference between the two systems for the AMAS was 0.18, and the LOA was from 26.70 to −26.33. However, the IMU had a mean of −9.54 for the difference between the two systems, and the LOA was from 50.48 to −69.56. T-tests were used to confirm the presence of fixed errors. For each task, the AMAS and IMU for the 2D motion analysis differed significantly, with a two-tailed test and a probability of significance of <1% and 95% CI: (1.02–1.49) for the AMAS and ([−2.19] to [−1.46]) for IMU for the sagittal plane angle and ([−0.09] to [0.46]) for the AMAS and ([−10.16] to [−8.91]) for IMU for the frontal plane angle. A fixed error was suggested by the absence of 0 in the 95% CI, except for the angle of the frontal plane by the AMAS. Regression analysis was performed to confirm the presence of proportional errors. The probability of significance of the regression equation, with DIFF as the dependent variable and MMEAN as the independent variable, was <1% for all tasks for both measurement methods, indicating no proportional error.

4. Discussion

We compared the reliability and validity of the AMAS in kinematic analysis with existing kinematic analysis assessment systems.
Comparisons between conditions demonstrated that the 2D Motion Analysis (both front and back) and AMAS consistently detected significant differences between most conditions. This indicates that both systems are generally reliable for evaluating sagittal and frontal plane angles. In particular, the 2D Motion Analysis and AMAS proved effective in detecting differences during maximum vs. mild conditions for both sagittal and frontal plane angles. In contrast, the IMU showed limitations in detecting differences, particularly in subjective motor speed and frontal plane angles. These limitations may stem from higher variability, lower resolution, or differences in data processing methods. As a result, the IMU appears less suited for identifying smaller differences or subtle changes, especially in subjective motor speed and frontal plane angle conditions. Criterion validation showed a significantly greater than moderate correlation between the AMAS and 2D motion analysis from the sagittal and anterior planes in all motor tasks and conditions without affecting joint angles and movement speed. The correlation coefficient values of 0–0.3, 0.3–0.7, and 0.7–1.0 represent a weak, moderate, and strong correlation, respectively [57]. Therefore, the present results revealed a more than moderate correlation. However, the IMU had no or a significantly low correlation with the 2D motion analysis. This suggests that the AMAS is more valid than the IMU for measuring the forefoot’s sagittal and forehead angles. Outliers and fixation errors may have caused the lower validity of the IMU over the AMAS, which may be due to the magnetic effects. Biases exist in measurement systems, such as IMU, with an improved agreement with marker-based optical motion capture in the sagittal plane. Still, there are more significant errors in non-sagittal planes [58], and the differences vary among participants [59]. Standard wearable sensors’ position, calibration method, and measurement algorithm affect accuracy [60]. Electromagnetic interference makes IMUs unreliable indoors [61]. Therefore, measurements should be collected in a magnetically neutral environment [62]. This study was conducted in a laboratory, and the results are consistent with previous studies. Our findings show that AMAS is a highly versatile system for clinical use.
Regarding the regression model performance index validation results, the mean RMSE of the AMAS based on the 2D motion analysis was significantly lower than that of the IMU. However, the mean RMSE of the AMAS was 10.90° ± 2.93° for the sagittal angle and 13.44 ± 1.09° for the frontal angle. Each participant’s RMSE was 4.37–15.88° for the sagittal angle and 13.07–20.97° for the frontal angle, suggesting that significant differences in measurement angles were observed and errors were introduced. IMU kinematics should be interpreted cautiously [58,59] as the IMU must improve consistency and accuracy to replace marker-based optical 3D motion analysers, considered the gold standard. Our results confirm the limitations of joint kinematics analysis using IMUs owing to the magnetic effects.
Regarding the results of the reliability validation, the AMAS’ reliability of sagittal and forehead angles had an ICC value of ≥0.76 for all motor tasks and conditions. This suggests that the reliability of measurements by the AMAS is higher than that by the conventional method [56]. Because obtaining kinematic data from individuals using the 3D motion analysis with markers, the gold standard method, is costly and complex, there is growing interest in a simple, inexpensive system with no local limitations [63]. The joint angles of ankle motion measured by this system are comparable to those obtained using previous measurement methods. This system has been verified to be a highly convenient measurement device because it solves the problem of environmental restrictions. The system’s rotary encoder is a reliable and accurate sensor for measuring limb angles [64,65]; however, it is often attached to a rigid mechanical attachment on the exoskeleton and is, therefore, unsuitable as a wearable device [66]. Therefore, the external dimensions of this system were designed to be compact enough to be worn on the foot, increasing its versatility as a wearable device. However, regarding the results of the agreement validation, the Bland–Altman analysis showed that the differences between the 2D motion analysis and each of the measurement devices did not converge within the LOA, with no proportional error but a fixed error being found. The differences between the 2D motion analysis and AMAS were plotted upward in the sagittal and forehead planes, indicating that the 2D motion analysis tended to measure at lower values than those associated with the AMAS. However, the difference between 2D motion analysis and IMU was plotted downward in the sagittal and forehead planes, suggesting that IMU measurements tended to be higher than the 2D motion analysis measurements. The clinically acceptable joint angle error in gait motion analysis is <5° RMSE [67]. In the present study, the RMSE exceeded the clinically significant limit, although it differed from the gait motion. This raises the concern that while ankle joint angle measurement by AMAS can be used as a primary indicator, there may be some errors when comparing the ankle motion analysis data from other motion analysis devices.
A multidisciplinary team in collaboration with clinicians in the field is necessary to provide a diverse perspective [68]. The AMAS developed in our study measures ankle motion from two aspects, the sagittal plane and anterior frontal plane, and its high validity and high reliability have been verified using the measurement results from the 2D motion analysis. Additionally, the velocity of the ankle motion did not affect the system’s angular measurement. Poor joint angle changes, decreased velocity in various movements, and abnormal compensatory movements accompany movement in post-stroke patients. Kinematic movement analysis results are essential for distinguishing between motor recovery and compensatory movement patterns [69,70]. Therefore, validation is needed in the rehabilitation field in patients presenting with various motor impairments, ranging from mild to severe.
In summary, AMAS is an evaluation system specialising in ankle joint motion control. Further validation can be applied to other joints and daily life activities. The development of AMAS is anticipated to contribute to the realisation of a multidimensional assessment of motor control in biomechanics and rehabilitation. It needs to be validated in other joints to demonstrate its usefulness as a wearable system.
The present study has several limitations. One limitation is that the results of this study measure non-weight-bearing motion that may not be valid or reliable during walking. Therefore, further analysis of actual walking motion measurements may be necessary before concluding that AMAS can measure motion under load, such as walking motion. Another limitation is that the subjects of this study were all healthy. The task of this study was to set up a condition of slow movement and minimum range of motion, assuming a patient, but we did not measure an actual patient. Therefore, further analysis of patients presenting with various movement disorders may be warranted in the future.

5. Conclusions

Because of convenience, versatility, and the ability to synchronously measure various biological signals, the AMAS was developed to assess ankle joint control, which is essential for walking in rehabilitation settings and real-life environments. The occurrence of a fixation error suggests room for improvement in this system. With future enhancements against errors, clinical evaluation using this system may help elucidate the mechanism of ankle joint control and develop individualised and optimised rehabilitation.

6. Practical Applications

The importance of capturing such quantitative analysis of human movement in free daily activities has been highlighted [71], and the AMAS has the potential to be applied to the evaluation of ankle joint motor control in various activities of daily living (ADLs). For example, it could assess movements in which ankle joint control is crucial, such as ascending and descending stairs, rising from a chair, and crossing an obstacle. However, it is necessary to optimise the measurement protocols and consider precautions for data interpretation according to the characteristics of each movement.

7. Patents

Japanese Patent Application No. 2023-67115.

Supplementary Materials

The following supporting information can be downloaded at https://www.mdpi.com/article/10.3390/biomechanics5010002/s1, Table S1. Spearman’s correlation coefficient, RMSE values per participant. The correlation coefficient (ρ) and RMSE (°) for each participant from A to N are shown.

Author Contributions

H.I. and T.K. conceived and conceptualised this study. T.K. and H.Y. collected the data. H.I. designed and performed the statistical analysis. H.I. contributed to the interpretation of the results. H.I. prepared the original manuscript. T.K. oversaw the conduct of this study. H.Y., H.N., M.I., K.K., K.M., and T.K. were responsible for the development of this study. All authors reviewed this manuscript and revised it critically for intellectual content. All authors have read and agreed to the published version of the manuscript.

Funding

This research received no external funding.

Institutional Review Board Statement

This study was conducted in accordance with the Declaration of Helsinki and approved by the Institutional Review Board (or Ethics Committee) of Kyoto Tachibana University (Approval No. 22-13, 27 June 2022).

Informed Consent Statement

Written informed consent has been obtained from the patients to publish this paper.

Data Availability Statement

The authors will make the raw data supporting this article’s conclusions available upon request.

Acknowledgments

I would like to thank T.K. for valuable discussions. I am grateful to H.Y., H.N., M.I., K.K., K.M., and T.K. for their assistance with the numerical simulations and for carefully proofreading this manuscript.

Conflicts of Interest

The authors declare no conflicts of interest.

References

  1. Schmitt, D. Insights into the evolution of human bipedalism from experimental studies of humans and other primates. J. Exp. Biol. 2003, 206, 1437–1448. [Google Scholar] [CrossRef] [PubMed]
  2. Mirelman, A.; Shema, S.; Maidan, I.; Hausdorff, J.M. Gait. Handb. Clin. Neurol. 2018, 159, 119–134. [Google Scholar] [CrossRef]
  3. Baker, J.M. Gait disorders. Am. J. Med. 2018, 131, 602–607. [Google Scholar] [CrossRef]
  4. Perry, J.; Garrett, M.; Gronley, J.K.; Mulroy, S.J. Classification of walking handicap in the stroke population. Stroke 1995, 26, 982–989. [Google Scholar] [CrossRef] [PubMed]
  5. Schmid, A.; Duncan, P.W.; Studenski, S.; Lai, S.M.; Richards, L.; Perera, S.; Wu, S.S. Improvements in speed-based gait classifications are meaningful. Stroke 2007, 38, 2096–2100. [Google Scholar] [CrossRef] [PubMed]
  6. Graf, A.; Judge, J.O.; Õunpuu, S.; Thelen, D.G. The effect of walking speed on lower-extremity joint powers among elderly adults who exhibit low physical performance. Arch. Phys. Med. Rehabil. 2005, 86, 2177–2183. [Google Scholar] [CrossRef] [PubMed]
  7. Lamontagne, A.; Richards, C.L.; Malouin, F. Coactivation during gait as an adaptive behavior after stroke. J. Electromyogr. Kinesiol. 2000, 10, 407–415. [Google Scholar] [CrossRef] [PubMed]
  8. Allen, J.L.; Kautz, S.A.; Neptune, R.R. The influence of merged muscle excitation modules on post-stroke hemiparetic walking performance. Clin. Biomech. 2013, 28, 697–704. [Google Scholar] [CrossRef] [PubMed]
  9. Wade, L.; Birch, J.; Farris, D.J. Walking with increasing acceleration is achieved by tuning ankle torque onset timing and rate of torque development. J. R. Soc. Interface 2022, 19, 20220035. [Google Scholar] [CrossRef]
  10. Morasso, P. A Vexing question in motor control: The degrees of freedom problem. Front. Bioeng. Biotechnol. 2022, 9, 783501. [Google Scholar] [CrossRef]
  11. Bernstein, N.A. The Coordination and Regulation of Movements; Pergamon Press: London, UK, 1967; pp. 143–168. [Google Scholar]
  12. Jenkyn, T.R.; Anas, K.; Nichol, A. Foot segment kinematics during normal walking using a multisegment model of the foot and ankle complex. J. Biomech. Eng. 2009, 131, 034504. [Google Scholar] [CrossRef]
  13. Farris, D.J.; Kelly, L.A.; Cresswell, A.G.; Lichtwark, G.A. The functional importance of human foot muscles for bipedal locomotion. Proc. Natl. Acad. Sci. USA 2019, 116, 1645–1650. [Google Scholar] [CrossRef] [PubMed]
  14. Yokoyama, H.; Kaneko, N.; Ogawa, T.; Kawashima, N.; Watanabe, K.; Nakazawa, K. Cortical correlates of locomotor muscle synergy activation in humans: An electroencephalographic decoding study. iScience 2019, 15, 623–639. [Google Scholar] [CrossRef]
  15. Churchland, M.M.; Cunningham, J.P.; Kaufman, M.T.; Foster, J.D.; Nuyujukian, P.; Ryu, S.I.; Shenoy, K.V. Neural population dynamics during reaching. Nature 2012, 487, 51–56. [Google Scholar] [CrossRef] [PubMed]
  16. Suresh, A.K.; Goodman, J.M.; Okorokova, E.V.; Kaufman, M.; Hatsopoulos, N.G.; Bensmaia, S.J.; Anatomy; Biology, Q.; Behavior, H.; States, U. Neural population dynamics in motor cortex are different for reach and grasp. eLife 2020, 9, 58848. [Google Scholar] [CrossRef] [PubMed]
  17. McLoughlin, J. Ten guiding principles for movement training in neurorehabilitation. OpenPhysio J. 2020, 10, 1–17. [Google Scholar] [CrossRef]
  18. Mehrabi, N.; Schwartz, M.H.; Steele, K.M. Can altered muscle synergies control unimpaired gait? J. Biomech. 2019, 90, 84–91. [Google Scholar] [CrossRef]
  19. Petersen, T.H.; Willerslev-Olsen, M.; Conway, B.A.; Nielsen, J.B. The motor cortex drives the muscles during walking in human subjects. J. Physiol. 2012, 590, 2443–2452. [Google Scholar] [CrossRef]
  20. Song, S.; Desai, R.; Geyer, H. Integration of an adaptive swing control into a neuromuscular human walking model. In Proceedings of the 2013 35th Annual International Conference of the IEEE Engineering in Medicine and Biology Society (EMBC), Osaka, Japan, 3–7 July 2013; pp. 4915–4918. [Google Scholar] [CrossRef]
  21. Akazawa, K.; Fuj, K. Theory of muscle contraction and motor control. Adv. Robot. 1986, 1, 379–390. [Google Scholar] [CrossRef]
  22. Takei, T.; Lomber, S.G.; Cook, D.J.; Scott, S.H. Transient deactivation of dorsal premotor cortex or parietal area 5 impairs feedback control of the limb in macaques. Curr. Biol. 2021, 31, 1476–1487.e5. [Google Scholar] [CrossRef]
  23. Minassian, K.; Hofstoetter, U.S.; Dzeladini, F.; Guertin, P.A.; Ijspeert, A. The human central pattern generator for locomotion: Does it exist and contribute to walking? Neuroscientist 2017, 23, 649–663. [Google Scholar] [CrossRef]
  24. Leiras, R.; Cregg, J.M.; Kiehn, O. Brainstem circuits for locomotion. Annu. Rev. Neurosci. 2022, 45, 63–85. [Google Scholar] [CrossRef]
  25. Krauth, R.; Schwertner, J.; Vogt, S.; Lindquist, S.; Sailer, M.; Sickert, A.; Lamprecht, J.; Perdikis, S.; Corbet, T.; Millán, J.d.R.; et al. Cortico-muscular coherence is reduced acutely post-stroke and increases bilaterally during motor recovery: A pilot study. Front. Neurol. 2019, 10, 126. [Google Scholar] [CrossRef]
  26. Liu, J.; Sheng, Y.; Liu, H. Corticomuscular coherence and its applications: A review. Front. Hum. Neurosci. 2019, 13, 100. [Google Scholar] [CrossRef]
  27. Brockett, C.L.; Chapman, G.J. Biomechanics of the ankle. Orthop. Trauma 2016, 30, 232–238. [Google Scholar] [CrossRef]
  28. Kim, H.; Cho, J.-E.; Seo, K.-J.; Lee, J. Bilateral ankle deformities affects gait kinematics in chronic stroke patients. Front. Neurol. 2023, 14, 1078064. [Google Scholar] [CrossRef] [PubMed]
  29. Hong, W.-H.; Wang, C.-M.; Chen, C.-K.; Wu, K.P.-H.; Kang, C.-F.; Tang, S.F. Kinematic features of rear-foot motion using anterior and posterior ankle-foot orthoses in stroke patients with hemiplegic gait. Arch. Phys. Med. Rehabil. 2010, 91, 1862–1868. [Google Scholar] [CrossRef]
  30. Palumbo, A.; Vizza, P.; Calabrese, B.; Ielpo, N. Biopotential signal monitoring systems in rehabilitation: A review. Sensors 2021, 21, 7172. [Google Scholar] [CrossRef]
  31. Munro, A.; Herrington, L.; Carolan, M. Reliability of 2-dimensional video assessment of frontal-plane dynamic knee valgus during common athletic screening tasks. J. Sport Rehabil. 2012, 21, 7–11. [Google Scholar] [CrossRef]
  32. Schurr, S.A.; Marshall, A.N.; Resch, J.E.; A Saliba, S. Two-dimensional video analysis is comparable to 3D motion capture in lower extremity movement assessment. Int. J. Sports Phys. Ther. 2017, 12, 163–172. [Google Scholar]
  33. Corazza, S.; Mündermann, L.; Gambaretto, E.; Ferrigno, G.; Andriacchi, T.P. Markerless motion capture through visual hull, articulated ICP and subject specific model generation. Int. J. Comput. Vis. 2010, 87, 156–169. [Google Scholar] [CrossRef]
  34. Simon, S.R. Quantification of human motion: Gait analysis—Benefits and limitations to its application to clinical problems. J. Biomech. 2004, 37, 1869–1880. [Google Scholar] [CrossRef]
  35. Michelini, A.; Eshraghi, A.; Andrysek, J. Two-dimensional video gait analysis: A systematic review of reliability, validity, and best practice considerations. Prosthet. Orthot. Int. 2020, 44, 245–262. [Google Scholar] [CrossRef] [PubMed]
  36. Dingenen, B.; Malliaras, P.; Janssen, T.; Ceyssens, L.; Vanelderen, R.; Barton, C.J. Two-dimensional video analysis can discriminate differences in running kinematics between recreational runners with and without running-related knee injury. Phys. Ther. Sport 2019, 38, 184–191. [Google Scholar] [CrossRef] [PubMed]
  37. Cordova, M.L.; Dorrough, J.L.; Kious, K.; Ingersoll, C.D.; Merrick, M.A. Prophylactic ankle bracing reduces rearfoot motion during sudden inversion. Scand. J. Med. Sci. Sports 2007, 17, 216–222. [Google Scholar] [CrossRef] [PubMed]
  38. Laidig, D.; Schauer, T.; Seel, T. Exploiting kinematic constraints to compensate magnetic disturbances when calcu-lating joint angles of approximate hinge joints from orientation estimates of inertial sensors. In Proceedings of the 2017 International Conference on Rehabilitation Robotics (ICORR), London, UK, 17–20 July 2017; pp. 971–976. [Google Scholar] [CrossRef]
  39. McGrath, T.; Stirling, L. Body-Worn IMU-Based Human hip and knee kinematics estimation during treadmill walking. Sensors 2022, 22, 2544. [Google Scholar] [CrossRef]
  40. Taetz, B.; Bleser, G.; Miezal, M. Towards self-calibrating inertial body motion capture. Int. Conf. Inf. Fusion 2016, 19, 1751–1759. [Google Scholar]
  41. Chan, P.Y.; Ripin, Z.M.; Halim, S.A.; Tharakan, J.; Muzaimi, M.; Ng, K.S.; Kamarudin, M.I.; Eow, G.B.; Hor, J.Y.; Tan, K.; et al. An in-laboratory validity and reliability tested system for quantifying hand-arm tremor in motions. IEEE Trans. Neural Syst. Rehabil. Eng. 2018, 26, 460–467. [Google Scholar] [CrossRef]
  42. Jaramillo, I.E.; Jeong, J.G.; Lopez, P.R.; Lee, C.-H.; Kang, D.-Y.; Ha, T.-J.; Oh, J.-H.; Jung, H.; Lee, J.H.; Lee, W.H.; et al. Real-time human activity recognition with IMU and encoder sensors in wearable exoskeleton robot via deep learning networks. Sensors 2022, 22, 9690. [Google Scholar] [CrossRef]
  43. Yang, J.-F.; Scholz, J.P. Learning a throwing task is associated with differential changes in the use of motor abundance. Exp. Brain Res. 2005, 163, 137–158. [Google Scholar] [CrossRef] [PubMed]
  44. Tseng, Y.-W.; Scholz, J.P.; Schöner, G.; Hotchkiss, L. Effect of accuracy constraint on joint coordination during pointing movements. Exp. Brain Res. 2003, 149, 276–288. [Google Scholar] [CrossRef]
  45. Gielen, C.; van Bolhuis, B.; Theeuwen, M. On the control of biologically and kinematically redundant manipulators. Hum. Mov. Sci. 1995, 14, 487–509. [Google Scholar] [CrossRef]
  46. Koster, B.; Deuschl, G.; Lauk, M.; Timmer, J.; Guschlbauer, B.; Lücking, C.H. Essential tremor and cerebellar dysfunction: Abnormal ballistic movements. J. Neurol. Neurosurg. Psychiatry 2002, 73, 400–405. [Google Scholar] [CrossRef] [PubMed]
  47. Matsugi, A.; Nishishita, S.; Bando, K.; Kikuchi, Y.; Tsujimoto, K.; Tanabe, Y.; Yoshida, N.; Tanaka, H.; Douchi, S.; Honda, T.; et al. Excessive excitability of inhibitory cortical circuit and disturbance of ballistic targeting movement in degenerative cerebellar ataxia. Sci. Rep. 2023, 13, 13917. [Google Scholar] [CrossRef]
  48. Mihcin, S. Simultaneous validation of wearable motion capture system for lower body applications: Over single plane range of motion (ROM) and gait activities. Biomed. Eng. Biomed. Tech. 2022, 67, 185–199. [Google Scholar] [CrossRef] [PubMed]
  49. McCurdy, K.; Langford, G. Comparison of unilateral squat strength between the dominant and non-dominant leg in men and women. J. Sports Sci. Med. 2005, 4, 153–159. [Google Scholar] [PubMed]
  50. Kapreli, E.; Athanasopoulos, S.; Papathanasiou, M.; Van Hecke, P.; Strimpakos, N.; Gouliamos, A.; Peeters, R.; Sunaert, S. Lateralization of brain activity during lower limb joints movement. An fMRI study. NeuroImage 2006, 32, 1709–1721. [Google Scholar] [CrossRef] [PubMed]
  51. Mousavi, S.H.; Hijmans, J.M.; Moeini, F.; Rajabi, R.; Ferber, R.; van der Worp, H.; Zwerver, J. Validity and reliability of a smartphone motion analysis app for lower limb kinematics during treadmill running. Phys. Ther. Sport 2020, 43, 27–35. [Google Scholar] [CrossRef]
  52. Choo, C.Z.Y.; Chow, J.Y.; Komar, J. Validation of the Perception Neuron system for full-body motion capture. PLoS ONE 2022, 17, e0262730. [Google Scholar] [CrossRef] [PubMed]
  53. Mould, R.F. Introductory Medical Statistics, 3rd ed.; Boca Raton: London, UK, 1998; pp. 177–194. [Google Scholar]
  54. Koo, T.K.; Li, M.Y. A guideline of selecting and reporting intraclass correlation coefficients for reliability research. J. Chiropr. Med. 2016, 15, 155–163. [Google Scholar] [CrossRef]
  55. Bland, J.M.; Altman, D.G. Statistical methods for assessing agreement between two methods of clinical measurement. Lancet 1986, 1, 307–310. [Google Scholar] [CrossRef]
  56. Brookshaw, M.; Sexton, A.; McGibbon, C.A. Reliability and validity of a novel wearable device for measuring elbow strength. Sensors 2020, 20, 3412. [Google Scholar] [CrossRef]
  57. Cohen, J. Statistical Power Analysis for the Behavioral Sciences, 2nd ed.; Routledge Academic, Lawrence Erlbaum Associates: New York, NY, USA, 1988; pp. 75–105. [Google Scholar]
  58. Heuvelmans, P.; Benjaminse, A.; Bolt, R.; Baumeister, J.; Otten, E.; Gokeler, A. Concurrent validation of the Noraxon MyoMotion wearable inertial sensors in change-of-direction and jump-landing tasks. Sports Biomech. 2022, 3, 1–16. [Google Scholar] [CrossRef] [PubMed]
  59. Rekant, J.; Rothenberger, S.; Chambers, A. Inertial measurement unit-based motion capture to replace camera-based systems for assessing gait in healthy young adults: Proceed with caution. Meas. Sensors 2022, 23, 100396. [Google Scholar] [CrossRef] [PubMed]
  60. Walmsley, C.P.; Williams, S.A.; Grisbrook, T.; Elliott, C.; Imms, C.; Campbell, A. Measurement of upper limb range of motion using wearable sensors: A systematic review. Sports Med. Open 2018, 4, 53. [Google Scholar] [CrossRef] [PubMed]
  61. McGrath, T.; Stirling, L. Body-Worn IMU Human skeletal pose estimation using a factor graph-based optimization framework. Sensors 2020, 20, 6887. [Google Scholar] [CrossRef]
  62. de Vries, W.; Veeger, H.; Baten, C.; van der Helm, F. Magnetic distortion in motion labs, implications for validating inertial magnetic sensors. Gait Posture 2009, 29, 535–541. [Google Scholar] [CrossRef]
  63. Sprager, S.; Juric, M.B. Inertial sensor-based gait recognition: A review. Sensors 2015, 15, 22089–22127. [Google Scholar] [CrossRef]
  64. Freeman, C.T.; Rogers, E.; Hughes, A.-M.; Burridge, J.H.; Meadmore, K.L. Iterative learning control in health care: Electrical stimulation and robotic-assisted upper-limb stroke rehabilitation. IEEE Control. Syst. 2012, 32, 18–43. [Google Scholar] [CrossRef]
  65. Sharma, N.; Stegath, K.; Gregory, C.M.; Dixon, W.E. Nonlinear neuromuscular electrical stimulation tracking control of a human limb. IEEE Trans. Neural Syst. Rehabil. Eng. 2009, 17, 576–584. [Google Scholar] [CrossRef]
  66. Allen, M.; Zhong, Q.; Kirsch, N.; Dani, A.; Clark, W.W.; Sharma, N. A nonlinear dynamics-based estimator for functional electrical stimulation: Preliminary results from lower-leg extension experiments. IEEE Trans. Neural Syst. Rehabil. Eng. 2017, 25, 2365–2374. [Google Scholar] [CrossRef]
  67. McGinley, J.L.; Baker, R.; Wolfe, R.; Morris, M.E. The reliability of three-dimensional kinematic gait measurements: A systematic review. Gait Posture 2009, 29, 360–369. [Google Scholar] [CrossRef] [PubMed]
  68. Kwakkel, G.; Van Wegen, E.; Burridge, J.; Winstein, C.; van Dokkum, L.; Murphy, M.A.; Levin, M.; Krakauer, J. Standardised measurement of quality of upper limb movement after stroke: Consensus-based core recommendations from the Second Stroke Recovery and Rehabilitation Roundtable. Int. J. Stroke 2019, 14, 783–791. [Google Scholar] [CrossRef]
  69. Levin, M.F.; Kleim, J.A.; Wolf, S.L. What do motor “recovery” and “compensation” mean in patients following stroke? Neurorehabilit. Neural Repair 2008, 23, 313–319. [Google Scholar] [CrossRef]
  70. Bernhardt, J.; Hayward, K.S.; Kwakkel, G.; Ward, N.S.; Wolf, S.L.; Borschmann, K.; Krakauer, J.W.; Boyd, L.A.; Carmichael, S.T.; Corbett, D.; et al. Agreed definitions and a shared vision for new standards in stroke recovery research: The Stroke Recovery and Rehabilitation Roundtable taskforce. Int. J. Stroke 2017, 12, 444–450. [Google Scholar] [CrossRef] [PubMed]
  71. Maura, R.M.; Parra, S.R.; Stevens, R.E.; Weeks, D.L.; Wolbrecht, E.T.; Perry, J.C. Literature review of stroke assessment for upper-extremity physical function via EEG, EMG, kinematic, and kinetic measurements and their reliability. J. Neuroeng. Rehabil. 2023, 20, 21. [Google Scholar] [CrossRef]
Figure 1. Experimental view. Video cameras were set up to capture the participant’s right foot from the side, front, and rear, along with the synchro light (a). An actual magnified image is shown in (b). The AMAS and IMU are attached to the right lower extremity with a belt, and nine reflective markers are attached to the designated anatomical landmarks using double-sided tape.
Biomechanics 05 00002 g001
Figure 2. Configuration of the AMAS. The AMAS comprises three components: a foot orthosis, a controller wirelessly connected to the operating application, and foot orthosis (a). The foot orthosis measures the angles of the sagittal and frontal planes of the foot using a unit incorporating a rotary encoder on the basic axis and moving axis side (b).
Biomechanics 05 00002 g002
Figure 3. Bland–Altman plot. (a) The Bland–Altman plot showing the dorsiflexion and plantarflexion angles measured using the AMAS and IMU under all conditions. The solid line indicates 0, and the upper and lower dashed lines indicate LOA. (b) The Bland–Altman plot showing the ankle inversion and eversion angles measured by the AMAS and IMU under all conditions.
Biomechanics 05 00002 g003
Table 1. Spearman’s correlation coefficients and RMSE values between systems for sagittal.
Subjective Motor Speed
ComfortableSlow
ActivityConditionsSystemρRMSEρRMSEρRMSE
DorsiflexionmaximumAMAS0.69 **9.220.65 **9.470.72 **9.04
IMU0.44 **17.30.41 **22.230.47 **12.73
mildAMAS0.54 **7.290.50 **7.350.58 **7.25
IMU0.35 **10.190.28 **10.020.40 **10.31
PlantarflexionmaximumAMAS0.53 **16.230.66 **14.320.45 **17.33
IMU0.47 **21.260.38 **22.340.54 **20.55
mildAMAS0.53 **9.950.59 **9.970.48 **9.94
IMU0.16 **19.660.17 **17.120.16 **21.23
** p < 0.01.
Table 2. Spearman’s correlation coefficients and RMSE values between systems for 2D motion analysis viewed from the front.
Subjective Motor Speed
ComfortableSlow
ActivityConditionsSystemρRMSEρRMSEρRMSE
InversionmaximumAMAS0.69 **14.490.72 **14.640.68 **14.38
IMU0.0228.82−0.08 *27.940.08 **29.42
mildAMAS0.55 **13.110.63 **12.290.49 **13.63
IMU0.0328.43−0.07 *29.780.10 **27.49
EversionmaximumAMAS0.46 **14.740.39 **15.290.52 **14.31
IMU0.0135.70.0138.23033.72
mildAMAS0.50 **11.190.55 **11.150.46 **11.22
IMU−0.06 *34.96−0.0241.86−0.07 *28.77
* p < 0.05, ** p < 0.01.
Table 3. Spearman’s correlation coefficients and RMSE values between systems for 2D motion analysis viewed from behind.
Subjective Motor Speed
ComfortableSlow
ActivityConditionsSystemρRMSEρRMSEρRMSE
InversionmaximumAMAS0.48 **17.460.50 **17.80.48 **17.22
IMU0.18 **24.690.19 **22.440.18 **26.16
mildAMAS0.49 **12.890.52 **12.750.49 **12.98
IMU0.31 **26.320.23 **270.35 **25.85
EversionmaximumAMAS0.07 **12.020.0412.50.11 **11.65
IMU0.0227.490.13 **28.7−0.09 **26.55
mildAMAS−0.05 *11.83−0.07 *12.49−0.0411.32
IMU0.0428.170.11 **34.04−0.0322.84
* p < 0.05, ** p < 0.01.
Table 4. Reliability results ICC (3,1).
ComfortableSlow
ICC 95% CIICC 95% CI
LowerUpper LowerUpper
Dorsiflexionmaximum0.83**0.680.930.98**0.950.99
mild0.95**0.890.980.93**0.870.98
Plantarflexionmaximum0.93**0.850.970.87**0.750.95
mild0.86**0.730.940.76**0.580.9
Inversionmaximum0.96**0.910.980.98**0.960.99
mild0.97**0.940.990.97**0.940.99
Eversionmaximum0.76**0.580.90.86**0.730.95
mild0.9**0.80.960.94**0.880.98
** p < 0.01.
Table 5. Reliability results ICC (3,5).
ComfortableSlow
ICC 95% CIICC 95% CI
LowerUpper LowerUpper
Dorsiflexionmaximum0.96**0.910.991**0.991
mild0.99**0.9810.99**0.970.99
Plantarflexionmaximum0.98**0.970.990.97**0.940.99
mild0.97**0.930.990.94**0.870.98
Inversionmaximum0.99**0.9811**0.991
mild0.99**0.9910.99**0.991
Eversionmaximum0.94**0.870.980.97**0.930.99
mild0.98**0.950.990.99**0.971
** p < 0.01.
Disclaimer/Publisher’s Note: The statements, opinions and data contained in all publications are solely those of the individual author(s) and contributor(s) and not of MDPI and/or the editor(s). MDPI and/or the editor(s) disclaim responsibility for any injury to people or property resulting from any ideas, methods, instructions or products referred to in the content.

