

The Relationship Between Foot Anthropometrics, Lower-Extremity Kinematics, and Ground Reaction Force in Elite Female Basketball Players: An Exploratory Study Investigating Arch Height Index and Navicular Drop


Abstract
:1. Introduction
2. Materials and Methods
2.1. Enrollment and Participants
2.2. Data Collection
2.2.1. Surveys
2.2.2. Anthropometrics
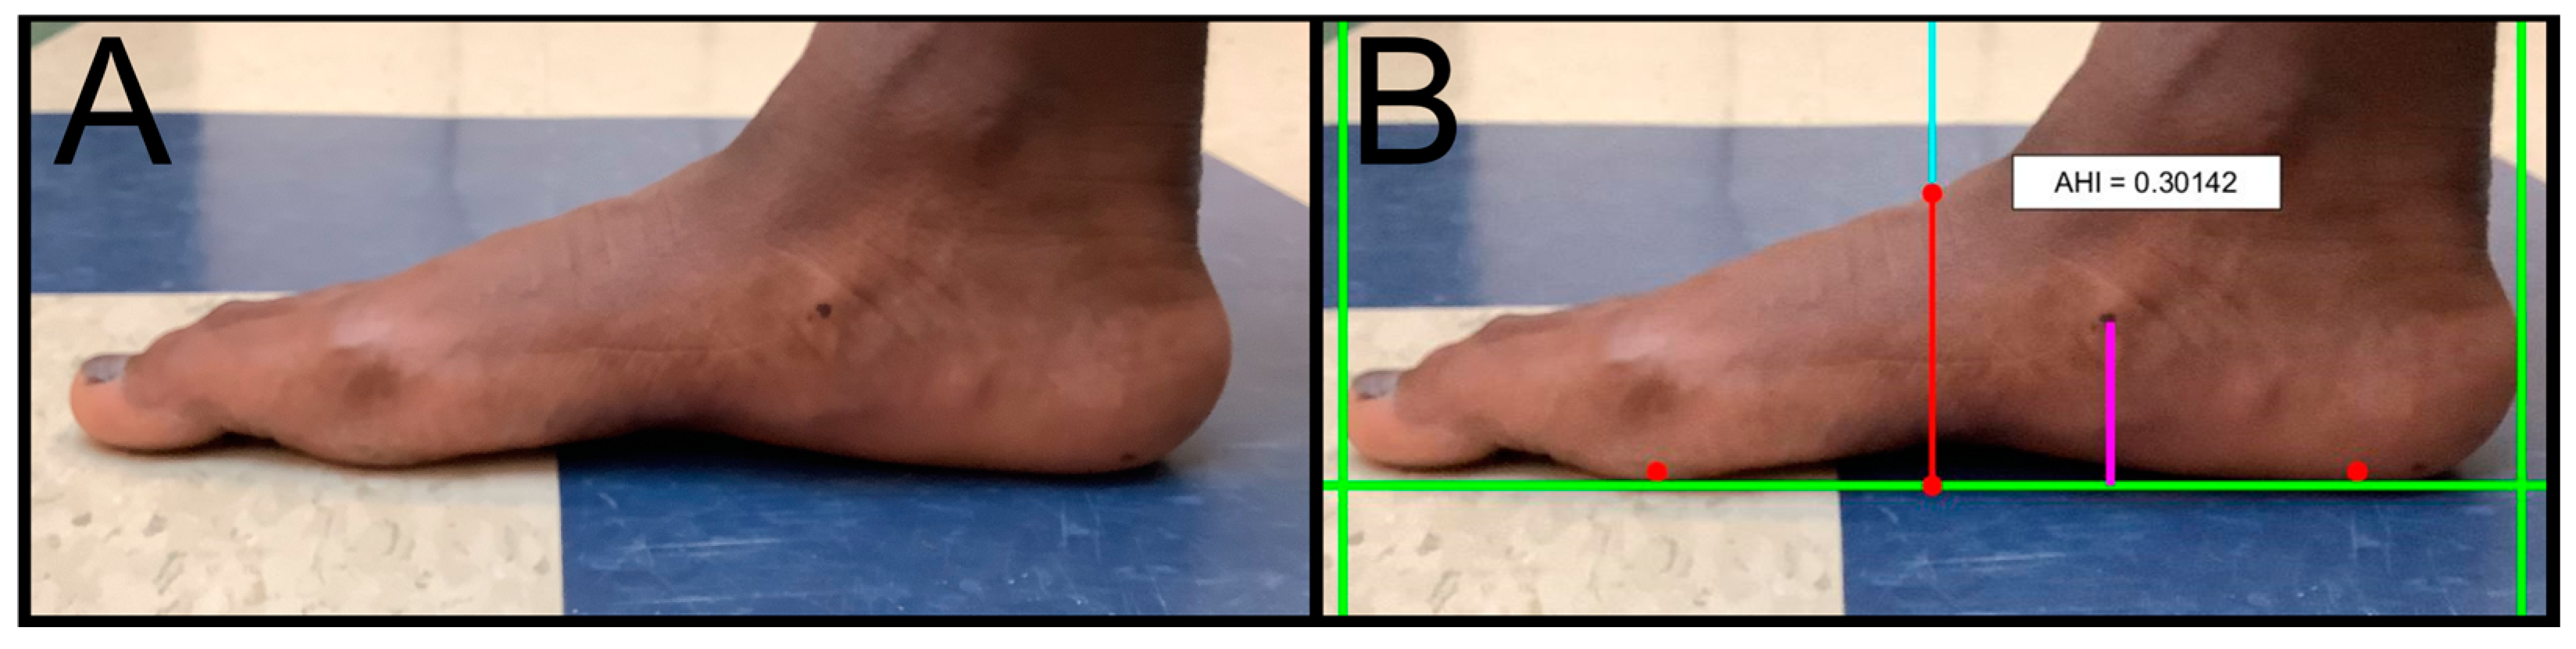
2.2.3. Foot Measurements
AHI
ND
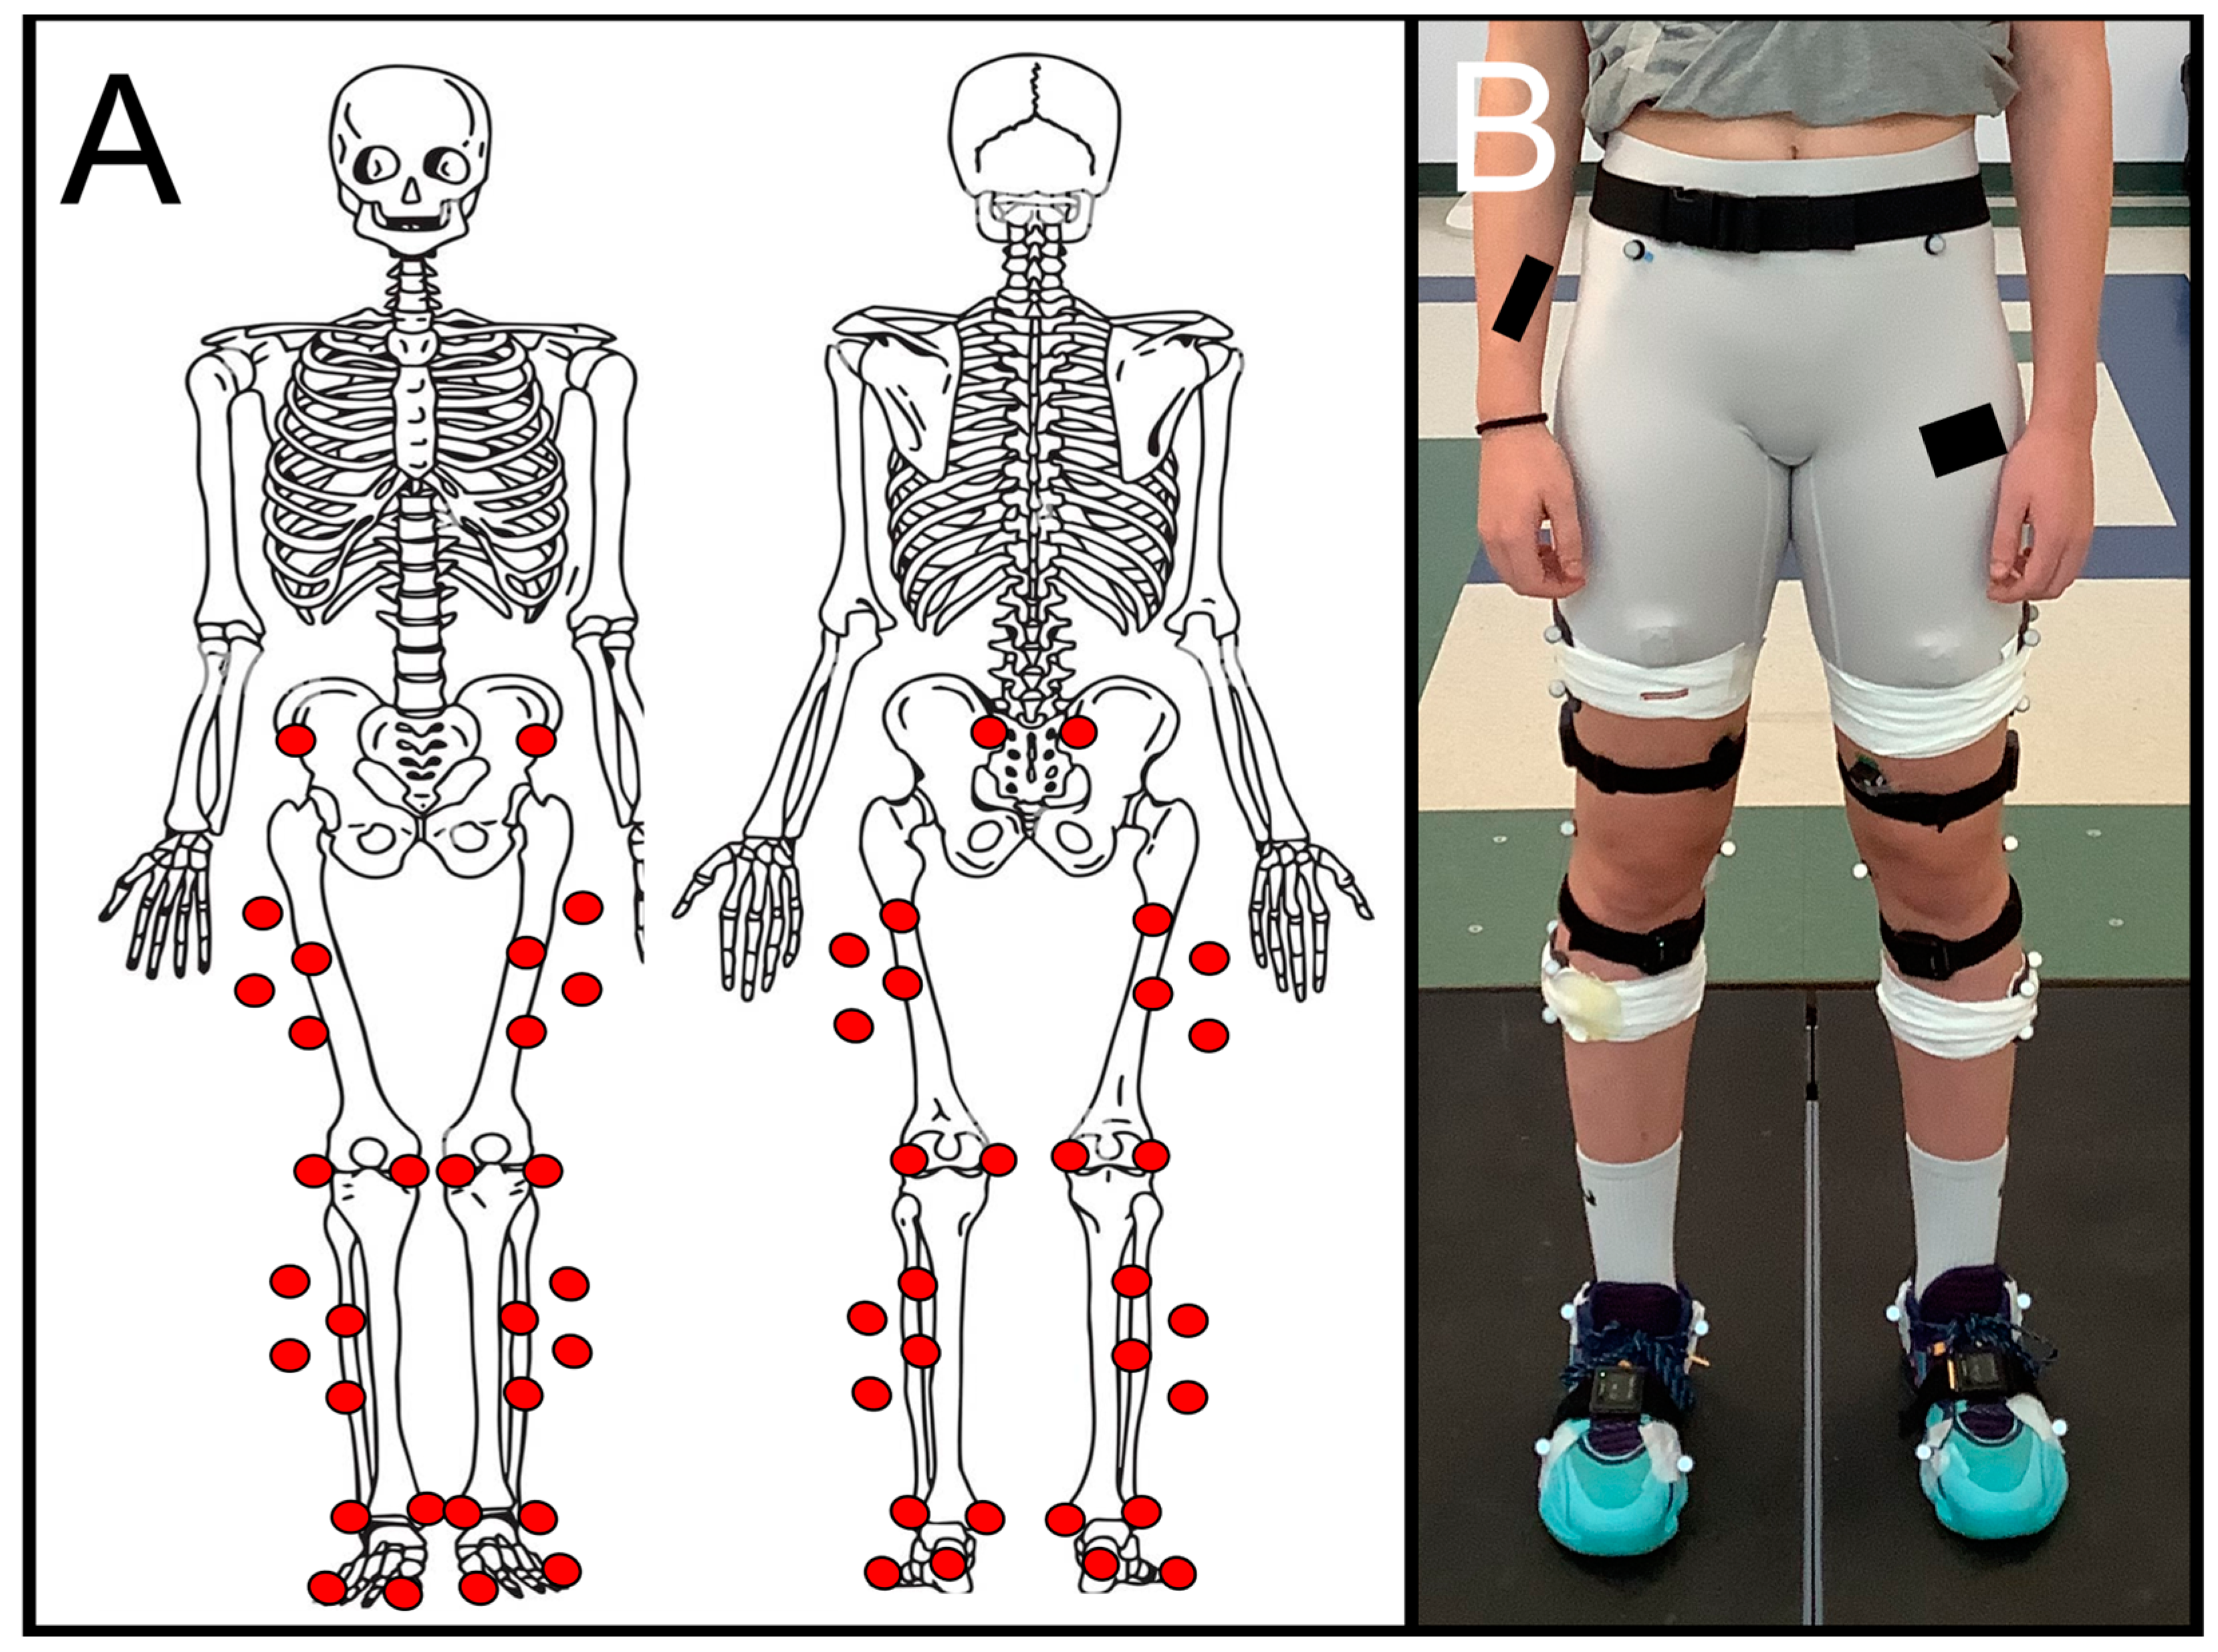
2.2.4. Biomechanics Instrumentation
MOCAP
Force Plates
Data Capture Metrics
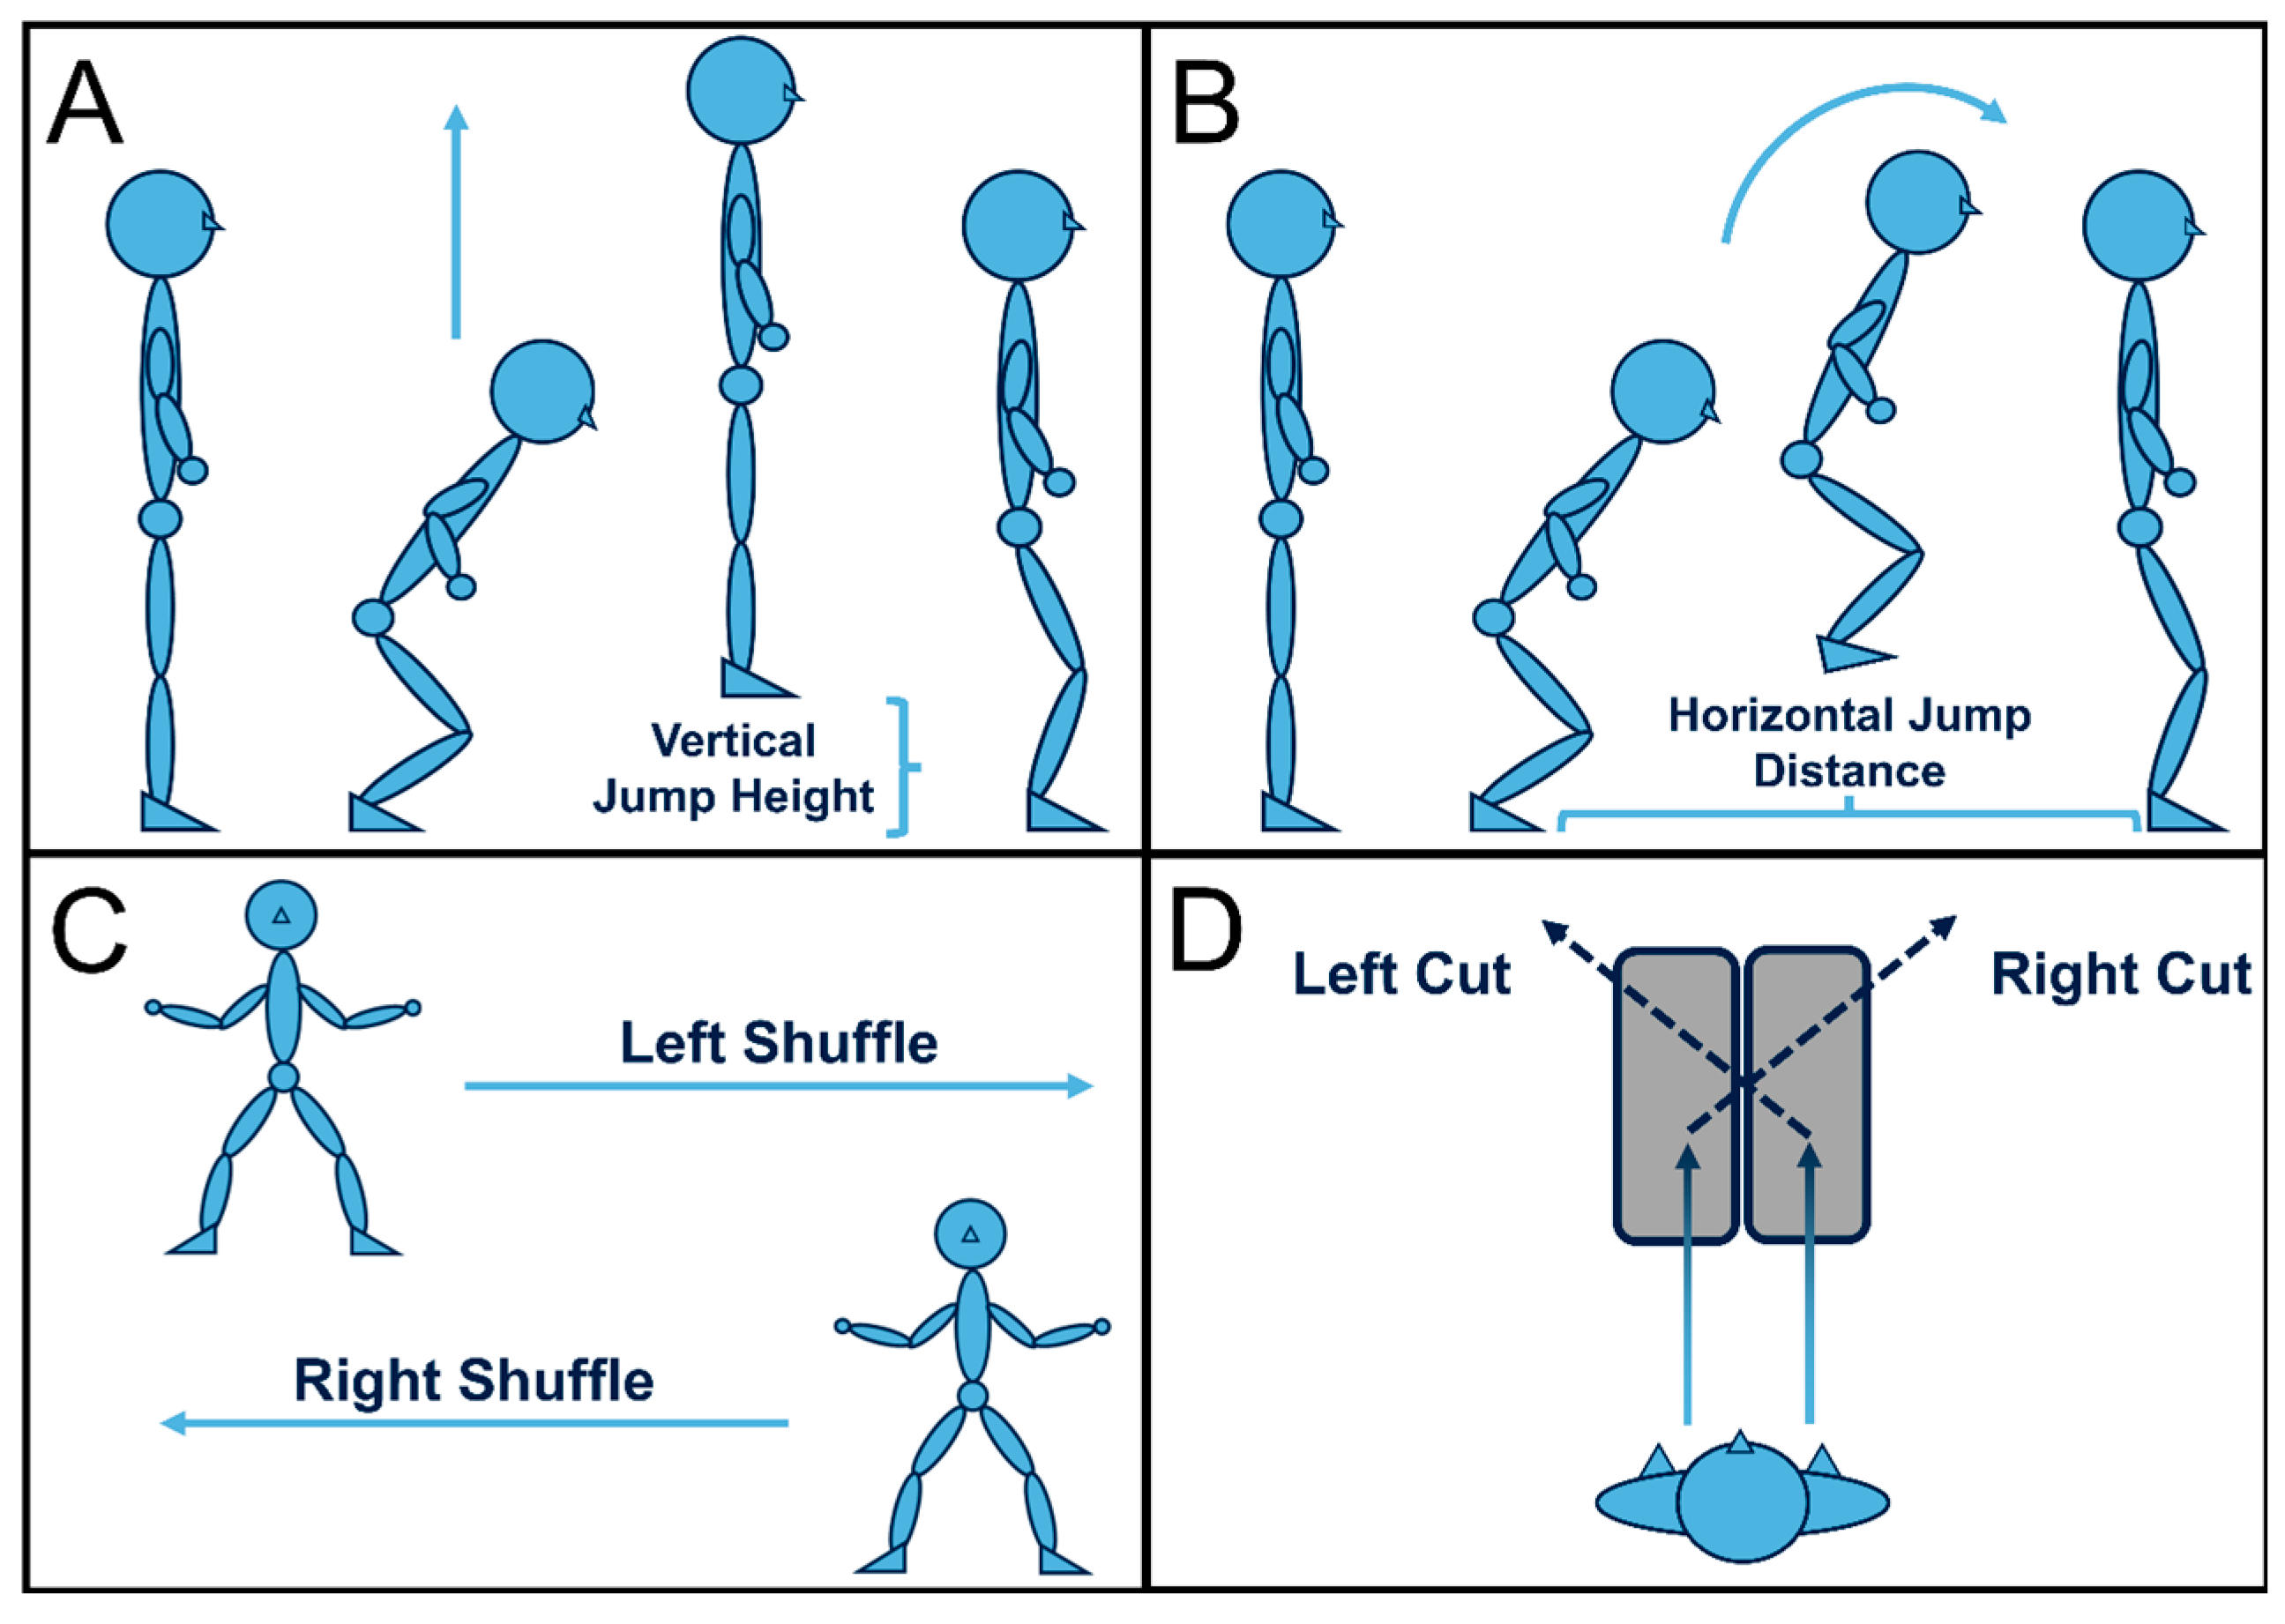
2.2.5. Activities
Static and Dynamic Calibrations
Activity Trials
2.3. Data Processing
2.3.1. QTM Tracking
2.3.2. V3D MOCAP Marker Processing
2.3.3. V3D GRF Processing
2.3.4. V3D Output Variables
2.3.5. Statistical Analysis
3. Results
3.1. Participant Characteristics
3.2. AHI and ND
3.3. Correlations Between AHI, ND, and Biomechanics Variables
3.3.1. AHI
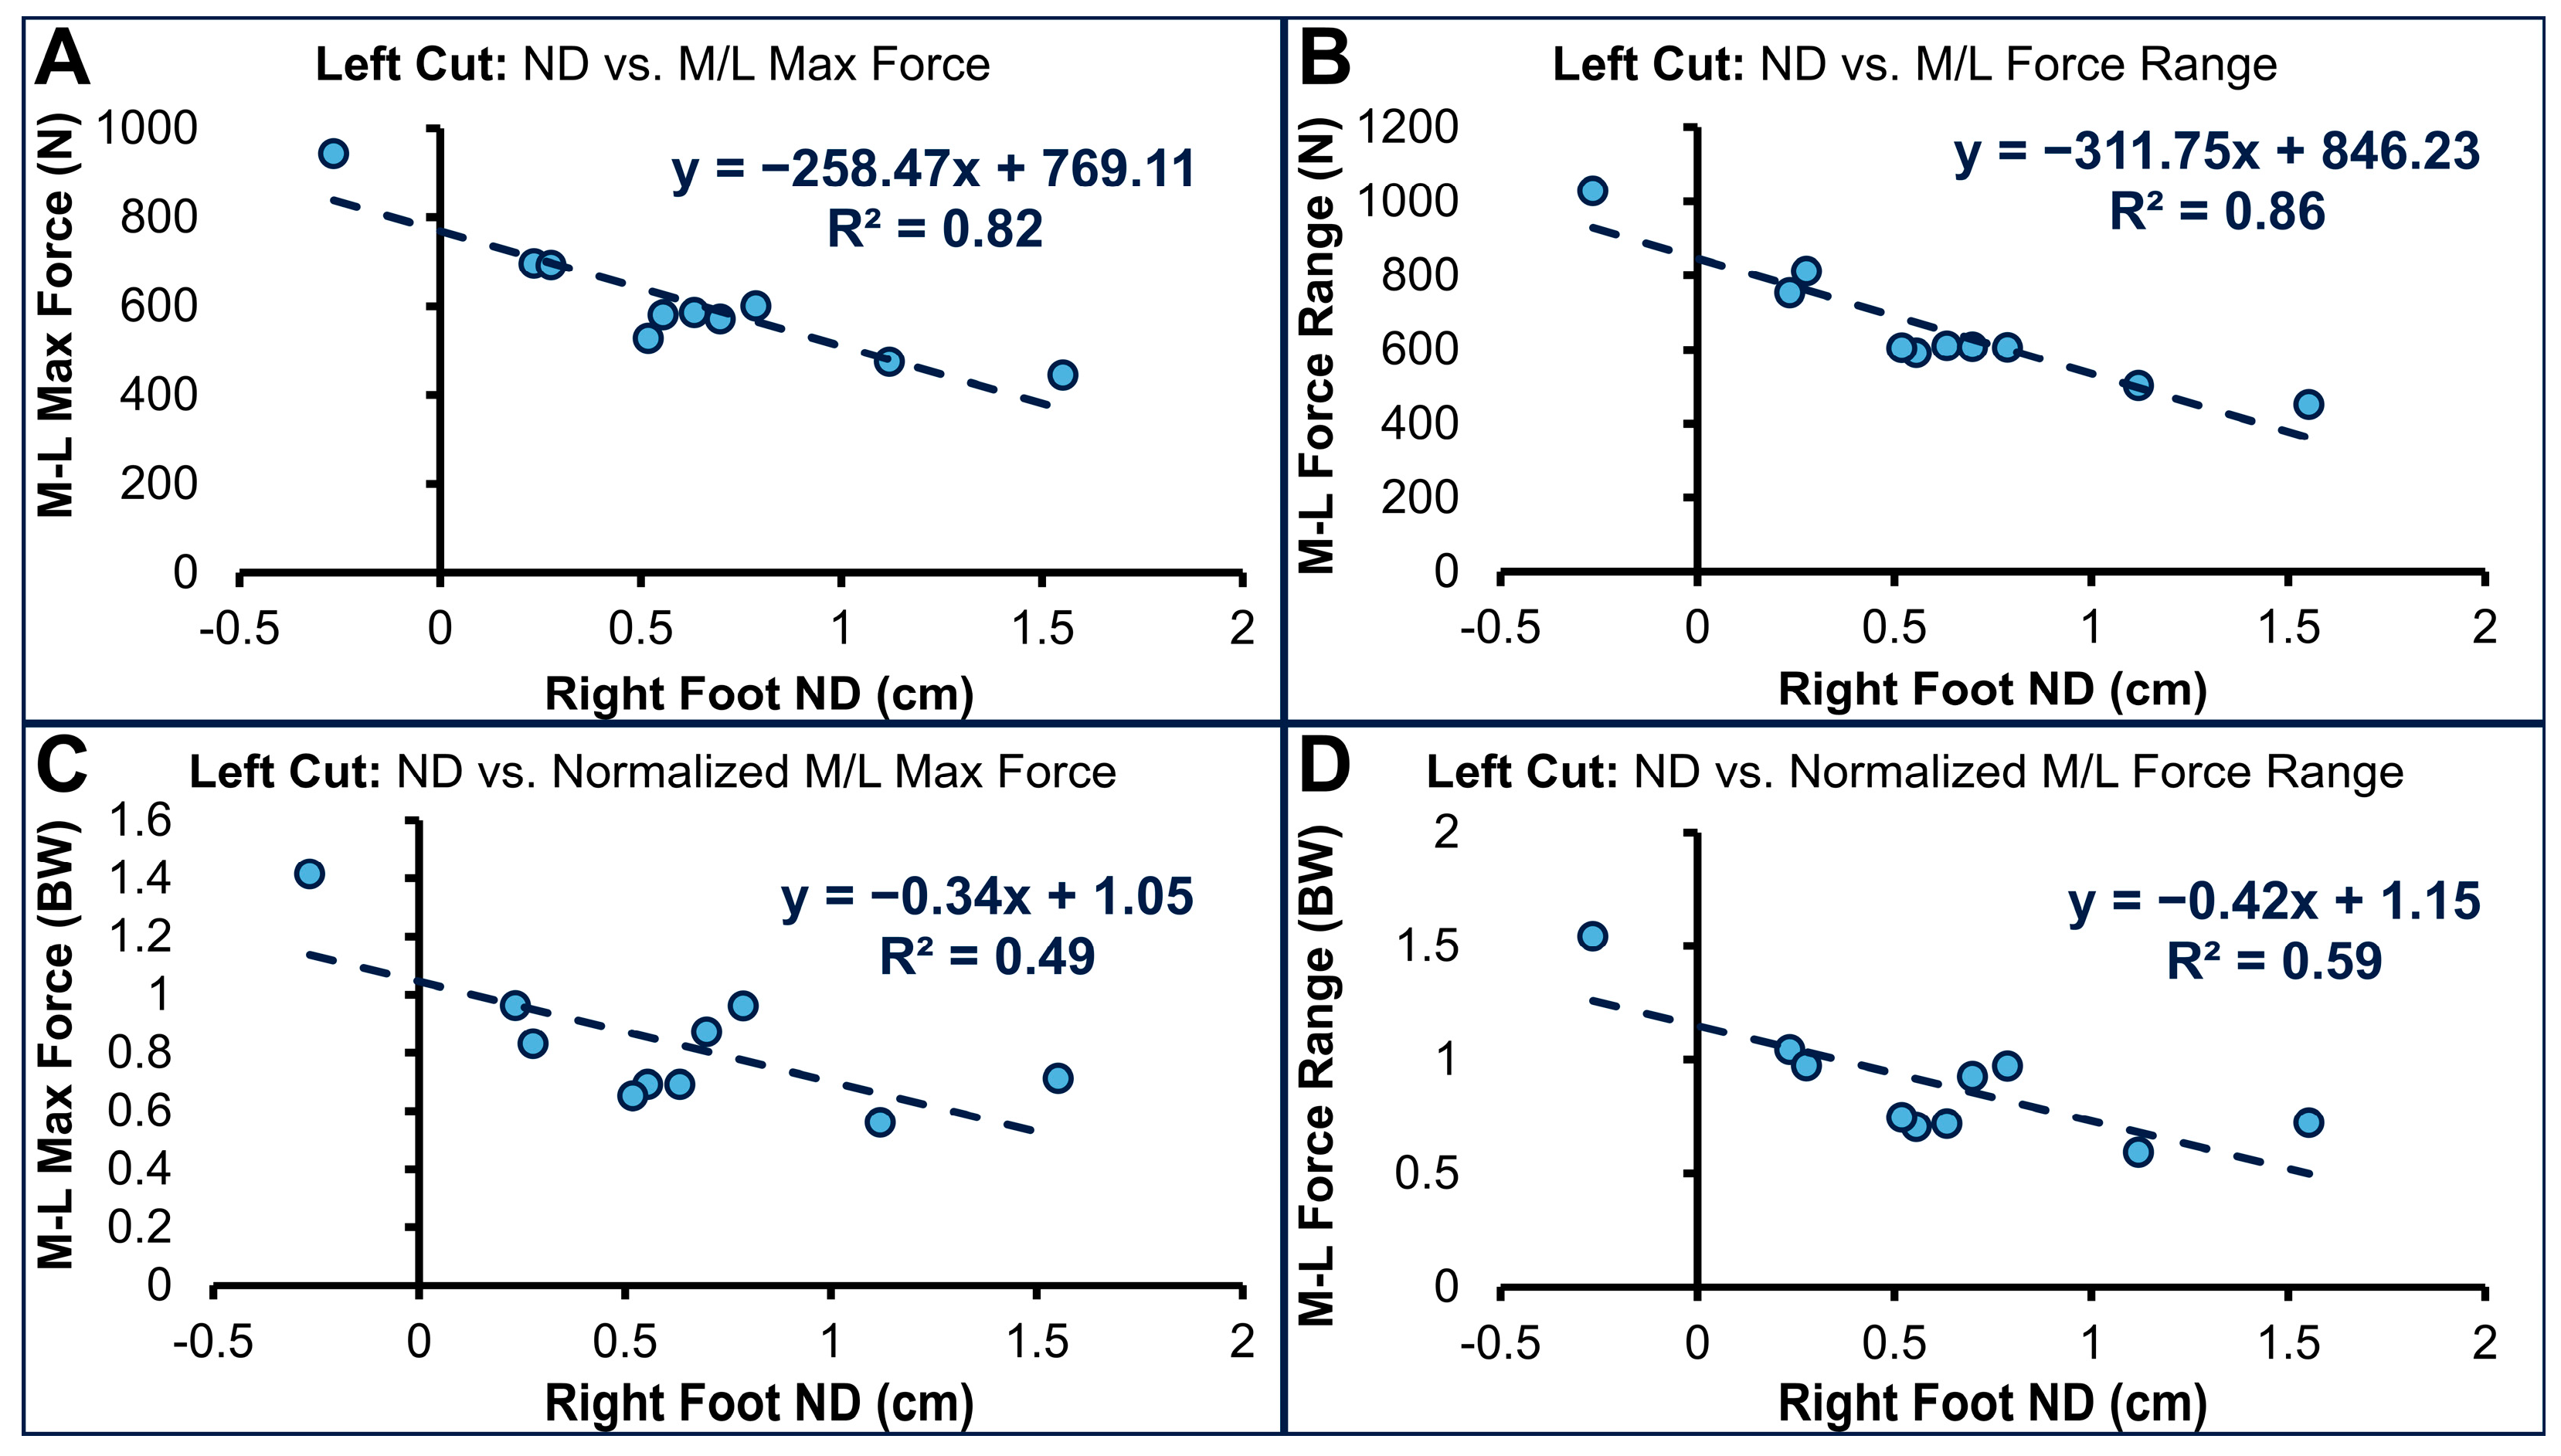
3.3.2. ND
4. Discussion
4.1. Summary
4.2. Limitations
5. Conclusions
Author Contributions
Funding
Institutional Review Board Statement
Informed Consent Statement
Data Availability Statement
Conflicts of Interest
References
- McKeon, P.O.; Hertel, J.; Bramble, D.; Davis, I. The Foot Core System: A New Paradigm for Understanding Intrinsic Foot Muscle Function. Br. J. Sports Med. 2015, 49, 290. [Google Scholar] [CrossRef] [PubMed]
- Dubin, A. Gait: The Role of the Ankle and Foot in Walking. Med. Clin. N. Am. 2014, 98, 205–211. [Google Scholar] [CrossRef] [PubMed]
- Eslami, M.; Damavandi, M.; Ferber, R. Association of Navicular Drop and Selected Lower-Limb Biomechanical Measures During the Stance Phase of Running. J. Appl. Biomech. 2014, 30, 250–254. [Google Scholar] [CrossRef]
- Hillstrom, H.J.; Song, J.; Kraszewski, A.P.; Hafer, J.F.; Mootanah, R.; Dufour, A.B.; Chow, B.S.; Deland, J.T. Foot Type Biomechanics Part 1: Structure and Function of the Asymptomatic Foot. Gait Posture 2013, 37, 445–451. [Google Scholar] [CrossRef]
- Hollander, K.; Stebbins, J.; Albertsen, I.M.; Hamacher, D.; Babin, K.; Hacke, C.; Zech, A. Arch Index and Running Biomechanics in Children Aged 10–14 Years. Gait Posture 2018, 61, 210–214. [Google Scholar] [CrossRef]
- Mølgaard, C.; Lundbye-Christensen, S.; Simonsen, O. High Prevalence of Foot Problems in the Danish Population: A Survey of Causes and Associations. Foot 2010, 20, 7–11. [Google Scholar] [CrossRef]
- Mootanah, R.; Song, J.; Lenhoff, M.W.; Hafer, J.F.; Backus, S.I.; Gagnon, D.; Deland, J.T.; Hillstrom, H.J. Foot Type Biomechanics Part 2: Are Structure and Anthropometrics Related to Function? Gait Posture 2013, 37, 452–456. [Google Scholar] [CrossRef]
- Subotnick, S.I. The Flat Foot. Physician Sportsmed. 1981, 9, 85–91. [Google Scholar] [CrossRef]
- Williams, D.S.B.; Tierney, R.N.; Butler, R.J. Increased Medial Longitudinal Arch Mobility, Lower Extremity Kinematics, and Ground Reaction Forces in High-Arched Runners. J. Athl. Train. 2014, 49, 290–296. [Google Scholar] [CrossRef]
- Headlee, D.L.; Leonard, J.L.; Hart, J.M.; Ingersoll, C.D.; Hertel, J. Fatigue of the Plantar Intrinsic Foot Muscles Increases Navicular Drop. J. Electromyogr. Kinesiol. 2008, 18, 420–425. [Google Scholar] [CrossRef] [PubMed]
- Bennett, J.E.; Reinking, M.F.; Rauh, M.J. The Relationship Between Isotonic Plantar Flexor Endurance, Navicular Drop, and Exercise-Related Leg Pain in a Cohort of Collegiate Cross-Country Runners. Int. J. Sports Phys. Ther. 2012, 7, 267–278. [Google Scholar] [PubMed]
- Buist, I.; Bredeweg, S.W.; Lemmink, K.A.P.M.; Van Mechelen, W.; Diercks, R.L. Predictors of Running-Related Injuries in Novice Runners Enrolled in a Systematic Training Program: A Prospective Cohort Study. Am. J. Sports Med. 2010, 38, 273–280. [Google Scholar] [CrossRef] [PubMed]
- Van Der Worp, M.P.; Ten Haaf, D.S.M.; Van Cingel, R.; De Wijer, A.; Nijhuis-van Der Sanden, M.W.G.; Staal, J.B. Injuries in Runners; A Systematic Review on Risk Factors and Sex Differences. PLoS ONE 2015, 10, e0114937. [Google Scholar] [CrossRef] [PubMed]
- Chow, T.-H.; Chen, Y.-S.; Tsai, W.-C.; Lin, M.-H. Plantar Pressure Profiles and Possible Foot Syndromes of Taiwanese College Elite Basketball Players. J. Am. Podiatr. Med. Assoc. 2021, 111, 5. [Google Scholar] [CrossRef]
- De Cesar Netto, C.; Bernasconi, A.; Roberts, L.; Lintz, F.; Richter, M.; O’Malley, M. Foot Alignment Profile in Injured Professional Basketball and Football Athletes. Foot Ankle Orthop. 2018, 3, 2473011418S0020. [Google Scholar] [CrossRef]
- Ho, M.; Kong, P.W.; Chong, L.J.-Y.; Lam, W.-K. Foot Orthoses Alter Lower Limb Biomechanics but Not Jump Performance in Basketball Players with and Without Flat Feet. J. Foot Ankle Res. 2019, 12, 24. [Google Scholar] [CrossRef]
- Lam, W.-K.; Lee, W.C.-C.; Ng, S.-O.; Zheng, Y. Effects of Foot Orthoses on Dynamic Balance and Basketball Free-Throw Accuracy Before and After Physical Fatigue. J. Biomech. 2019, 96, 109338. [Google Scholar] [CrossRef]
- Cejudo, A. Lower Extremity Flexibility Profile in Basketball Players: Gender Differences and Injury Risk Identification. Int. J. Environ. Res. Public Health 2021, 18, 11956. [Google Scholar] [CrossRef]
- Joseph, M.F.; Rahl, M.; Sheehan, J.; MacDougall, B.; Horn, E.; Denegar, C.R.; Trojian, T.H.; Anderson, J.M.; Kraemer, W.J. Timing of Lower Extremity Frontal Plane Motion Differs Between Female and Male Athletes During a Landing Task. Am. J. Sports Med. 2011, 39, 1517–1521. [Google Scholar] [CrossRef]
- Lim, B.-O.; Park, Y.-H. A Comparison of Sex-Based Differences in Knee Neuromuscular Biomechanics Factors during Basketball Rebound Jump. Korean J. Appl. Biomech. 2007, 17, 23–29. [Google Scholar]
- Schmitz, R.J.; Kulas, A.S.; Perrin, D.H.; Riemann, B.L.; Shultz, S.J. Sex Differences in Lower Extremity Biomechanics During Single Leg Landings. Clin. Biomech. 2007, 22, 681–688. [Google Scholar] [CrossRef] [PubMed]
- Smith, R.E.; Paquette, M.R.; Harry, J.R.; Powell, D.W.; Weiss, L.W. Footwear and Sex Differences in Performance and Joint Kinetics During Maximal Vertical Jumping. J. Strength Cond. Res. 2020, 34, 1634–1642. [Google Scholar] [CrossRef] [PubMed]
- Donelon, T.A.; Edwards, J.; Brown, M.; Jones, P.A.; O’Driscoll, J.; Dos’Santos, T. Differences in Biomechanical Determinants of ACL Injury Risk in Change of Direction Tasks Between Males and Females: A Systematic Review and Meta-Analysis. Sports Med. Open 2024, 10, 29. [Google Scholar] [CrossRef] [PubMed]
- Lin, C.Y.; Casey, E.; Herman, D.C.; Katz, N.; Tenforde, A.S. Sex Differences in Common Sports Injuries. PMR 2018, 10, 1073–1082. [Google Scholar] [CrossRef]
- Sigurðsson, H.B.; Sveinsson, Þ.; Briem, K. Timing, Not Magnitude, of Force May Explain Sex-Dependent Risk of ACL Injury. Knee Surg. Sports Traumatol. Arthrosc. 2018, 26, 2424–2429. [Google Scholar] [CrossRef]
- Greene, J.J.; McGuine, T.A.; Leverson, G.; Best, T.M. Anthropometric and Performance Measures for High School Basketball Players. J. Athl. Train. 1998, 33, 229–232. [Google Scholar]
- Cattran, A.M.; Kalkwarf, H.J.; Pinney, S.M.; Huang, B.; Biro, F.M. Bone Density and Timing of Puberty in a Longitudinal Study of Girls. J. Pediatr. Adolesc. Gynecol. 2015, 28, 170–172. [Google Scholar] [CrossRef]
- Culvenor, A.G.; Boeth, H.; Diederichs, G.; Wirth, W.; Duda, G.; Eckstein, F. Longitudinal Bone, Muscle and Adipose Tissue Changes in Physically Active Subjects—Sex Differences During Adolescence and Maturity. J. Musculoskelet. Neuronal Interact. 2016, 16, 237–246. [Google Scholar]
- Chia, L.; Myer, G.D.; Hewett, T.E.; McKay, M.J.; Sullivan, J.; Ford, K.R.; Pappas, E. When Puberty Strikes: Longitudinal Changes in Cutting Kinematics in 172 High-School Female Athletes. J. Sci. Med. Sport 2021, 24, 1290–1295. [Google Scholar] [CrossRef]
- DiCesare, C.A.; Montalvo, A.; Barber Foss, K.D.; Thomas, S.M.; Ford, K.R.; Hewett, T.E.; Jayanthi, N.A.; Stracciolini, A.; Bell, D.R.; Myer, G.D. Lower Extremity Biomechanics Are Altered Across Maturation in Sport-Specialized Female Adolescent Athletes. Front. Pediatr. 2019, 7, 268. [Google Scholar] [CrossRef]
- Cowan, D.N. Foot Morphologic Characteristics and Risk of Exercise-Related Injury. Arch. Fam. Med. 1993, 2, 773–777. [Google Scholar] [CrossRef] [PubMed]
- McPoil, T.G.; Cornwall, M.W.; Abeler, M.G.; Devereaux, K.J.; Flood, L.J.; Merriman, S.E.; Sullivan, S.; van Der Laan, M.J.; Villadiego, T.A.; Wilson, K. The Optimal Method to Assess the Vertical Mobility of the Midfoot: Navicular Drop versus Dorsal Arch Height Difference? Clin. Res. Foot Ankle 2013, 1, 1–7. [Google Scholar] [CrossRef]
- Pohl, M.B.; Farr, L. A Comparison of Foot Arch Measurement Reliability Using both Digital Photography and Calliper Methods. J. Foot Ankle Res. 2010, 3, 14. [Google Scholar] [CrossRef] [PubMed]
- Miller, E.E.; Whitcome, K.K.; Lieberman, D.E.; Norton, H.L.; Dyer, R.E. The Effect of Minimal Shoes on Arch Structure and Intrinsic Foot Muscle Strength. J. Sport Health Sci. 2014, 3, 74–85. [Google Scholar] [CrossRef]
- Adhikari, U.; Arulsingh, W.; Pai, G.; Raj, J.O. Normative Values of Navicular Drop Test and the Effect of Demographic Parameters—A Cross Sectional Study. Ann. Biol. Res. 2014, 5, 40–48. [Google Scholar]
- Graham, M.E.; Jawrani, N.T.; Chikka, A. Radiographic Evaluation of Navicular Position in the Sagittal Plane—Correction Following an Extraosseous Talotarsal Stabilization Procedure. J. Foot Ankle Surg. 2011, 50, 551–557. [Google Scholar] [CrossRef]
- Nielsen, R.G.; Rathleff, M.S.; Simonsen, O.H.; Langberg, H. Determination of Normal Values for Navicular Drop During Walking: A New Model Correcting for Foot Length and Gender. J. Foot Ankle Res. 2009, 2, 12. [Google Scholar] [CrossRef]
- Cappozzo, A.; Cappello, A.; Della Croce, U.; Pensalfini, F. Surface-Marker Cluster Design Criteria for 3-D Bone Movement Reconstruction. IEEE Trans. Biomed. Eng. 1997, 44, 1165–1174. [Google Scholar] [CrossRef]
- Ferber, R.; McClay Davis, I.; Williams Iii, D.S. Gender Differences in Lower Extremity Mechanics During Running. Clin. Biomech. 2003, 18, 350–357. [Google Scholar] [CrossRef]
- Livingstone, C. Color Atlas of Skeletal Landmark Definitions: Guidelines for Reproducible Manual and Virtual Palpations; Elsevier: Amsterdam, The Netherlands, 2007. [Google Scholar]
- Kertis, J.D.; Fritz, J.M.; Long, J.T.; Harris, G.F. Static and Dynamic Calibration of an Eight-Camera Optical System for Human Motion Analysis. Crit. Rev. Phys. Rehabil. Med. 2010, 22, 49–59. [Google Scholar] [CrossRef]
- Grood, E.S.; Suntay, W.J. A Joint Coordinate System for the Clinical Description of Three-Dimensional Motions: Application to the Knee. ASME J. Biomech. Eng. 1983, 105, 136–144. [Google Scholar] [CrossRef] [PubMed]
- Wu, G.; Siegler, S.; Allard, P.; Kirtley, C.; Leardini, A.; Rosenbaum, D.; Whittle, M.; D’Lima, D.D.; Cristofolini, L.; Witte, H.; et al. ISB Recommendation on Definitions of Joint Coordinate System of Various Joints for the Reporting of Human Joint Motion—Part I: Ankle, Hip, and Spine. J. Biomech. 2002, 35, 543–548. [Google Scholar] [CrossRef] [PubMed]
- Kong, P.W.; Candelaria, N.G.; Tomaka, J. Perception of Self-Selected Running Speed is Influenced by the Treadmill but not Footwear. Sports Biomech. 2009, 8, 52–59. [Google Scholar] [CrossRef] [PubMed]
- Sloot, L.H.; Van Der Krogt, M.M.; Harlaar, J. Self-Paced Versus Fixed Speed Treadmill Walking. Gait Posture 2014, 39, 478–484. [Google Scholar] [CrossRef]
- Cabarkapa, D.; Cabarkapa, D.V.; Philipp, N.M.; Knezevic, O.M.; Mirkov, D.M.; Fry, A.C. Pre-Post Practice Changes in Countermovement Vertical Jump Force-Time Metrics in Professional Male Basketball Players. J. Strength Cond. Res. 2023, 37, e609–e612. [Google Scholar] [CrossRef]
- Mandic, R.; Jakovljevic, S.; Jaric, S. Effects of Countermovement Depth on Kinematic and Kinetic Patterns of Maximum Vertical Jumps. J. Electromyogr. Kinesiol. 2015, 25, 265–272. [Google Scholar] [CrossRef]
- Krishnan, A.; Sharma, D.; Bhatt, M.; Dixit, A.; Pradeep, P. Comparison between Standing Broad Jump Test and Wingate Test for Assessing Lower Limb Anaerobic Power in Elite Sportsmen. Med. J. Armed Forces India 2017, 73, 140–145. [Google Scholar] [CrossRef]
- Pehar, M.; Sekulic, D.; Sisic, N.; Spasic, M.; Uljevic, O.; Krolo, A.; Milanovic, Z.; Sattler, T. Evaluation of Different Jumping Tests in Defining Position-Specific and Performance-Level Differences in High Level Basketball Players. Biol. Sport 2017, 3, 263–272. [Google Scholar] [CrossRef]
- Whitting, J.W.; De Melker Worms, J.L.A.; Maurer, C.; Nigg, S.R.; Nigg, B.M. Measuring Lateral Shuffle and Side Cut Performance. J. Strength Cond. Res. 2013, 27, 3197–3203. [Google Scholar] [CrossRef]
- Zaslow, T.L.; Pace, J.L.; Mueske, N.M.; Chua, M.C.; Katzel, M.J.; Dennis, S.W.; Wren, T.A.L. Comparison of Lateral Shuffle and Side-Step Cutting in Young Recreational Athletes. Gait Posture 2016, 44, 189–193. [Google Scholar] [CrossRef]
- Butler, L.S.; Milian, E.K.; DeVerna, A.; Latz, K.; Ellis, H.B.; Martinez, A.R.; Hayden, K.; Gerstenkorn, C.; Carpenito, S.C.; Wyatt, C.W.; et al. Reliability of the Cutting Alignment Scoring Tool (CAST) to Assess Trunk and Limb Alignment During a 45-Degree Side-Step Cut. Int. J. Sports Phys. Ther. 2021, 16, 312. [Google Scholar] [CrossRef] [PubMed]
- Nishizawa, K.; Hashimoto, T.; Hakukawa, S.; Nagura, T.; Otani, T.; Harato, K. Effects of Foot Progression Angle on Kinematics and Kinetics of a Cutting Movement. J. Exp. Orthop. 2022, 9, 11. [Google Scholar] [CrossRef] [PubMed]
- Bell, A.L.; Pedersen, D.R.; Brand, R.A. A Comparison of the Accuracy of Several Hip Center Location Prediction Methods. J. Biomech. 1990, 23, 617–621. [Google Scholar] [CrossRef] [PubMed]
- Bell, A.L.; Brand, R.A.; Pedersen, D.R. Prediction of Hip Joint Centre Location from External Landmarks. Hum. Mov. Sci. 1989, 8, 3–16. [Google Scholar] [CrossRef]
- Butler, R.J.; Hillstrom, H.; Song, J.; Richards, C.J.; Davis, I.S. Arch Height Index Measurement System: Establishment of Reliability and Normative Values. J. Am. Podiatr. Med. Assoc. 2008, 98, 102–106. [Google Scholar] [CrossRef]
- NCD Risk Factor Collaboration (NCD-RisC) A Century of Trends in Adult Human Height. eLife 2016, 5, e13410. [CrossRef]
- Nigg, B.M.; Cole, G.K.; Nachbauer, W. Effects of Arch Height of the Foot on Angular Motion of the Lower Extremities in Running. J. Biomech. 1993, 26, 909–916. [Google Scholar] [CrossRef]
- Williams, D.S.; McClay, I.S.; Hamill, J.; Buchanan, T.S. Lower Extremity Kinematic and Kinetic Differences in Runners with High and Low Arches. J. Appl. Biomech. 2001, 17, 153–163. [Google Scholar] [CrossRef]
- Gazbare, P.; Rucha, C.; Rathi, M.; Shivam, S.; Shivani, D. Relationship of Foot Arch Height and Lower Limb Muscle Strength with Vertical Jump Height in Recreational Basketball Players: A Correlational Study. YMER 2023, 22, 16–24. [Google Scholar]
- Nachbauer, W.; Nigg, B.N. Effects of Arch Height of the Foot on Ground Reaction Forces in Running. Med. Sci. Sports Exerc. 1992, 24, 1264–1269. [Google Scholar] [CrossRef]
- Johnson, C.D.; Davis, I.S. Relationships Between Arch Height Flexibility and Medial–Lateral Ground Reaction Forces in Rearfoot and Forefoot Strike Runners. J. Appl. Biomech. 2021, 37, 118–121. [Google Scholar] [CrossRef] [PubMed]
- Zifchock, R.; Parker, R.; Wan, W.; Neary, M.; Song, J.; Hillstrom, H. The Relationship Between Foot Arch Flexibility and Medial-lateral Ground Reaction Force Distribution. Gait Posture 2019, 69, 46–49. [Google Scholar] [CrossRef] [PubMed]
- Ho, I.M.K.; Weldon, A.; Yeung, N.C.Y.; Luk, J.T.C. Low-Dye Taping May Enhance Physical Performance and Muscle Activation in Basketball Players with Overpronated Feet. PLoS ONE 2022, 17, e0275178. [Google Scholar] [CrossRef] [PubMed]

| Age (years) | 20.7 ± 2.1 |
| Height (cm) | 183.0 ± 6.5 |
| Mass (kg) | 76.1 ± 10.0 |
| Experience (years) | 10.9 ± 4.5 |
| Footedness | 0.68 ± 0.29 |
| Handedness | 0.76 ± 0.25 |
| Variable | Left | Right | t-Test Results |
|---|---|---|---|
| Femur Length (cm) | 46.8 ± 2.7 | 46.9 ± 2.7 | 0.66 |
| Tibia Length (cm) | 45.4 ± 3.5 | 45.7 ± 3.5 | 0.05 |
| Foot Length (cm) | 26.8 ± 2.0 | 26.8 ± 1.8 | 0.74 |
| Foot Width (cm) | 10.1 ± 0.6 | 10.1 ± 0.6 | 0.68 |
| Arch Height Index | 0.34 ± 0.03 | 0.34 ± 0.02 | 0.60 |
| Navicular Drop (cm) | 0.35 ± 0.31 | 0.61 ± 0.50 | 0.20 |
| Variable | Left (°) | Right (°) | Shapiro–Wilk L/R | t-Test Results |
|---|---|---|---|---|
| Hip Sagittal | 135.8 ± 17.2 | 133.1 ± 17.2 | 0.18/0.33 | 0.50 |
| Hip Frontal | 54.7 ± 7.1 | 60.9 ± 9.0 | 0.85/0.44 | 0.006 |
| Hip Transverse | 74.2 ± 11.3 | 69.0 ± 9.0 | 0.84/0.44 | 0.006 |
| Knee Sagittal | 136.6 ± 10.0 | 132.8 ± 10.5 | 0.56/0.04 | 0.21 |
| Knee Frontal | 0.9 ± 1.0 | 0.8 ± 1.0 | 0.03/0.01 | 0.80 |
| Ankle Sagittal | 52.1 ± 9.3 | 54.6 ± 12.8 | 0.53/0.95 | 0.42 |
| Ankle Frontal | 45.1 ± 11.3 | 38.3 ± 7.9 | 0.79/0.65 | 0.09 |
| Ankle Transverse | 36.1 ± 10.4 | 37.0 ± 9.2 | 0.85/0.02 | 0.78 |
Disclaimer/Publisher’s Note: The statements, opinions and data contained in all publications are solely those of the individual author(s) and contributor(s) and not of MDPI and/or the editor(s). MDPI and/or the editor(s) disclaim responsibility for any injury to people or property resulting from any ideas, methods, instructions or products referred to in the content. |
© 2024 by the authors. Licensee MDPI, Basel, Switzerland. This article is an open access article distributed under the terms and conditions of the Creative Commons Attribution (CC BY) license (https://creativecommons.org/licenses/by/4.0/).
Share and Cite
Cairns, C.I.; Van Citters, D.W.; Chapman, R.M. The Relationship Between Foot Anthropometrics, Lower-Extremity Kinematics, and Ground Reaction Force in Elite Female Basketball Players: An Exploratory Study Investigating Arch Height Index and Navicular Drop. Biomechanics 2024, 4, 750-764. https://doi.org/10.3390/biomechanics4040055
Cairns CI, Van Citters DW, Chapman RM. The Relationship Between Foot Anthropometrics, Lower-Extremity Kinematics, and Ground Reaction Force in Elite Female Basketball Players: An Exploratory Study Investigating Arch Height Index and Navicular Drop. Biomechanics. 2024; 4(4):750-764. https://doi.org/10.3390/biomechanics4040055
Chicago/Turabian StyleCairns, Catherine I., Douglas W. Van Citters, and Ryan M. Chapman. 2024. "The Relationship Between Foot Anthropometrics, Lower-Extremity Kinematics, and Ground Reaction Force in Elite Female Basketball Players: An Exploratory Study Investigating Arch Height Index and Navicular Drop" Biomechanics 4, no. 4: 750-764. https://doi.org/10.3390/biomechanics4040055
APA StyleCairns, C. I., Van Citters, D. W., & Chapman, R. M. (2024). The Relationship Between Foot Anthropometrics, Lower-Extremity Kinematics, and Ground Reaction Force in Elite Female Basketball Players: An Exploratory Study Investigating Arch Height Index and Navicular Drop. Biomechanics, 4(4), 750-764. https://doi.org/10.3390/biomechanics4040055