Article

Influence of Wall Compliance on the Flow Patterns in a Patient-Specific Brachio-Cephalic Arterio-Venous Fistula

1
Bernal Institute, University of Limerick, V94 XT66 Limerick, Ireland
2
School of Engineering, University of Limerick, V94 XT66 Limerick, Ireland
3
Health Research Institute, University of Limerick, V94 XT66 Limerick, Ireland
*
Author to whom correspondence should be addressed.
Biomechanics 2022, 2(2), 158-173; https://doi.org/10.3390/biomechanics2020014
Submission received: 9 December 2021 / Revised: 1 April 2022 / Accepted: 6 April 2022 / Published: 8 April 2022

Abstract

:
Patients with end stage renal disease require some form of vascular access for treatment, with Arterio-Venous Fistulas (avf) being the preferred form available due to better patency rates. However, they continue to present complications after creation, leading to early or late failure. While many studies are examining the flow in patient-specific fistulas, they often neglect the influence of vessel compliance on its hemodynamics. The objective of this study is to investigate the effect of wall compliance on the complex hemodynamics of a patient-specific brachio-cephalic avf and how it differs from a rigid fistula. Particle Image Velocimetry (piv) was used to capture the flow pattern within the fistula for both steady (Re = 1817) and pulsatile ( Re av = 1817 , Re max = 2232 ) flow conditions. The results were compared to rigid model measurements performed under the same Reynolds number. The streamline plots and coefficient of variation results did not differ significantly between the models; however, the non-dimensional velocity and directional variability results did vary between the two fistulas. A difference of approximately 8% was seen between the two models for both steady and pulsatile flow. The findings of this study suggest that to determine the bulk flow, a rigid model is adequate, but to capture the finer details of the flow, a compliant model is necessary.

1. Introduction

End stage renal disease (ESRD) is the last stage of chronic kidney disease (CKD). It occurs when the kidneys have lost the ability to filter blood, leading to a buildup of harmful toxins in the body. To treat ESRD, some form of renal replacement therapy, such as kidney replacement or dialysis, is required; while a kidney transplant is the ideal form of treatment, due to a lack of donors, the most common treatment option used is hemodialysis. To perform hemodialysis, some form of vascular access with a high flow rate is required. There are three forms of vascular access available for hemodialysis: an arterio-venous fistula (AVF), an arterio-venous graft (AVG) or a central venous catheter (CVC). An arterio-venous fistula is a surgically created connection between an artery and a vein and is the preferred form of vascular access [1]. Unfortunately, these access types have high failure rates. Fistula failure is generally due to failure to mature or vascular occlusion triggered by intimal hyperplasia [2]. For hemodialysis to be effective, an AVF needs to be functioning adequately making it essential to evaluate the hemodynamics within an AVF, as they perform an important role in AVF patency.
While many studies have investigated the role of hemodynamics in fistula failure, most research focuses on studying rigid walled AVF models and disregards the influence of wall compliance on the flow. There have been few fluid structure interaction (FSI) studies on AVFs and even fewer experimental studies on compliant fistulas. Park et al. [3] performed FSI modeling on AVFs at three different angles and validated the results with micro-particle image velocimetry (PIV) experiments on a compliant model. The vessel walls were modeled as isotropic, homogeneous and elastic with a Young’s Modulus of 3.36 MPa. The results showed good agreement with each other and that the wall shear stress (WSS) was largest at the vein in the fistula with an acute angle. De Villiers et al. [4] performed FSI modeling in a patient-specific AVF and compared it to flow in vivo using four-dimensional (4D) magnetic resonance imaging (MRI); while flow patterns matched, quantitatively, there was a significant difference between the FSI and MRI due to the inaccuracy in spatial and temporal resolution of MRI. Jodko et al. [5] examined the maturation process in a patient-specific AVF through two stages using FSI simulations. The first stage modeled was after AVF creation, where the vein begins dilating. Three different AVF geometries with Young’s Modulus of 0.4, 0.55 and 0.35 MPa were modeled. The second stage modeled was right after the first when the venous hemodynamics are stable. The first stage showed high levels of WSS due to the increased flow rate and considerable vein dilation, resulting in the development of vortices. In the second stage, the WSS values in the vein were typical venous values for fistulas for two of the models, while one of the models continued showing high levels of WSS. The authors believe that the mean WSS levels should also be examined to determine whether or not a fistula is mature for dialysis. Jodko et al. [6] also investigated the pressure drop in an patient-specific AVF using FSI and in vitro modeling. The experimental model was made of Polyjet photopolymer with a Young’s Modulus of 0.2 MPa, while the FSI model had a higher Young’s Modulus of 3 MPa. The experimental and FSI pressure drop results illustrated good agreement. The pressure drop was determined to be lower than some literature and higher than others. Decorato et al. [7] conducted a FSI study on a patient-specific AVF and compared it with a rigid experimental model. The vessel walls were modeled as non-uniform hyperelastic and incompressible. The authors found that the FSI and PIV results agreed well with each other and that modeling the deformability of the fistula did not significantly influence the hemodynamics for this particular case. However, the authors only compared velocity profiles for FSI and PIV results and failed to study any other hemodynamic parameters. Another study by the same group, Decorato et al. [8], also modeled three different AVFs using FSI. The first model was an AVF with a stenosis, the second was the fistula after angioplasty and the last model was the fistula after angioplasty with stenting. The arterial and venous the walls were modeled as hyperelastic, homogeneous and incompressible with the artery being more compliant. The stenosis was modeled as viscoplastic. Angioplasty was found to reduce the velocity by 10% in the region of the stenosis, which in turn reduced the WSS by 50%. The pressure also decreased after angioplasty by 60%. However, no significant difference in pressure, velocity or WSS was determine between the stenting and not stenting after angioplasty with the exception of internal shear stresses, which were higher at the throat of the stenosis. McGah et al. [9] investigated the influence of wall compliance on AVF hemodynamics and compared the results with rigid model data. The time averaged wall shear stress (TAWSS) was determined to be lower in the FSI model, with some regions seeing up to ≥50% difference in values. However, the TAWSS in the FSI model was still found to be higher than it should be in healthy arteries and veins, suggesting that modeling rigid walled models is acceptable for certain circumstances, but to capture bruits and thrills, FSI modeling provides more realistic results. Despite these studies, there remains a significant lack of research, particularly experimental studies, on the effect of AVF compliance on the hemodynamics within.
Computational fluid dynamics (CFD) is becoming more popular to study complex cardiovascular hemodynamics. It is useful in developing and improving medical devices, as well as predicting the response of medical implants, disease progression and the effect of surgical treatment [7]. Although CFD is well established, it is not always accurate. Stewart et al. [10] investigated the reliability of CFD to predict the hemodynamics in a medical device. Several CFD studies modeled the flow entering and exiting a conical collector at five different Reynolds (RE) Numbers with PIV experiments used for validation. It was determined that the CFD models were able to predict the flow in some aspects and regions while not in others. The CFD results varied significantly among both the studies and experimental results. WSS showed significant variation among the CFD results, which is an important parameter studied in blood flow. The authors believe the differences could be due to different boundary conditions, convergence time, viscous mesh spacing, wall conditions and space/time order of accuracies used. In addition, it was found that laminar models predicted the flow better than turbulent models, despite the inlet Reynolds flow being in the transitional regime, which also highlighted the need of transitional models, especially for blood flow in medical devices which usually fall under transitional flow. The PIV validation for this study was performed by Hariharan et al. [11], and illustrated less variation among the experimental results, suggesting that experimental modeling is more reliable at capturing complex flow patterns than CFD. To improve the performance of CFD, Drost et al. [12] suggested the use of experimental methods, as they have good reproducibility, controllability and accuracy. These can be employed to provide guidance for CFD modeling in aspects such as boundary conditions, wall conditions and modeling assumptions.
The aim of this study is to investigate the effect of wall compliance on the hemodynamics within a patient-specific brachio-cephalic AVF using PIV and how it differs from a rigid model of the same geometry. Studying a compliant fistula is important, as it is a more realistic depiction of a fistula, where there is a force applied back to the flow. This will provide a dataset which can be used for CFD guidance as well as validation. This dataset will also add to the scarce experimental data on compliant patient-specific fistulas. A complete three-dimensional–three-component (3D-3C) velocity field was investigated to understand the complex hemodynamics present within the AVF. Unlike previous studies, this investigation experimentally examines the difference in flow fields between patient-specific rigid and compliant models. Two previously unused velocity-based parameters were also introduced to infer wall shear stresses of the walls.

2. Materials and Methods

2.1. Flow Phantom

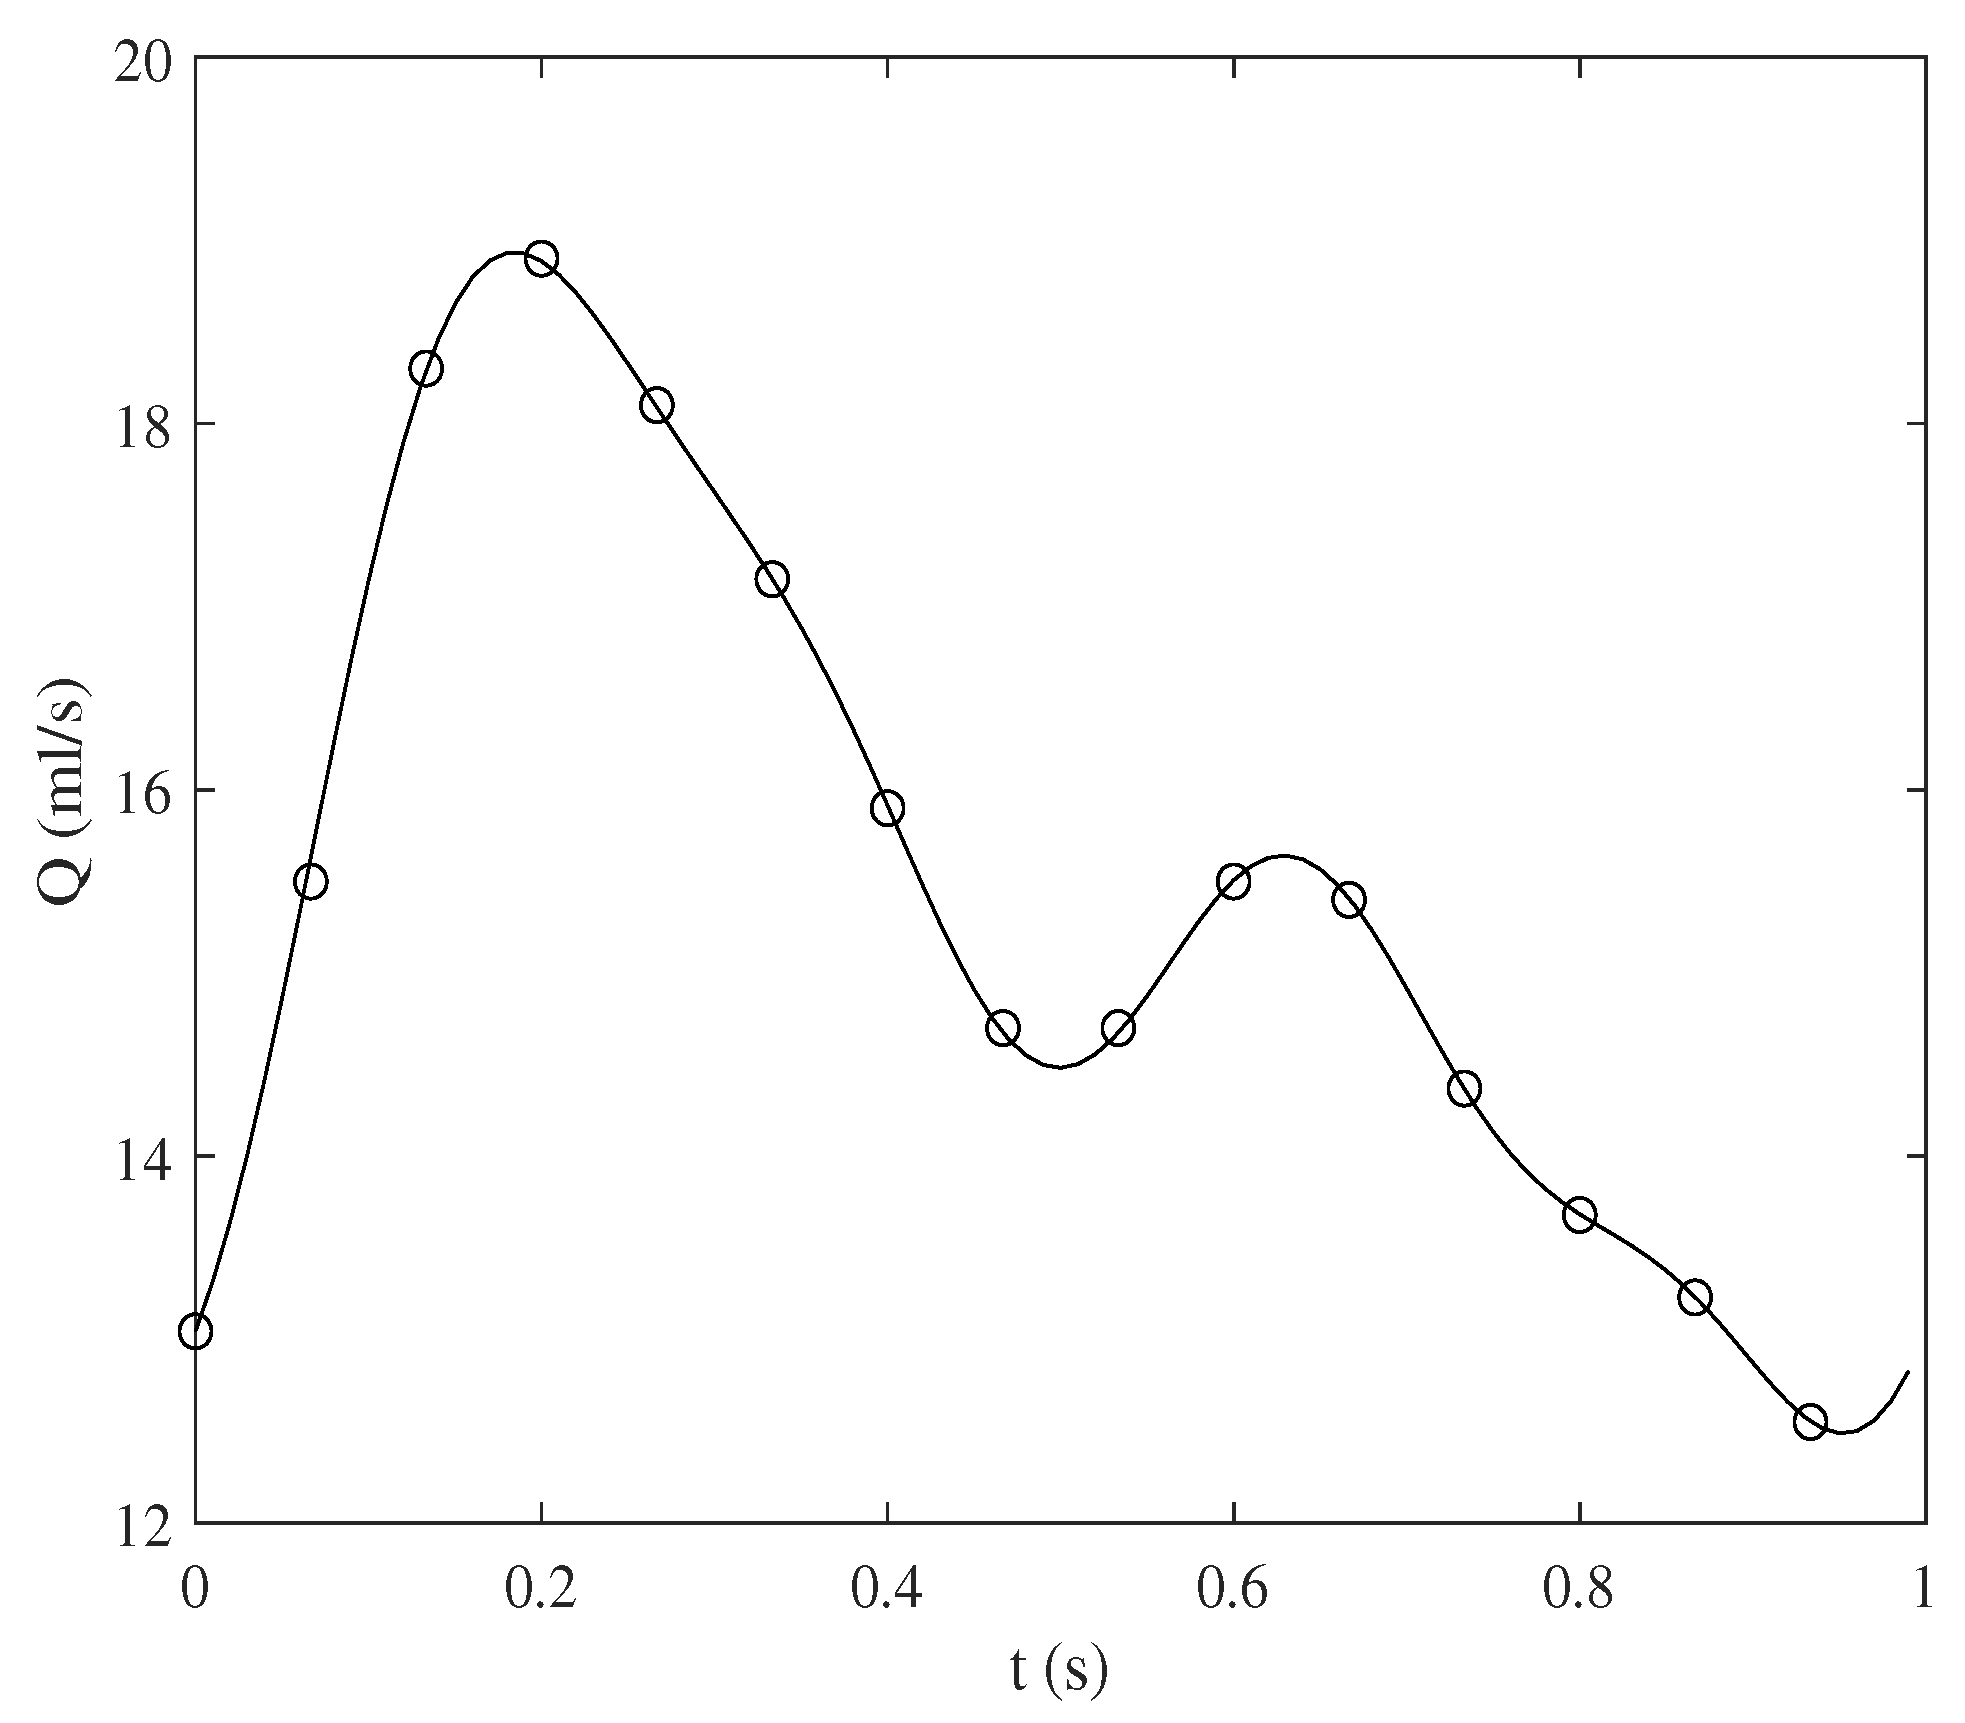
MRI scan data from a hemodialysis-treated patient as part of a study (also part of EU Seventh Framework Program ReDVA) were used to recreate the fistula geometry, illustrated in Figure 1. The phantom was 3D printed in transparent silicone by Medisim Corporation, Ontario, Canada. The phantom has a Young’s modulus of 1.5 MPa and homogenous walls with 1 mm thickness. Healthy brachial arteries have a mean Elastic modulus of 100.85 ± 8.1 kPa, while patients with CKD have a higher Elastic modulus with a value of 129.89 ± 6.44 kPa [13]. Patients with ESRD usually have calcification in both their arteries and veins, which would affect the Elastic modulus. Previous FSI studies, such as Park et al. [3] (3.36 MPa), Colley et al. [14] (1 MPa) and Jodko et al. [5,6], (3 MPa, and 0.4, 0.55, 0.35 MPa), have all used a much higher Young’s Modulus, as lower values would result in excessive vessel dilation and overlook the affect and constraint of the surrounding tissues. Taking these factors and experimental limitations into consideration, in this study, we have used a higher Young’s modulus of 1.5 MPa. Furthermore, due to experimental limitations, the walls are homogeneous with a thickness of 1 mm. Threaded pipe fittings were attached to the ends of the phantom to secure it into a transparent box and connect it to the rest of the set-up. Pulsatile flow, as illustrated in Figure 2, ( Re av = 1817 , Re max = 2232 ), and steady flow ( Re av = 1817 ) measurements were taken in a plane approximately at the anastomosis. The pulsatile waveform was derived from the same hemodialysis-treated patient that provided the scan for the AVF geometry. The Womersley number, α , and pulsatility index, PI, of the pulsatile waveform that was used in this study were 1.7 and 0.42, respectively.

2.2. PIV Setup

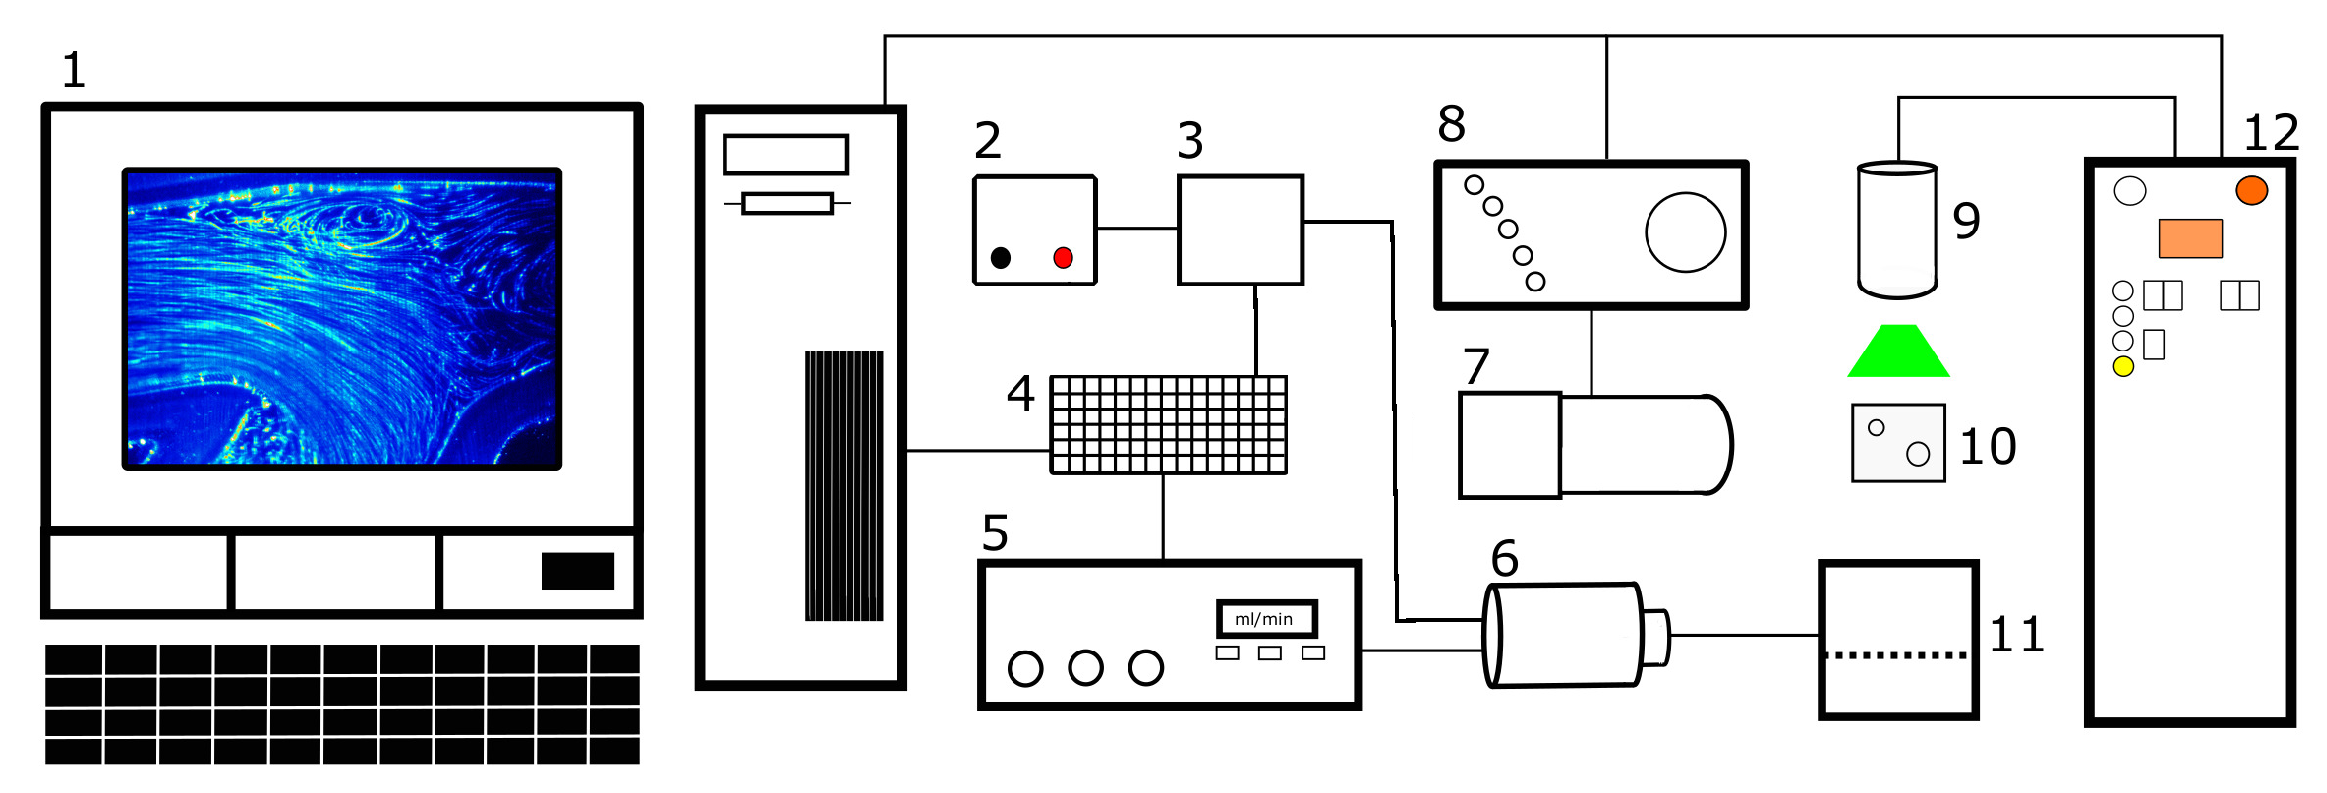
The PIV measurements were recorded by a planar PIV system, as illustrated in Figure 3. The images were recorded with a PIV camera (Imager LX, LaVision, Göttingen, GmbH, Germany) at the anastomosis, where the flow is expected to be the most complex. A Nikon lens (Nikon AF Micro Nikkor 105 mm f/2.8 D) was attached to the camera, resulting in a spatial resolution of 1208 × 1608 pixels. The interrogation window used was 32 × 32 pixels, with a 50% overlap, producing a resolution of 0.24 mm and a vector spacing of 0.12 mm. For steady flow, 300 frame pairs were recorded, and for pulsatile flow, 15 points were recorded on the waveform with 40 frame pairs captured at each point. An exposure time of 95 μ s was used for both steady and pulsatile measurements. In order to check that the temporal acquisition rate was sufficient, a point at a location close to the anastomosis was arbitrarily chosen and the velocity magnitude plotted as a function of time, as shown in Figure 4. This figure shows the same form as that of the imposed flow profile, shown in Figure 2, indicating that the 15 data points across the period of the waveform sufficiently captured the temporal gradients in the flow. Velocity magnitude and streamline plots were compared for steady and phase average results. It was also examined along the pulsatile flow cycle. Two velocity-based shear stress metrics, known as the coefficient of variation and directional variability, were also studied and compared for both models, which can be used to infer temporal wall shear stress gradients (TWSSG) and transverse wall shear stress (TransWSS), respectively.
The flow was illuminated by a double-pulsed Nd-YAG laser (New Wave Solo III-15 Hz, λ = 532 nm). PIV measurements were at taken the anastomosis, as seen in Figure 5 (plane d), where the flow is expected to be the most complex. In total, 20 different planes were recorded with a spacing of 0.3 mm, allowing the 3D-3C flow to be extracted and the complete flow to be inspected. Instead of using correlation averaging, the average of the instantaneous velocity vectors was used to provide more reliable results in areas of unsteady flow [15]. The pumping system was composed of a gear pump linked to an Arduino microcontroller to produce both steady and pulsatile flow (for further details [16]). To simplify the experiment, the distal artery was occluded.

2.3. Test Fluid

The test fluid used to submerge the flow phantom in the transparent box was a mixture of water and glycerol (41.3 wt% and 58.7 wt%, respectively) to reduce the optical distortions by matching the refractive index of the compliant phantom. The resulting density and viscosity are ρ = 1091 kg/ m 3 and μ = 6.23 mPa·s, respectively. The working fluid used was a different mixture of water and glycerol (75.42 wt% and 24.58 wt%, respectively), to reduce the viscosity to achieve the same Reynolds number as the rigid phantom. The density and viscosity are ρ = 1047 kg/ m 3 and μ = 2.26 mPa·s, respectively, resulting in a kinematic viscosity of ν = 2.4 · 10 6   m 2 / s . Ideally, for PIV measurements, it is important that both the working fluid and test fluid are appropriately index matched to reduce optical distortions. For comparison purposes, it is important that the Reynolds and Womersley Number were as close as possible to the rigid phantom measurements. Due to experimental limitations, it was not possible for both the working fluid to be index matched and the Reynolds and Womersley Number to be similar to the rigid phantom experiment; for this reason, the ratio of water and glycerol is different in the working fluid. The flow was seeded with 10   μ m fluorescent polystyrene tracer particles (PS-FluoRed 10.0, Microparticles, GmbH, Germany).

2.4. Experimental Parameters

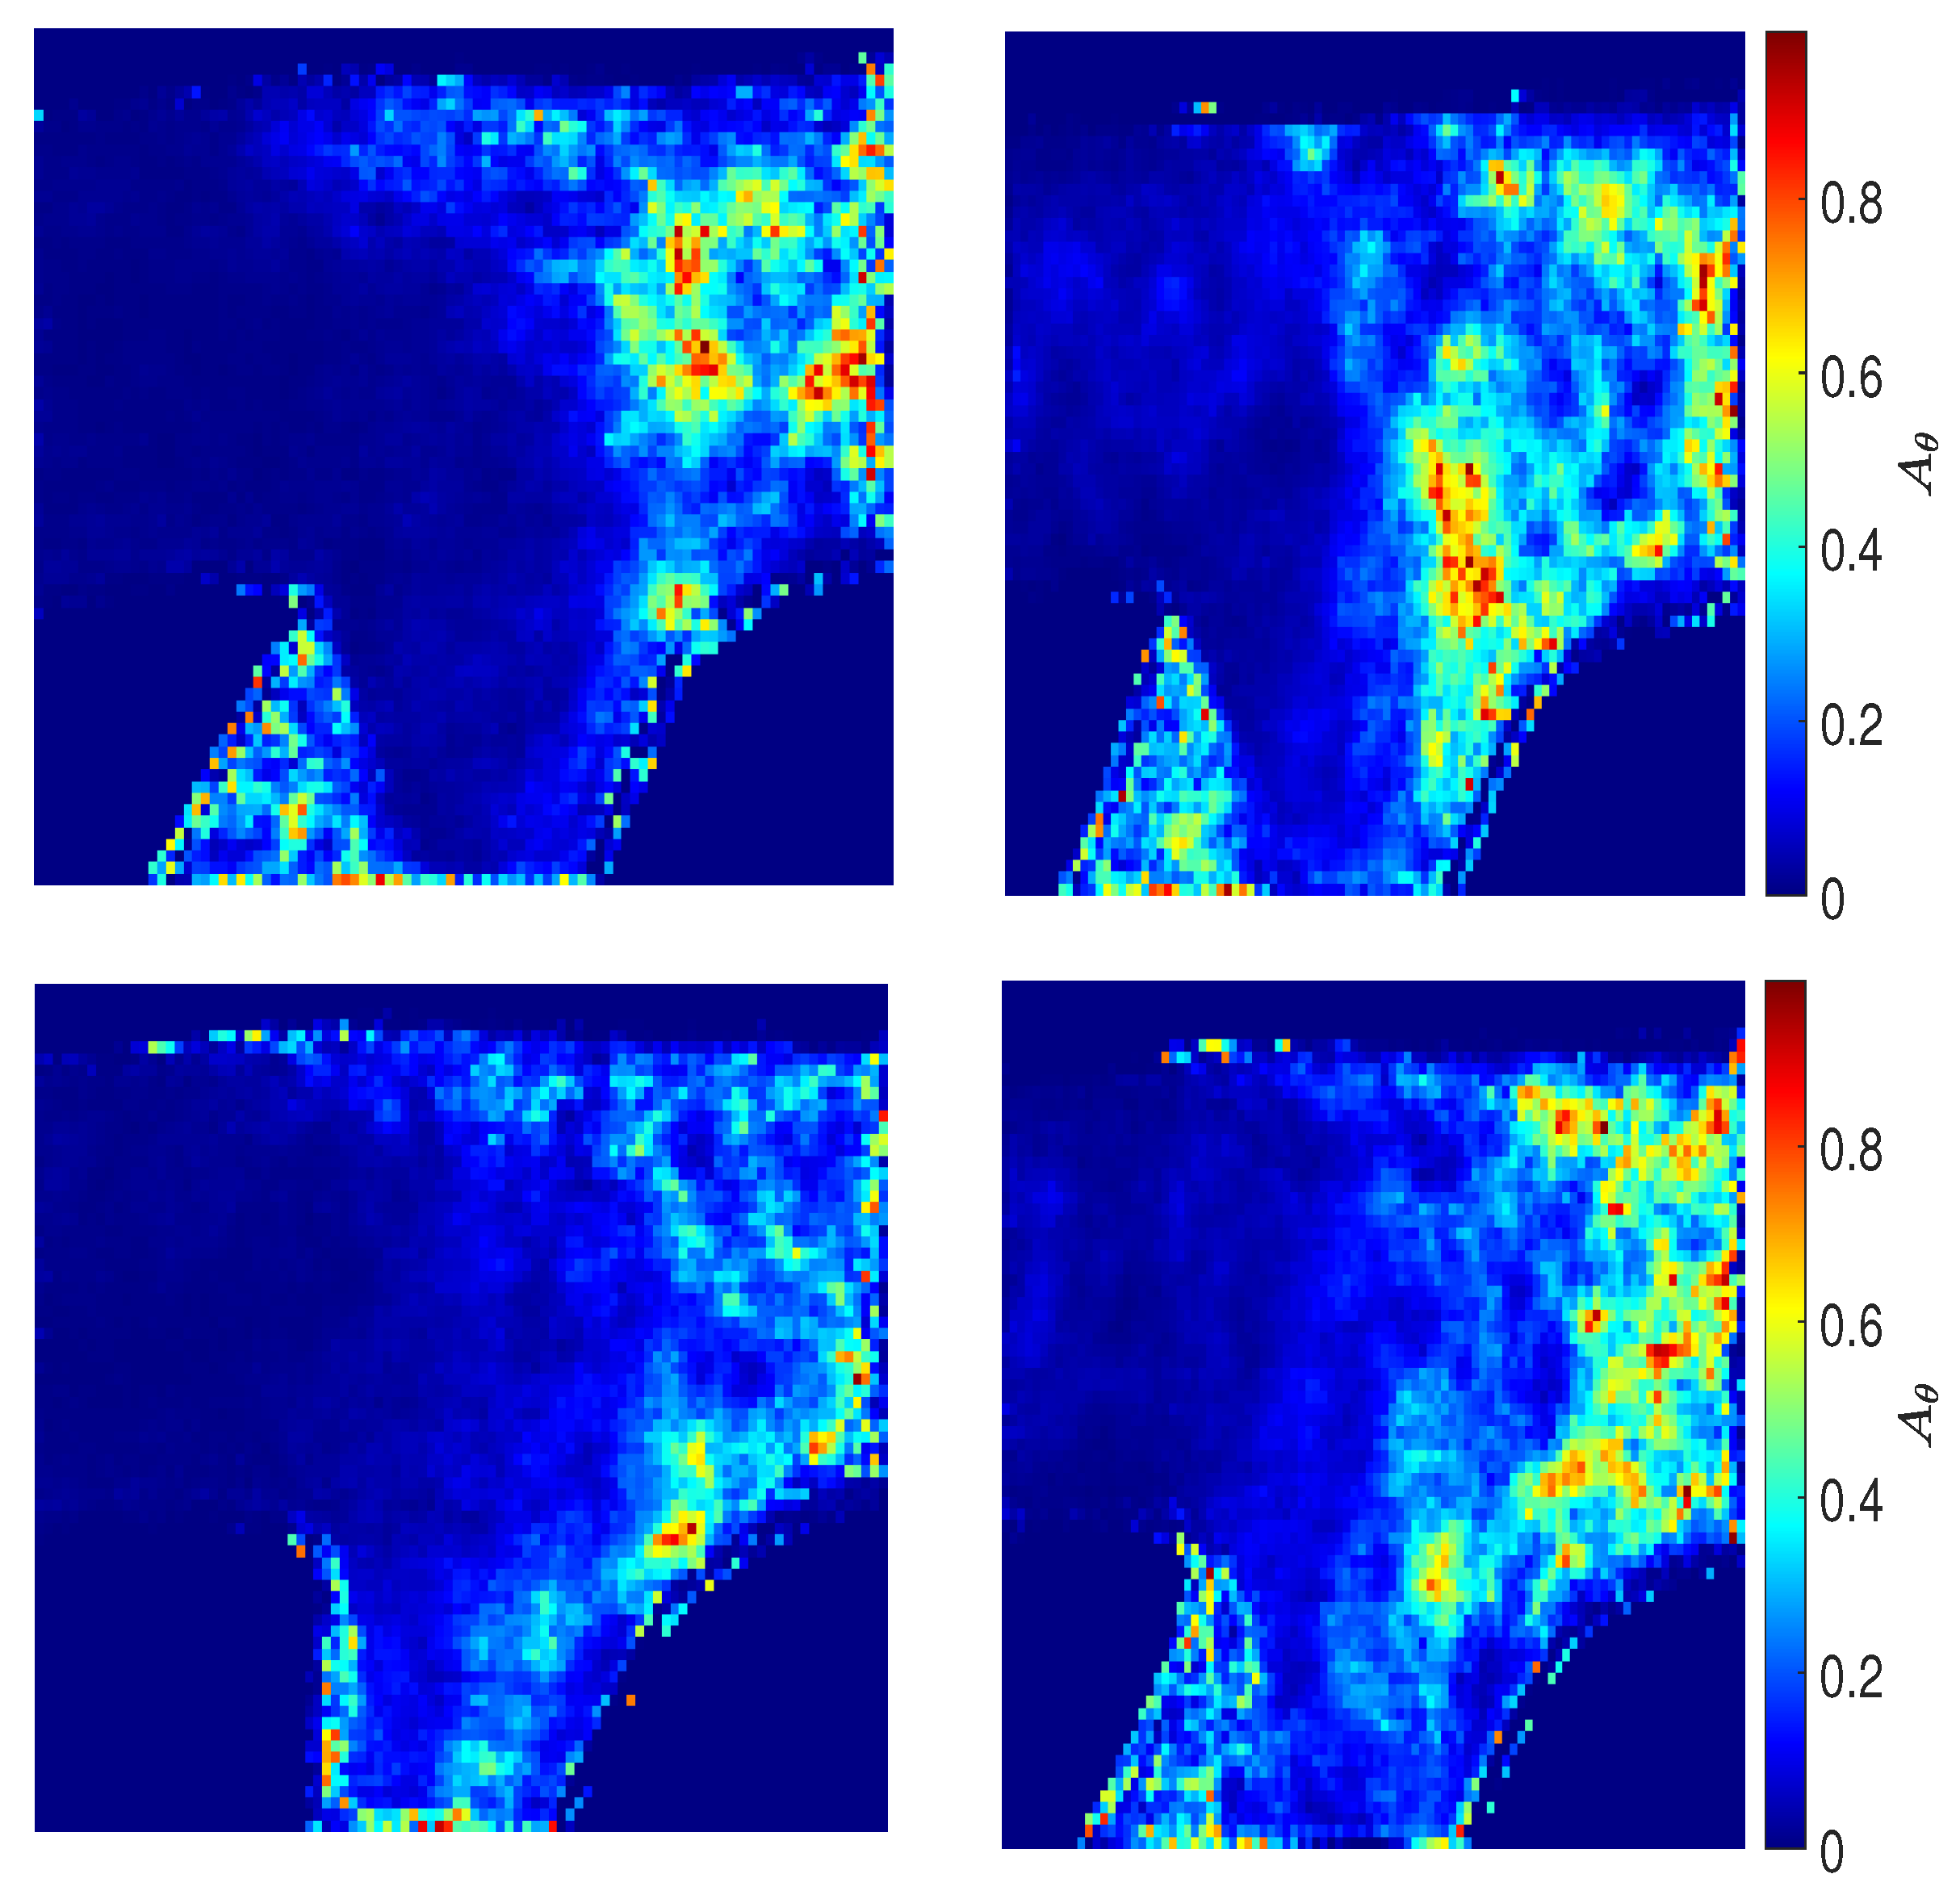
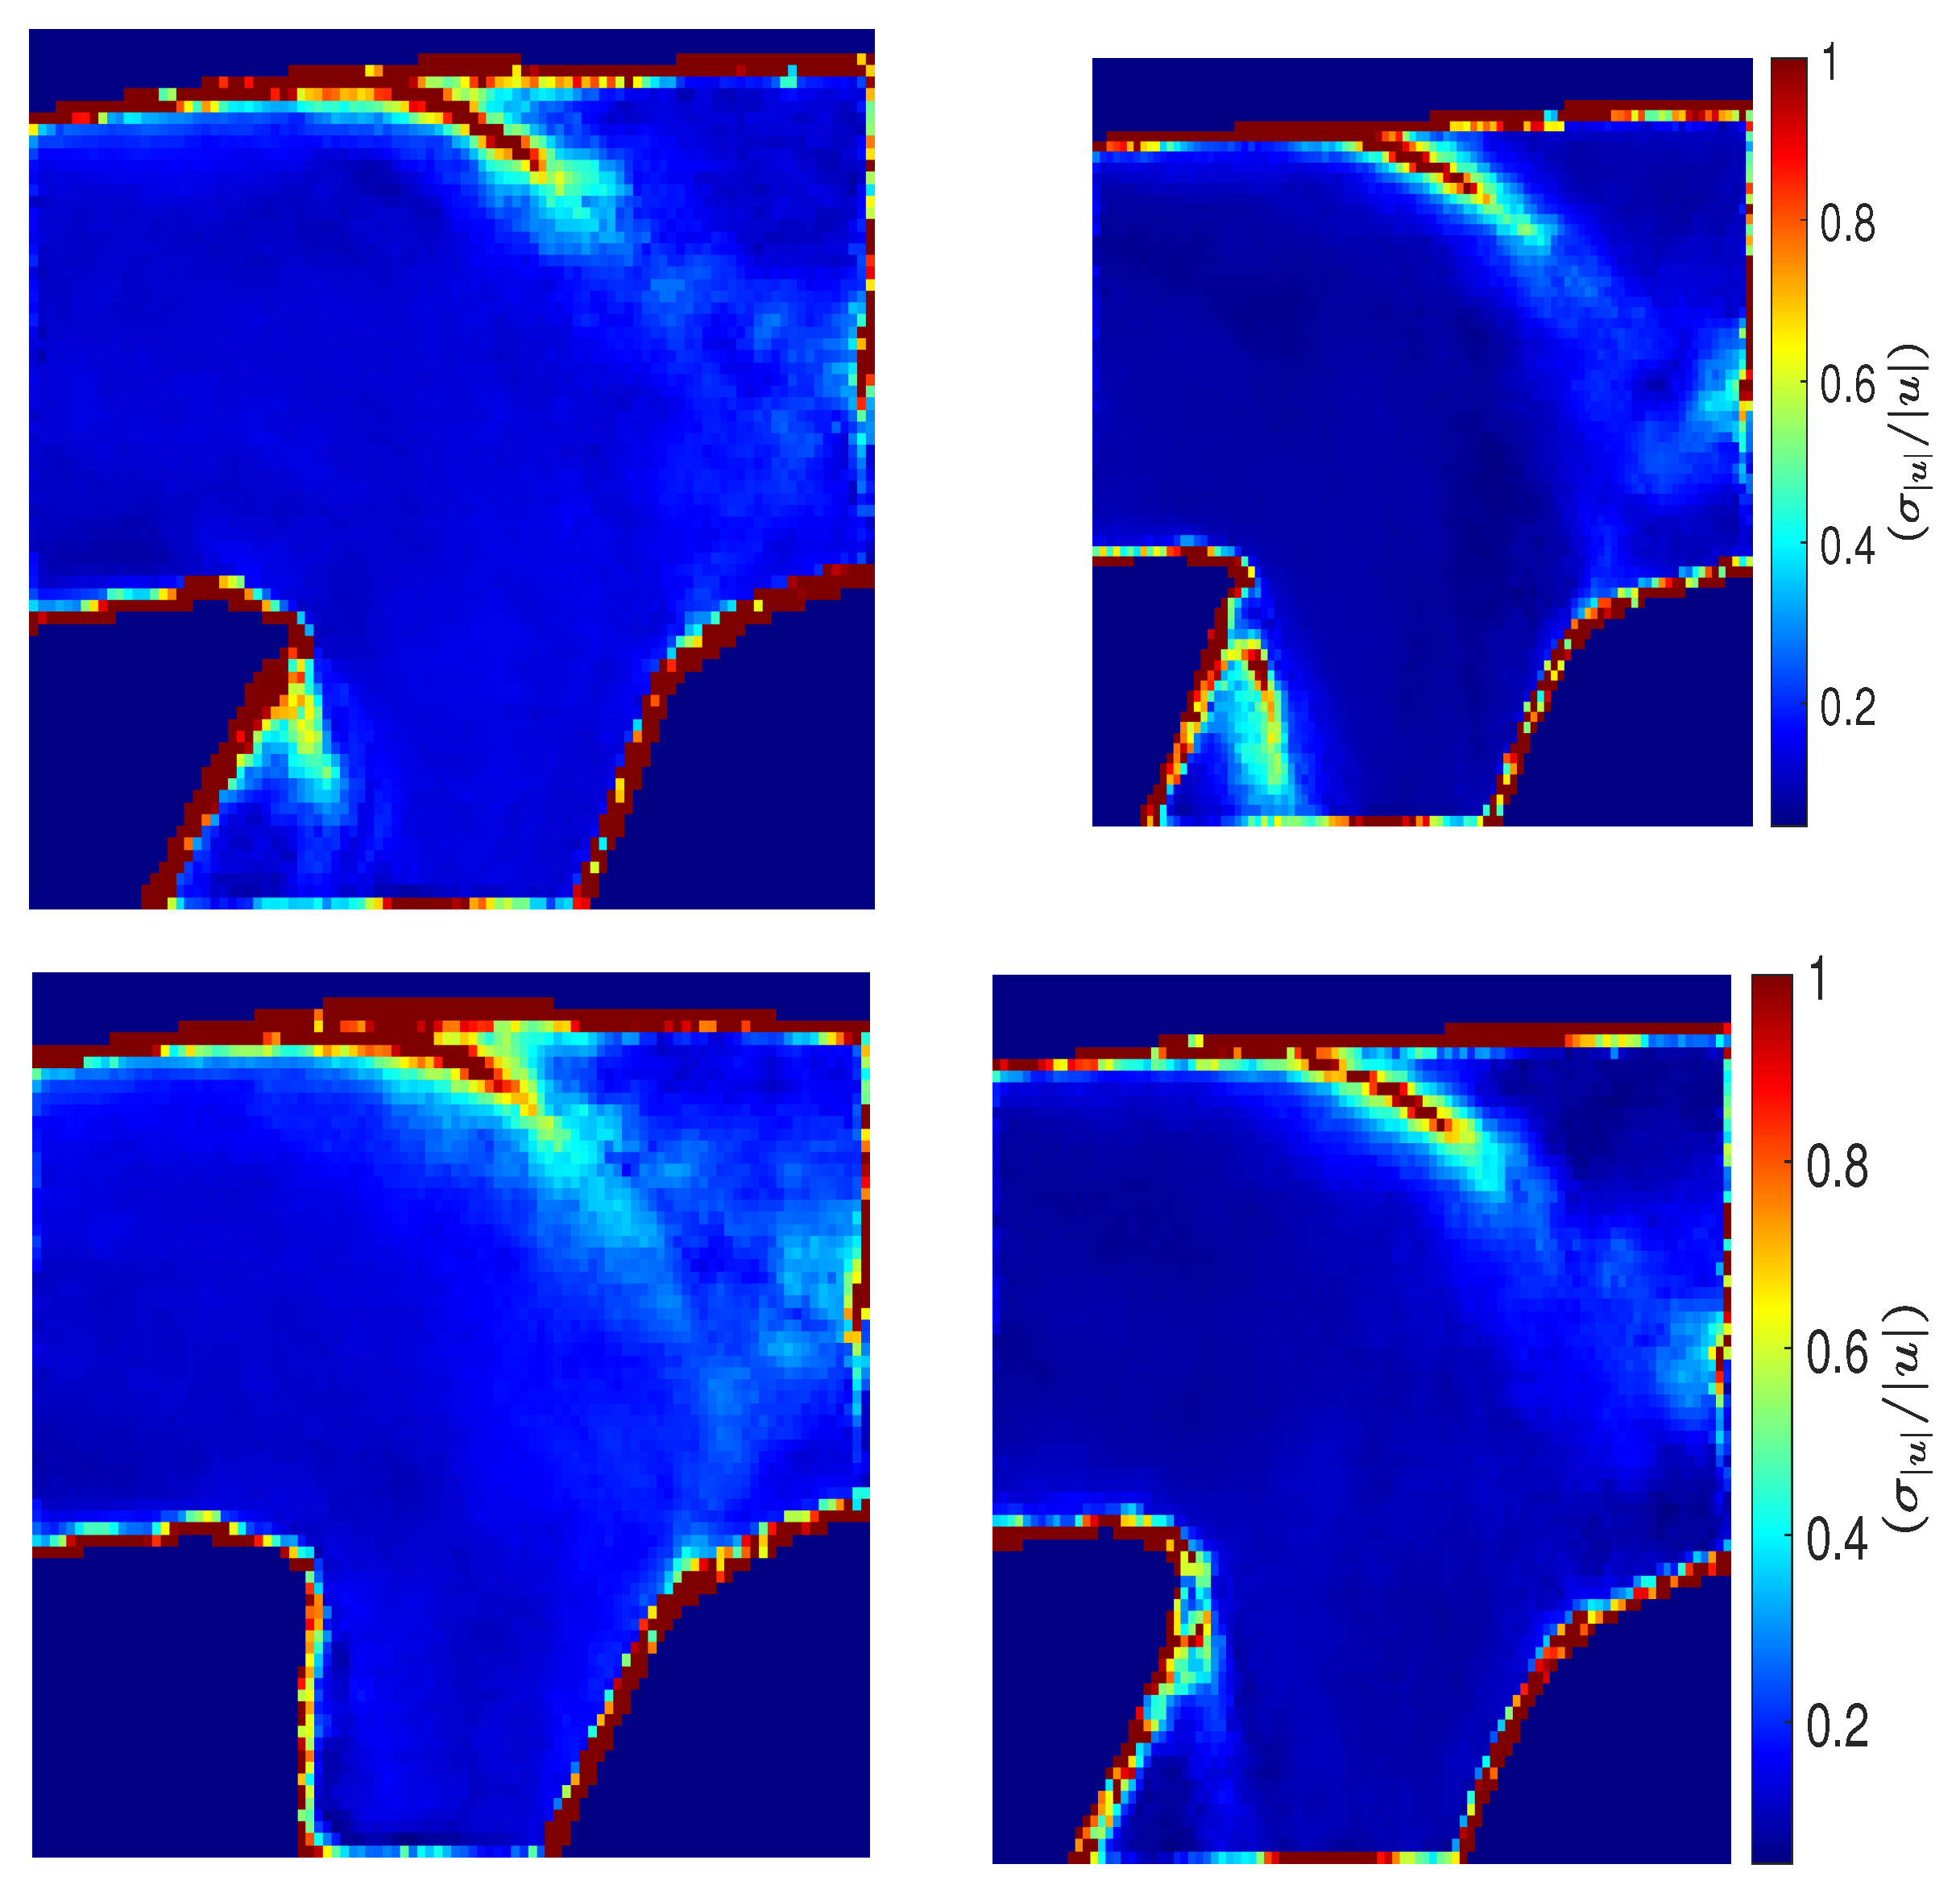
Two velocity-based variables were used to determine the temporal wall shear stress gradient (TWSSG) and transverse wall shear stress (transWSS) experimentally. The coefficient of variation ( σ | u | , rel ), which is the relative standard deviation of the velocity magnitude, is comparable to TWSSG at the walls, while the “directional variability” ( A θ ) ratio of the smallest and largest eigenvalues from principal component analysis (PCA) will correlated with transWSS at the walls, defined, respectively, as:
σ | u | , rel = σ | u | | u | , A θ = e v 2 e v 1 ,
where | u | is the in-plane velocity magnitude, σ | u | is the standard deviation and e v 1 and e v 2 are the eigenvalues of the principal and secondary component, respectively. At A θ = 0 , the flow is completely unidirectional; however, when A θ = 1 , the flow has no preference for direction.

2.5. Out-of-Plane Velocity Component

The complex and irregular geometry of the fistula generates a 3D-3C flow structure. The in-plane velocity fields (u, v) were measured using a planar PIV system, while the third velocity (w) component was estimated using the continuity equation. Before the equation was used, a filtered second-order difference was applied to the in-plane velocity fields to reduce the uncertainty of the out-of-plane velocity. The no-slip condition was applied to the walls for the integration.
w ( x i , y j , z ) = w ( x i , y j , z k ) z k z u x + v y z .

3. Results and Discussion

3.1. PIV Uncertainty

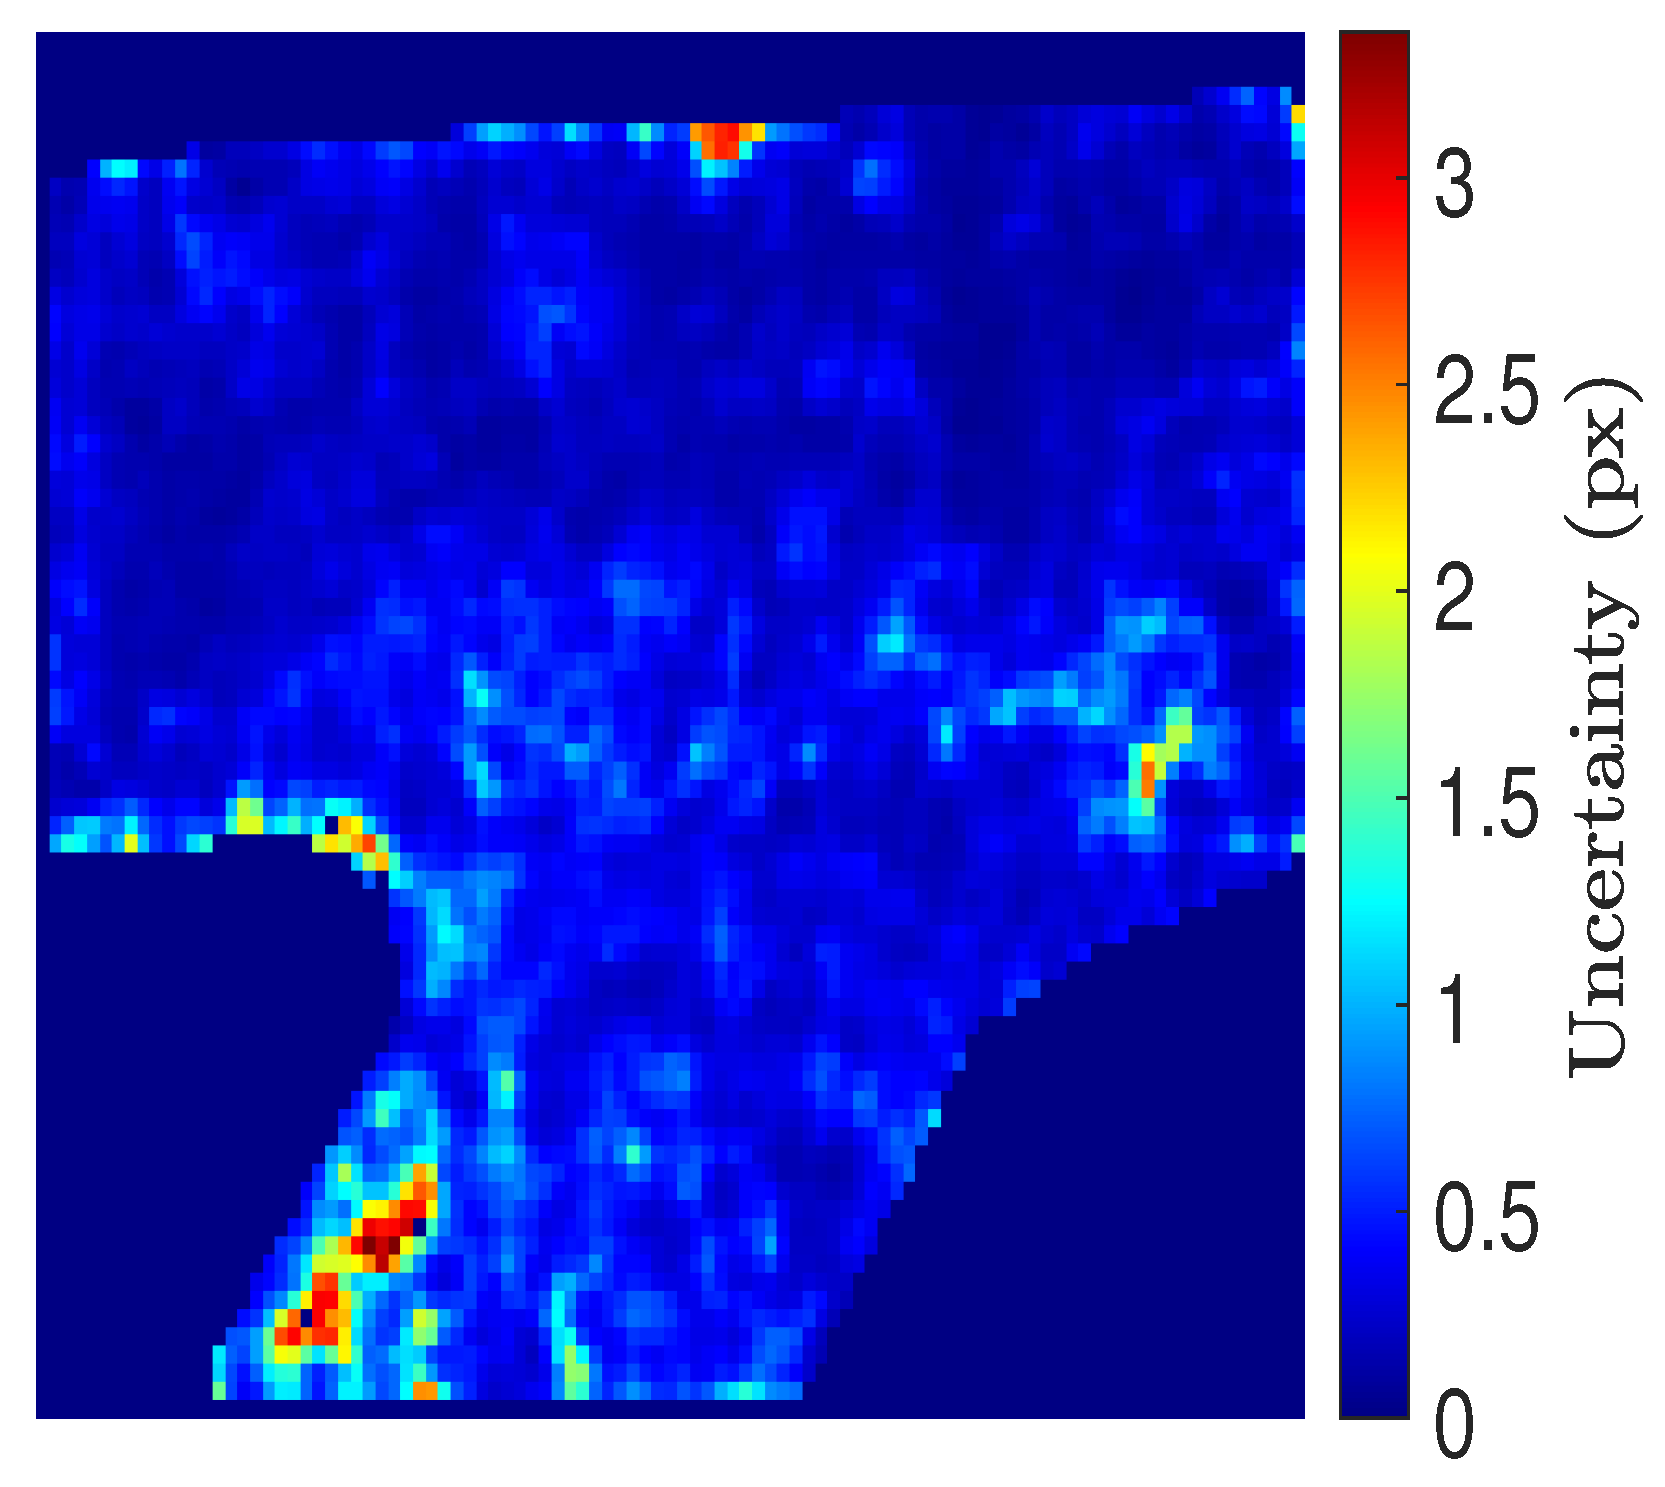
Figure 6 presents the uncertainty of the instantaneous PIV measurements. The uncertainty was calculated using the approach described by Wieneke [17] (built into DaVis software) and is approximately 0.3 pixels on average, close to the ideal uncertainty of 0.1 pixels [18]. The regions of maximum uncertainty vary throughout the 300 image pairs. The uncertainty of the velocity is likely to be influenced by the velocity fluctuations and not the measurement uncertainty.

3.2. Out-of-Plane Velocity

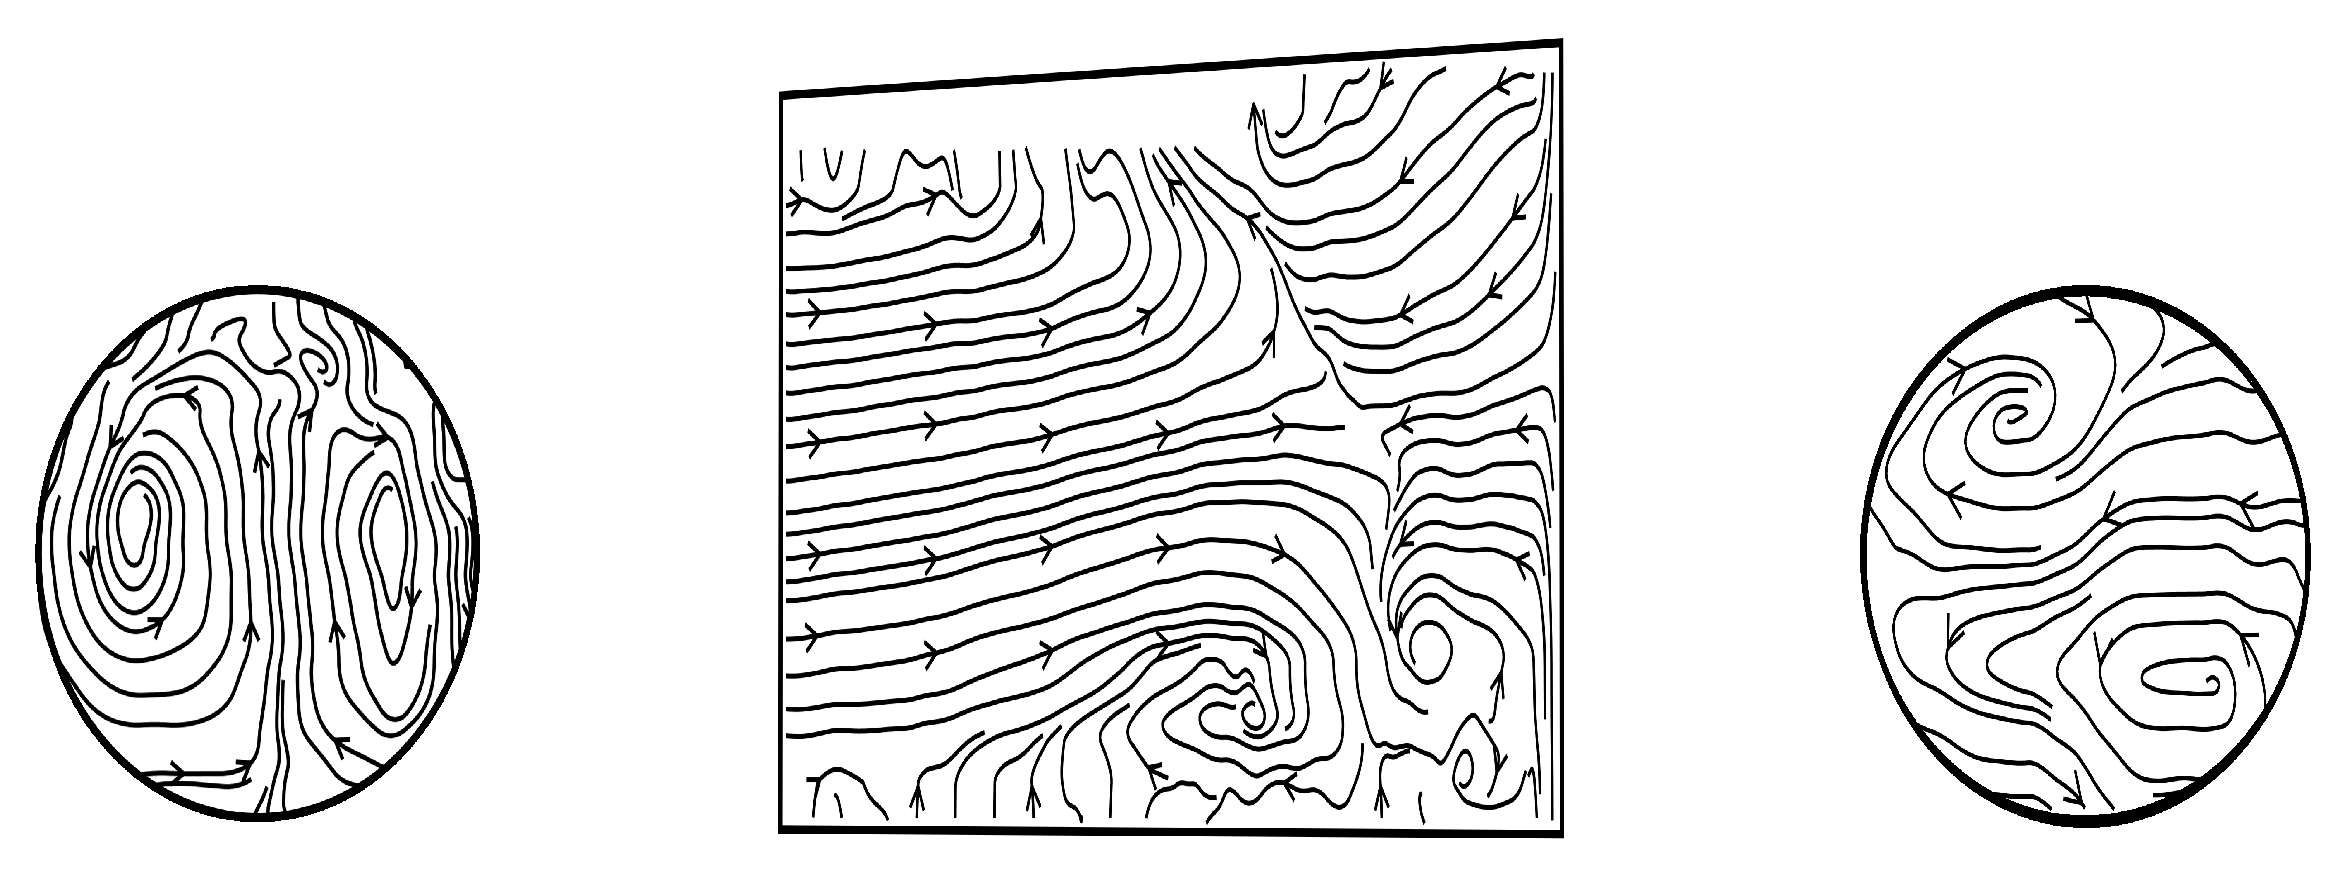
Using the continuity equation, the third velocity component was estimated for the steady flow dataset, allowing for full visualization of the complete 3D-3C flow pattern within the AVF. Streamline plots were used to visualize the complex flow structure in the fistula with slices extracted at the cross-section of the distal artery, longitudinal section of the fistula and cross-section of the anastomosis in Figure 7. In the cross-section of the distal artery, two large vortices are present on either side of the cross-section. The longitudinal section of the artery illustrates the flow entering the field of view from the right, separating near the entrance of the distal artery and wall, leading to the presence of vortices. The cross-section of the anastomosis also displays vortices on the top and bottom of the image. The rapid shift in flow direction at the anastomosis results in the development of multiple vortices of different sizes in each cross-section, leading to flow disturbances within this fistula. Previous AVF studies such as [19,20] also reported the presence of vortices within the fistula. The existence of vortices within the fistula can lead to access recirculation, meaning that the blood in an ESRD patient is not filtered properly, leaving behind toxins which could lead to further complications [21].

3.3. Qualitative Comparison of Rigid and Compliant Measurements

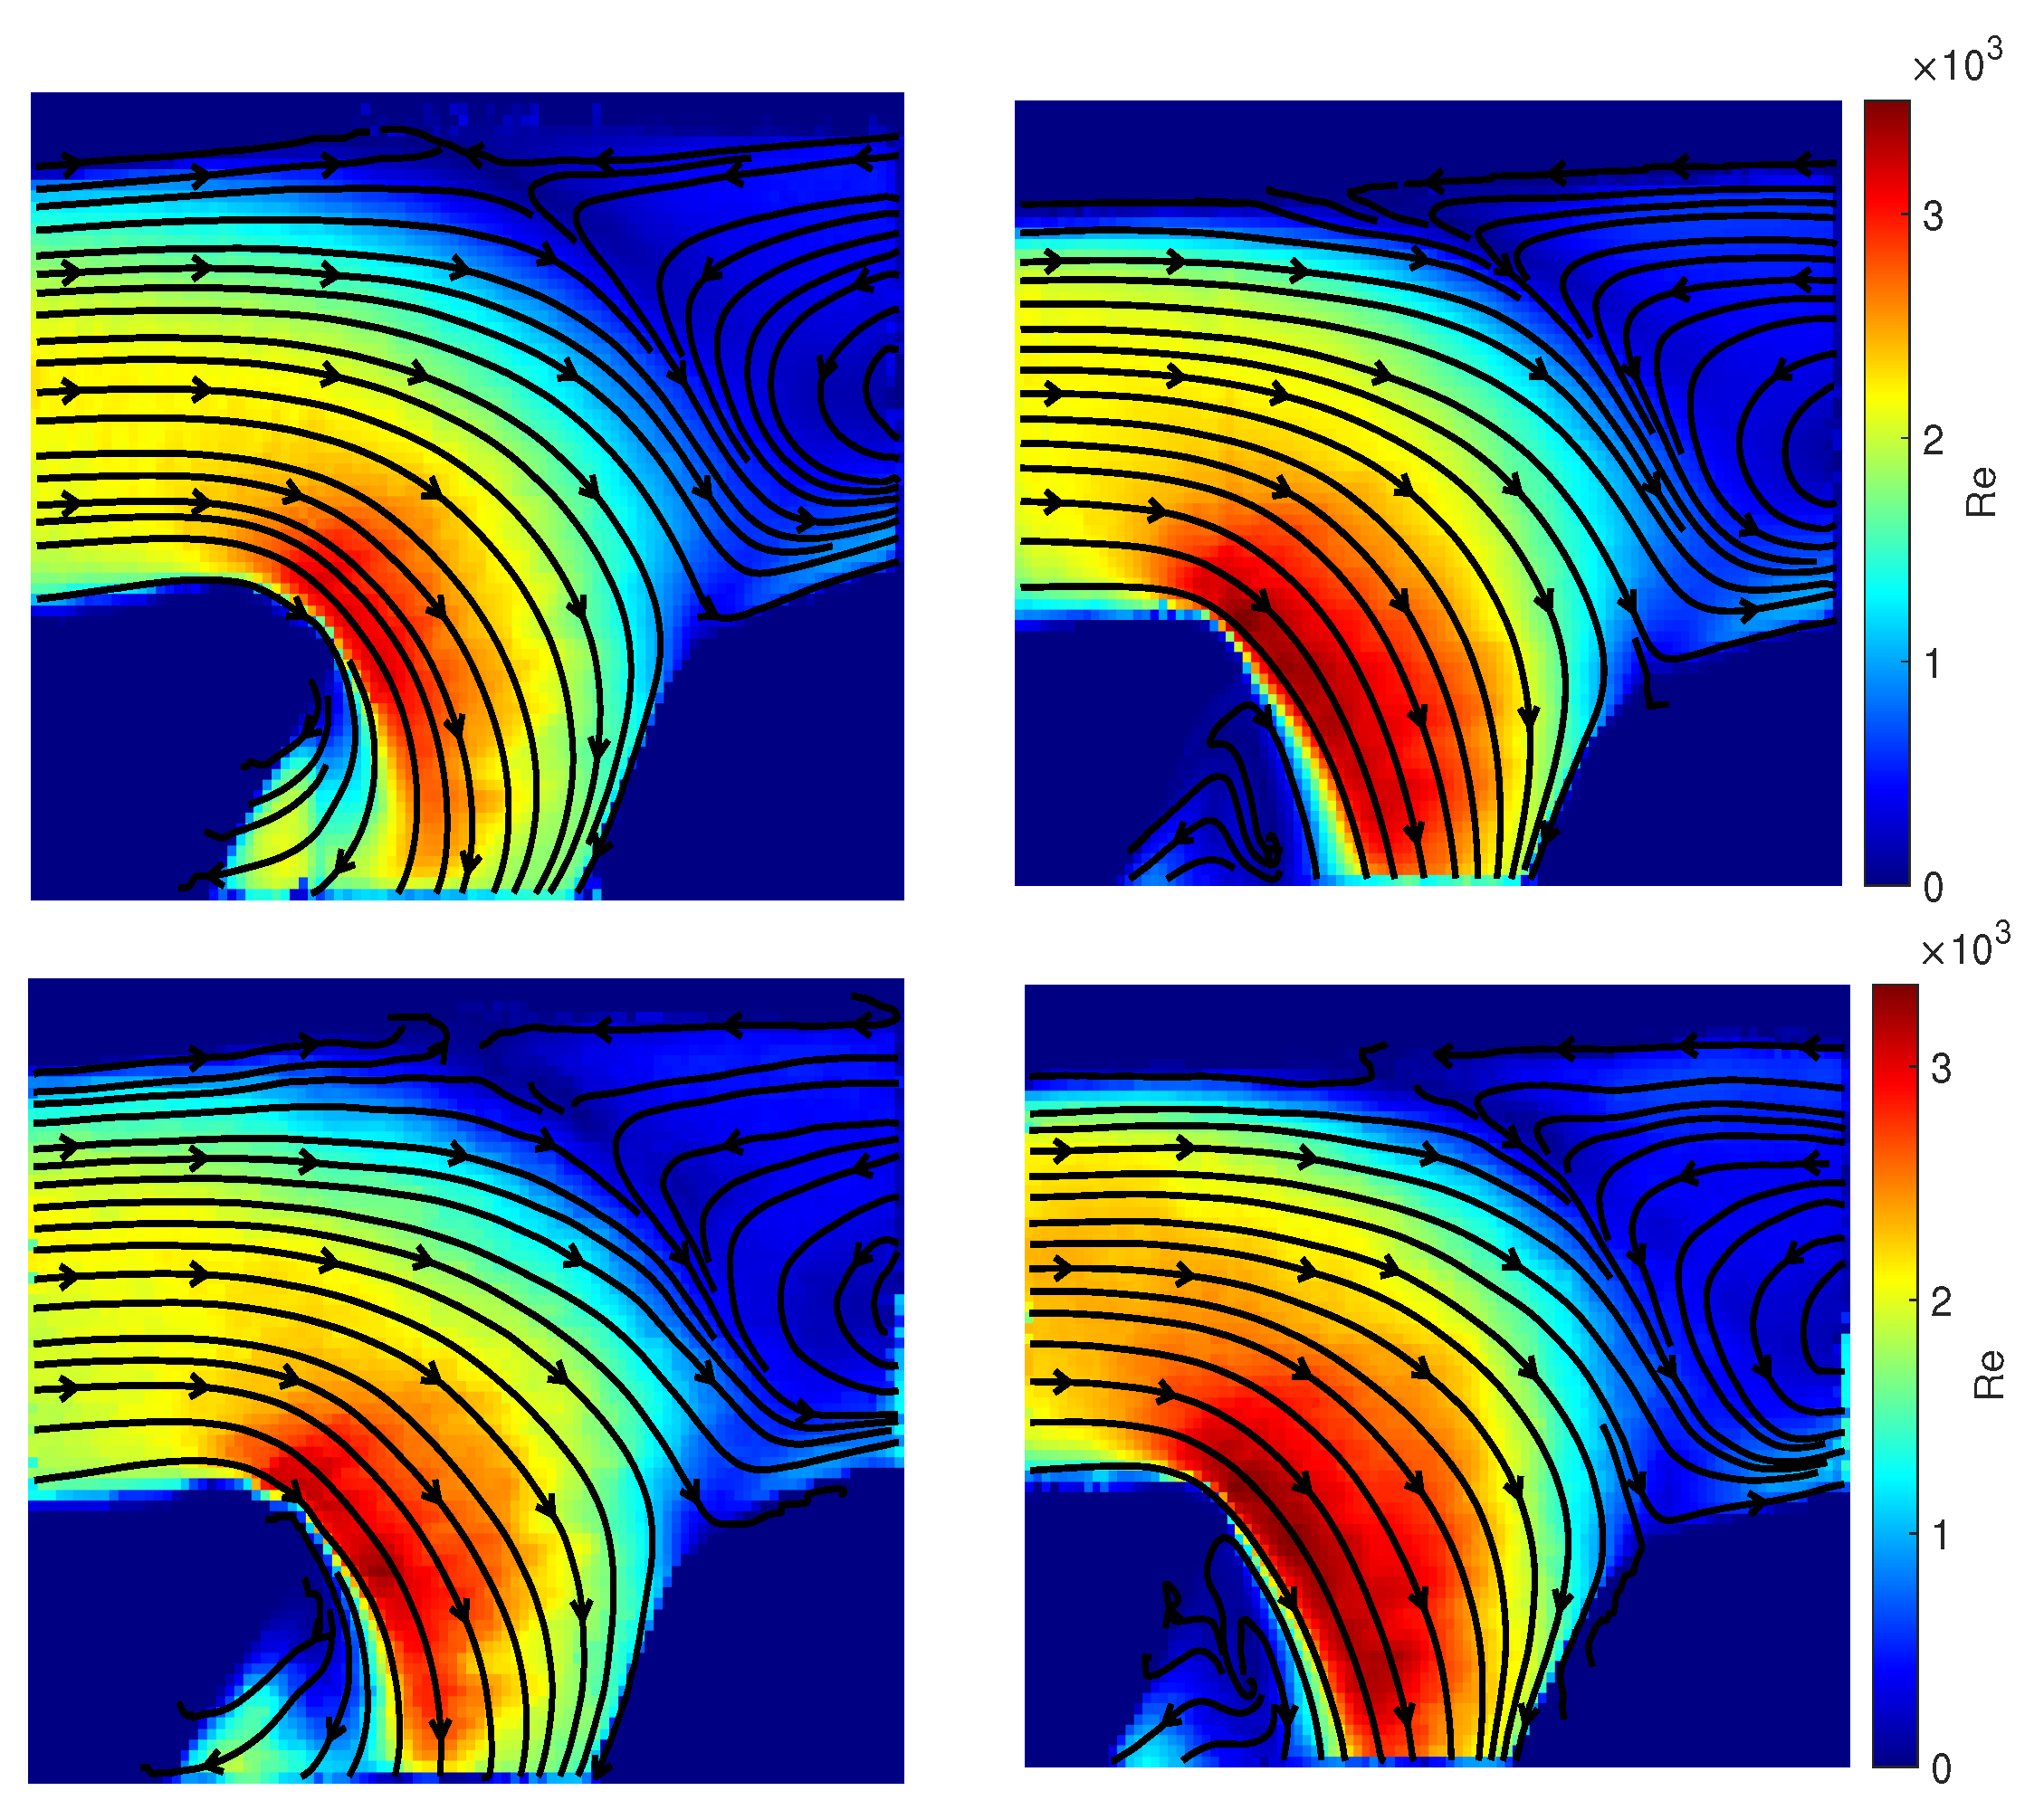
A comparison of the steady flow in the rigid (Re 1817) and compliant ( Re av = 1817 ) phantoms is illustrated in Figure 8. The non-dimensional velocities plots show flow entering through the proximal artery (on the left), rapidly moving into the proximal vein, where it begins to separate at the heel and distal artery. Both rigid and compliant phantoms display similar flow features; however, the rigid model demonstrates lower values of velocity. The streamline plots show a similar flow pattern to the velocity plots, illustrating flow separation in the distal artery and proximal vein, leading to a large recirculation zone in the distal artery and a smaller one at the heel of the anastomosis. The streamline plots also reveal flow impingement on the vessel wall at the toe. To further examine the difference in flow fields between the rigid ( Re av = 1817 , Re max = 2233 ) and compliant ( Re av = 1817 , Re max = 2232 ) models, both phantoms were examined under phase average flow conditions, as seen in Figure 8. The velocity and streamline plots show a similar pattern to steady flow results. Both show flow impingement at the anastomosis toe and flow recirculation in the distal artery and proximal vein, with the largest values of velocity also occurring at the anastomosis heel in both phantoms. Similar to steady flow, the compliant phantom produces higher values of velocity. This suggests that while the rigid phantom is capable of determining the bulk flow, it does not capture the true flow in the fistula. Botti et al. [19] and Browne et al. [20] discovered recirculation regions in the fistula, which can lead to flow instabilities. Recirculation zones can also decrease the adequacy of hemodialysis, which can lead to fistula failure [22].
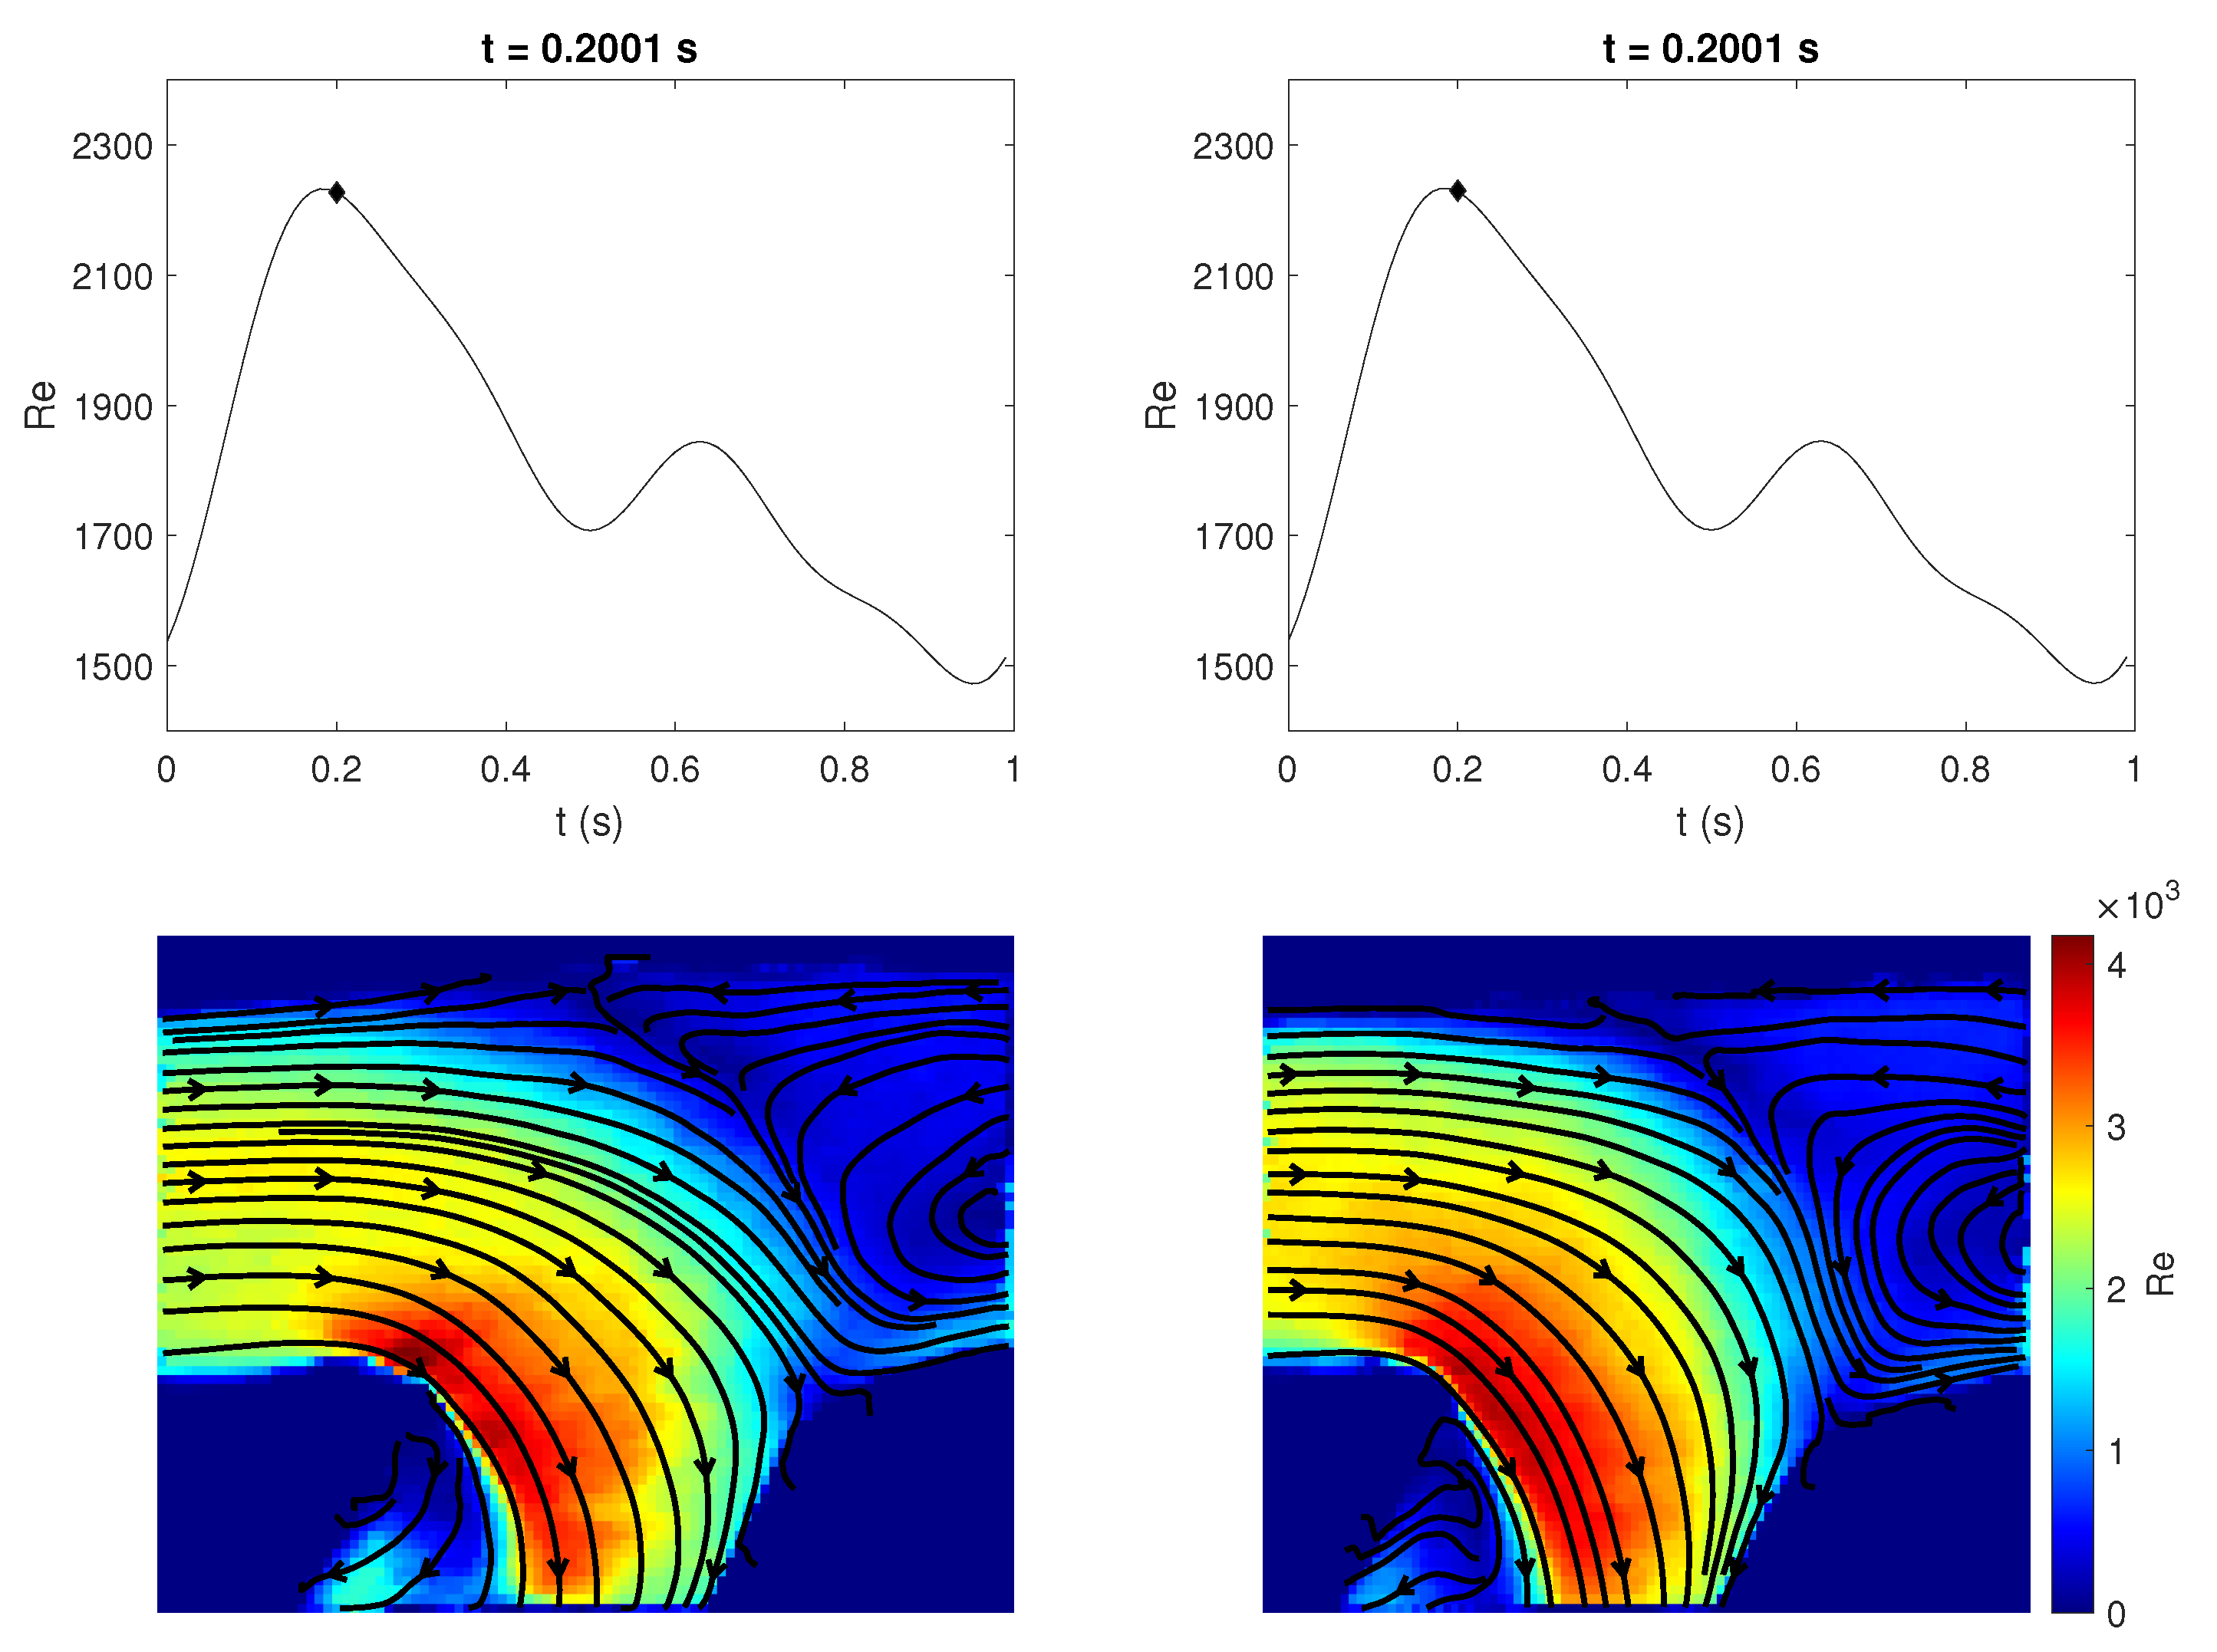
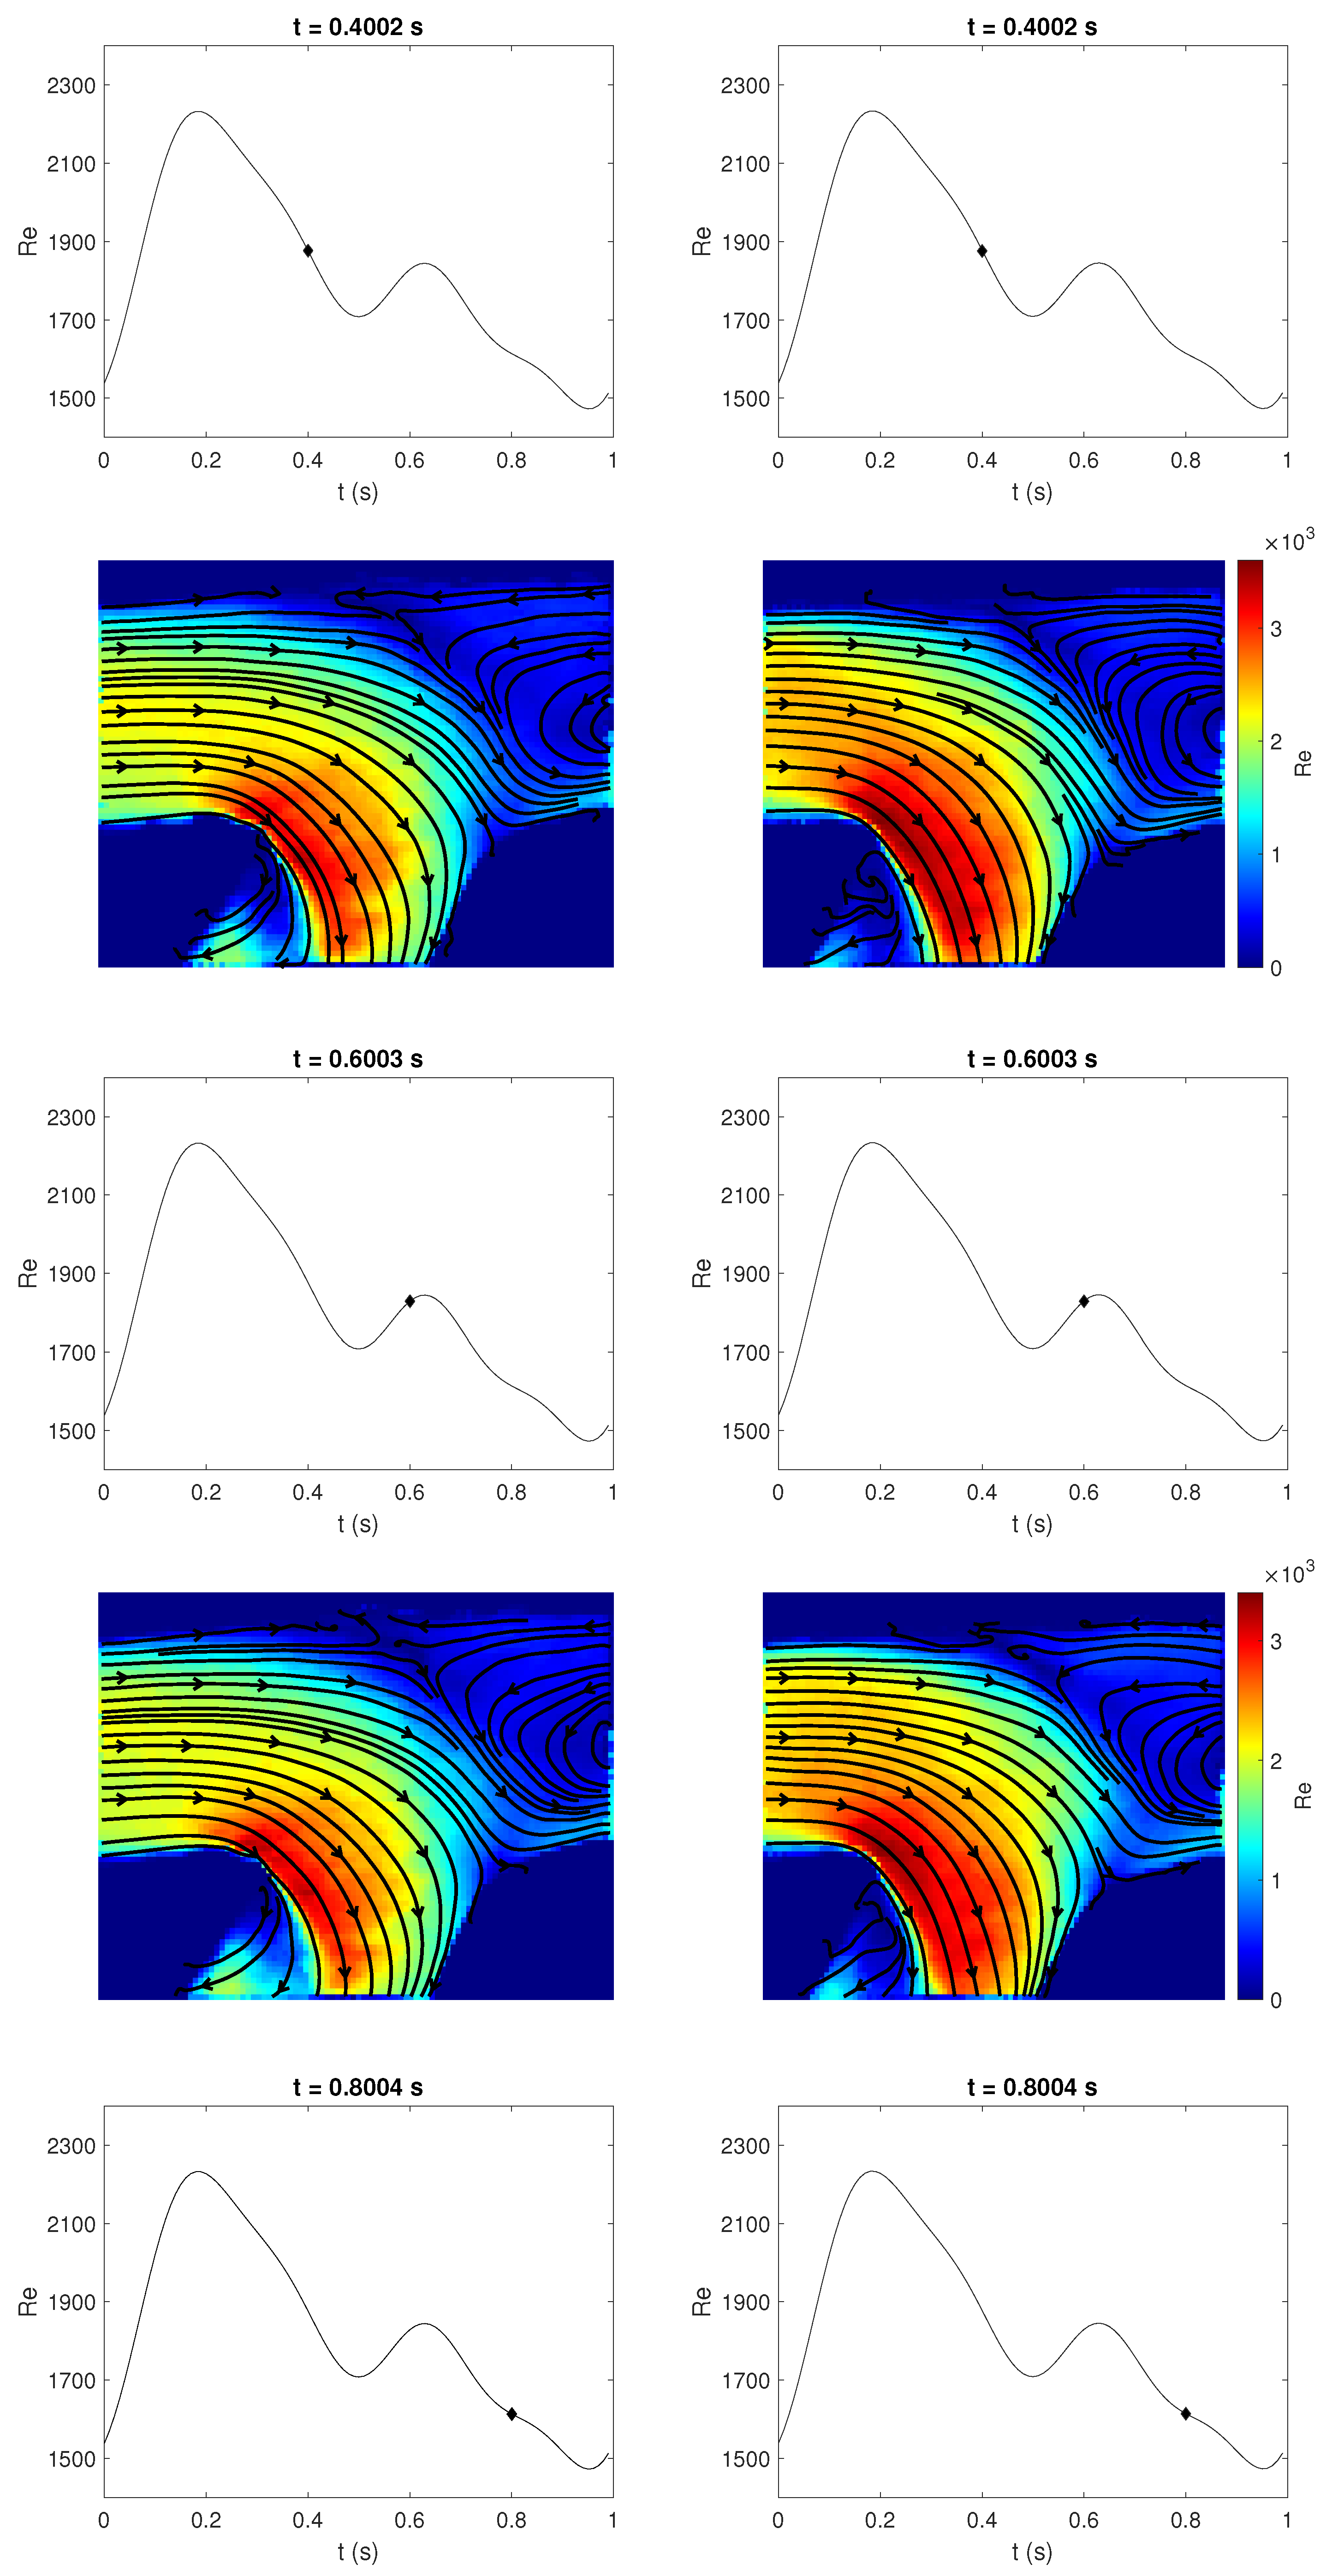
Phase-average flow measurements were recorded at 15 different points on the waveform for both models. The non-dimensional velocity plots with streamlines superimposed onto them were compared for four different time points (t = 0.2001 s, t = 0.4002 s, t = 0.6003 s, t = 0.8004 s) to examine how the bulk flow features vary at different points on the waveform and between the models. Figure 9 exhibits a similar flow structure to Figure 8: the flow enters through the proximal artery and separates in the proximal vein and distal artery, leading to the development of recirculation zones in the distal artery and at the heel, while on the vessel wall at the toe, there is flow impingement. The extent of the recirculation zones do not differ significantly throughout the flow cycle for both phantoms, nor does it vary substantially between the phantoms. Sivanesan et al. [23] observed a similar flow in steady and pulsatile flow, which the authors believe is due to the low pulsatility index. However, as in Figure 8, the rigid phantom underestimates the velocity. This reiterates the suggestion that to capture the flow pattern in a fistula, using a rigid phantom is sufficient, but to accurately predict the velocity, a compliant model would be better suited. Decorato et al. [24] and McGah et al. [9] discovered differences between rigid and FSI models, suggesting that a rigid model does not accurately capture the flow in a fistula.

3.4. Quantitative Comparison of Rigid and Compliant Measurements

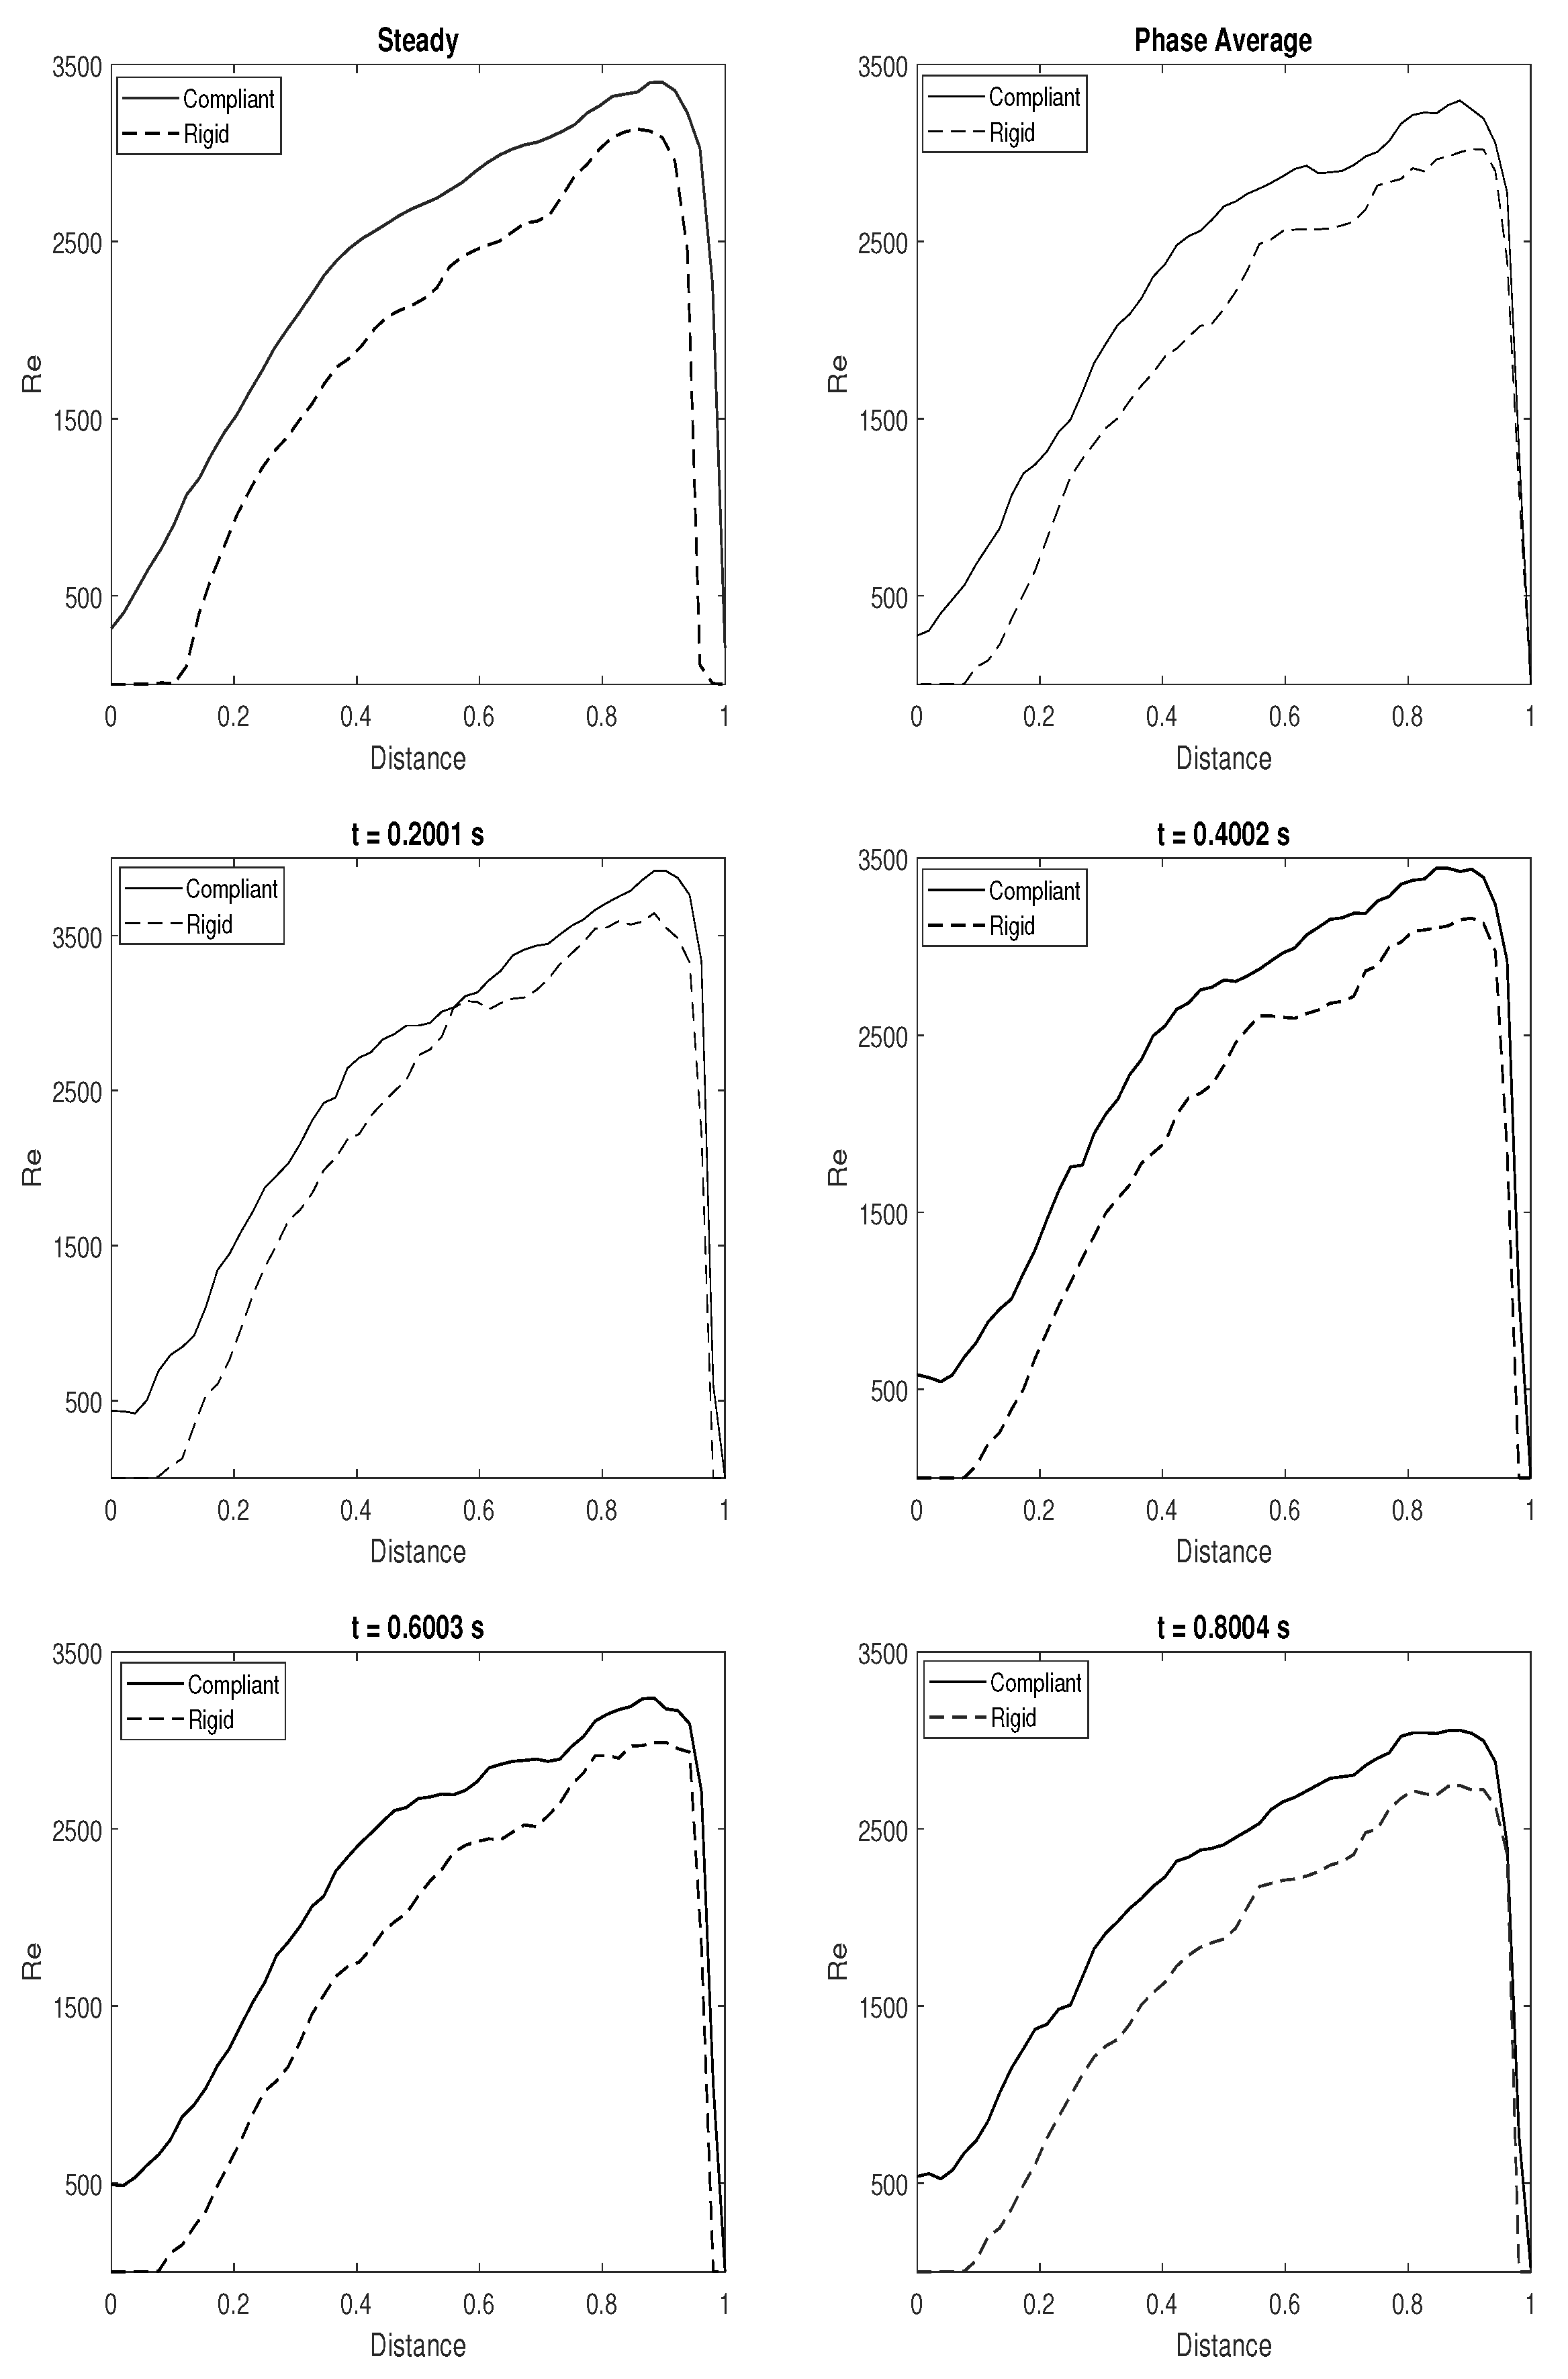
To further examine the effect of wall compliance on AVF hemodynamics, velocity profiles from the rigid and compliant models were compared in Figure 10. These profiles were extracted from the anastomosis, where the flow begins to move into the proximal vein. Both the velocity and distance of the vessel are non-dimensionalized. The rigid and compliant models illustrate a similar flow pattern for both steady (Re = 1817) and phase average pulsatile ( Re av = 1817 ); however, the velocity is determined to be greater (by approximately 8%) in the compliant model. This supports the suggestion that a rigid model does not fully capture the hemodynamics within a fistula. Velocity profiles were also compared between the two models at the four different time points of the waveform. Similar to the velocity magnitude plots, Figure 9, these profiles did not vary significantly between the time points and exhibited a profile which resembles steady flow. Here, the compliant model also presents a larger velocity (average 8% difference), further emphasizing that the rigid phantom underestimates the velocity within a fistula.

3.5. Directional Variability and Coefficient of Variation
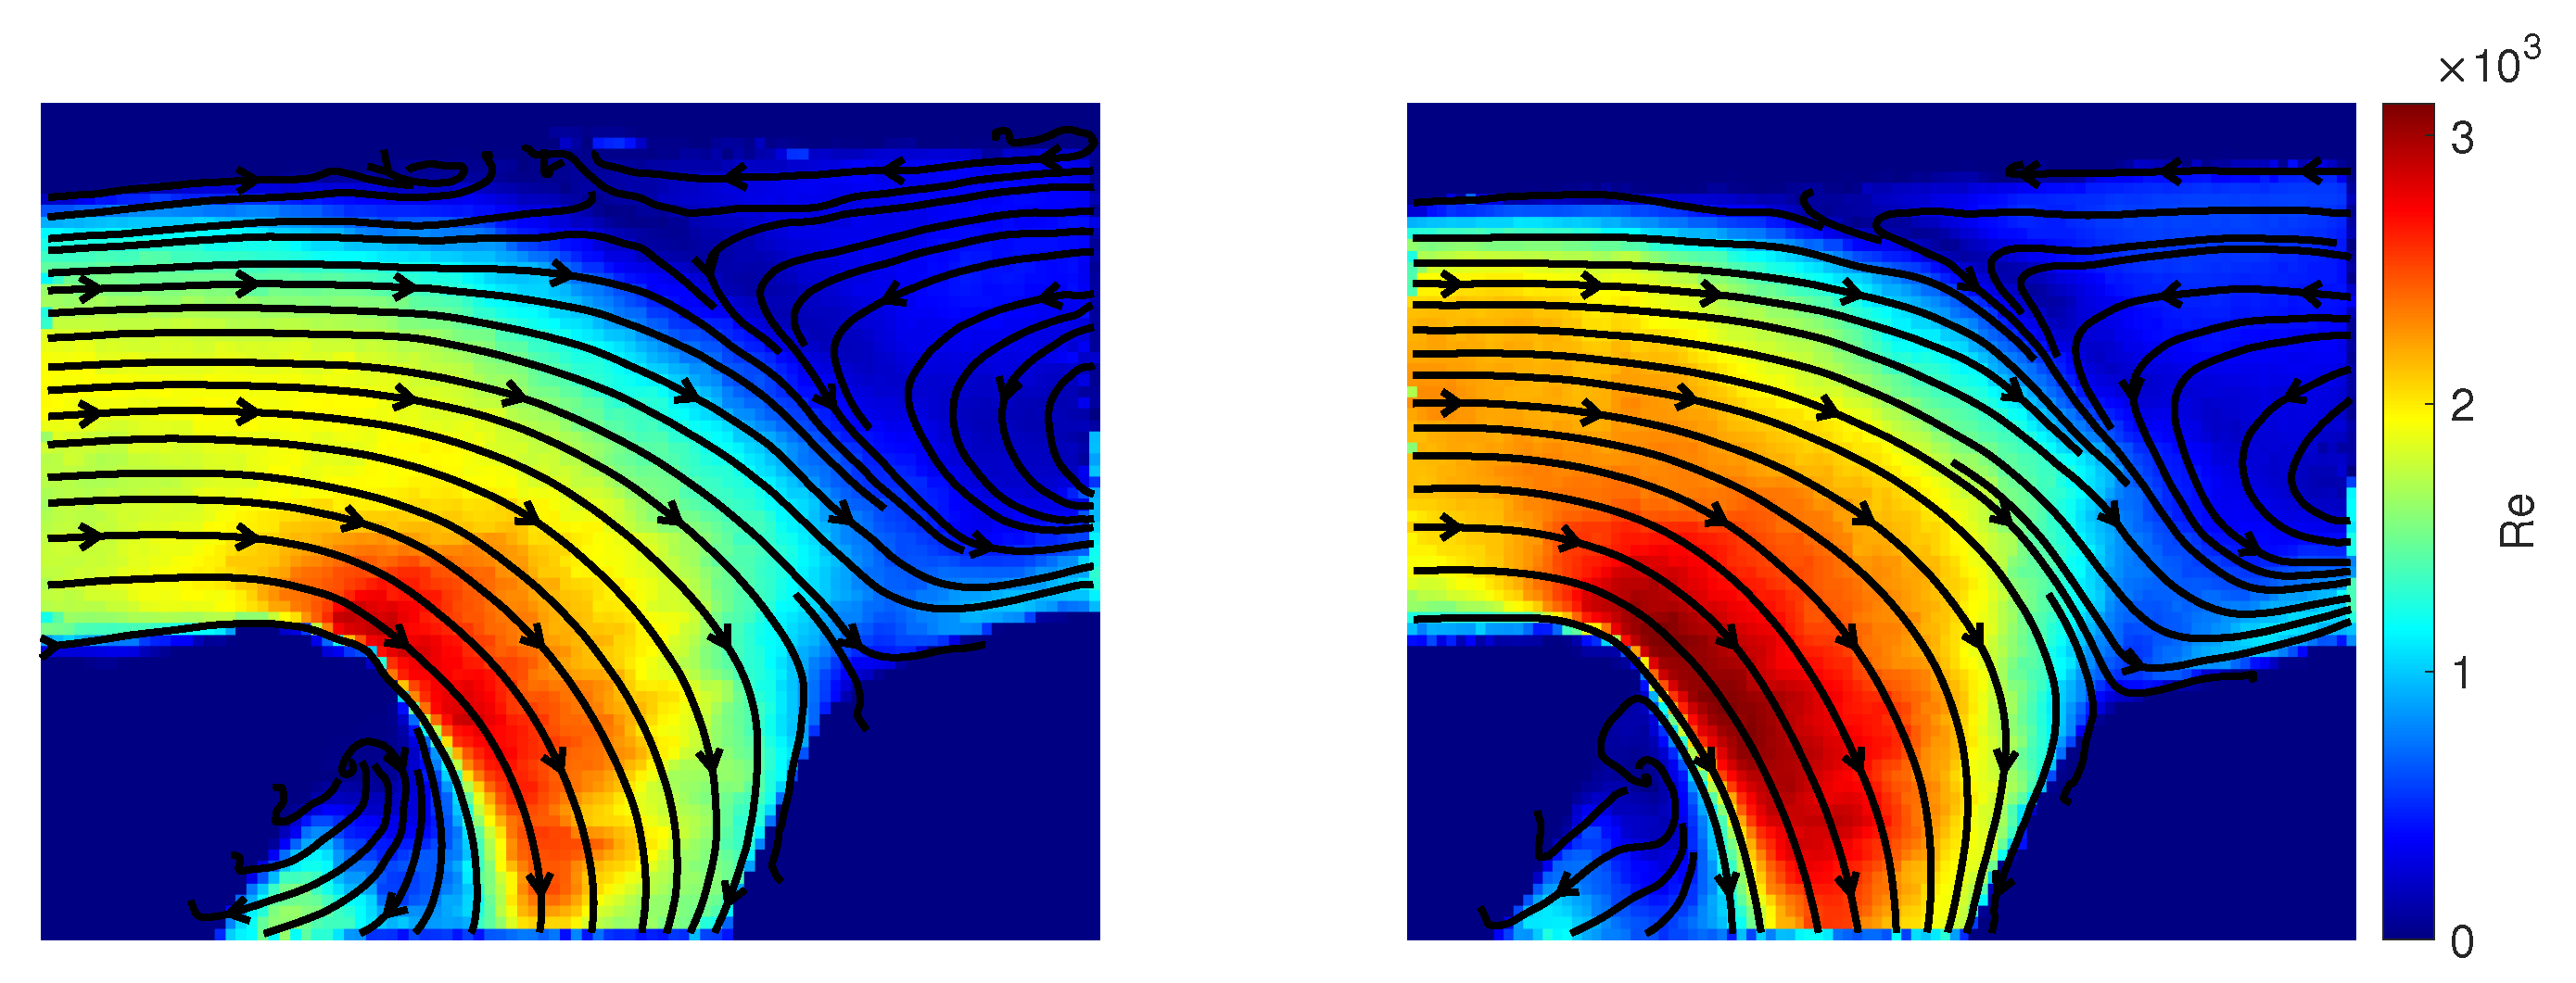
Derived from velocity, directional variability is a parameter which is comparable to transWSS at the walls and ranges from 0, where the flow is unidirectional, to 1, where the flow has no direction preference. It is examined in two different planes to understand the difference between the models. In Figure 11, the directional variability is greatest in the distal artery where the flow begins to separate and recirculate, at the region of flow impingement and at the recirculation zone in the proximal vein. The directional variability in Figure 11 is largest in the recirculation regions in the distal artery and proximal vein as well as the toe, where there is flow impingement. These regions are expected to correlate with regions of high transWSS at the walls. Bozzetto et al. [25] studied four patient-specific AVFs and discovered high levels of transWSS in the juxta-anastomosic vein and at the anastomosis floor for all four AVFs. An investigation of disturbed flow and access recirculation in AVFs by Fulker et al. [26] determined the presence of transWSS in the swing segment, anastomosis and in the region of the venous needle jet impingement. High values of transWSS are believed to result in lesion prevalence [27]. Although there is no substantial difference observed between the values nor the regions of directional variability, there is a difference in the extent of the zones. The directional variability covers a larger region in the distal artery and anastomosis and heel in the compliant phantom. This further reinforces the idea that modeling a rigid phantom is acceptable to capture the bulk flow features in AVFs, but to understand the finer details of the flow, modeling a compliant phantom is necessary. McGah et al. [9] determined that the extent of the TAWSS was larger in the FSI model than the rigid model and concluded that while a rigid model is useful to predict regions of fistula failure, a compliant model is needed to understand thrills and bruits in vascular access.
Figure 10. Non-dimensional velocity profiles.
Biomechanics 02 00014 g010
Another velocity-based parameter investigated in this study is the relative standard deviation, also known as the coefficient of variation. This can be used to infer regions of high TWSSG at the walls. Figure 12 portrays the coefficient of variation in the same planes as Figure 11 to better identify how it varies between a rigid and compliant phantom. The coefficient of variation is quiet low, only established to be high at the walls and where the flow begins to separate in the proximal vein and distal artery for both planes and both phantoms. This further emphasizes that there is no significant difference in the flow structure and shear stresses between this rigid and compliant AVF phantoms. A study by Kharboutly et al. [28] noticed high values of TWSSG in the fistula, which could be associated with calcification plaques.

4. Conclusions

In this study, the influence of wall compliance in a patient-specific fistula was examined. Rigid and compliant flow fields were compared for both steady (Re = 1817) and pulsatile ( Re av = 1817 , Re max = 2232 ) flow conditions. The out-of-plane motion was also investigated.
The streamlines plots of the 3D-3C flow illustrated a complex flow pattern consisting of various vortices of differing sizes, indicating the presence of disturbed flow. These regions of disturbed and recirculating flow are likely to result to fistula failure. When comparing the flow structure between a rigid and compliant model, a similar flow pattern is seen in both. The streamline plots depicted the flow entering from the proximal artery, which separated and recirculated in the distal artery and proximal vein. Flow impingement was also identified at the toe of the anastomosis. Both phantoms exhibited similar non-dimensional velocity patterns, with the highest velocity seen at the anastomosis heel in both models. However, the rigid phantom undervalued the non-dimensional velocity, by approximately 8%. Similarly, differences were also observed in the directional variability results; while it was determined to be highest in regions of flow recirculation in the proximal vein, distal artery and where the flow impinged on the vessel wall, the extent of these regions was larger in the compliant phantom. This suggests the rigid phantom is not able to capture the finer details of the flow. Lastly, the coefficient of variation displayed no significant different between the two models, with the greatest values present in the regions where the flow begins to separate in the distal artery and proximal vein, and at the walls.
With differences determined between the rigid and compliant phantoms, modeling rigid walled fistulas is only sufficient to establish the bulk flow features, but to illustrate the detailed complexity of the flow, a compliant phantom is needed. The boundary condition of the wall should be chosen based on objective of the study. However, one of the main limitations of this study is the exclusion of the role of pressure on wall compliance. Its significance should be examined in a future study.

Author Contributions

Conceptualization, D.N.; methodology, N.A.; software, N.A.; validation, N.A.; formal analysis, N.A.; investigation, N.A.; resources, D.N.; data curation, N.A.; writing—original draft preparation, N.A.; writing—review and editing, N.A. and D.N.; visualization, N.A.; supervision, D.N.; project administration, D.N.; funding acquisition, D.N. All authors have read and agreed to the published version of the manuscript.

Funding

This research was funded by the European Union Seventh Framework Programme for research, technological development and demonstration under grant agreement no. 324487.

Institutional Review Board Statement

Not applicable.

Informed Consent Statement

Not applicable.

Data Availability Statement

The datasets are available from the corresponding author on reasonable request.

Conflicts of Interest

The authors declare no conflict of interest.

Abbreviations

3D-3CThree-Dimensional–Three-Component
4DFour Dimensional
AVFArterio-Venous Fistula
AVGArterio-venous Graft
CFDComputational Fluid Dynamics
CKDChronic Kidney Disease
CVCCentral Venous Catheter
ESRD        End Stage Renal Disease
FSIFluid Structure Interaction
MRIMagnetic Resonance Imaging
PIPulsatility Index
PIVParticle Image Velocimetry
ReReynolds Number
TAWSSTime Averaged Wall Shear Stress
TransWSSTransverse Wall Shear Stress
TWSSGTemporal Wall Shear Stress Gradient
WSSWall Shear Stress

References

  1. Chandra, A.; Mix, D.; Varble, N. Hemodynamic study of arteriovenous fistulas for hemodialysis access. Vascular 2013, 21, 54–62. [Google Scholar] [CrossRef] [PubMed]
  2. Browne, L.D.; Griffin, P.; Bashar, K.; Walsh, S.R.; Kavanagh, E.G.; Walsh, M.T. In Vivo Validation of the In Silico Predicted Pressure Drop Across an Arteriovenous Fistula. Ann. Biomed. Eng. 2015, 43, 1275–1286. [Google Scholar] [CrossRef] [PubMed]
  3. Park, S.C.; Song, R.; Kim, S.; Kim, H.K.; Kim, S.H.; Lee, J. Fabrication of artificial arteriovenous fistula and analysis of flow field and shear stress by using μ-PIV technology. J. Mech. Sci. Technol. 2016, 30, 5503–5511. [Google Scholar] [CrossRef]
  4. de Villiers, A.; McBride, A.; Reddy, B.; Franz, T.; Spottiswoode, B. A validated patient-specific FSI model for vascular access in haemodialysis. Biomech. Model. Mechanobiol. 2018, 17, 479–497. [Google Scholar] [CrossRef] [Green Version]
  5. Jodko, D.M.; Obidowski, D.S.; Reorowicz, P.; Jóźwik, K.; Jodko, D. A two-stage model of an arteriovenous fistula maturation process. Acta Bioeng. Biomech. 2020, 22, 139–153. [Google Scholar] [CrossRef]
  6. Jodko, D.; Palczynski, T.; Reorowicz, P.; Miazga, K.; Obidowski, D.; Jozwik, K. Determination of a Pressure Drop in the Arteriovenous Fistula With Fluid Structure Interaction Simulations and In Vitro Methods. In Proceedings of the ASME International Mechanical Engineering Congress and Exposition, American Society of Mechanical Engineers, Tampa, FL, USA, 3–9 November 2017; Volume 58363, p. V003T04A016. [Google Scholar]
  7. Decorato, I.; Kharboutly, Z.; Vassallo, T.; Penrose, J.; Legallais, C.; Salsac, A.V. Numerical simulation of the fluid structure interactions in a compliant patient-specific arteriovenous fistula. Int. J. Numer. Methods Biomed. Eng. 2014, 30, 143–159. [Google Scholar] [CrossRef]
  8. Decorato, I.; Kharboutly, Z.; Legallais, C.; Salsac, A.V. Comparison of two endovascular treatments of a stenosed arteriovenous fistula: Balloon-angioplasty with and without stenting. Int. J. Artif. Organs 2014, 37, 763–772. [Google Scholar] [CrossRef]
  9. McGah, P.M.; Leotta, D.F.; Beach, K.W.; Aliseda, A. Effects of wall distensibility in hemodynamic simulations of an arteriovenous fistula. Biomech. Model. Mechanobiol. 2014, 13, 679–695. [Google Scholar] [CrossRef] [Green Version]
  10. Stewart, S.F.; Paterson, E.G.; Burgreen, G.W.; Hariharan, P.; Giarra, M.; Reddy, V.; Day, S.W.; Manning, K.B.; Deutsch, S.; Berman, M.R.; et al. Assessment of CFD performance in simulations of an idealized medical device: Results of FDA’s first computational interlaboratory study. Cardiovasc. Eng. Technol. 2012, 3, 139–160. [Google Scholar] [CrossRef]
  11. Hariharan, P.; Giarra, M.; Reddy, V.; Day, S.W.; Manning, K.B.; Deutsch, S.; Stewart, S.F.; Myers, M.R.; Berman, M.R.; Burgreen, G.W.; et al. Multilaboratory particle image velocimetry analysis of the FDA benchmark nozzle model to support validation of computational fluid dynamics simulations. J. Biomech. Eng. 2011, 133, 041002. [Google Scholar] [CrossRef] [Green Version]
  12. Drost, S.; Alam, N.; Houston, J.; Newport, D. Review of experimental modelling in vascular access for hemodialysis. Cardiovasc. Eng. Technol. 2017, 8, 330–341. [Google Scholar] [CrossRef] [PubMed]
  13. Sorace, A.G.; Robbin, M.L.; Umphrey, H.; Abts, C.A.; Berry, J.L.; Lockhart, M.E.; Allon, M.; Hoyt, K. Ultrasound measurement of brachial artery elasticity prior to hemodialysis access placement: A pilot study. J. Ultrasound Med. 2012, 31, 1581–1588. [Google Scholar] [CrossRef] [PubMed]
  14. Colley, E.; Carroll, J.; Thomas, S.; Simmons, A.; Barber, T. Development of a Patient-Specific FSI Model of an Arteriovenous Fistula. Development 2016, 5, 8. [Google Scholar]
  15. Poelma, C.; Westerweel, J. Generalized displacement estimation for averages of non-stationary flows. Exp. Fluids 2011, 50, 1421–1427. [Google Scholar] [CrossRef] [Green Version]
  16. Drost, S.; de Kruif, B.J.; Newport, D. Arduino control of a pulsatile flow rig. Med. Eng. Phys. 2017, 51, 67–71. [Google Scholar] [CrossRef] [Green Version]
  17. Wieneke, B. PIV uncertainty quantification from correlation statistics. Meas. Sci. Technol. 2015, 26, 074002. [Google Scholar] [CrossRef]
  18. Adrian, R.J.; Westerweel, J. Particle Image Velocimetry; Cambridge Aerospace Series; Cambridge University Press: Cambridge, UK, 2011; Volume 30. [Google Scholar]
  19. Botti, L.; van Canneyt, K.; Kaminsky, R.; Claessens, T.; Planken, R.N.; Verdonck, P.; Remuzzi, A.; Antiga, L. Numerical evaluation and experimental validation of pressure drops across a patient-specific model of vascular access for hemodialysis. Cardiovasc. Eng. Technol. 2013, 4, 485–499. [Google Scholar] [CrossRef]
  20. Browne, L.D.; Walsh, M.T.; Griffin, P. Experimental and numerical analysis of the bulk flow parameters within an arteriovenous Fistula. Cardiovasc. Eng. Technol. 2015, 6, 450–462. [Google Scholar] [CrossRef]
  21. Kharboutly, Z.; Deplano, V.; Bertrand, E.; Legallais, C. Numerical and experimental study of blood flow through a patient-specific arteriovenous fistula used for hemodialysis. Med. Eng. Phys. 2010, 32, 111–118. [Google Scholar] [CrossRef]
  22. Javadzadegan, A.; Myo Lwin, N.; Asyraf, M.; Simmons, A.; Barber, T. Analysis of blood flow characteristics in a model of a mature side-to-side arteriovenous fistula. Artif. Organs 2017, 41, E251–E262. [Google Scholar] [CrossRef]
  23. Sivanesan, S.; How, T.; Black, R.; Bakran, A. Flow patterns in the radiocephalic arteriovenous fistula: An in vitro study. J. Biomech. 1999, 32, 915–925. [Google Scholar] [CrossRef]
  24. Decorato, I.; Kharboutly, Z.; Legallais, C.; Salsac, A.V. Numerical study of the influence of wall compliance on the haemodynamics in a patient-specific arteriovenous fistula. Comput. Methods Biomech. Biomed. Eng. 2011, 14, 121–123. [Google Scholar] [CrossRef]
  25. Bozzetto, M.; Ene-Iordache, B.; Remuzzi, A. Transitional flow in the venous side of patient-specific arteriovenous fistulae for hemodialysis. Ann. Biomed. Eng. 2016, 44, 2388–2401. [Google Scholar] [CrossRef] [PubMed]
  26. Fulker, D.; Ene-Iordache, B.; Barber, T. High-resolution computational fluid dynamic simulation of haemodialysis cannulation in a patient-specific arteriovenous fistula. J. Biomech. Eng. 2018, 140, 031011. [Google Scholar] [CrossRef]
  27. Mohamied, Y.; Rowland, E.M.; Bailey, E.L.; Sherwin, S.J.; Schwartz, M.A.; Weinberg, P.D. Change of direction in the biomechanics of atherosclerosis. Ann. Biomed. Eng. 2015, 43, 16–25. [Google Scholar] [CrossRef] [Green Version]
  28. Kharboutly, Z.; Fenech, M.; Treutenaere, J.; Claude, I.; Legallais, C. Investigations into the relationship between hemodynamics and vascular alterations in an established arteriovenous fistula. Med. Eng. Phys. 2007, 29, 999–1007. [Google Scholar] [CrossRef]
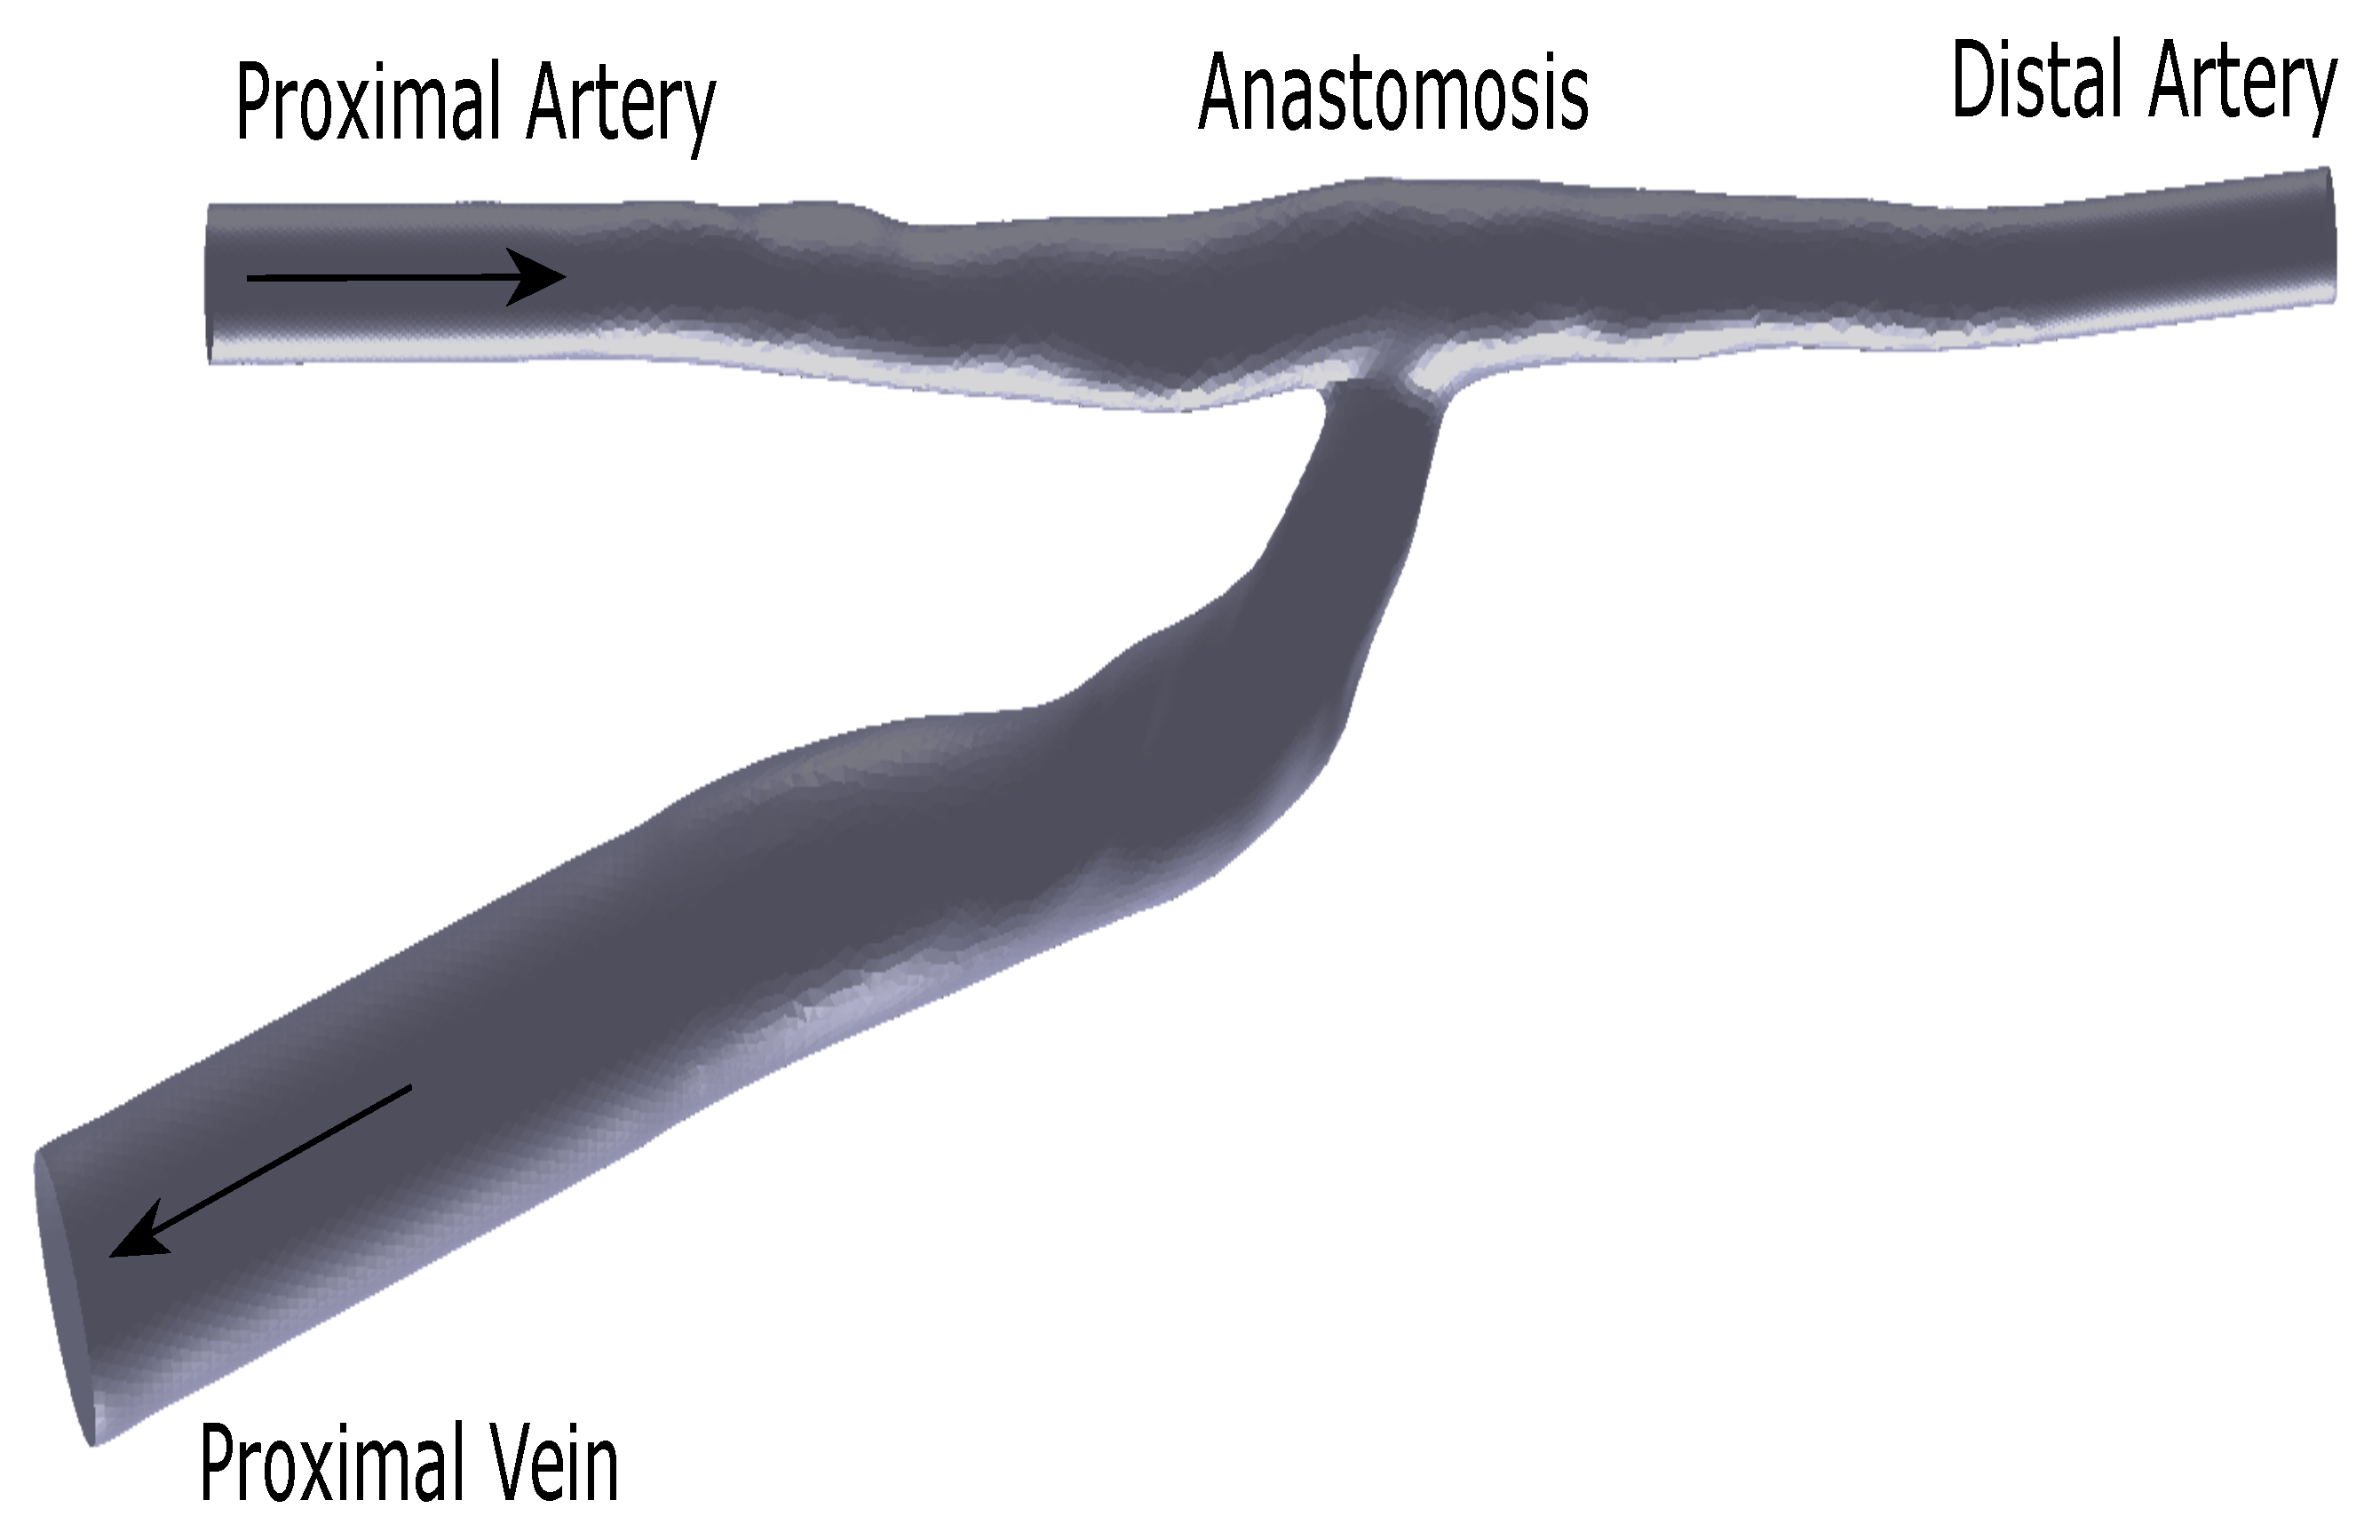
Figure 1. Labeled model of the AVF, with arrows denoting direction of flow.
Biomechanics 02 00014 g001
Figure 2. Waveform used for pulsatile flow measurements; open circles mark the timing of PIV recordings ( Re av = 1817 , Re max = 2232 , α = 1.7, PI = 0.42) with time on the x-axis and flow rate on the y-axis.
Biomechanics 02 00014 g002
Figure 3. Schematic of experimental setup: 1. PC, 2. Power Supply, 3. Solid State Relay, 4. Microcontroller, 5. Flow meter, 6. Gear Pump, 7. PIV Camera, 8. PTU System, 9. Light Arm, 10. AVF Phantom, 11. Reservoir, 12. Double Pulsed Laser.
Biomechanics 02 00014 g003
Figure 4. Waveform from PIV measurements with time on the x-axis and velocity on the y-axis.
Biomechanics 02 00014 g004
Figure 5. Geometry of fistula illustrating locations of the results. Plane a. cross-section of distal artery, plane b. longitudinal section of the fistula, plane c. cross-section of the anastomosis and plane d. plane where PIV measurements were recorded.
Biomechanics 02 00014 g005
Figure 6. Uncertainty of the instantaneous PIV displacement field.
Biomechanics 02 00014 g006
Figure 7. Streamline plots of steady (Reynolds Number = 1817) flow (left) in the cross-section of the distal artery, (middle) in the longitudinal section of the artery and (right) in the cross-section of the anastomosis.
Biomechanics 02 00014 g007
Figure 8. Comparison of non-dimensional velocity and streamline plots rigid and compliant arterio-venous fistula models under (top) steady flow (Reynolds Number = 1817) and (bottom) phase average (Reynolds Number = 1817).
Biomechanics 02 00014 g008
Figure 9. Streamline and non-dimensional velocity plots (left) rigid phantom and (right) compliant phantom with time points above.
Biomechanics 02 00014 g009aBiomechanics 02 00014 g009bBiomechanics 02 00014 g009c
Figure 11. Directional variability in (left) rigid phantom and (right) compliant phantom, where (top) is plane d and (bottom) is 0.6 mm from plane d.
Biomechanics 02 00014 g011
Figure 12. Coefficient of variation in (left) rigid phantom and (right) compliant phantom, where (top) is plane d and (bottom) is 0.6 mm from plane d.
Biomechanics 02 00014 g012
Publisher’s Note: MDPI stays neutral with regard to jurisdictional claims in published maps and institutional affiliations.