1. Introduction
Competitive canoe slalom performance relies on the athlete’s ability to negotiate a set course as quickly as possible. Courses consist of 18–25 numerically sequenced gates, consisting of two poles (≥1.2 m apart), suspended above the water, over a section of river 150–400 m length. In order not to acquire time penalties (2 s for hitting a gate, 50 s for missing a gate) the athlete’s whole head and any part of the boat must cross the gate line at the same instance, without touching either pole [
1]. As such, understanding technique(s) in relation to athlete speed(s), distance travelled, work rate and trajectory are essential for optimal performance. However, measuring such components of performance separate to race outcome has been acknowledged traditionally difficult [
2,
3] as athletes all use different techniques, take different lines and cover different distances. Current coach practice revolves around timing [
4] and video analysis of racecourse sections, in order to provide subjective (based on experience) opinions [
5]. These revolve around systematic observations using phase and temporal analysis [
6]. Limitations on using time to evaluate performance alone have been documented in slalom skiing [
7,
8] where sectional course data is limited by initial velocity, position and orientation, but also varies between competitors by significant (10%) amounts [
9]. This is also likely the case in canoe slalom and could bias coach opinion, and thus feedback to athletes.
Recent work has validated means of assessing work rate and stroke kinetics [
10] without any negative interference to athlete performance, but still does not provide quantitative kinematic data and may not reflect performance outcome if trajectory, distance travelled and speed and/or acceleration data is not considered. Athlete trajectory assessed through overhead video tracking has been performed on small sections or gate sequences [
4,
11] indicating that performance characteristics are related to trajectory and can distinguish between individual performances within competitions. As such, more user-friendly, less expensive methods allowing valid and reliable means of tracking slalom athlete’s distance travelled, speed, accelerations-decelerations, and trajectory need to be investigated.
Currently, there is a wealth of data available in team-game sports [
12,
13] where analysts relay spatiotemporal scalar data measured by electronic performance tracking systems and suggest bias <10% are useful for movement analysis [
14]. Such systems utilise one of four methods including Global Navigation Satellite Systems (GNSS) used singularly, combinations of different systems (GPS + GLONASS) and GPS + inertial units or differential GPS (dGPS), radio-based local positioning systems (LPS), optical tracking systems, and manual tracking systems. While dGPS [
15], local positioning systems [
16,
17], and optical tracking systems [
18] are acknowledged more valid, reliable and time-sparing, they are either too expensive, not compatible and/or cumbersome for individual use within canoe slalom. An example is that used in alpine skiing, the winter parent of canoe-slalom, where sub-decimetre accuracy is reportedly required, and obtained through the use of a bulky GPS + GLONASS system [
19]. The advent of satellite-based augmentation systems (SBAS), such as the Southern Positioning Augmentation Network (SouthPAN) to improve standard GNSS data precision will offer a low-cost alternative but is will not be fully functional until 2025. These SBAS systems work via the collection of multiple reference points from stationary positions, and relay error correction data to the same antenna as the GNSS devices [
15].
To our knowledge, no specific peer-review publication has focused on the use of a GNSS device within the sport of canoe slalom. Therefore, the purpose of this study was to investigate the validity and reliability of scalar data obtained from a commercially available high speed (10 Hz) SBAS-GPS device (but only using normal GPS), compared to automated video tracking during a simulated dry-land slalom set out in a car park, and a real-world, on the water slalom exercise. It was hypothesised that automated video tracking would provide more valid and reliable data for distance, speed, and position than the GPS device, while the real-world slalom trial would be less valid and reliable than the simulated trial due to small discrepancies in movement and data point error.
2. Method
One experienced (35 yrs. national/international experience, age 48 yrs; height 172 cm; body weight including clothing, spraydeck and shoes 64.0 kg) male kayaker consented in accordance with the University Human Ethics Committee. As the main purpose of this study was to assess the validity and reliability of the tracking systems rather than any test protocol or athlete performance(s) it was deemed acceptable to use one participant [
10,
20].
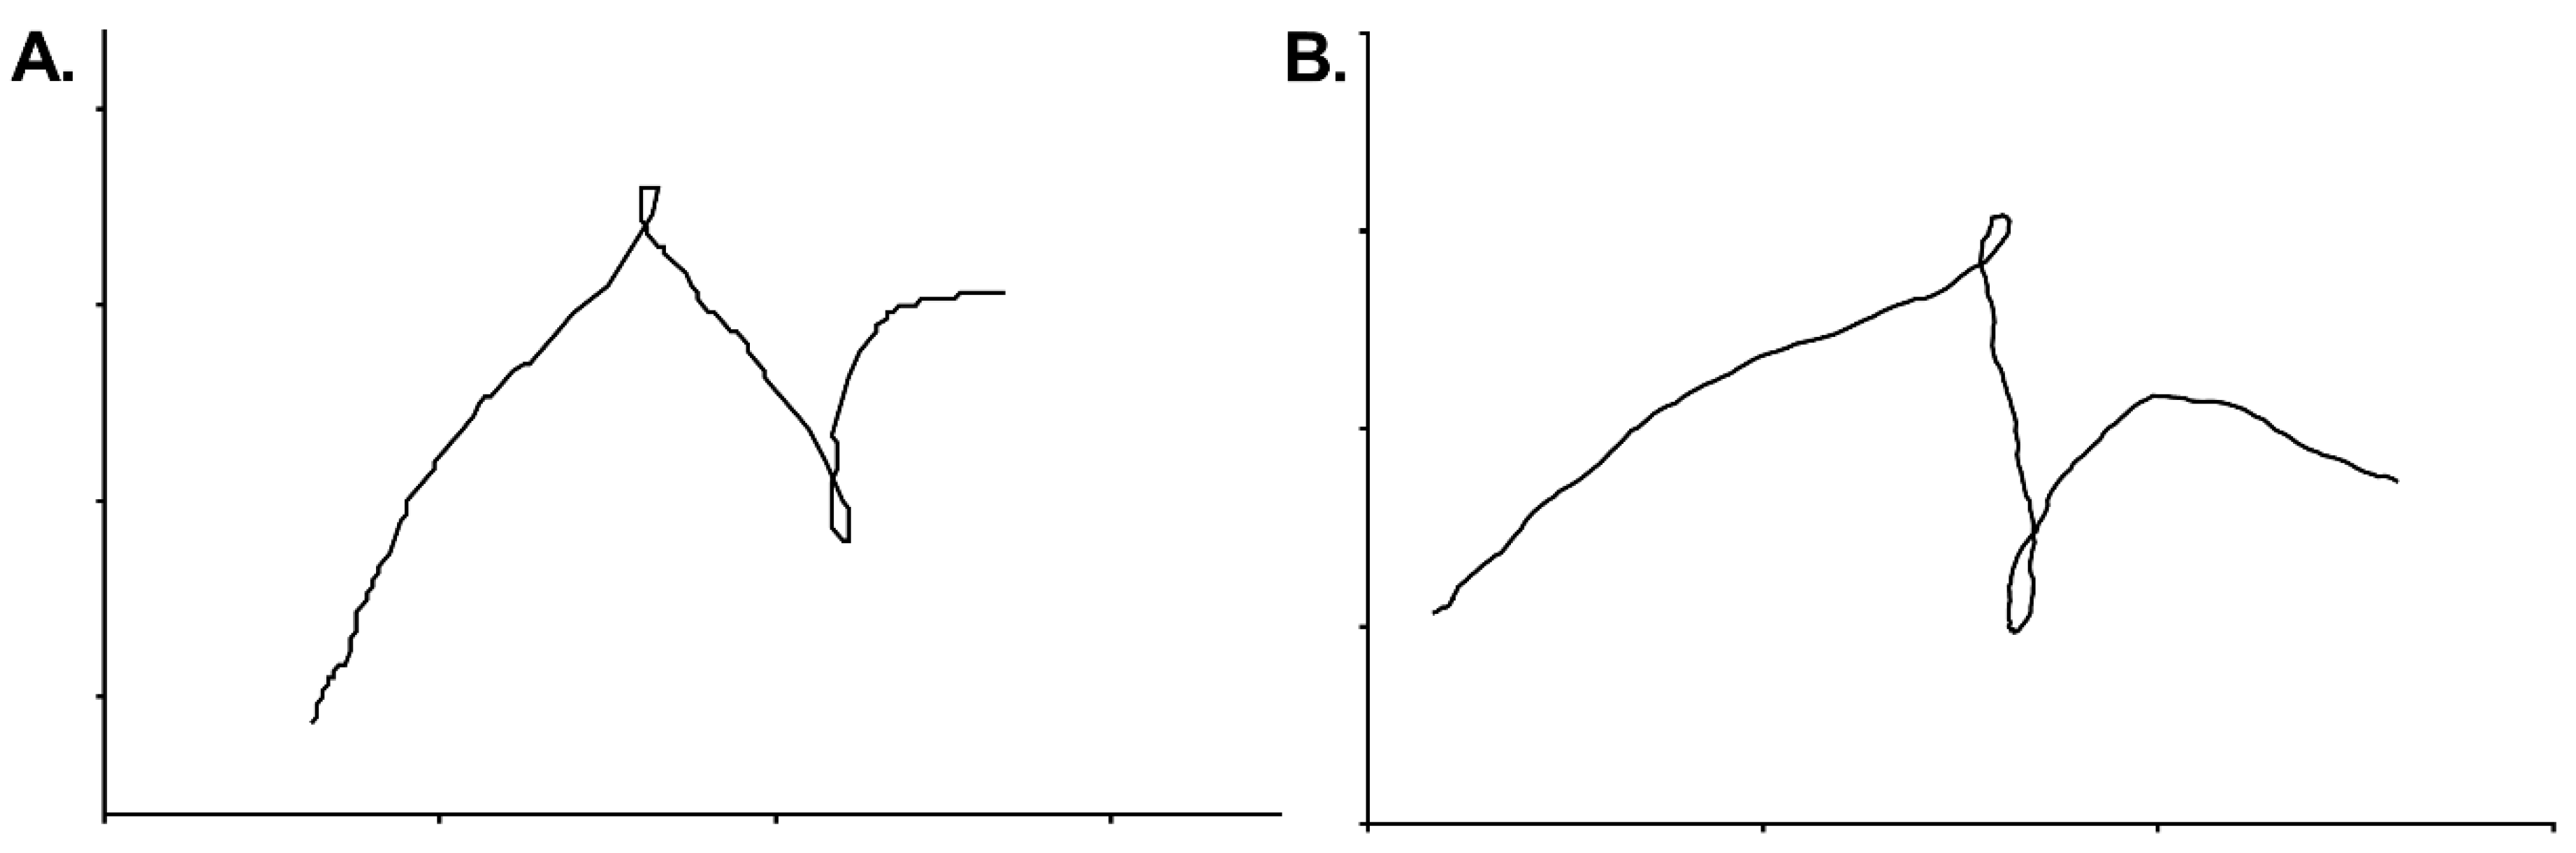
As a result of an inability to precisely follow a set trajectory through slalom gates of known distance, it was decided to perform a dry-land simulation typical of slalom (
Figure 1A). This enabled assessment of method validity and compared aerial video was taken with an unmanned aerial vehicle or drone (Mavic Pro, DJI, Shenzhen, Guangdong, China). Tracking of the participants’ head (aerial view) at two speeds (10 and 30 frames per second (fps)) and processed through 3rd party software (MaxTRAQ Standard, Innovision Systems, V2.8.8.6, Columbiaville, MI, USA) using informed (colour) filter. Continuous calibration occurred throughout via a two-point calibration located on the deck of the kayak. Conversion of X-Y data to distance and subsequently speed occurred as per the following Equations:
This allowed for a comparison between optical tracking and the 10 Hz GPS (BT-Q818XT, QStarz, Tapai, Taiwan). Synchronisation was possible through the use of GNSS time stamps on video and GPS devices.
The GPS device was positioned on the midline of the frontal region (occipital bone) of the head, above the glabella and between the two frontal eminences to minimise satellite reception impediment [
21] but also because international federation rules [
1] stipulate the head must pass through the gate-line. As such, placement on the boat would likely augment any discrepancy or misrepresentation of athlete trajectory, limiting data value. Logging of GPS data occurred through combination with a telemetric video system application (TrackAddict Android App). The GPS receiver uses an MTK
TM chipset with 66-CH performance and −165 dBm sensitivity. Knowledge of method capability within a controlled environment (trial 1) permitted comparison of the two systems during an on-water slalom course (trial 2) for ecological validity (
Figure 1B).
2.1. Test 1: Dry Land Slalom
From a standing start on the threshold of gate 1, the participant followed a painted line on a black asphalt surface configured to replicate a typical slalom trajectory dictated by a set course of gates (
Figure 1A). Slalom poles were replaced by two cones, 1.2 m apart as per International Canoe Federation Slalom Rule 27 for spacing of gate poles. Each trial finished when crossing the threshold between the two cones (slalom poles) as per
Figure 1A. The total length as per the tape measure method was 38.8 m. The participant completed the course on foot (
n = 30), at a variety of speeds comparable to those reached in canoe slalom through unreported data collection (mean ± SD was 5.80 ± 1.64 km∙h
−1, range 0–16.4 km∙h
−1), where longitude, latitude, distance, and time were recorded using 10 Hz GPS. Automated aerial tracking of stationary aerial video footage was filmed from a height of 25 m and filmed at 3840 × 2160 pixels, data rate 60,120 kbps, 30 fps, and converted to 10 fps using TechSmith, Camtasia Studios, V8.6.
2.2. Test 2: On-Water Slalom
The aim of this test was to confirm the validity and reliability of test 1 in a real-world setting for slalom kayaking. The test was performed on a flatwater, grade I slalom venue (Centennial Lagoon, Palmerston North, New Zealand). The participant completed 30 trials over a set course (
Figure 1B) which included performing the sequence of gates in both directions 15 times each. As per the simulated trial speed was not controlled and had a mean ± SD of 5.39 ± 0.34 km∙h
−1, range 0–17.92 km∙h
−1). The analysis compared 10 Hz GPS data with manual tracking from 10 fps video.
3. Data Analysis
Descriptive (mean ± SD, and % CV ± 95% CI) data were calculated for the three methods (automated-informed-aerial video tracking at 10 and 30 fps, and 10 Hz GPS). Calculated total distance (m) during the dry-land slalom (test 1) was compared with the known distance (38.8 m) of the course via a two-tailed one sample
t-test. Overall differences (m) between actual and measured methods were then compared via one-way ANOVA with posthoc multiple comparisons made via Tukey’s test for the dry-land slalom test. A paired student
t-test was used to compare distances (m) when using the 10 fps video tracking with the GPS during the on-water slalom test. Further analysis using Bland–Altman, intraclass correlation coefficient (ICC) and their 95% confidence intervals and interpretation [
22], plus inter-item correlation (Pearson’s r-value, interpretation [
23]) enabled comparison of methods to infer reliability for both dry-land and on-water slalom trials. All statistical analyses except ICC were performed using Graphpad Prism (V6.0f). ICC (95% CI) were calculated using SPSS statistical package version 25 (SPSS Inc., Chicago, IL, USA) based on a mean-rating (
k = 3), absolute-agreement, 2-way mixed-effects model [
22].
5. Discussion
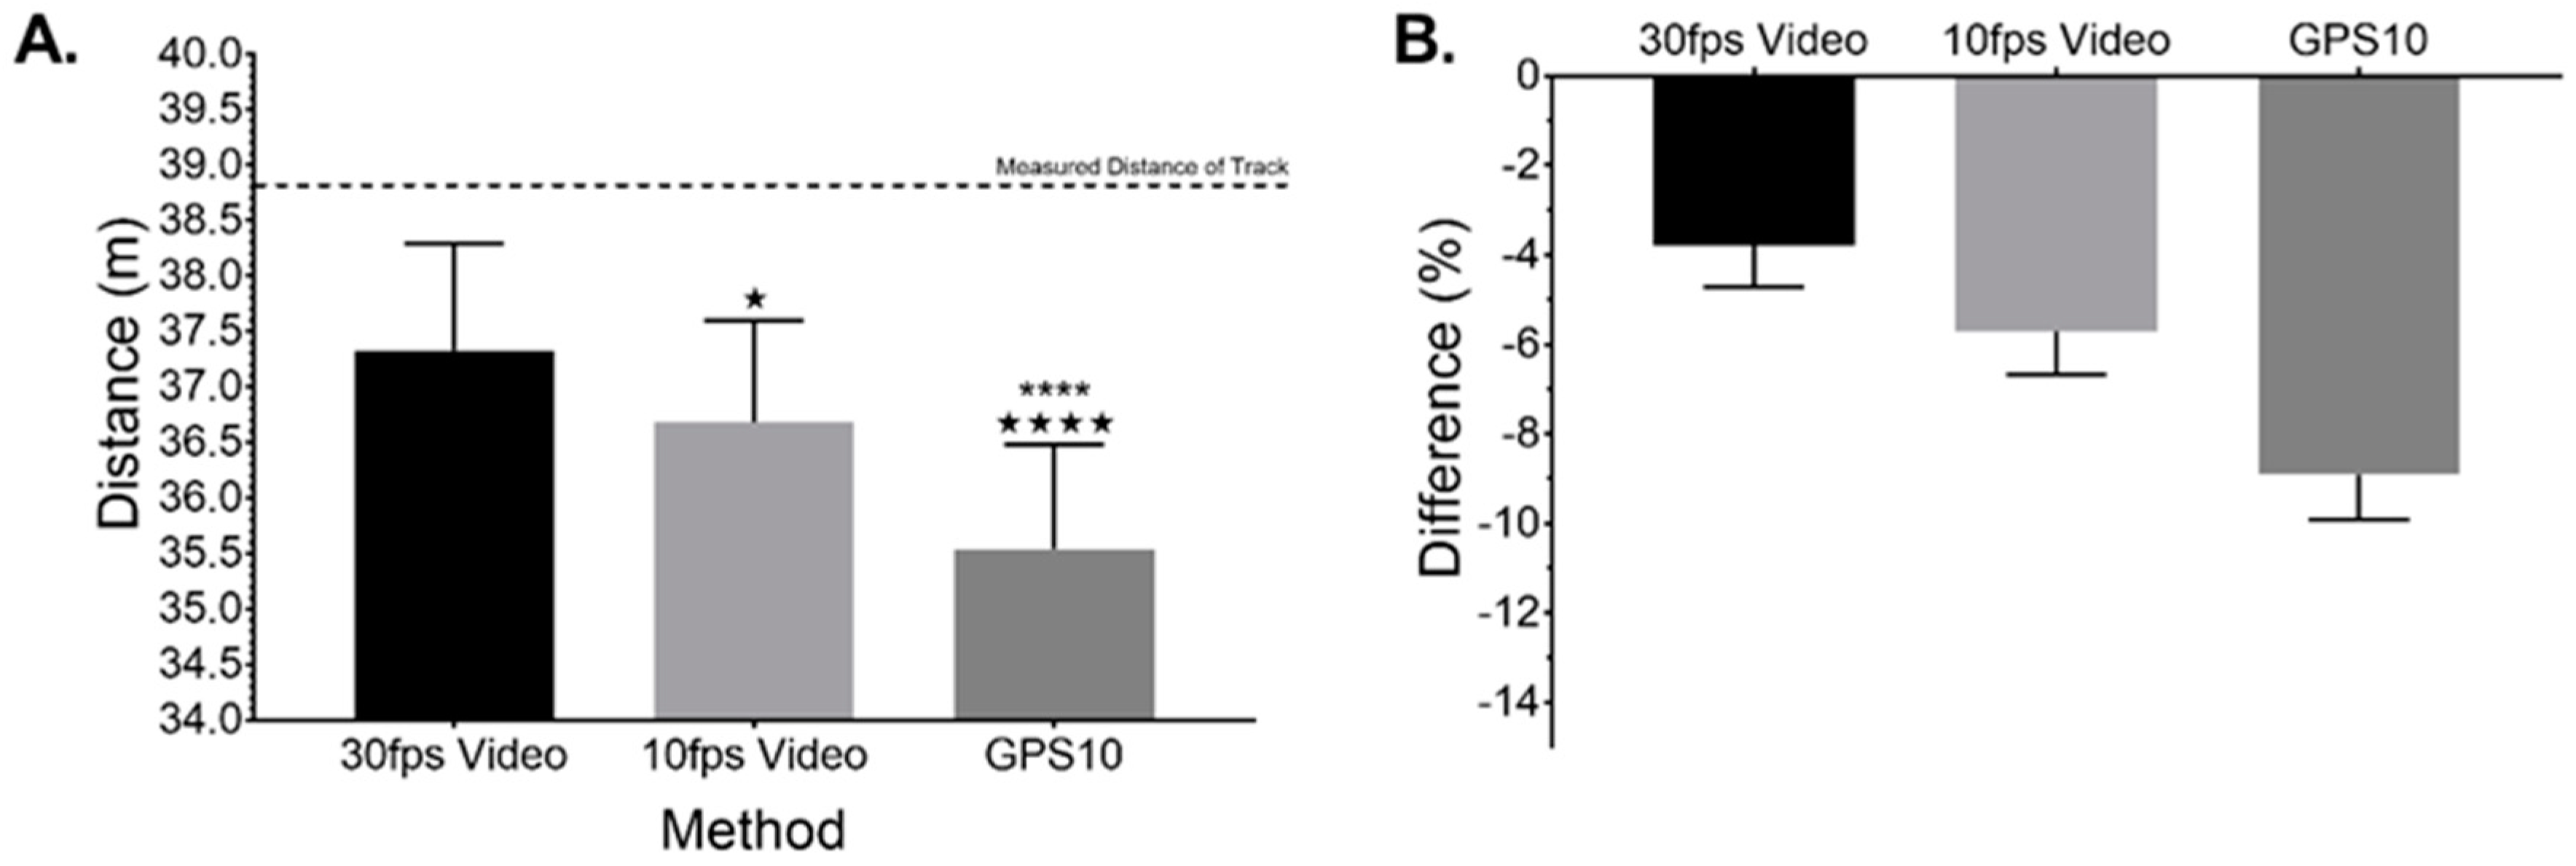
The purpose of this study was to investigate the validity and reliability of data from a commercially available 10 Hz GPS device compared to automated video tracking during a simulated dry land slalom and on-water slalom. The main findings from the dry-land test show that automated tracking and GPS underreported distances compared to actual track distance. Automated tracking was more accurate than GPS. Greater sample frequency within automated tracking provided greater accuracy. The reliability of automated tracking and GPS were similar and deemed good. The use of automated colour-informed aerial video tracking on the water was not possible due to lighting, but manual tracking at 10 Hz presented significantly greater distances than 10 Hz GPS, where both systems presented good reliability.
Two tests were used to attain data regarding the accuracy and reliability of the tracking methods used (Test 1: Dry-land slalom), and their application to real-world settings (Test 2: On-water slalom). Traditionally, the best consumer grade GPS devices, when presented with clear unobstructed skies, can be expected to be within 5 m error 95% of the time when the receiver is kept at or above head height. For the dry-land trial, used to determine accuracy and reliability, the skies were clear, the GPS device was located on the frontal region of the athlete’s head, and automated tracking followed the path of the athletes from an aerial perspective. Even so, both automated (30 fps and 10 fps) and GPS underreported distance travelled in the dry-land test by 3.8%, 5.7%, and 8.9% for automated track 30 Hz, 10 Hz and GPS, respectively when compared to a known track typical of those found in slalom canoeing (
Figure 2 and
Figure 3). This data agrees with previous work where GPS underestimated the distance, and that small movements, such as turning in the gates for canoe-slalom would increase inaccuracies [
24,
25,
26]. Explanations for such discrepancies within GPS measurements have previously centred on body lean and limb movements [
26]. This variable was controlled to a certain extent, as placement of the GPS device and automated tracking of the head negates limb and body movements, yet significant differences between and within methods still occurred. However, the automated tracking at 30 Hz proved to be considerably more accurate, likely due to higher resolution, providing greater accuracy during small turning circles common in canoe-slalom, and less room for error with head movement. A possible explanation for the discrepancy between the 30 fps and the actual track might be due to errors within the calibration process of the video software between trials. However, this was deemed small (
n = 30, 2301 ± 13.29 mm, CV = 0.58% with a bias of 0.81 ± 0.58%, 95% LOA −0.33–1.94). Even so, 30 fps automated tracking still only produced similar accuracy levels to a 5 Hz non-differential GPS (NdGPS) system used for a football specific test [
27].
Conversion of video to 10 fps enabled true comparison between automated tracking and GPS as sample frequency has been shown to affect accuracy in GPS tracking units [
16,
28,
29]. The data in this study for automated aerial video tracking highlights a 1.9% difference between 30 and 10 fps (
Figure 2) with lower sample frequency presenting greater difference from the actual distance. Additionally, good reliability was maintained between sample frequency for automated tracking (2.49% CV) suggesting a useful comparison between 10 fps automated tracking and 10 Hz GPS is possible in the on-water, slalom specific trial [
30,
31].
Data presented within this study is inclusive of data set error (erroneous longitude-latitude position) as it was believed important to provide an overall picture of method and sample frequency capability. However, visual inspection of trajectory occurred, as limitations of GPS trajectory quantified via distance travelled have been reported as high as 10% for 10 Hz and 20% for 18 Hz GPS device [
16]. Within the automated tracking for the dryland test, data set errors of the trajectory (
Figure 4A,B) occurred at a rate of 20 and 16.6% for 30 fps and 10 fps, respectively and were deemed not large enough to affect overall results. Errors were in the order of <1 m, typically occurred but were not restricted to upstream manoeuvres. It was deemed that such error would restrict usability confidence within an elite sport setting where visual inspection of trajectory would have to occur before reporting any data analysis outputs. Interestingly, data set errors as per the automated tracking tended not to occur within the GPS data sets. However, trajectory lines were less smooth with a jerky (stepped) appearance (
Figure 4C) and in many cases looked like there were gaps in signal reception as straight lines appeared where a smoother curve might be expected as in the automated tracking trajectories. This has been reported previously [
26] where data was sampled at 5 Hz and interpolated via a commercially sensitive algorithm into 15 Hz producing such partitioning of linear segments as shown in our data,
Figure 4C. Future work needs to confirm the viability of sport-specific algorithms to automatically account for such data set trajectory errors as identified within this data.
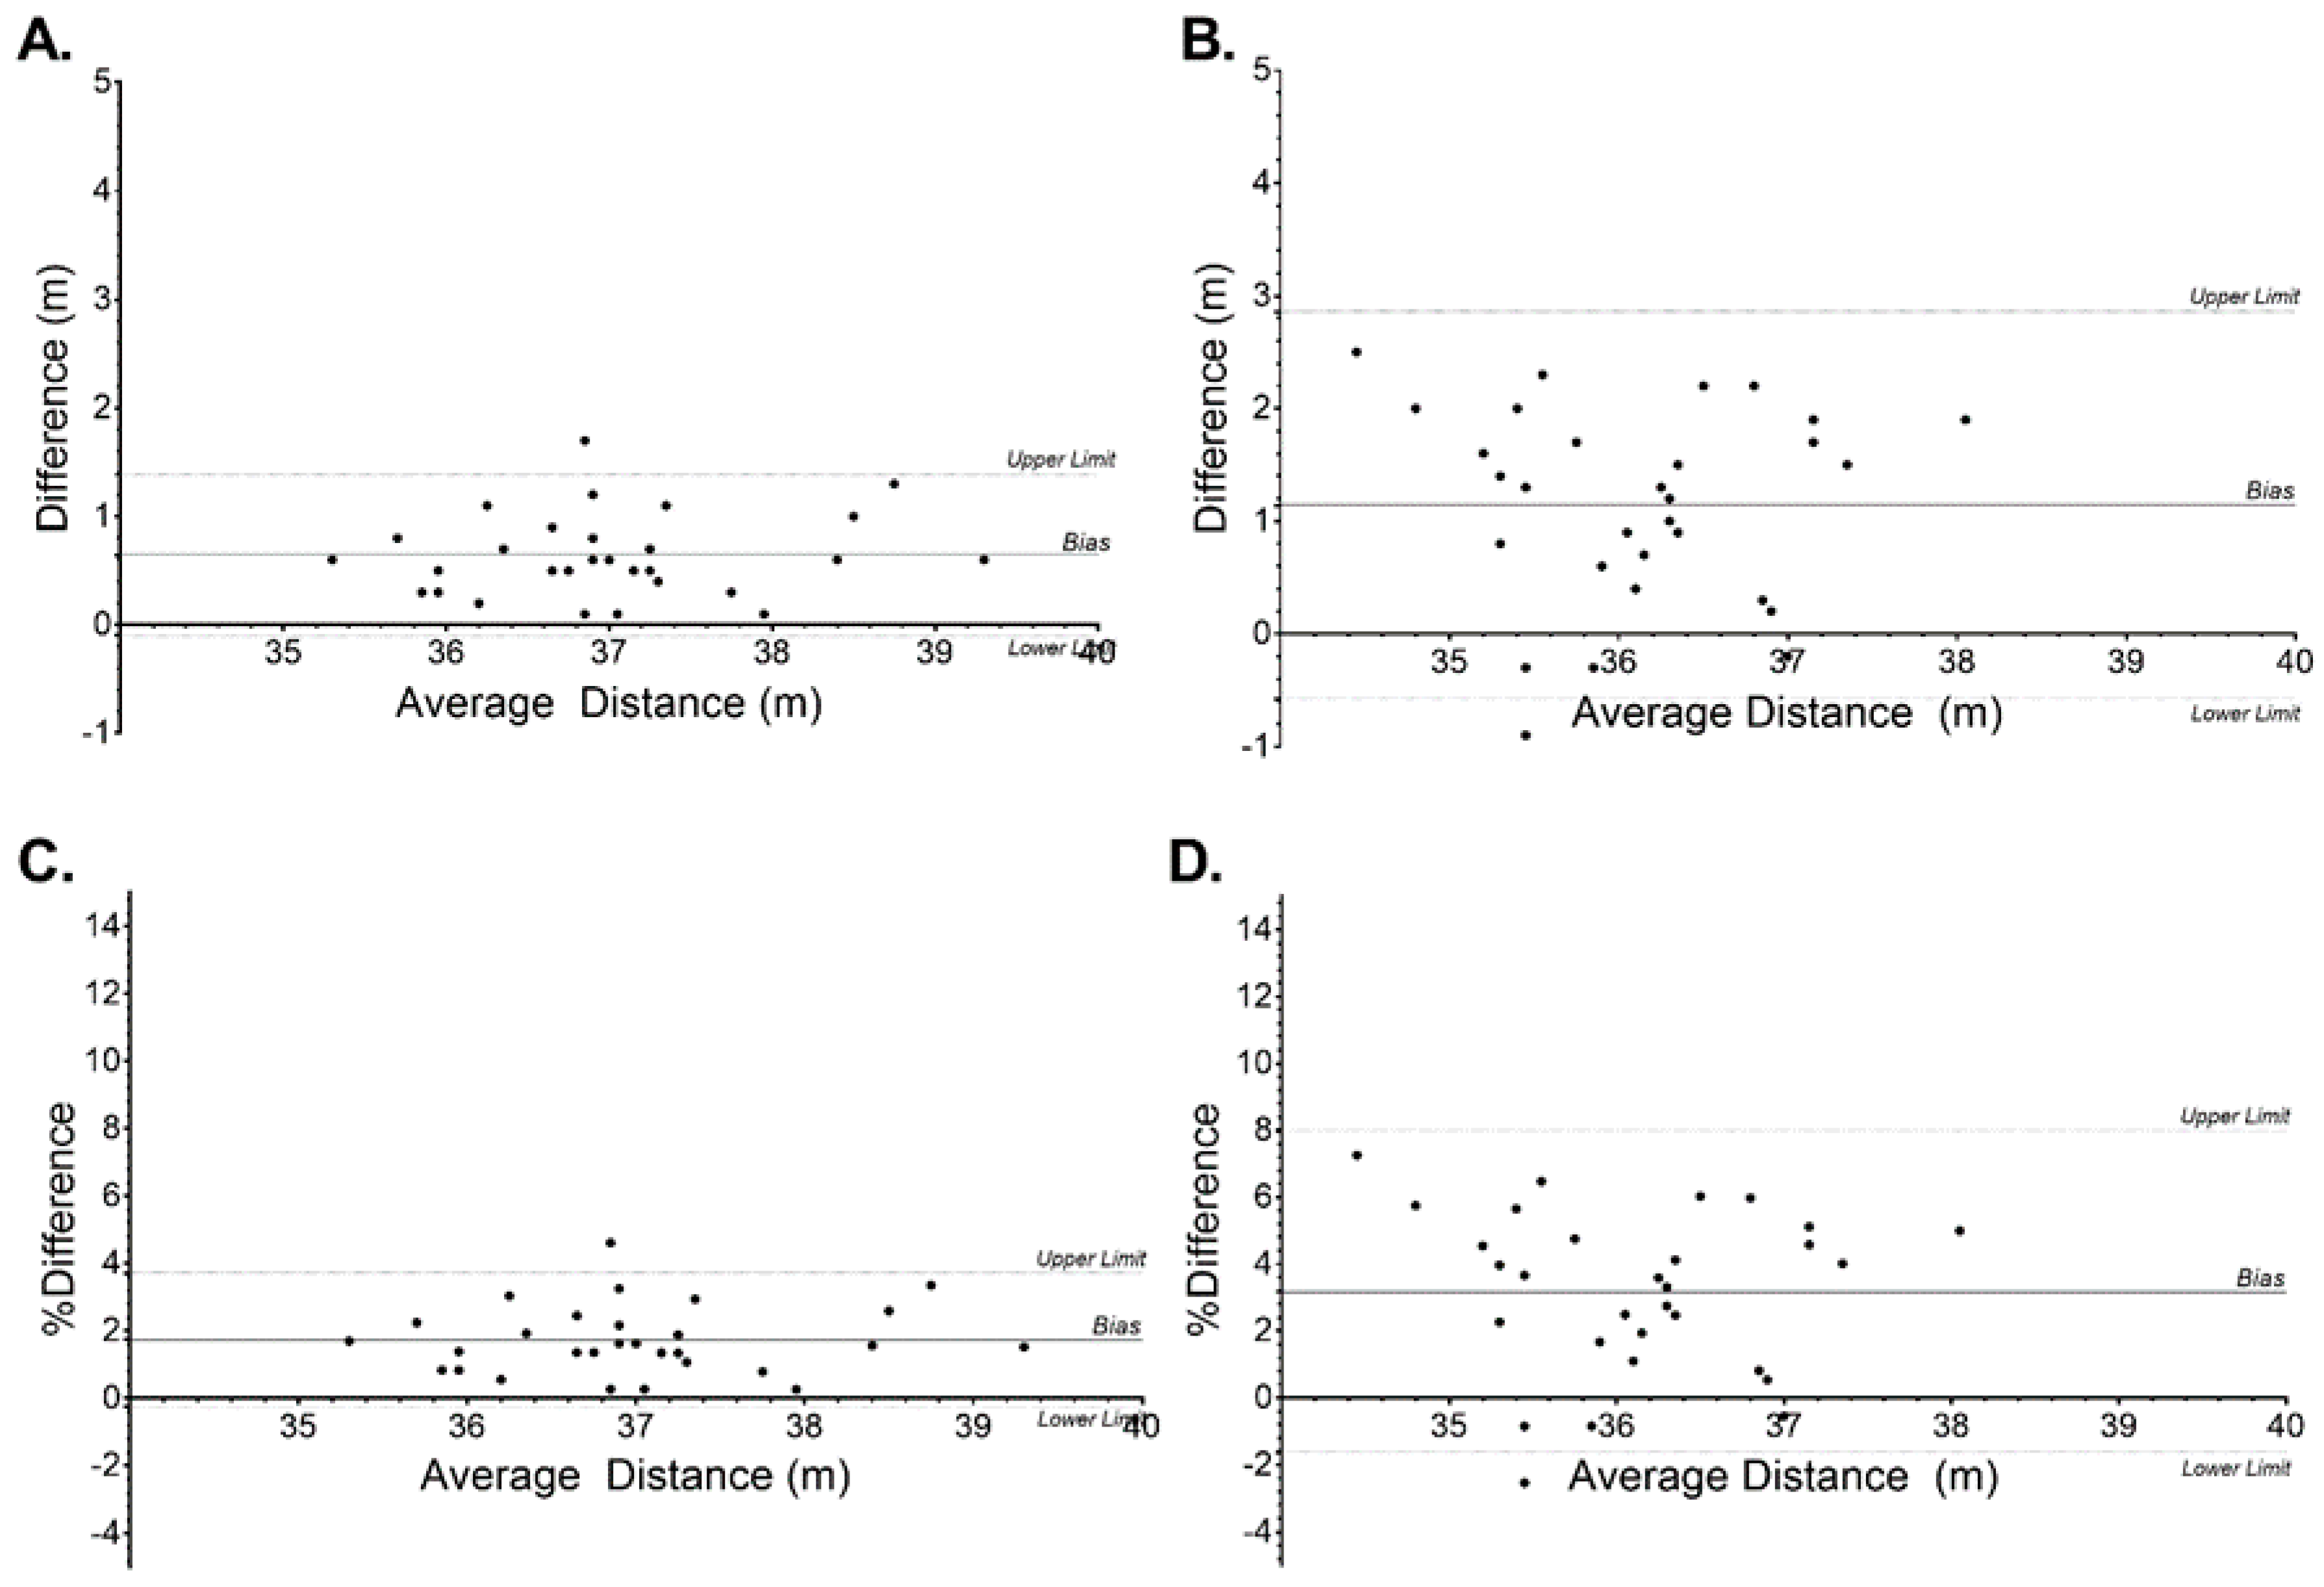
Trial 2 included the comparison of 10 fps aerial tracking with 10 Hz GPS during a real-world on-water slalom gate sequence. Initial analysis identified a considerable limitation with the automated aerial video tracking in that the addition of water reduced software capability due to changes in surface colour changes and glare as a response to natural lighting within the environment. This led the authors to perform manual tracking that resulted in a more robust reliable data set, without the errors of trial 1. As reported earlier, little is known regarding the reliability of a slalom athlete to follow the same path on multiple attempts at the same course. If we assume data from the manual tracking is good then on this course, on this occasion our participants’ ability to repeat the same trajectory varied by 1.7 m (SD) or 3.75% (CV). This alone might be a useful indicator of athlete capability and used in developmental monitoring but is outside the scope of this study. When comparing data from the same runs (
Figure 5A), GPS significantly underestimated trajectory distance by 2.5 m (5.5%) compared to aerial video tracking. This is significantly greater than the difference reported for the dryland (trial 1). Again, the comparison of mean data and the variation around distance travelled does not necessarily reflect between method variations within runs. Bland–Altman plots (
Figure 5B,C) displays such difference with the large LOA (−4.2–14.7%) when comparing run to run.
As per the dryland trial, there was a relatively low level of data set errors for GPS where on-water trials produced 10% (three definite) data set errors with more yawing (side-side) motion in the path (
Figure 6) as might be expected in a human propelled kayak. Rotation of the upper body caused by the forwards reach of each stroke would result in directional heading changes within the GPS device. This yawing path might be expected to increase overall distance rather than reduce it compared to the smoother line of the on-water manual tracking (
Figure 6A) and in the case of the dryland trial automated aerial tracking (
Figure 4A,B). However, linearity of relatively low sampling frequency along with possible impediment of satellite reception brought about by head movements typical within slalom, combined with positional dropout are likely causes of inaccuracies.
As such quantitative tracking of canoe slalom athlete trajectory using this format of GPS is deemed not accurate or reliable enough during a real-world setting to determine meaningful differences for inter- or intra-athlete comparisons where worthwhile changes have been deemed 0.4–0.6% [
32]. Manual aerial video tracking along with automated tracking in dryland simulation was proven accurate and reliable enough for athletes or coaches to track athlete capability with regards to the path taken. These methods are time inefficient and require third party software capability or future integration into application development. Differences between methods mean comparisons should not be made and future work needs to look at combining GNSS systems, such as GPS + GLONASS or the combination of local positioning systems, SBAS GNSS systems, a greater sampling frequency of the GNSS used and better corrective algorithms to empower slalom athletes and their coaches to quantify technical elements of performance in an efficient manner. Additionally, future work needs to determine the effects of multiple participants rather than
n = 1 on the reliability and useability of such devices.


