Article

Development of a Lower Limb Finite Element Musculoskeletal Gait Simulation Framework Driven Solely by Inertial Measurement Unit Sensors

1
Faculty of Systems Design, Tokyo Metropolitan University, 1-1 Minami-Osawa, Hachioji-shi, Tokyo 192-0397, Japan
2
The Faculty of Rehabilitation and Care, Seijoh University, 2-172 Fukinodai, Tokai 460-0002, Japan
*
Author to whom correspondence should be addressed.
Biomechanics 2021, 1(3), 293-306; https://doi.org/10.3390/biomechanics1030025
Submission received: 26 July 2021 / Revised: 6 October 2021 / Accepted: 6 October 2021 / Published: 18 October 2021
(This article belongs to the Section Gait and Posture Biomechanics)

Abstract

:
Finite element musculoskeletal (FEMS) approaches using concurrent musculoskeletal and finite element models driven by motion data such as marker-based motion trajectory can provide insight into the interactions between the knee joint secondary kinematics, contact mechanics, and muscle forces in subject-specific biomechanical investigations. However, these data-driven FEMS systems have a major disadvantage that makes them challenging to apply in clinical environments, i.e., they require expensive and inconvenient equipment for data acquisition. In this study, we developed an FEMS model of the lower limb driven solely by inertial measurement unit sensors that include the tissue geometries of the entire knee joint, and that combine modeling of 16 muscles into a single framework. The model requires only the angular velocities and accelerations measured by the sensors as input. The target outputs (knee contact mechanics, secondary kinematics, and muscle forces) are predicted from the convergence results of iterative calculations of muscle force optimization and knee contact mechanics. To evaluate its accuracy, the model was compared with in vivo experimental data during gait. The maximum contact pressure (11.3 MPa) occurred on the medial side of the cartilage at the maximum loading response. The developed framework combines measurement convenience and accurate modeling, and shows promise for clinical applications aimed at understanding subject-specific biomechanics.

1. Introduction

Knee joint kinematics, kinetics, and muscle and ligament forces play essential roles in the early detection of knee disorders, evaluations of patients presenting with knee pain, and musculoskeletal (MS) symptoms [1,2]. Noninvasive computational methods such as MS [3] and finite element (FE) [4] models have been widely used in biomechanical analyses and clinical assessments of the knee joint. The MS model, which consists of rigid body skeleton segments connected by joints and muscles that span these joints, can be used to estimate the joint kinematics, kinetics, and muscle forces. Alternatively, FE models developed based on medical imaging can predict detailed contact mechanical responses (specifically, contact pressure, contact area, and soft tissue deformation) of the knee joint with predefined boundary conditions. In past studies, some researchers have combined MS and FE models [5,6]. Specifically, the muscle or knee joint compressive force is primarily calculated using MS models; these values then serve as inputs for an FE model of the knee joint region to simulate its contact mechanics. This combined approach can help overcome the limitations of each modeling domain while improving the quality of the analysis.
However, the predictions of the MS model are independent of the FE analysis. The muscle forces contribute to the knee joint kinematics and could thus change the deformation and translocation of the cartilage and meniscus soft tissue. Paradoxically, the soft tissue deformation estimated by the FE model could change the secondary kinematics [7], which, in turn, could seriously affect the muscle moment arm estimation, thus affecting the muscle force re-estimation [8]. Recent research has introduced finite element musculoskeletal (FEMS) approaches using concurrent MS and FE models, combining muscle modeling and detailed soft tissue deformation FE analysis into a single framework [7,9]. The inclusion of deformable soft tissues in an FEMS model of the lower limb may preserve the realistic interaction of the muscle force with the knee kinematics and moment in human motion simulation.
Although these modeling approaches consider soft tissue deformations in estimations of muscle force, to improve computational efficiency, knee joint contact is commonly simplified to a rigid contact [10] or a load-dependent relationship [11] between femoral and tibial cartilage based on elastic foundation theory. As far as we know, none of the studies using an FEMS model framework of the entire knee joint has considered the contact relationship between the meniscus and the articulating cartilage. However, the meniscus has been proved to be an essential structural component that shares the knee joint load [12] and influences the knee secondary kinematics [13] during human gait. Ahmed and Burke [14] reported that at least 50% of the compressive load on the knee was transmitted by the menisci. Hu et al. [15] reported that the maximum anterior–posterior displacement increased approximately two-fold, internal–external rotation almost vanished, and medial–lateral displacement reversed direction at the knee joint after meniscal removal. Therefore, the interaction of the entire knee contact mechanics and knee joint secondary kinematics considering meniscal mechanics, and muscle force is still unclear.
Depending on their purpose, the simulations of the MS system are categorized as either predictive (i.e., they do not rely on data) or experimental data tracking simulations. The predictive simulation approach is used to obtain the optimal movement to perform a specific motor task without experimental data [16]. This approach predicts knee movement patterns based on a mathematical model of the MS system that can reveal the interaction of the knee kinematics, muscle forces, and joint loading by clarifying cause–effect relationships. Although the approach is valuable in preventing and slowing the progression of different knee disorders, it is difficult to use in standard clinical applications, such as subject-specific gait analysis, and the accuracy of simulation results is also problematic [17]. On the other hand, experimental data tracking simulation requires motion measurement data as a prerequisite. Recently, simulations based on detailed knee joint kinematics data, collected using methods such as the point cluster technique [18], stereoradiography [19], and fluoroscopic techniques [20], have been extensively studied in an effort to accurately predict subject-specific knee secondary kinematics, muscle force, and joint load. However, these data collection systems are difficult to apply in a standard clinical environment because they must be professionally installed, they require complex preparation for experiments and data analysis, and they are extremely expensive. Recently, human body kinematics and kinetic measurements relying only on inertial measurement unit (IMU) sensors have begun to see widespread clinical use [21]. The use of an IMU sensor as a driving model component offers the advantages of being low-cost and allowing convenient measurements, which can replace motion capture systems to provide motion capture containing the primary kinematics of joints [22]. Applying this measurement method to FEMS modeling could improve the convenience and efficiency of its clinical use.
The aim of this study was to develop a solely IMU-sensor-driven, single whole-body model including an FEMS model of the right lower limb, taking into consideration the interaction of the contact mechanics, kinematics, muscle, and ligament force of the entire knee joint. The model requires only that the lower limb primary kinematics be measured by the sensors as input, and that the other outcomes (knee contact mechanics, secondary kinematics, and muscle and ligament forces) be predicted from the model calculation.

2. Materials and Methods

The FEMS modeling process primarily involved a whole-body inverse kinematics and dynamics analysis, static optimization of the lower-limb muscle force, and calculation of the knee contact mechanics (Figure 1). The postures of the segments (primary kinematics of the joints) were calculated by the whole-body inverse kinematics analysis. The ground reaction force (GRF) and joint moments were computed by Newton–Euler inverse dynamics. We focused on the right lower limb, predicting the muscle forces with a static optimization algorithm. The knee contact mechanics and secondary kinematics could be obtained based on the muscle forces input to the FEMS model of the right lower limb, and the secondary kinematics were then used as feedback to apply an inverse dynamics analysis to the re-estimation of the muscle force.

2.1. Finite Element Musculoskeletal Model

A whole-body model containing an FEMS-based right lower limb, a rigid body of the left lower limb, and a head-arms-torso segment (HAT) modeled as a rigid body was developed in ABAQUS/Explicit (SIMULIA, Providence, RI) (Figure 2). The FEMS model included the geometry of the entire lower limb bones and soft tissues of the knee joint containing the cartilages and the meniscus, which were segmented from computed tomography (CT) and magnetic resonance imaging (MRI) data, respectively. The data collection was approved by the ethical committee of the Tokyo Metropolitan University, Japan. The whole-body model has 22 degrees of freedom (DOFs), shown in Figure 2. The DOFs of the lower limb joint were defined based on their purpose, so the left knee joint has 1 DOF while the right knee joint has 12. The main targets of the computation, i.e., the knee joint kinematics, contact mechanics, and muscle forces, were obtained from the FEMS-based right lower limb, and the rigid-body-based, left lower limb model was only included to create a human closed-loop system from the multibody dynamics calculation.
In the FEMS model, the bones were represented using rigid triangular shell elements because the stiffness of bone is much higher than that of soft tissues, and the focus of this study is soft tissue mechanical response. Additionally, the cartilage and the meniscus were represented using eight-node hexahedral elements. The defined material properties of the tissues are shown in Table 1. The contact behaviors were defined with a coefficient of friction of 0.04 [23] between the femoral and tibial cartilage on the lateral and medial sides. The menisci were connected to the tibia via multiple spring elements at four meniscal horn attachments. The same contact interactions were defined for the medial meniscus–femoral, medial meniscus–tibial, lateral meniscus–femoral, and medial meniscus–tibial cartilages. The anterior and posterior cruciate ligaments (ACL and PCL), the medial and lateral collateral ligaments (MCL and LCL) crossing the tibiofemoral joint, and the patellar ligament connecting the tibial and patellar bones were modeled as nonlinear spring bundles [24]. The insertion positions of the ligament models were determined by the boundaries of the insertion sites from MRI data. The FEMS model included 16 muscles: the gluteus maximus (three units), iliopsoas, rectus femoris, vastus medialis, vastus intermedius, vastus lateralis semimembranosus, semitendinosus, biceps femoris (short and long heads), tibialis anterior, and gastrocnemius (medial and lateral heads), soleus. The insertion and origin of the muscles were initially derived from anatomical data [25] and scaled based on the overall bone geometry from MRI data. The wrapping between the quadriceps and the femoral bone was considered in knee flexion [10] to avoid altering the direction of the muscle forces and apply an additional compressive force from the muscle insertion to the femoral bone surface.

2.2. Prediction of the Knee Contact Mechanics and Muscle Forces

2.2.1. Estimation of the Ground Reaction Force and Moments

Whole-body inverse kinematics analysis was used to derive the kinematics of the eight modeled body segments (HAT, pelvis, thighs, shanks, and feet) using the corresponding eight IMU sensors. In brief, the measured angular velocities and accelerations were calibrated to each body segment, and the calibrated signal data were used in the integral calculation to determine the joint angles. Note that only a 1-DOF knee joint (flexion–extension) was defined in the inverse kinematics because of inaccuracies in the estimation of the secondary kinematics of the knee joint from sensor data. The remaining DOFs in the knee joint were released in the next step of the inverse dynamics, the muscle optimization, and the computation of the knee contact mechanics.
The inverse dynamics analysis drove the whole-body model by the primary kinematics obtained from the inverse kinematics analysis. The GRF and GRM results can be obtained directly from Equations (A1) and (A2) (Appendix A) in a top-down method using the body segment approach, as these act as the only external force and moment during the single-support stance. For example, during the right single-support stance, the total external force (moment) is the GRF(M) of the right foot, and those on the left side, i.e., F g l and M g l , are zero from Equations (A1) and (A2) (Appendix A). However, when the body forms a closed loop during the double support stance, the GRF and GRM of the right foot are indeterminate. In the study, a smooth transition assumption function based on semi-empirical data was applied to overcome this problem [28].

2.2.2. Muscle Force Optimization and Knee Contact Mechanics Computation

The MS system is usually redundant, which means the number of unknown muscle forces exceeds the number of equations describing the system. In this study, a static optimization method was used to solve the muscle redundancy problem in the FEMS model. The static optimization problem was constrained by requiring the assumed muscle forces to satisfy the equations of equilibrium in the joint moment, and the muscle forces were optimized by minimizing the sum of the cube of the muscular activation s u [29]. These conditions are respectively described as Equations (A3) and (A4) (Appendix B). Muscle force optimization was performed by implementing subroutines written in MATLAB (R2018b, MathWorks, Natick, MA, USA) and FE analysis-based knee contact mechanics computation in the FEMS model while simultaneously simulating the stance phase of a single gait. Before entering the feedback loop of the muscle force optimization, the preoptimization of the muscle forces was performed by inputting the muscle parameters (muscle lengths, and muscle moment arms) determined based on the primary kinematics (hip joint angles, ankle joint dorsiflexion–plantarflexion angle, and knee joint flexion– extension angles) on the inverse kinematics and joint moments calculated from inverse dynamics (Figure 1). Then, the knee secondary kinematics were predicted based on the obtained knee contact mechanics, which were computed from the GRF acting on the foot center of mass and muscle forces estimated in the preoptimization step. In the feedback loop of the inverse dynamics, the muscle force optimization and the computation of the knee contact mechanics, as well as the remaining DOFs of the tibiofemoral and patellofemoral joints, were unconstrained, while the knee joint secondary kinematics were determined based on the interactions among the contact mechanics, muscle forces, and ligament restraint of the joint. The knee secondary kinematics were fed back to a new inverse dynamics analysis, yielding new muscle parameters, joint moments, and GRF results, thus enabling the re-estimation of the muscle forces.

2.3. Subject Experiments

A healthy male subject (age 26 years, height 178 cm, weight 65 kg) participated in the gait measurement. The subject was informed about the purpose, methods, and caveats of the experiment. The experiment was reviewed by the research ethics committee of the Tokyo Metropolitan University. Eight sensors (100 Hz sampling frequency, TSND151, ATR-Promotions Inc., Kyoto, Japan) were positioned at the approximate center of mass of the lateral sides of the thighs and shanks and the upper sides of the feet, lumbar, and torso. For the sensor-to-segment calibration, the subject was instructed to move through a sequence of various postures [30].
The marker-based motion trajectories (100 Hz sampling frequency, OptiTrack Flex 3 motion capture camera, Natural Point Inc., Corvallis, OR, USA) and GRFs (1000 Hz sampling frequency, TF-4060-D force plate, Tec Gihan Co., Ltd., Kyoto, Japan) during a single walking trial were collected synchronously by inertial sensor-based motion capture to verify the accuracy of the sensor-based prediction during gait. A straight, approximately 5-m-long walkway was prepared for the experiment. The subject was verbally instructed to “walk at a comfortable pace” with his preferred gait during the experiment. In this study, to clarify the definition of coordinate transformation, we did not conduct special signal processing, such as applying a Kalman filter to the measured signal. However, a second order Butterworth high-pass filtering with a cut-off frequency of 0.3 Hz was used for drift reduction of the measured angular velocity and acceleration [31] using MATLAB (R2018b, MathWorks, Natick, MA, USA). In order to reduce noise of the data, a filtering program was performed using a second order Butterworth low-pass filter with a cut-off frequency of 6 Hz in MATLAB.

3. Results

As shown in Figure 3, the vertical and medial forces of the ground reaction matched the measured data. However, the predicted horizontal force only followed the general trend of the force plate data, with a large error in the second loading response (second peak vertical GRF).
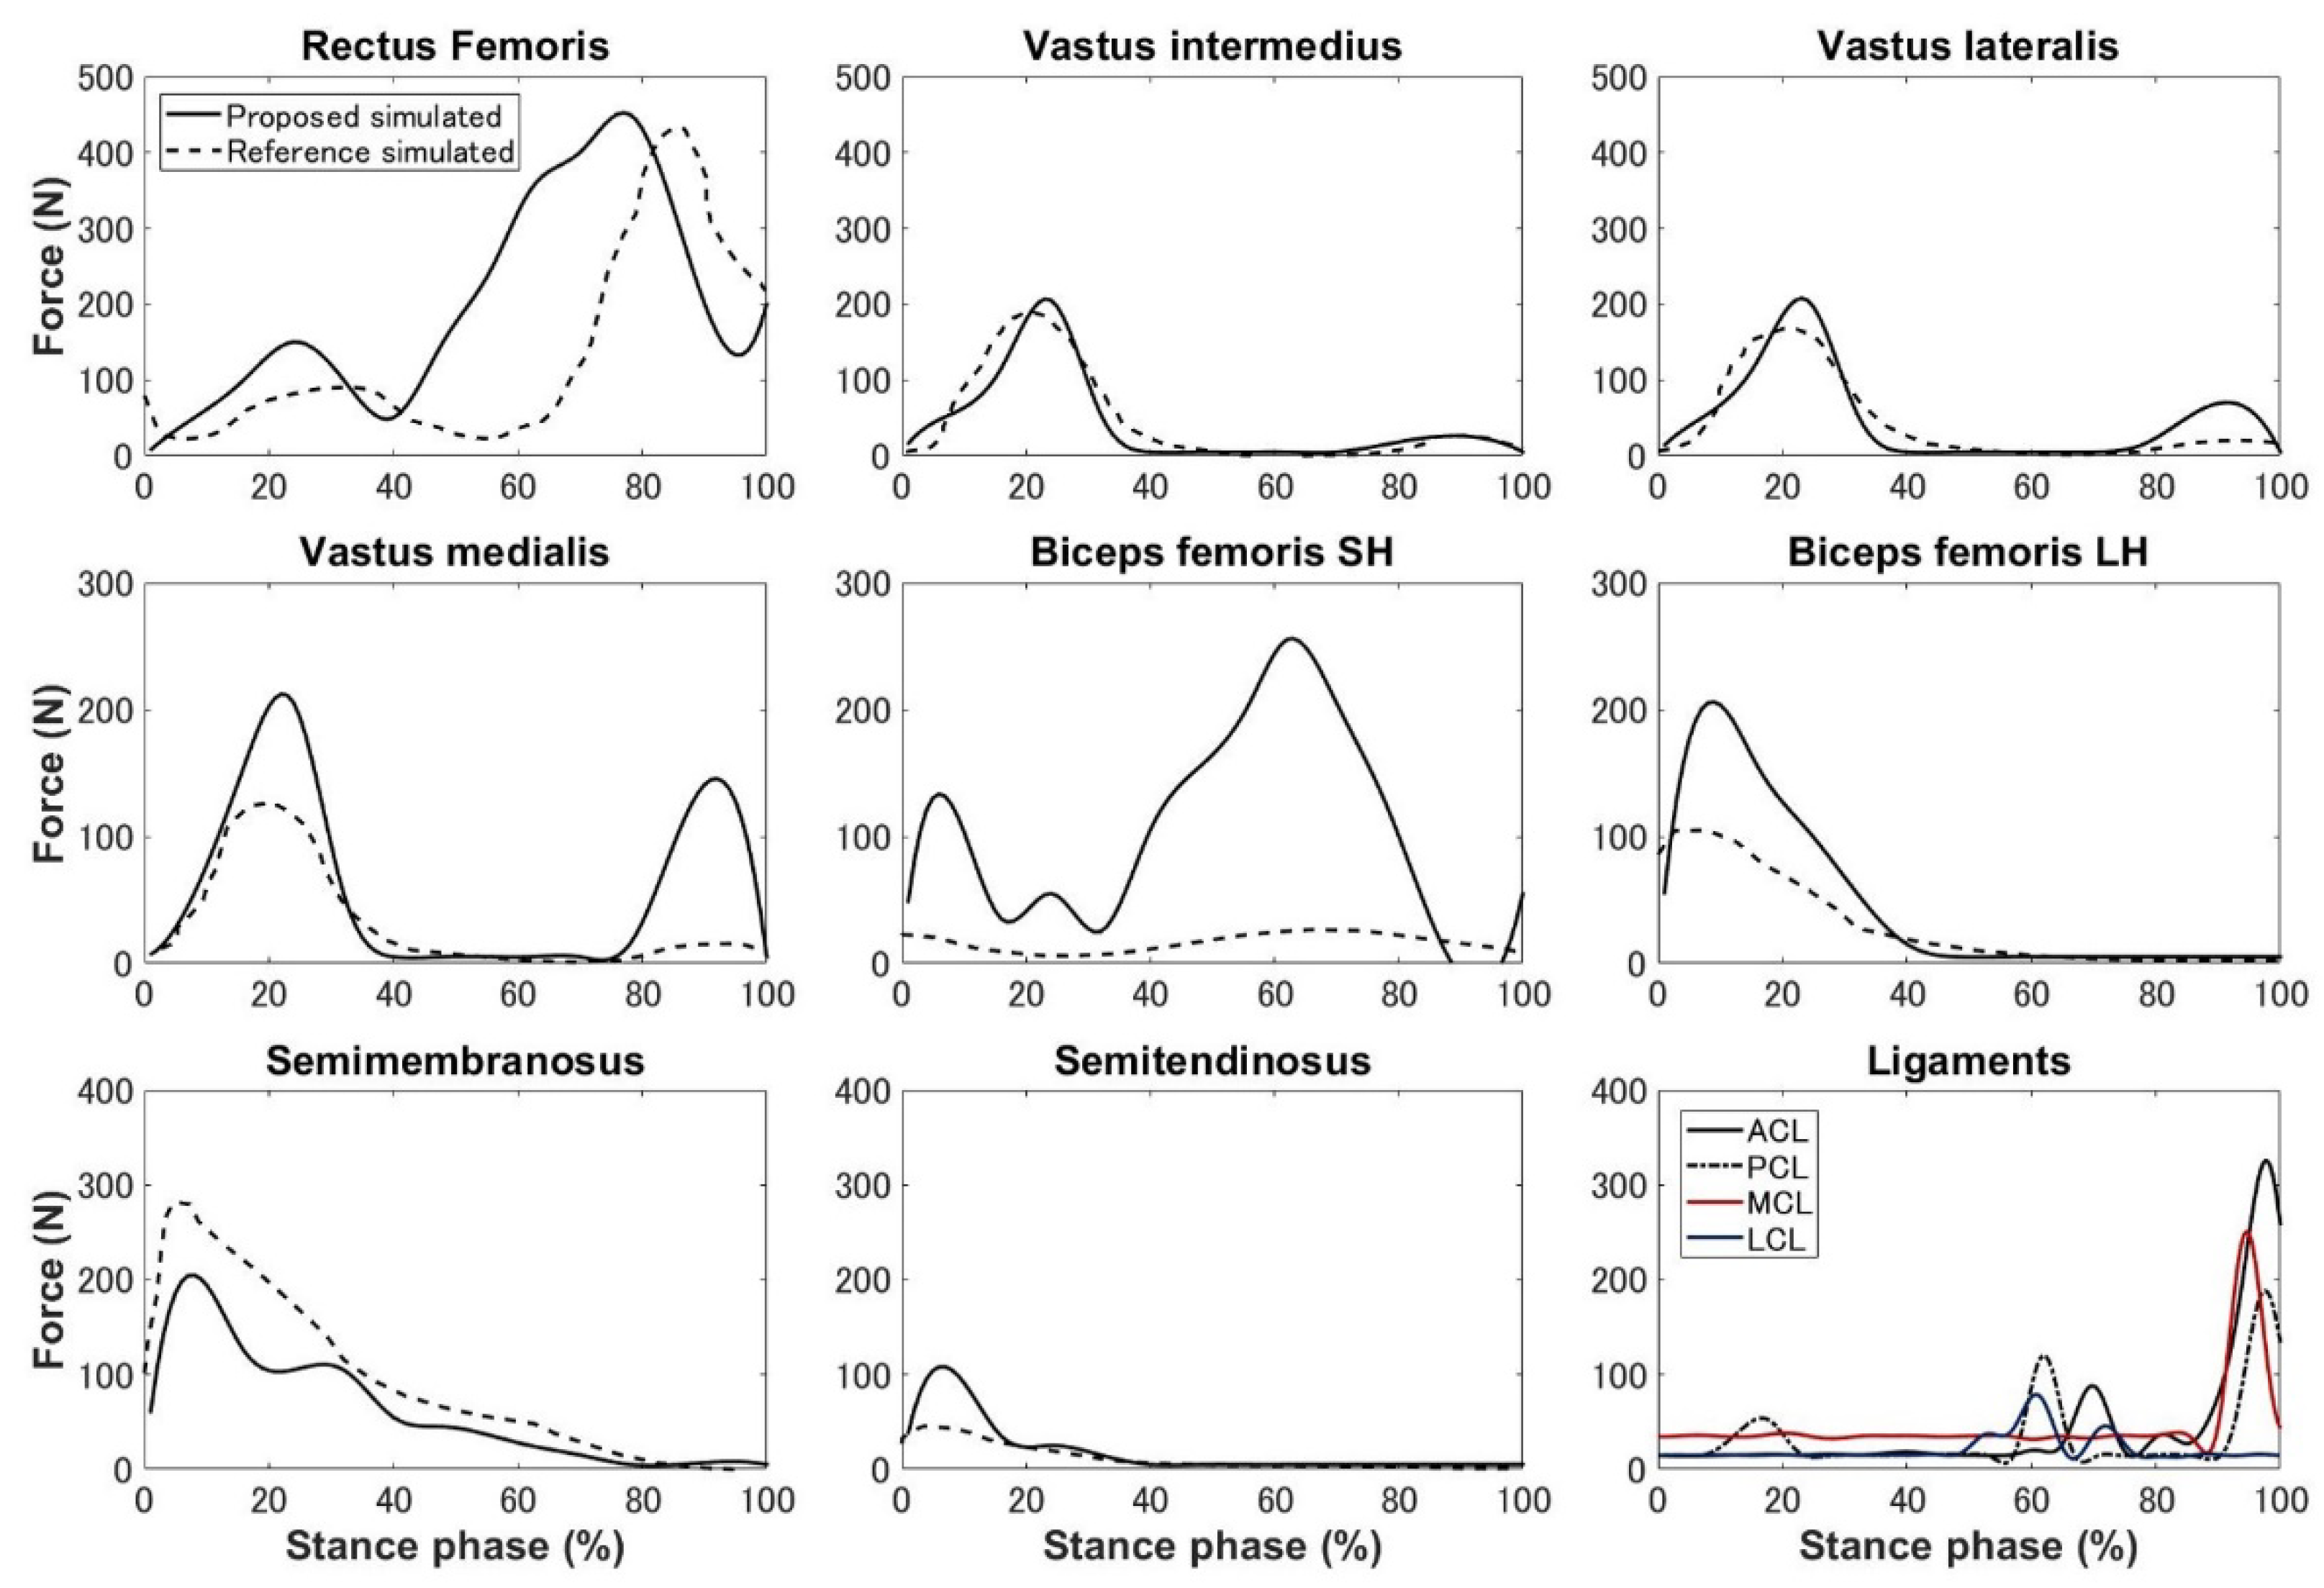
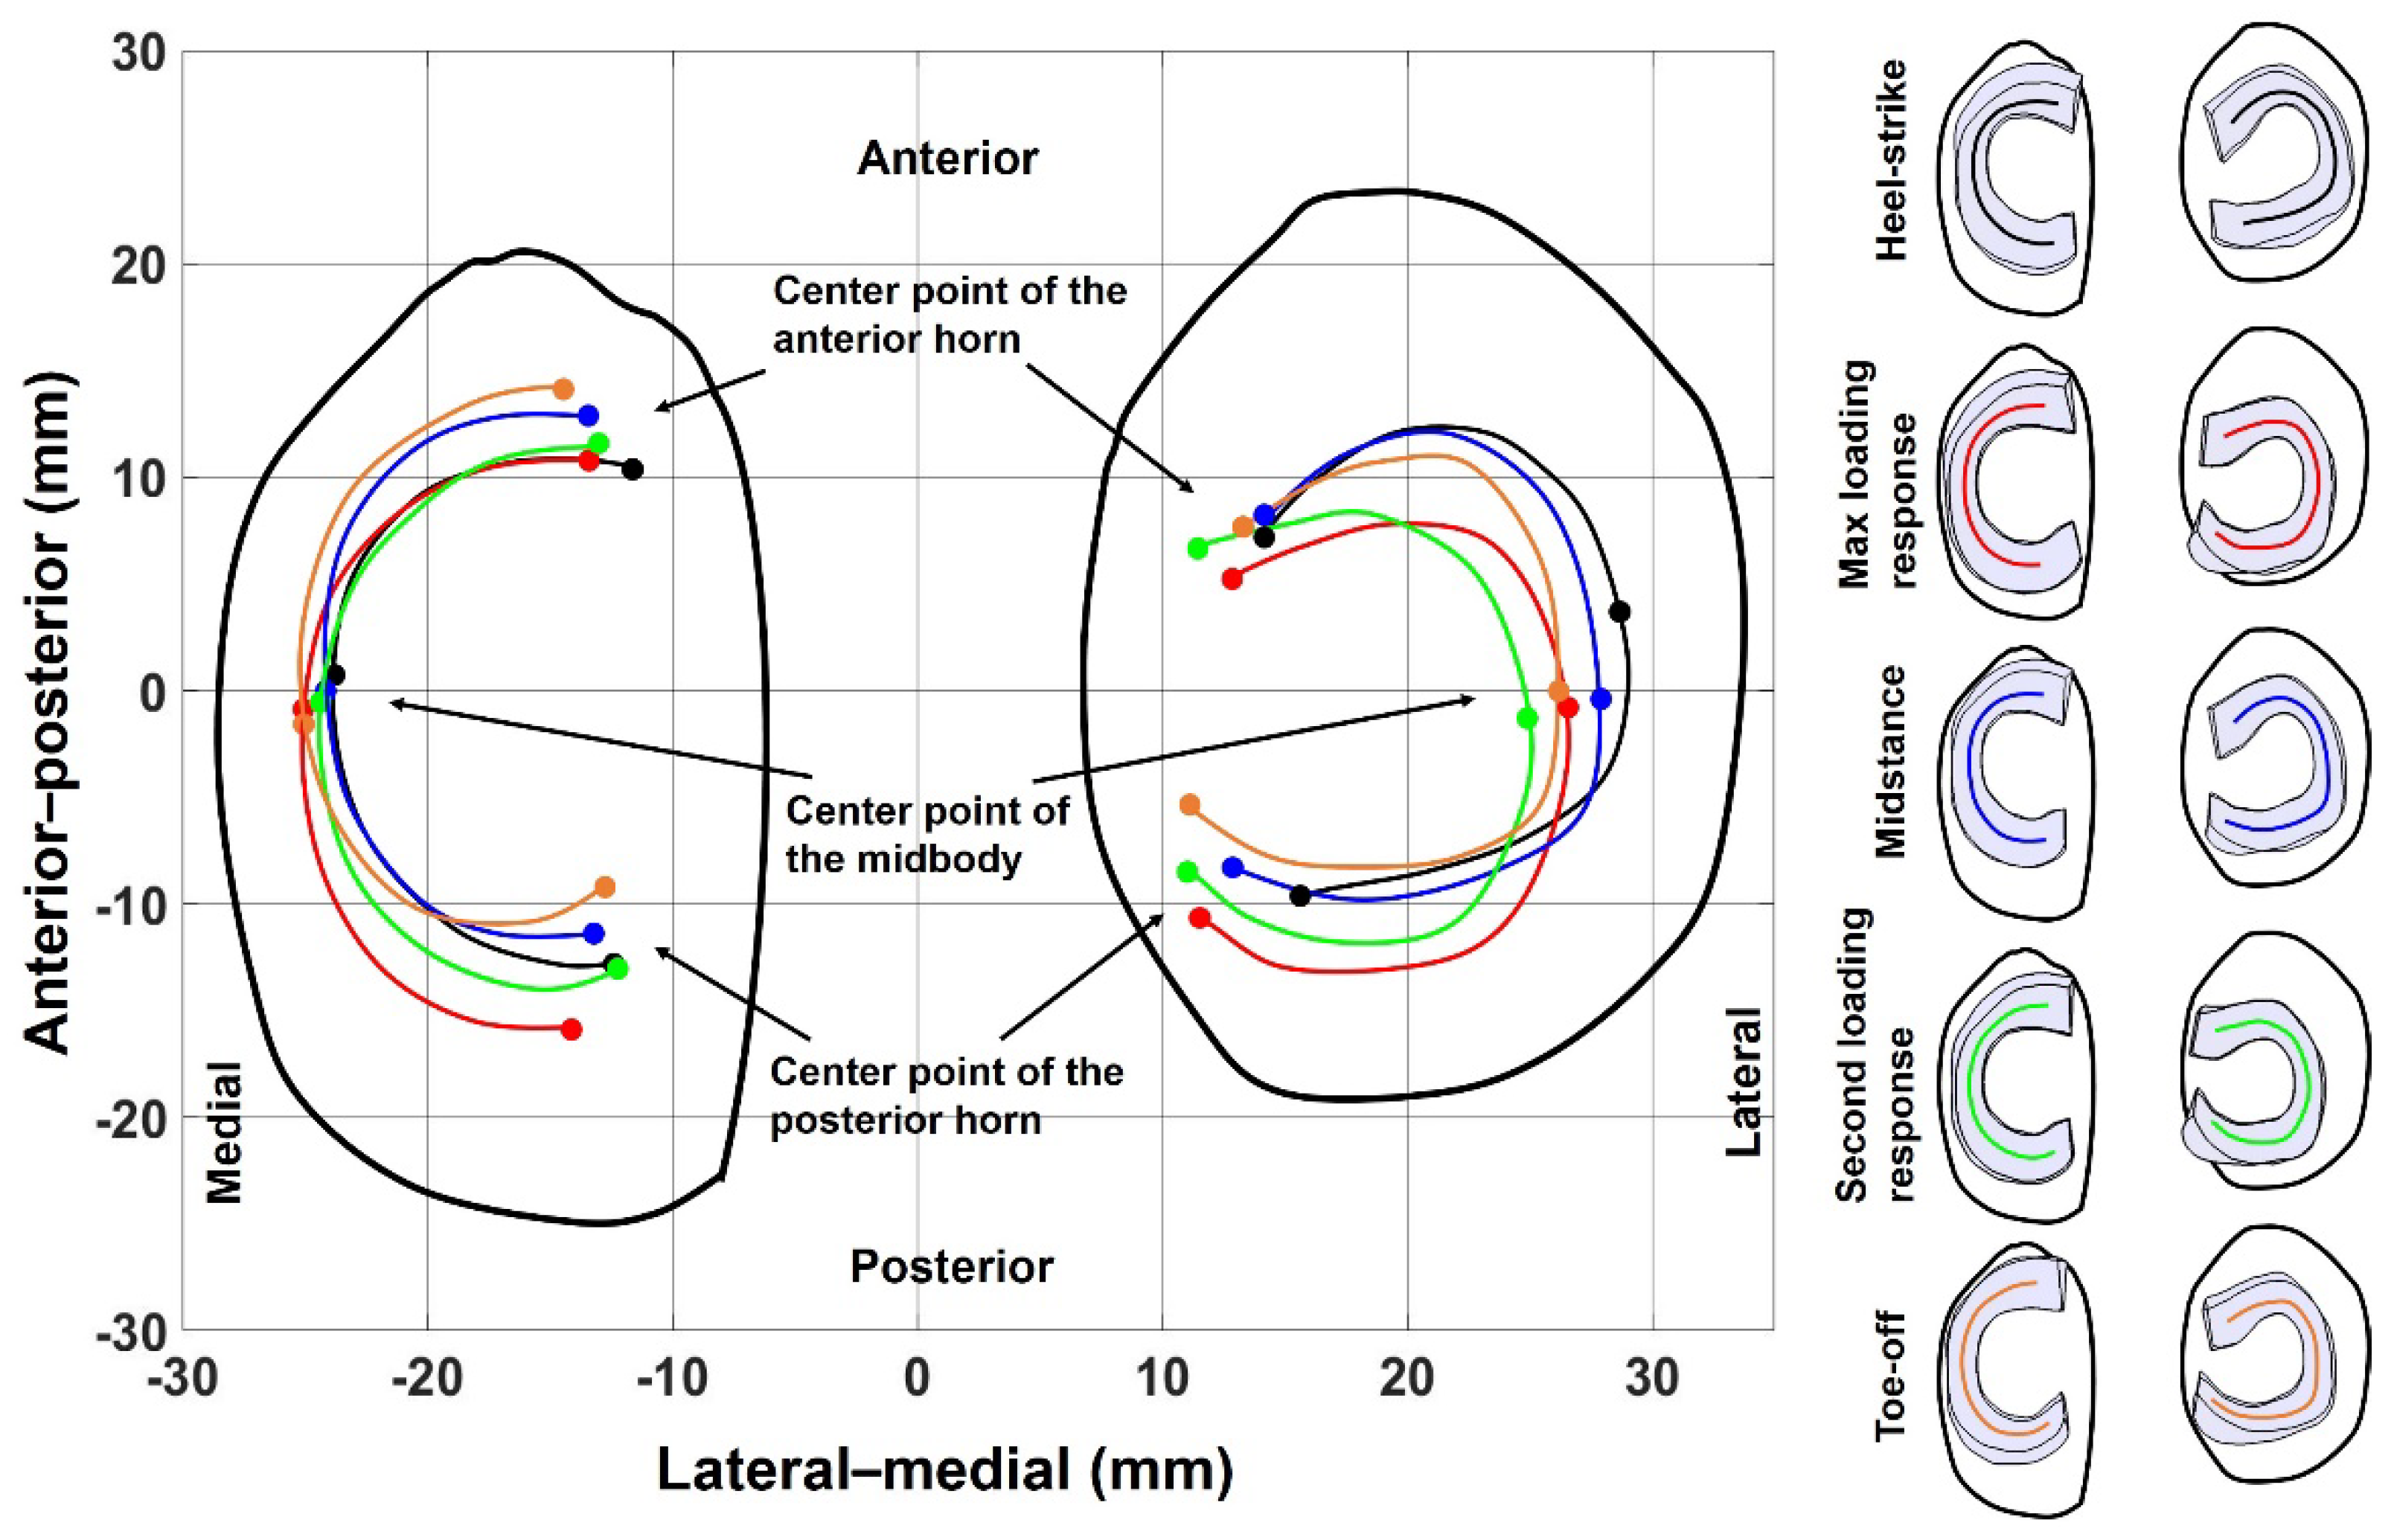
Previous studies showed noticeable subject-dependent variations in both the trend and magnitude of experimental secondary kinematics obtained by mobile X-ray or MRI imaging [20,32,33], as shown in Figure 4. However, the varus–valgus, anterior–posterior, and medial–lateral translations predicted in the present study were in excellent agreement with this previous experimental data (Figure 4). The peak internal rotation occurred 8.8° from the approximately maximal loading response, and afterward, the tibia externally rotated until back to the initial angle of 0° during toe-off. However, discrepancies were observed between the experimental and predicted magnitudes of the internal–external rotation. The eight muscle forces surrounding the knee joint were estimated as shown in Figure 5. The quadriceps femoris muscles (vastus intermedius, vastus lateralis, and vastus medialis) exhibited a similar trend with peaks (206, 207, and 212 N, respectively) during midstance, and rectus femoris showed large forces (452 N) during preswing. The force of the biceps femoris (short head) was largest (256 N) at heel-off. The biceps femoris (long head), semimembranosus, and semitendinosus showed similar trends with maximum forces (206, 311.2, and 218 N, respectively) at the beginning that decreased throughout the stance phase. The peak force on the ACL was 324.7 N at toe-off. The MCL was activated with peak forces of 230.4 N only during preswing. The PCL and LCL activity exhibited complex trends, with peak forces (188.5 and 78.9 N) occurring during preswing and the terminal stance, respectively. Medial meniscal translocation mainly occurred in the anterior–posterior direction, while the lateral meniscus moved in both the anterior–posterior and medial–lateral directions (Figure 6). For the medial meniscus, in the anterior–posterior direction, the most pronounced translocation (3.3 mm) was exhibited in the anterior horn during toe-off. The maximum anterior (3 mm) and posterior (3.1 mm) translocations were observed in the posterior horn during toe-off and the maximum loading response (1st peak vertical GRF), respectively. Slight variations in the translocation were detected in the midbody of the medial meniscus. There was evident translocation on the midbody and posterior horn in the lateral meniscus. During the second loading, the maximum lateral meniscal translations in the medial direction were exhibited in the anterior horn (2.6 mm), midbody (4 mm), and posterior horn (4.8 mm). The peak contact pressures on the medial and lateral tibial cartilages were 11.3 and 11.2 MPa at maximum loading response and during the second loading response, respectively (Figure 7). The peak contact pressure and contact area at the medial tibia plateau cartilage were higher than those on the lateral side.

4. Discussion

In this study, an FEMS model of the lower limb was developed to simultaneously estimate the knee kinematics, the contact mechanics, the muscle forces, and the ligament forces. This model included the tissue geometries of the entire knee joint and combined muscle modeling and detailed soft tissue deformable FE analysis into a single framework. The model has a crucial advantage in that the muscle force optimization takes into account the knee secondary kinematics, the soft tissue deformation, and the ligament forces. The second advantage of the model is that the modeling includes the actual knee joint contact behavior at the femoral cartilage–tibial cartilage, femoral cartilage–meniscus, and tibial cartilage–meniscus interfaces, instead of simplified tibiofemoral contact behavior. To the best of our knowledge, no previous studies have integrated all of the abovementioned functional couplings into a single model framework. Finally, the model can be driven by IMU sensors alone, which is expected to enable widespread clinical use in applications such as analyses of the knee joint under various activities, rehabilitation assessments, evaluations of the function of total knee replacements, and analyses of some daily activities [35,36,37].

4.1. Kinematics, Kinetics, and Ligament Force

The predicted varus–valgus, anterior–posterior, and medial–lateral translations were in excellent agreement with experimental results (Figure 4). The maximum internal rotation occurred during the 10% stance phase, which tended to be earlier than in the experimental results (Figure 4). The peak forces of the biceps femoris (short and long heads), semimembranosus, and semitendinosus co-occurred at the 10% stance phase. The sum of the forces of the semimembranosus and semitendinosus was greater than that of the biceps femoris (short and long heads). Thus, the total activity of those muscles acted as an internal rotator of the knee, which could be the reason for the inconsistency between the predicted and experimental internal rotations. From midway through a single-support stance, the model knee continued to rotate externally without presenting a trend of internal rotation, which is different from what was observed experimentally (Figure 4). The biceps femoris (short head) in the component of the hamstrings is activated only during this phase, which might explain the discrepancy in the rotation.
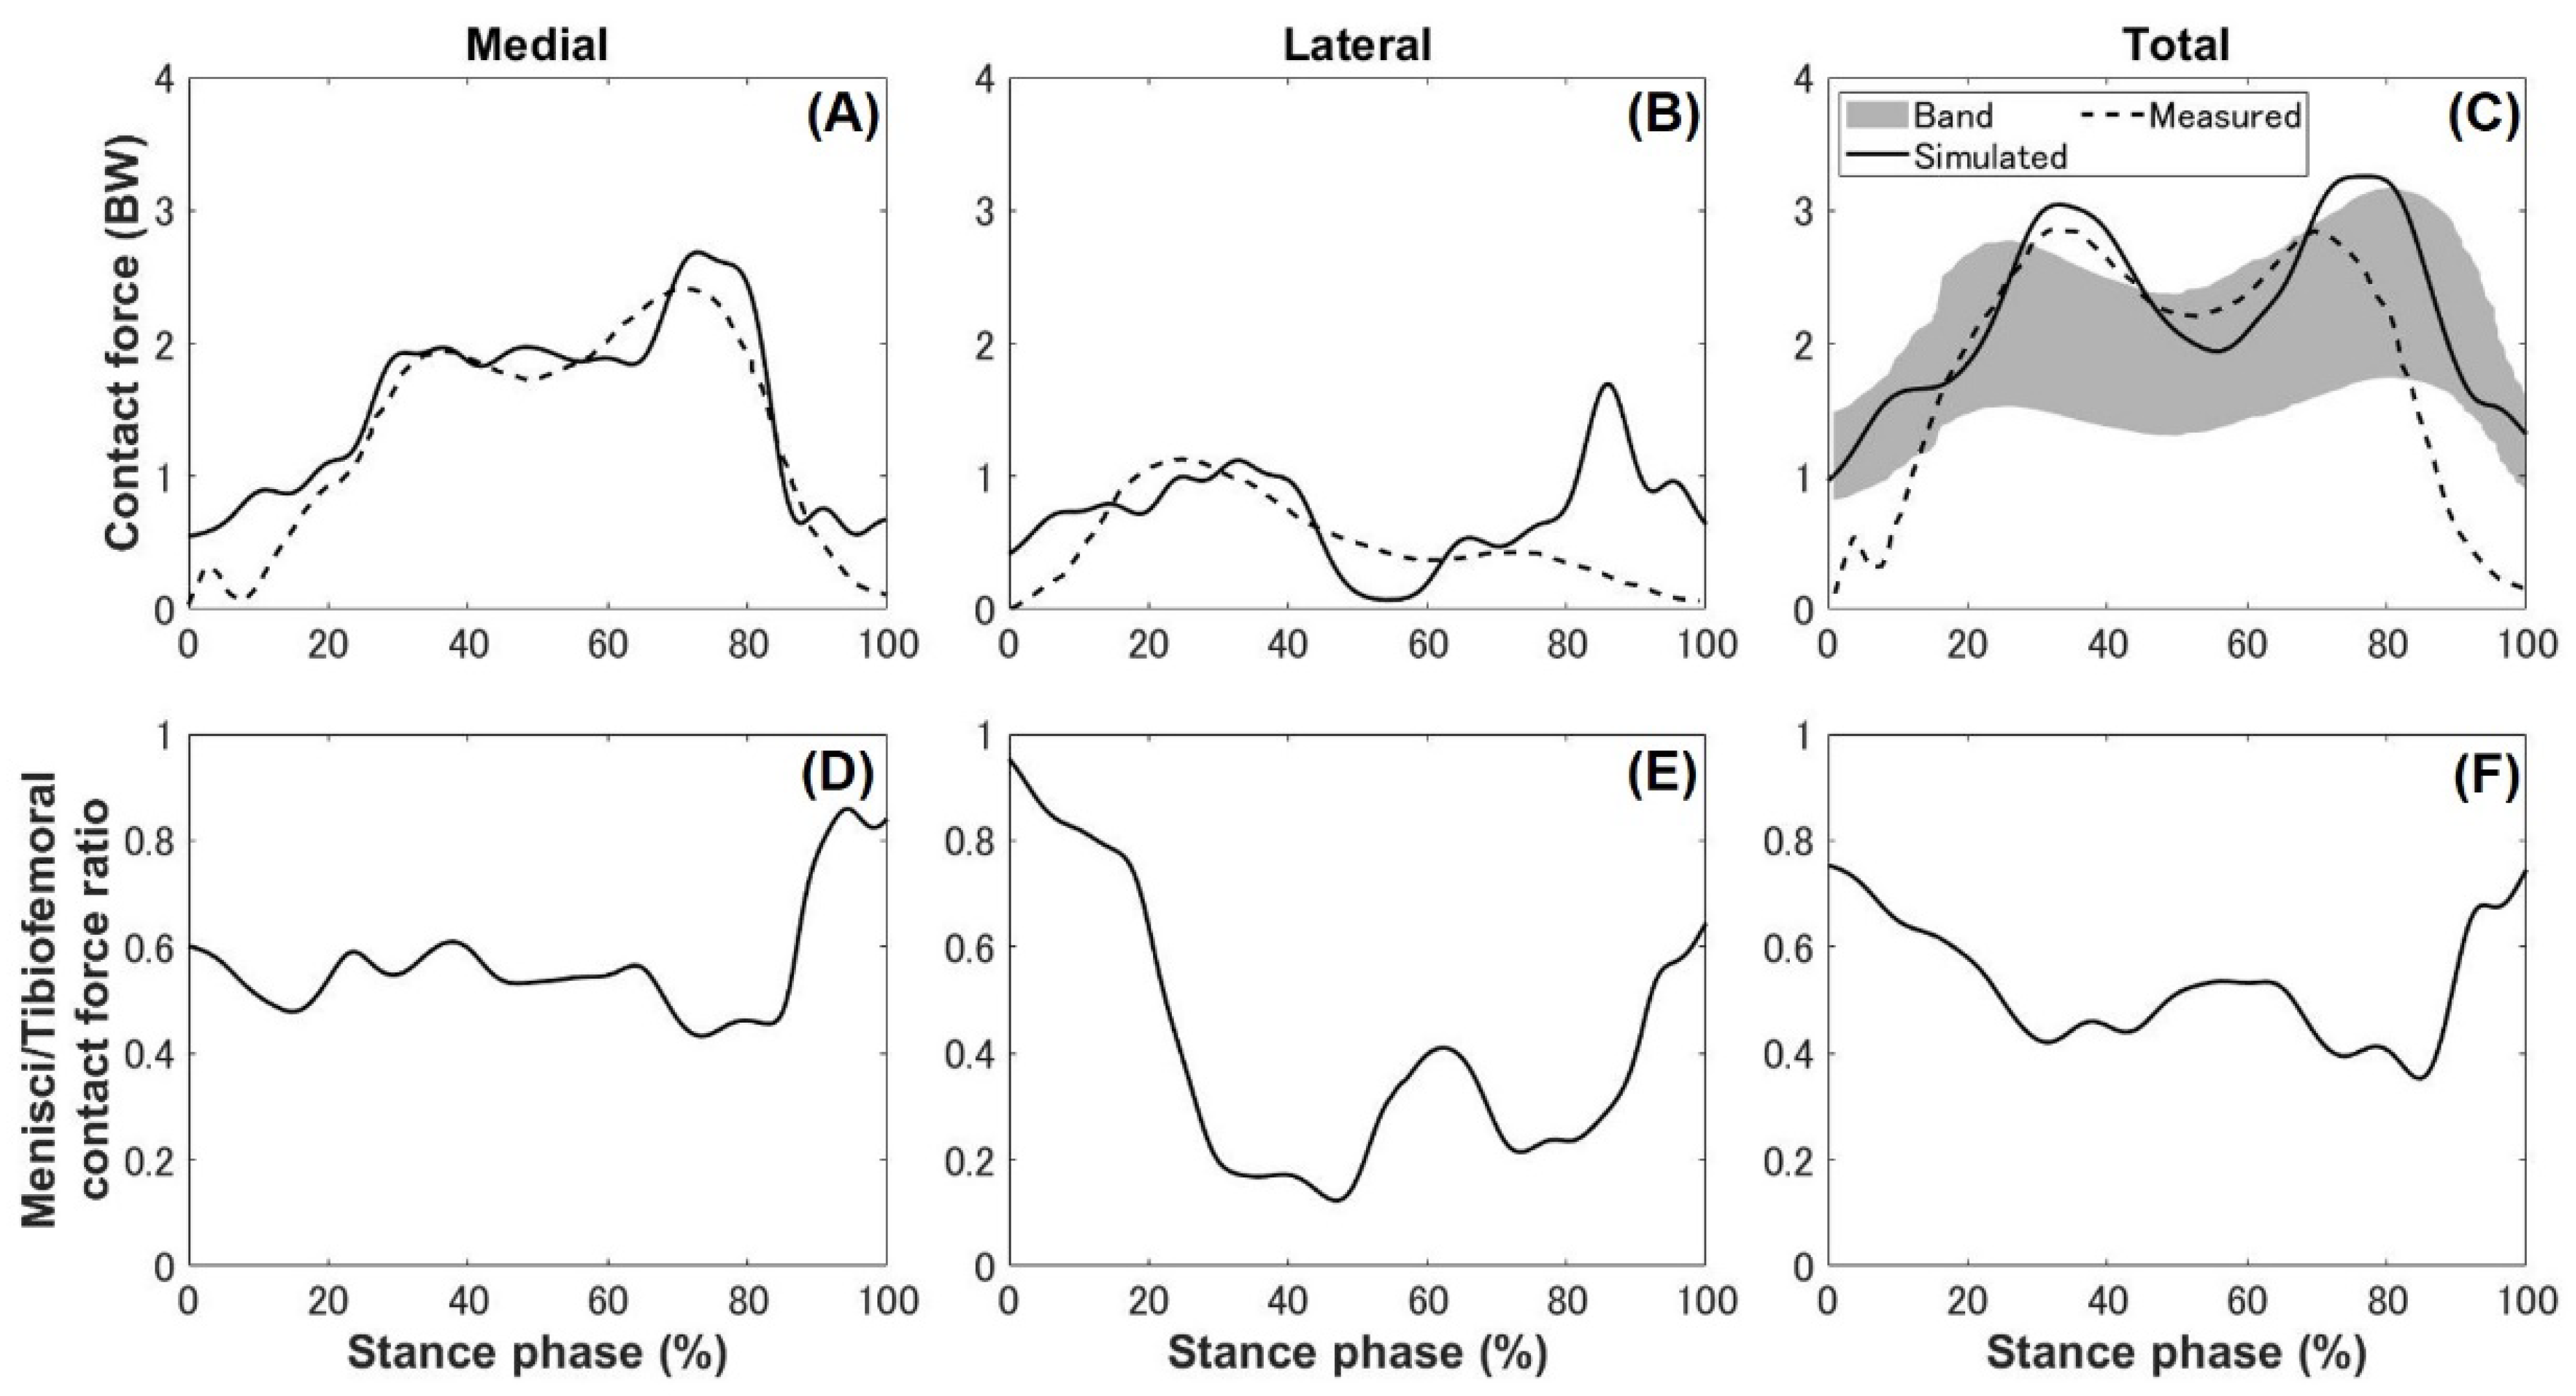
The normalized total knee joint force showed a characteristic double peak during the stance phase, which compares favorably to the experimental data [38,39], as shown in Figure 8. The peak force of 3.26 times the bodyweight estimated by the model was consistent with the predicted results from the other publications [40]. The contact force on the medial side was found to be greater than that on the lateral side. The maximum contact pressure occurred at the maximum loading response, but the peak contact force occurred at the second loading response, which means that the contact area at that phase was smaller than that in the maximum loading response on the medial side. The minimum force was exhibited midway through the single-support stance on the lateral side because the vertical valley of GRF also occurred at the same time. The ratio of the medial cartilage–meniscus contact force to whole tibiofemoral contact force was 0.65 ± 0.22, which illustrates the essential function of the medial meniscus in load sharing. In contrast, the lateral cartilage–meniscus contact force ratio exhibited remarkably irregularities. The menisci bore almost all of the load from the lateral side during the first 20% of the stance phase, while in the remaining 80%, the tibial cartilage bore more of the load than the menisci. The total meniscus contact force ratio estimated by the model was 0.6 ± 0.15, which was similar to experimental data showing the meniscus carried between 44% and 78% of the load [41]. The ligament forces predicted by the models agreed well with the knee kinematics. Posterior translation occurred during the loading response, while the PCL activated to constrain the motion. The ACL and PCL were equally prominent during the preswing; the reason for this might be the combined effect of the rotation and anterior–posterior translation, as opposed to simply the result of the translation motion. Catalfamo et al. [42] reported ligaments mainly activating during the terminal stance and the preswing, which is consistent with our observations, despite discrepancies in the magnitudes. However, ultimately, the predicted ligament forces could not be verified, because measurements were not possible from the experiments.

4.2. Meniscal Translocation and Deformation

Overall, the change in location of the medial meniscus midbody was minimal. A similar, previous finding showed that, in comparison with the anterior and posterior horns, relatively little movement takes place in the midbody [43]. In contrast, the whole lateral meniscus, both the anterior and posterior horns, and the midbody showed large displacements. This result shows a similar trend to results from a previous study [44].
The application of the maximum vertical loading of the GRF caused a large deformation of the medial meniscus, and the posterior horn showed the highest posterior translocation. The tibial posterior translation occurred at the maximum loading response but with a posterior displacement of the entire lateral meniscus. The reason for this is that the internal rotation of the tibia played an essential role with the pivot point closer to the medial side than the lateral. In the second loading response, the anterior and posterior horns and the midbody of the lateral meniscus simultaneously achieved their peak medial displacements because the tibia was in the maximum lateral position. However, integrative action of the tibial anterior translation and external rotation did not cause the posterior translocation of the medial meniscus as expected, which might have been because tremendous pressure magnitudes and distributions were causing the meniscus to deform rather than displace, as similarly concluded in a previous study [45]. During preswing, the posterior horn of the lateral meniscus showed peak anterior translocation, the anterior horn and midbody showed slightly anterior translocations with the external rotation of the tibia, and the tibial posterior translation played a crucial role in causing the anterior displacement of the medial meniscus.

4.3. Limitations

This study had a number of limitations. First, only one participant with a single walking trial was used because the focus was on the development of a new approach, i.e., a single FEMS model framework driven solely by a sensor. Moreover, the developed model was compared and validated against experimental data. It must be acknowledged that the lack of quantification of the gait speed and performance of only one single walking trial over a distance of 5 m may not represent the normal walking patterns of the participant. In future work, we recommend the use of subject-specific scaling modelling techniques based on a range of anthropometric and MRI images of the participant’s knee joint and related soft tissues, and multiple trials of gait and other daily activities for longer periods of time. Second, the ligaments were simplified as one-dimensional, elastic elements to reduce the computational expense. However, because wrapping and realistic soft tissue contact are not included in the model, this may result in prediction error. Third, the predicted muscle forces were not compared with corresponding experimental data, such as electromyography signals, although the knee contact forces explained by the balance of the muscle forces and ligament restraint were experimentally validated and compared with the previous estimated results. Furthermore, the GRFs were directly applied to the mass centers of the feet. In the future, we will consider adding the floor–foot contact model to our model. A final limitation was that the fully converged calculation in the stance phase took approximately 20 h of computation time on a personal computer (Windows 10 Pro, Intel 14 cores i9-7940X, 128GB RAM). However, mesh optimization for the soft tissue model can dramatically decrease solution speeds.

Author Contributions

Conceptualization, S.W., K.H. and S.O.; methodology, S.W., K.H. and S.O.; software, S.W.; validation, S.W. and K.H.; formal analysis, S.W.; investigation, S.W.; resources, K.H.; data curation, S.W. and K.H.; writing—original draft preparation, S.W.; writing—review and editing, S.W., K.H. and S.O.; visualization, S.W.; supervision, K.H.; project administration, K.H.; funding acquisition, K.H. and S.O. All authors have read and agreed to the published version of the manuscript.

Funding

This research was funded by Japan Society for the Promotion of Science Grant-in-Aid for Scientific Research (B) 19H03970.

Institutional Review Board Statement

The study was conducted according to the guidelines of the Declaration of Helsinki, and approved by the research ethics committee of the Tokyo Metropolitan University (protocol code: H2-120 and date of approval: 17 November 2019).

Informed Consent Statement

Informed consent was obtained from all subject involved in the study.

Data Availability Statement

The data presented in this study are available on request from the corresponding author.

Acknowledgments

We would like to express our gratitude to the Nagoya Orthopedic Surgery and Artificial Joint Clinic for providing medical images of patients.

Conflicts of Interest

The authors declare no conflict of interest.

Appendix A

The total external force was determined from Newton’s second law by balancing the sum of forces on both the left and right lower limbs, as [46]
F g l + F g r = i = 1 n m i ( a i g ) ,
where F g l and F g r are the GRFs of the left and right feet, respectively; n is the total number of segments; m i is the mass of the ith segment; a i is the linear acceleration of the center of mass of the ith segment; and g is the acceleration due to gravity.
The total external moment applied to both feet can be calculated from Euler’s equation, as [46]
M g l + M g r = i = 1 n [ I i ω ˙ i + ω i × ( I i ω i ) ] i = 1 n k = 1 n i ( p i k × F i k ) ,
where M g l and M g r are the ground reaction moments (GRMs) of the left and right feet, respectively; n i is the number of segment endpoints; I i is the inertia tensor of the center of mass of the ith segment; ω i and ω ˙ i are the angular velocity and acceleration, respectively, of the ith segment; p i k is the position vector of the kth endpoint of the ith segment with respect to its center of mass position; and F i k is the resultant force at the kth endpoint of the ith segment. All variables are represented in the global coordinate system.

Appendix B

The muscle forces were optimized by minimizing the sum of the cube of the muscular activation s u as follows,
M j = u ( r j u × f u ( s u ) b j u ) ,  
C = min   u s u 3 ,
where j indicates the joint, u indicates the muscle, M j is the moment of the jth joint for the right lower limb, r j u the moment arm vector of the jth joint, and b j u is the orientation vector of the uth muscle. With each muscular activation considered as a variable, the muscle force can be roughly expressed as a function f u ( s u ) of the activation. In addition, the muscular activations were constrained to be in the range of zero to one (inclusive).

References

  1. Baliunas, A.J.; Hurwitz, D.E.; Ryals, A.B.; Karrar, A.; Case, J.P.; Block, J.A.; Andriacchi, T.P. Increased knee joint loads during walking are present in subjects with knee osteoarthritis. Osteoarthr. Cartil. 2002, 10, 573–579. [Google Scholar] [CrossRef] [PubMed] [Green Version]
  2. Heiden, T.L.; Lloyd, D.G.; Ackland, T.R. Knee joint kinematics, kinetics and muscle co-contraction in knee osteoarthritis patient gait. Clin. Biomech. 2009, 24, 833–841. [Google Scholar] [CrossRef] [PubMed]
  3. Delp, S.L.; Loan, J.P.; Hoy, M.G.; Zajac, F.E.; Topp, E.L.; Rosen, J.M. An interactive graphics-based model of the lower extremity to study orthopaedic surgical procedures. IEEE Trans. Biomed. Eng. 1990, 37, 757–767. [Google Scholar] [CrossRef] [PubMed]
  4. Donahue, T.L.H.; Hull, M.L.; Rashid, M.M.; Jacobs, C.R. A finite element model of the human knee joint for the study of tibio-femoral contact. J. Biomech. Eng. 2002, 124, 273–280. [Google Scholar] [CrossRef] [PubMed]
  5. Halonen, K.S.; Dzialo, C.M.; Mannisi, M.; Venäläinen, M.S.; Zee, M.D.; Andersen, M.S. Workflow assessing the effect of gait alterations on stresses in the medial tibial cartilage-combined musculoskeletal modelling and finite element analysis. Sci. Rep. 2017, 7, 17396. [Google Scholar] [CrossRef] [PubMed]
  6. Park, S.; Lee, S.; Yoon, J.; Chae, S.W. Finite element analysis of knee and ankle joint during gait based on motion analysis. Med. Eng. Phys. 2019, 63, 33–41. [Google Scholar] [CrossRef]
  7. Shu, L.; Yamamoto, K.; Yao, J.; Saraswat, P.; Liu, Y.; Mitsuishi, M.; Sugita, N. A subject-specific finite element musculoskeletal framework for mechanics analysis of a total knee replacement. J. Biomech. 2018, 77, 146–154. [Google Scholar] [CrossRef] [PubMed]
  8. Hume, D.R.; Navacchia, A.; Ali, N.A.; Shelburne, K.B. The interaction of muscle moment arm, knee laxity, and torque in a multi-scale musculoskeletal model of the lower limb. J. Biomech. 2016, 76, 173–180. [Google Scholar] [CrossRef]
  9. Marouane, H.; Adl, A.S.; Adouni, M. 3D active-passive response of human knee joint in gait is markedly altered when simulated as a planar 2D joint. Biomech. Model. Mechanobiol. 2017, 16, 693–703. [Google Scholar] [CrossRef] [PubMed]
  10. Ali, A.A.; Shalhoub, S.S.; Cyr, A.J.; Fitzpatrick, C.K.; Maletsky, L.P.; Rullkoetter, P.J.; Shelburne, K.B. Validation of predicted patellofemoral mechanics in a finite element model of the healthy and cruciate-deficient knee. J. Biomech. 2016, 49, 302–309. [Google Scholar] [CrossRef] [PubMed] [Green Version]
  11. Lenhart, R.L.; Kaiser, J.; Smith, C.R.; Thelen, D.G. Prediction and validation of load-dependent behavior of the tibiofemoral and patellofemoral joints during movement. Ann. Biomed. Eng. 2015, 43, 2675–2685. [Google Scholar] [CrossRef] [Green Version]
  12. Mononen, M.E.; Jurvelin, J.S.; Korhonen, R.K. Effects of radial tears and partial meniscectomy of lateral meniscus on the knee joint mechanics during the stance phase of the gait cycle-a 3D finite element study. J. Orthop. Res. 2012, 31, 1208–1217. [Google Scholar] [CrossRef] [PubMed]
  13. Harato, K.; Sakurai, A.; Kudo, Y.; Nagura, T.; Masumoto, K.; Otani, T.; Niki, Y. Three-dimensional knee kinematics in patients with a discoid lateral meniscus during gait. Knee 2016, 23, 622–626. [Google Scholar] [CrossRef] [PubMed]
  14. Ahmed, A.; Burke, D. In-vitro of measurement of static pressure distribution in synovial joints–part I: Tibial surface of the knee. J. Biomech. Eng. 1983, 105, 216–225. [Google Scholar] [CrossRef] [PubMed]
  15. Hu, J.; Xin, H.; Chen, Z.; Zhang, Q.; Peng, Y.; Jin, Z. The role of menisci in knee contact mechanics and secondary kinematics during human walking. Clin. Biomech. 2019, 61, 58–63. [Google Scholar] [CrossRef] [PubMed] [Green Version]
  16. Mo, F.; Li, J.; Dan, M.; Liu, T.; Behr, M. Implementation of controlling strategy in a biomechanical lower limb model with active muscles for coupling multibody dynamics and finite element analysis. J. Biomech. 2019, 91, 51–60. [Google Scholar] [CrossRef]
  17. Cardona, M.; Cena, C.E.G. Biomechanical analysis of the lower limb: A full-body musculoskeletal model for muscle-driven simulation. IEEE Access 2019, 7, 92709–92723. [Google Scholar] [CrossRef]
  18. Lathrop, R.L.; Chaudhari, A.M.W.; Siston, R.A. Comparative assessment of bone pose estimation using point cluster technique and OpenSim. J. Biomech. Eng. 2011, 133, 114503. [Google Scholar] [CrossRef] [PubMed]
  19. Navacchia, A.; Hume, D.R.; Rullkoetter, P.J.; Shelburne, K.B. A computationally efficient strategy to estimate muscle forces in a finite element musculoskeletal model of the lower limb. J. Biomech. 2019, 84, 94–102. [Google Scholar] [CrossRef]
  20. Gray, H.A.; Guan, S.; Thomeer, L.T.; Schache, A.G.; Steiger, R.D.; Pandy, M.G. Three-dimensional motion of the knee-joint complex during normal walking revealed by mobile biplane X-ray imaging. J. Orthop. Res. 2019, 37, 615–630. [Google Scholar] [CrossRef] [PubMed]
  21. Cho, Y.S.; Jang, S.H.; Cho, J.S.; Kim, M.J.; Lee, H.D.; Lee, S.Y.; Moom, S.B. Evaluation of validity and reliability of inertial measurement unit-based gait analysis systems. Ann. Rehabil. Med. 2018, 42, 872–883. [Google Scholar] [CrossRef] [Green Version]
  22. Hindle, B.R.; Keogh, J.W.; Lorimer, A.V. Inertial-based human motion capture: A technical summary of current processing methodologies for spatiotemporal and kinematic measures. Appl. Bionics Biomech. 2021, 2021, 6628320. [Google Scholar] [CrossRef] [PubMed]
  23. McCann, L.; Ingham, E.; Jin, Z.; Fisher, J. Influence of the meniscus on friction and degradation of cartilage in the natural knee joint. Osteoarthr. Cartil. 2009, 17, 995–1000. [Google Scholar] [CrossRef] [PubMed] [Green Version]
  24. Ali, A.A.; Harris, M.D.; Shalhoub, S.; Maletsky, L.P.; Rullkoetter, P.J.; Shelburne, K.B. Combined measurement and modeling of specimen-specific knee mechanics for healthy and ACL-deficient conditions. J. Biomech. 2017, 57, 117–124. [Google Scholar] [CrossRef] [PubMed] [Green Version]
  25. Delp, S.L.; Anderson, F.C.; Arnold, A.S.; Loan, P.; Habib, A.; John, C.T.; Guendelman, E.; Thelen, D.G. OpenSim: Open-source software to create and analyze dynamic simulations of movement. IEEE Trans. Biomed. Eng. 2007, 54, 1940–1950. [Google Scholar]
  26. Li, G.; Lopez, O.; Rubash, H. Variability of a three dimensional finite element model constructed using magnetic resonance images of a knee for joint contact stress analysis. J. Biomech. Eng. 2001, 123, 341–346. [Google Scholar] [CrossRef]
  27. Yao, J.; Snibbe, J.; Maloney, M.; Lerner, A.L. Stresses and strains in the medial meniscus of an ACL deficient knee under anterior loading: A finite element analysis with image-based experimental validation. J. Biomech. Eng. 2006, 128, 135–141. [Google Scholar] [CrossRef]
  28. Ren, L.; Jones, R.K.; Howard, D. Whole body inverse dynamics over a complete gait cycle based only on measured kinematics. J. Biomech. 2008, 41, 2750–2759. [Google Scholar] [CrossRef]
  29. Hase, K.; Yamazaki, N. Computer simulation study of human locomotion with a three-dimensional entire-body neuro-musculo-skeletal model (I. Acquisition of normal walking). JSME Int. J. 2002, 45, 1040–1050. [Google Scholar] [CrossRef] [Green Version]
  30. O’Donovan, K.J.; Kamnik, R.; O’Keeffe, D.T.; Lyons, G.M.A. An inertial and magnetic sensor based technique for joint angle measurement. J. Biomech. 2007, 40, 2604–2611. [Google Scholar] [CrossRef]
  31. Du, J.; Gerdtman, C.; Lindén, M. Signal quality improvement algorithms for MEMS gyroscope-based human motion analysis systems: A systematic review. Sensors 2018, 18, 1123. [Google Scholar] [CrossRef] [Green Version]
  32. Kozanek, M.; Hosseini, A.; Liu, F.; Van de Velde, S.K.; Gill, T.J.; Rubash, H.E.; Li, G. Tibiofemoral kinematics and condylar motion during the stance phase of gait. J. Biomech. 2009, 43, 1877–1884. [Google Scholar] [CrossRef] [Green Version]
  33. Clément, J.; Toliopoulos, P.; Hagemeister, N.; Desmeules, F.; Fuentes, A.; Vendittoli, P.A. Healthy 3D knee kinematics during gait: Differences between women and men, and correlation with X-ray alignment. Gait Post. 2018, 64, 198–204. [Google Scholar] [CrossRef]
  34. Trinler, U.; Schwameder, H.; Baker, R.; Alexander, N. Muscle force estimation in clinical gait analysis using AnyBody and OpenSim. J. Biomech. 2019, 86, 55–63. [Google Scholar] [CrossRef] [PubMed]
  35. Cen, X.; Lu, Z.; Baker, J.; István, B.; Gu, Y. A Comparative Biomechanical Analysis during Planned and Unplanned Gait Termination in Individuals with Different Arch Stiffnesses. Appl. Sci. 2021, 11, 1871. [Google Scholar] [CrossRef]
  36. Dempster, J.; Dutheil, F.; Ugbolue, U.C. The Prevalence of Lower Extremity Injuries in Running and Associated Risk Factors: A Systematic Review. J. Phys. Act. Health 2021, 5, 133–145. [Google Scholar] [CrossRef]
  37. Arias, L.M.; Iwaniec, J.; Iwaniec, M. Modeling and Analysis of the Power Conditioning Circuit for an Electromagnetic Human Walking-Induced Energy Harvester. Energies 2021, 14, 3367. [Google Scholar] [CrossRef]
  38. Bergmann, G.; Bender, A.; Graichen, F.; Dymke, J.; Rohlmann, A.; Trepczynski, A.; Heller, M.O.; Kutzner, I. Standardized loads acting in knee implants. PLoS ONE 2014, 9, e86035. [Google Scholar] [CrossRef] [Green Version]
  39. Zeighami, A.; Aissaoui, R.; Dumas, R. Knee medial and lateral contact forces in musculoskeletal model with subject-specific contact point trajectories. J. Biomech. 2018, 69, 138–145. [Google Scholar] [CrossRef] [Green Version]
  40. D’Lima, D.D.; Fregly, B.J.; Patil, S.; Steklov, N.; Colwell, C.W.C., Jr. Knee joint force: Prediction, measurement, and significance. Proc. Inst. Mech. Eng. H 2012, 226, 95–102. [Google Scholar] [CrossRef] [PubMed] [Green Version]
  41. Walker, P.S.; Arno, S.; Bell, C.; Salvadore, G.; Borukhov, I.; Oh, C. Function of the medial meniscus in force transmission and stability. J. Biomech. 2015, 48, 1383–1388. [Google Scholar] [CrossRef] [PubMed]
  42. Catalfamo, P.F.; Aguiar, G.; Curi, J.; Braidot, A. Anterior cruciate ligament injury: Compensation during gait using hamstring muscle activity. Open Biomed. Eng. J. 2010, 4, 99–106. [Google Scholar] [CrossRef] [Green Version]
  43. Vedi, V.; Williams, A.; Tennant, S.J.; Spouse, E.; Hunt, D.M.; Gedroyc, W.M.W. Meniscal movement: An in-vivo study using dynamic MRI. Bone Jt. J. 1999, 81, 37–41. [Google Scholar] [CrossRef]
  44. Thompson, W.O.; Thaete, F.L.; Fu, F.H.; Dye, S.F. Tibial meniscal dynamics using three-dimensional reconstruction of magnetic resonance images. Am. J. Sports Med. 1991, 19, 210–215. [Google Scholar] [CrossRef] [PubMed]
  45. Guess, T.M.; Razu, S. Loading of the medial meniscus in the ACL deficient knee: A multibody computational study. Med. Eng. Phys. 2017, 41, 26–34. [Google Scholar] [CrossRef] [Green Version]
  46. Winter, D.A. The Biomechanics and Motor Control of Human Movement; John Wiley & Sons: Hoboken, NJ, USA, 2005; pp. 189–191. [Google Scholar]
Figure 1. The angular velocities ω   I M U i and accelerations a   I M U i of the sensors were converted angular velocities ω i , angular accelerations ω ˙ i , and accelerations a i of the body segments using a sensor-body segment calibration method. The segment data were input into the inverse kinematics and dynamics to predicted the joint primary angles θ p r i (lumbar flexion–extension, hip joint 3-DOF rotations, knee joint flexion–extension, and ankle dorsiflexion–plantarflexion), right lower limb joint moments M j , the GRF F g r of the right foot, muscle lengths l j u , and muscle moment arms r j u The static optimization of the muscle force was performed with the joint moments and the muscle parameters as inputs to predict the muscle force f u . From the muscle forces and the GRF, the knee contact mechanics were computed to predict the secondary kinematics. The predicted knee primary and secondary kinematics were fed back to a new inverse dynamics computation, and the muscle force optimization and knee contact mechanics computation were again performed.
Biomechanics 01 00025 g001
Figure 2. Whole-body model, composed of rigid body models for the HAT segment and left lower limb and a lower limb FEMS model. The whole-body model has 22 DOFs. The lower limb FEMS model includes a 12-DOF nature knee joint, muscles and ligaments (displayed in red), cartilages, and a meniscus (displayed in orange).
Biomechanics 01 00025 g002
Figure 3. Predicted ground reaction forces (solid line) compared with the force plate data (dotted line) for a subject at normal walking speed.
Biomechanics 01 00025 g003
Figure 4. Knee secondary kinematics of the tibia with respect to the femur compared with experimental results from previous studies: (A) external–internal rotation, (B) varus–valgus, (C) anterior–posterior translation, and (D) medial–lateral translation. The measurement data were obtained from (1) Clément et al. [33], (2) Kozanek et al. [32], and (3) Gray et al. [20], and they are shifted to start from zero to excluding difference in the choice of coordinate system.
Biomechanics 01 00025 g004
Figure 5. Predicted forces of eight major lower limb muscles (solid line) compared with the means of the forces estimated by the OpenSim simulation toolkit for biomechanical analyses [34] averaged across 10 participants (dotted line) and fourpredicted ligament forces during a single stance phase.
Biomechanics 01 00025 g005
Figure 6. Predicted meniscal translocations on the tibial cartilage at five postures. The different lines outline the meniscal locations at heel-strike (black), maximum loading response (red), midstance (blue), second loading response (green), and toe-off (yellow). Points display the locations of the anterior and posterior horns and the midbody.
Biomechanics 01 00025 g006
Figure 7. FE analysis result of the contact pressure distribution occurring on the tibial cartilage during the stance phase.
Biomechanics 01 00025 g007
Figure 8. Predicted contact forces of the knee joint (solid line) compared with experimental data (Zeighami et al. 2018) (dotted line) and instrumented knee implant data [38] (shaded area): (A) medial contact force, (B) lateral contact force, (C) total contact force on the medial and lateral sides. Predicted ratios of the meniscal contact forces to total tibiofemoral contact forces: (D) medial ratio, (E) lateral ratio, (F) total ratio.
Biomechanics 01 00025 g008
Table 1. Element types, material properties, and density of the tissues.
TissuesElement TypeYoung’s Modulus
[MPa]
Poisson RatioDensity
[kg/m3]
BonesTriangular shell--1,100,000
Cartilages [26]8-node hexahedra100.461800
Menisci [4,27]8-node hexahedraRadial and axial: 20 In-plane: 0.21800
Circumferential: 140Out-plane: 0.3
Ligaments, Meniscal hornNonlinear spring--1500
Publisher’s Note: MDPI stays neutral with regard to jurisdictional claims in published maps and institutional affiliations.