Article

A Proposed Method for Evaluating Drop Jump Performance with One Force Platform

1
Directorate of Psychology and Sport, University of Salford, Salford M6 6PU, UK
2
Chichester Institute of Sport, University of Chichester, Chichester PO19 6PE, UK
3
Institute for Sport, Physical Activity and Leisure, Leeds Beckett University, Leeds LS16 5LF, UK
4
Centre for Exercise and Sport Science Research, Edith Cowan University, Joondalup, WA 6027, Australia
*
Author to whom correspondence should be addressed.
Biomechanics 2021, 1(2), 178-189; https://doi.org/10.3390/biomechanics1020015
Submission received: 17 June 2021 / Revised: 7 July 2021 / Accepted: 12 July 2021 / Published: 16 July 2021

Abstract

:
The drop jump (DJ) is commonly utilised to assess athletes. The criterion two force platform (2FP) method of assessing DJ performance involves two adjacent force platforms, one for the box and one for the athlete to rebound from. Most researchers and practitioners only have access to one force platform (1FP) and they rarely account for the often considerable discrepancy between box height and drop height (DH). Therefore, this study aimed to determine the criterion validity of evaluating DJ performance with 1FP. Twenty-six young male sports students performed three DJs, from a 0.30 m and 0.40 m high box, on two adjacent force platforms. The DH, touchdown velocity and several performance variables were calculated using the 2FP and 1FP methods. Ordinary least-products regression identified no fixed or proportional bias between methods for any DJ variable. The mean DH was 10% lower than the 0.30 m box and 14% lower than the 0.40 m high box. This discrepancy highlights the importance of accounting for DH when conducting DJ assessments. In conclusion, the 1FP method of evaluating DJ performance is a valid alternative to the criterion 2FP method and could be embedded into automated force analysis software for researchers and practitioners to utilise.

1. Introduction

The drop jump (DJ) is an exercise that is commonly utilised to both assess and train athletes’ stretch–shortening cycle (SSC) ability [1]. The DJ requires the athlete to (1) begin by standing on a box that is usually 0.30–0.40 m high [2], (2) drop from the box, (3) perform a rebound jump when they contact the ground with the aim of minimising contact time (<0.250 s [3] and maximising jump height), and (4) finish with a controlled landing on the ground. The assumption when performing the DJ is that athletes drop from the height of the box. However, box height and drop height (DH) are typically different. In fact, DH was recently estimated to be 28.6–37.4% different to box height when sport students performed DJs from 0.20–0.50 m high boxes [4]. Even the DH calculated for full-time academy rugby players was reported to range from 29.4% lower to 39.5% higher than the 0.20 m box that they started on [5]. This discrepancy is problematic when routinely assessing athletes’ DJ performance, because the testing conditions will be different for each athlete and, perhaps, each time the same athlete performs the test [6]. Any variation in DH changes the mechanical demands of the DJ test. This compromises data accuracy because any DJ performance changes may be a consequence of athletes dropping from different heights from trial to trial.
Due to the advent of cheaper but valid force platform (FP) systems, the DJ is becoming more commonly assessed via a FP, meaning that there is the potential for many variables (with examples listed further below) to be reported. However, not knowing the true height that an athlete drops from during the DJ means that the velocity at which they impact the ground (termed touchdown velocity) cannot be accurately calculated [7,8]. This can be overcome by simultaneously collecting motion data [9], often based on a whole- or partial-body marker system, but this can be time consuming and, therefore, impractical. Consequently, velocity–time and displacement–time records may not be accurately obtained from the DJ force–time records alone, meaning that the braking and propulsion phases of the jump cannot be accurately identified and hence many variables of interest to researchers and practitioners cannot be precisely calculated (e.g., rate of force development, power, and leg stiffness). The only variables that can be calculated with some degree of confidence are peak force, contact time, flight time, jump height (using the flight time method), and reactive strength index (jump height ÷ contact time). While these variables may be sufficient in both quantity and quality, this approach prevents the tester from quantifying the consistency of the athlete’s trial-to-trial DH. Thus, not accounting for DJ DH compromises the accuracy and utility of DJ performance testing [5] and undermines the great potential afforded by FP assessment of the DJ.
Fortunately, some attempts to calculate DJ DH have been made [4,5,7,8,9,10]. Bobbert et al. [10] used one FP (1FP) to estimate the DH of DJs performed from 0.20, 0.40, and 0.60 m from the impulse–momentum relationship, reporting DHs of 0.20, 0.31, and 0.49 m, respectively. The same method was recently used by Gerado et al. [4]. While it provides an estimate of DH, its accuracy is questionable [7,8]. The suggested criterion method of calculating DJ DH involves two FPs (2FP), one placed underneath the box and one positioned directly in front of the box to record the rebound jump element [7,8,9]. The accuracy of the 2FP method depends on the athlete standing still whilst on the first FP to enable numerical integration of the force–time record to calculate velocity–time and displacement–time records [9]. The 2FP method was recently employed by Costley et al. [5]. Ultimately, this method enables centre of mass (COM) velocity and displacement to be calculated between the time when the athletes step off the box and when they contact the second FP, thereby providing accurate DH and touchdown velocity calculations.
A limitation of the 2FP method is that it requires access to two adjacent FPs, with at least one of them large enough to accommodate a box [7,8]. Baca [7] compared the 2FP method to, among other methods, an alternative 1FP method to one first used by Bobbert et al. [10]. This alternative 1FP method involved visually inspecting the post DJ landing velocity–time record to correct the touchdown velocity [7]. Whilst this method showed promise and was suggested to be the best option if only using 1FP (based on percentage differences to the 2FP method), limited methodological details are provided. Furthermore, due to the recent production of commercially available and open access automated force analysis software and increased use of FPs in high performance sports settings, relying on visually inspecting whether and where each athlete remained still after landing from the DJ, to enable the correction of touchdown velocity and the subsequent estimate of DH, presents a barrier to the practical utility of this method (e.g., it is time intensive and cannot be automated). Therefore, the purpose of this study was to build on the method introduced by Baca [7] by establishing the validity of evaluating DJ performance with 1FP when robust, but easily applied, data collection and analyses procedures are employed. It was hypothesised that the 1FP method would be a valid alternative to the criterion 2FP method for calculating DH, touchdown velocity and several typically reported performance variables.

2. Materials and Methods

2.1. Participants

Twenty-six male sports science students (age = 23.8 ± 5.1 years, height = 1.80 ± 0.07 m, body mass = 81.2 ± 11.6 kg) from a variety of sports participated in this study. Participants competed in both team and individual sports and regularly completed one competitive match and two skill sessions per week, and all possessed a minimum of 1 year’s resistance training experience. They had previous experience of completing DJ testing as part of their degree programme and were injury-free at the time of testing. Specifically, any person interested in participating in the study who had sustained a significant lower limb injury within the 6 months prior to testing was excluded from participation. Twenty-six participants were deemed appropriate for the study as it was a similar sample size (n = 22–28) to other recent concurrent validity studies that also included vertical jumping tasks performed on a force platform and ordinary least products regression analyses as the main statistical approach [11,12]. Written informed consent was provided by each participant before testing, the study was pre-approved by the University of Salford Institutional Ethics Committee (No. HST1718-357) and it conformed to the World Medical Association’s Declaration of Helsinki.

2.2. Experimental Design

A cross-sectional design was adopted in this study and all testing was conducted inside a human performance laboratory. Following a brief (~10 min) warm-up comprised of dynamic stretching and sub-maximal jumping (countermovement jumps and rebound jumps) [13,14], participants performed three DJs each from a 0.30 m and a 0.40 m high box in a randomised order. These box heights were selected as they are typically identified as the “optimal” box height in DJ studies [2].
Ground reactions forces were simultaneously recorded from two adjacent in-ground FPs that sampled at 1000 Hz for seven seconds (Advanced Mechanical Technology Inc., Watertown, MA, USA). During each DH condition, the box was placed on one of the FPs and it was zeroed to remove its weight from the subsequent force–time record. After both FPs were zeroed, participants stood completely upright (extended hips and knees) and motionless on the box for at least one second until given the verbal command “drop”. Participants then stepped off the box (they were asked to minimise any raising or lowering of their COM) and were instructed to rebound as “fast and high” as possible upon contacting the second FP before performing a controlled landing on the same (second) FP (Figure 1). Participants immediately stood upright again and were instructed to remain still until the end of data recording [15]. All jumps were performed with hands on hips due to arm swing differentially affecting DJ performance depending on prior experience [16]. Force data were recorded using Qualisys Track Manager software (Qualisys Ltd., Gothenburg, Sweden) with the raw vertical force data saved as text files and analysed in Microsoft Excel.
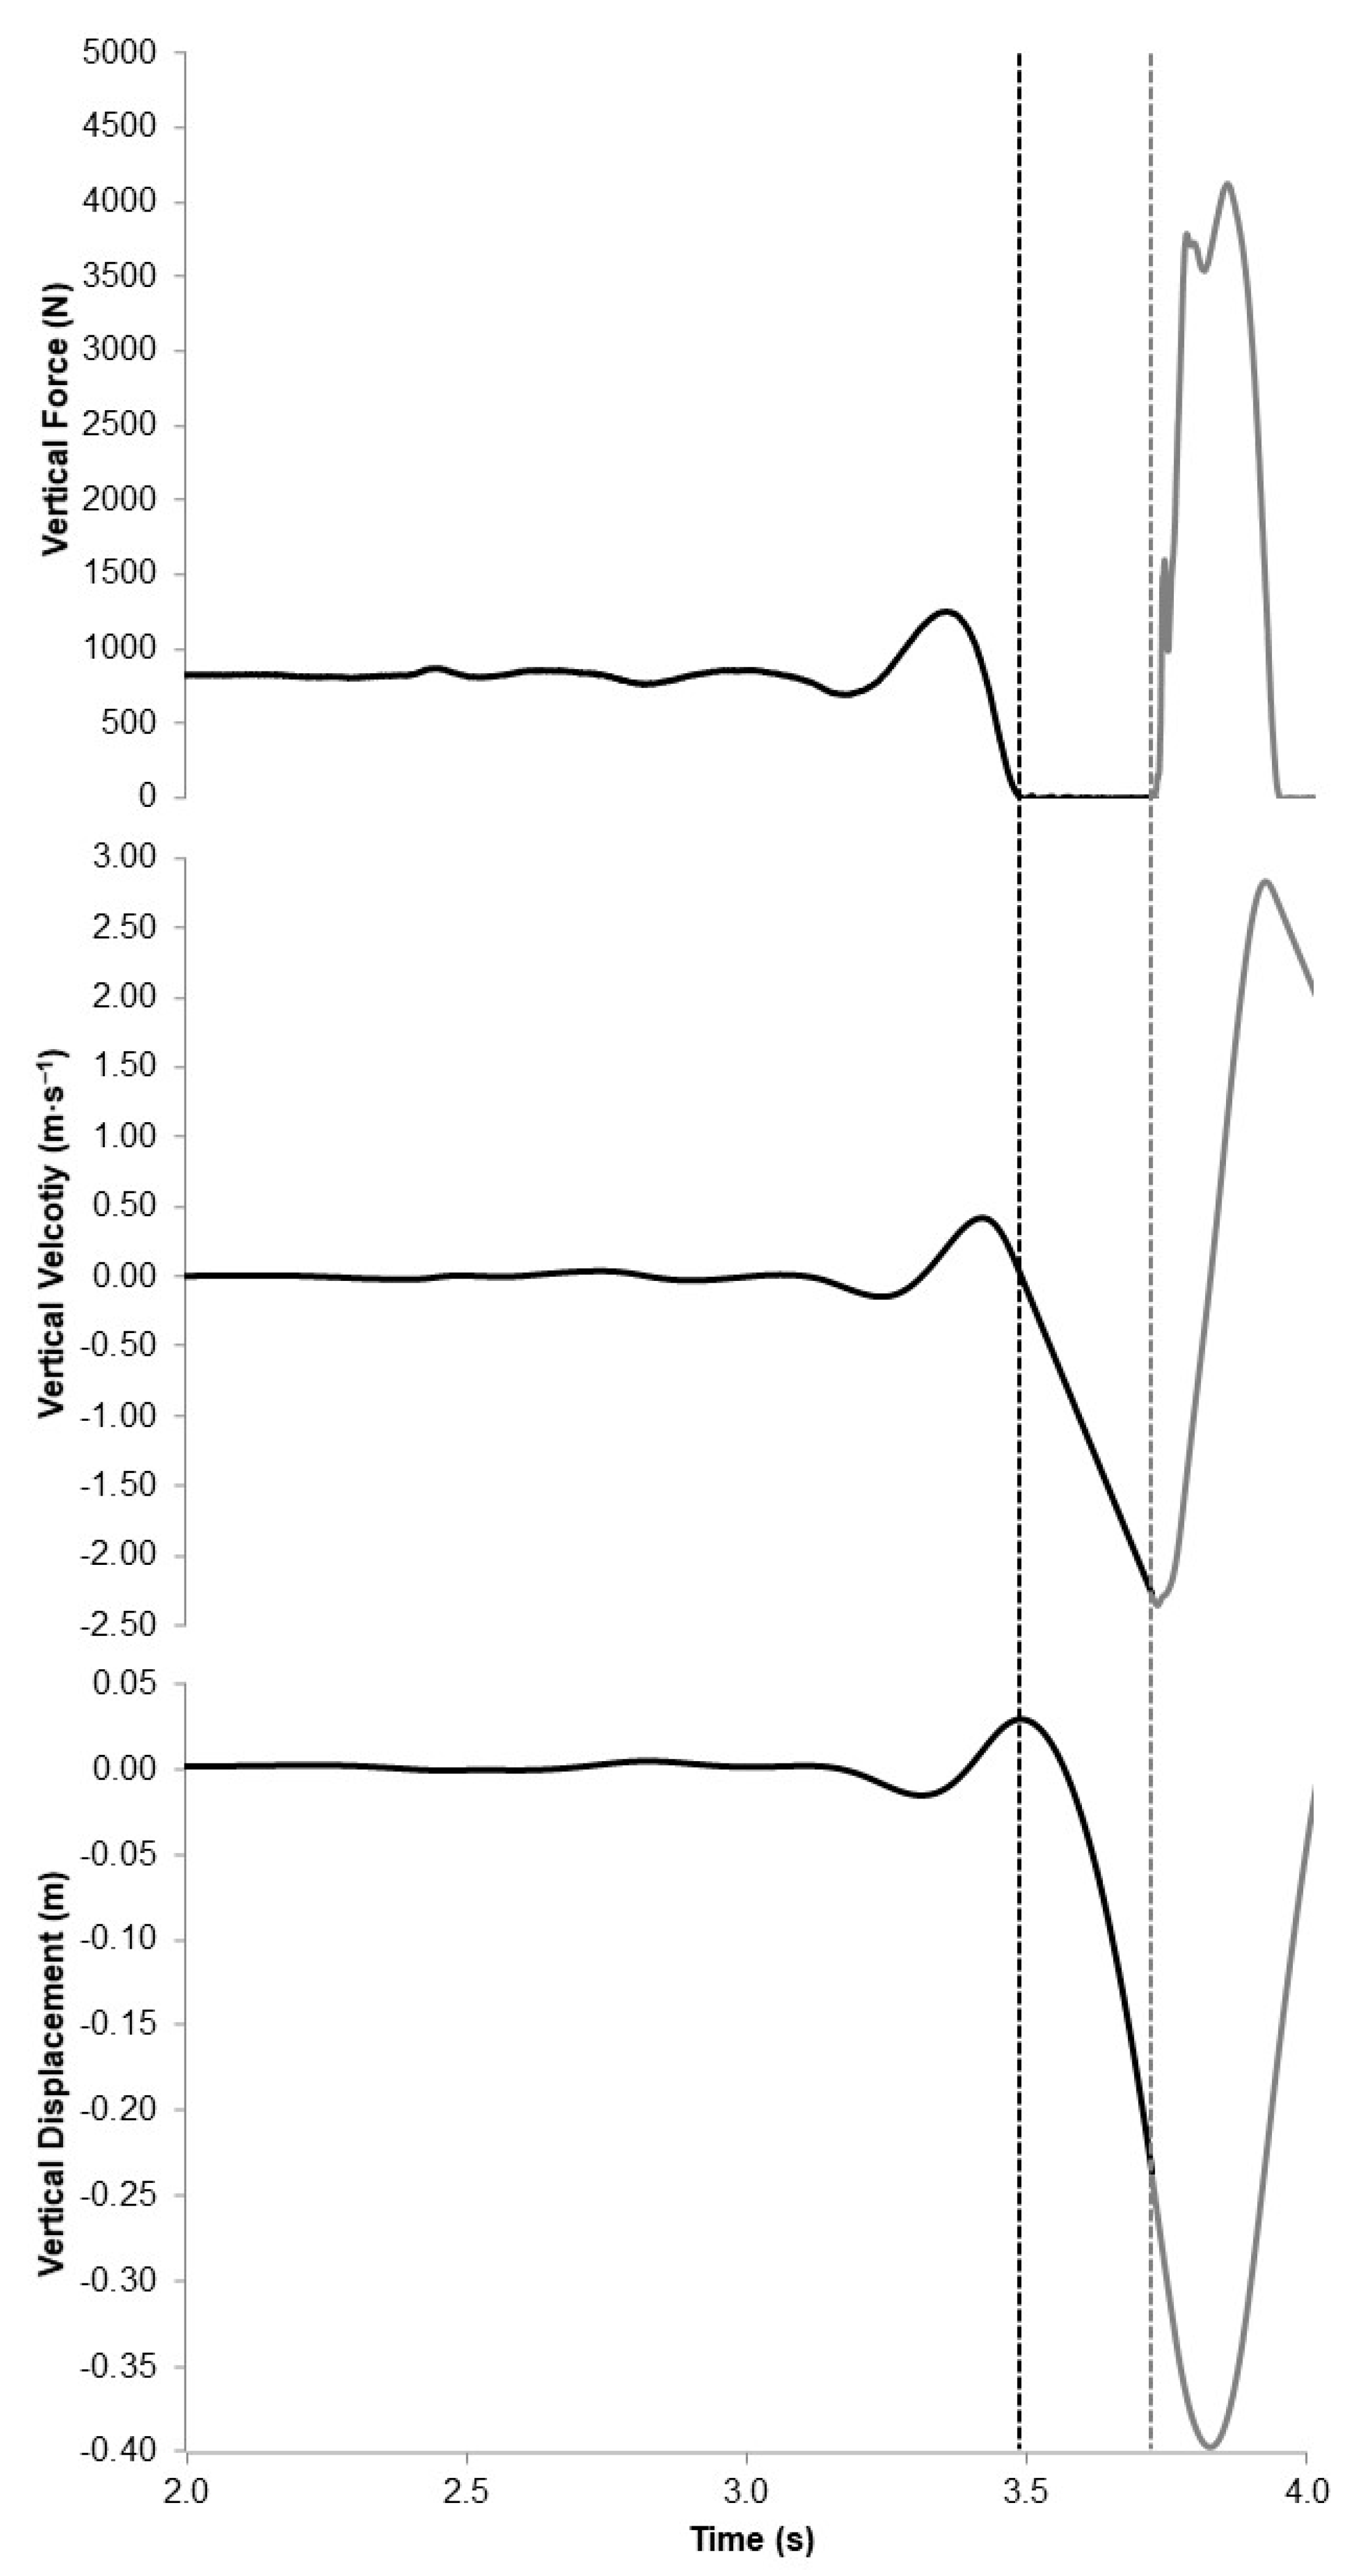
The 2FP (criterion) method involved calculating the participants’ body weight (BW) while they were stood on the box positioned on the first FP. This was done by calculating the mean force over the first one second of data recording (Figure 2). The standard deviation (SD) over this same period was calculated, multiplied by five and then both added to and subtracted from BW to create an upper and lower bound force threshold, respectively [17]. The first force value to cross either the upper or lower bound force value was identified and then a backward search to 0.03 s prior to this was completed to identify the onset of movement [17]. From the onset of movement on the first FP, COM velocity was determined on a sample-by-sample basis by dividing vertical force (minus BW) by body mass and then integrating the product using the trapezoid rule [18]. The COM displacement was then determined on a sample-by-sample basis by integrating the velocity–time record (trapezoid rule). It was then necessary to identify when the participant stepped off the box on the first FP. This was done by finding the first force value that fell below a force threshold equal to the mean plus five SDs of force recorded during the first 0.300 s of the flight phase (i.e., when the first FP was unloaded (<10 N) as the participants descended towards the second FP). The instant of touchdown on the second FP was identified by finding the first force value that surpassed a force threshold equal to the mean plus five SD of force recorded during the first 0.300 s of data recording (i.e., when the second FP was unloaded (<10 N) at the beginning of data collection). DH was calculated as the displacement between the instants of step-off from the box on the first FP and the instant of touchdown on the second FP (Figure 3). The associated touchdown velocity of the COM was also identified at this latter point (Figure 3) and then used as the first velocity value in the numerical integration procedures of force–time record obtained from the second FP (performed using the same methods used for the first FP data).
The 1FP (alternative) method began by calculating the participants’ BW using the same method described above but during the final one second of data collection (during post-landing standing still period, Figure 2). Touchdown velocity was then estimated from box height based on the conservation of mechanical energy principle as the square root of 2 × 9.81 × box height (in m) [7]. Numerical integration of the force–time record obtained from the second FP (the only one proposed to be used for this alternative method) was performed using the same methods as were employed for the first FP data to yield COM velocity and displacement, but included the BW value obtained from the second FP during the post-landing standing still period. If box height and DH were identical then the mean velocity during the final one second of data recording would equal approximately 0 m·s−1 because the participants were stood still during the post-landing standing still period. The mean velocity during the final one second of data collection was calculated and the discrepancy between the mean velocity and 0 m·s−1 was used to correct touchdown velocity (Figure 4).
For example, if the mean velocity during the final one second of data collection equalled −0.12 m·s−1 rather than 0 m·s−1 then this value was deducted from the touchdown velocity that was estimated using the conservation of mechanical energy principle. Numerical integration of the force–time record obtained from the second FP was then performed again using this updated touchdown velocity value to generate “corrected” COM velocity and displacement values throughout the entire data recording. DH was estimated from the updated touchdown velocity as: touchdown velocity squared divided by 19.62 (i.e., 2 × gravitational acceleration).
For both the 2FP and 1FP methods, braking phase time was calculated as the time between the instants of touchdown and the first instant of zero velocity (Figure 5). Propulsion phase time was calculated as the time between the first instant of zero velocity and take-off (Figure 5). The instant of take-off from the second FP was calculated using the same force threshold as the instant of touchdown. The corresponding take-off velocity was used to estimate jump height using the formula: take-off velocity squared divided by 19.62 [19,20]. Braking and propulsion phase displacement and mean force were also calculated.

2.3. Statistical Analysis

For each variable, the mean and SD of the three DJ trials recorded for each box height were taken forward for statistical analysis. All variables met parametric assumptions, apart from propulsion phase time from both box heights, following the Shapiro–Wilk test of normality. The concurrent validity of the 1FP method was established using Deming regression (Passing–Bablok regression for propulsion phase time) to provide estimates of fixed and proportional bias. Specifically, if the 95% confidence interval for the intercept did not include 0, then fixed bias was present. If the 95% confidence interval for the slope did not include 1.0, then proportional bias was present [21,22]. Statistical analyses were performed using SPSS software (version 25; SPSS Inc., Chicago, IL, USA) and Microsoft Excel, with the a priori alpha level set at p ≤ 0.05.

3. Results

The mean and SD for each variable calculated for the DJs performed from the 0.30 m and 0.40 m boxes using the criterion (2FP) and alternative (1FP) methods are presented in Table 1 and Table 2, respectively. Actual DH was on average ~0.03 m and ~0.055 m lower, respectively, than the 0.30 m and 0.40 m box that the participants started on (Table 1 and Table 2). The results of the ordinary least products regression analyses showed that no fixed or proportional bias was present for any variable reported for DJs performed from both box heights (Table 1 and Table 2). Therefore, the 1FP method of evaluating DJ performance can be considered a valid alternative to the criterion 2FP.

4. Discussion

The purpose of this study was to establish the validity of evaluating DJ performance with 1FP when using our proposed method to obtain accurate DJ performance data. Specifically, when compared to typical DJ testing, the presented 1FP method simply required participants to remain still during the final one second of data recording (to enable the determination of BW and associated COM velocity over this period) and incorporated force thresholds to determine the instants of touchdown and take-off that considered signal noise in a similar manner to the recommendations for FP assessment of the countermovement jump [23]. With box height (in m) as the initial input for determining touchdown velocity, any discrepancy between mean velocity during the final one second of data recording and 0 m·s−1 was used to correct touchdown velocity, which allowed the numerical integration of the net force–time record to be reperformed to generate “corrected” data. The results presented in Table 1 and Table 2 support the validity of the 1FP method (no fixed or proportional bias when compared to the 2FP method) when assessing DJs from 0.30 m and 0.40 m high boxes. Therefore, the 1FP method is a valid alternative to the criterion 2FP method for calculating DH, touchdown velocity and several typically reported performance variables, thus the hypothesis of the study was accepted. Due to the recent production of commercially available and open access automated force analysis software, and increased use of FPs in high performance sports settings, the presented 1FP method of assessing DJ performance could be easily integrated into researchers’ and practitioners’ analysis procedures.
Actual DH was on average ~0.03 m (10%) and ~0.055 m (14%) lower, respectively, than the 0.30 m and 0.40 m box that the participants started on (Table 1 and Table 2). The discrepancy between box and DH was expected based on the results of previous studies [4,5,7,9,10] which reinforces the rationale for this study of the proposed alternative 1FP method. The mean difference between the DH estimated by the 1FP and 2FP methods was just 2 mm (0.7%) for the 0.30 m DJ and 4 mm (0.9%) for the 0.40 m DJ trials, with no fixed or proportional bias present (Table 1 and Table 2). Therefore, the 1FP method can be confidently used to estimate DH, enabling researchers and practitioners to consider the true height that the participant dropped from when interpreting and monitoring their athletes’ DJ performances. Accounting for DH when routinely conducting DJ testing will highlight whether any changes in performance may reflect differences in the mechanical demands of the test and not solely changes in the athletes’ physical capabilities. More importantly than simply knowing and tracking what the DH during DJ testing was, is identifying the corresponding touchdown velocity to enable accurate numerical integration of the force–time curve to generate a plethora of performance variables. The mean difference between the touchdown velocity estimated by the 1FP and 2FP methods was just 0.4% for the 0.30 m DJ and 0.5% for the 0.40 m DJ trials. Therefore, considering that the 2FP has been previously shown to yield accurate touchdown velocity data [9], the 1FP method can also be confidently used to estimate touchdown velocity.
For the 1FP method to “work” with any degree of accuracy, it is essential that athletes remain still during the final one second of data recording to enable BW and the associated COM velocity to be calculated over this period. Baca [7] suggested that it may be difficult for participants to do this as it may influence their jumping technique. None of the participants in the present study were unable to remain still during the last second of data collection but a habituation process could be useful for some athletes prior to performing DJ testing in line with the proposed 1FP method. The requirement to remain still during the final second of data recording was also successful when professional rugby league players completed DJ testing from a 0.27 m high box [15]. Force data were collected for 7 s in the present study due to the requirement for synchronous data recording from 2FPs and for BW to be calculated over one second at both the start (2FP method) and end (one FP method) of the data recording. When using the 1FP method, data could be collected for 4–5 s to capture the rebound and landing (including at least one second of post-landing standing still) phases of the DJ [15]. The problem with recording and integrating force data over a longer duration is that there is increased likelihood of accumulating error which should be avoided where possible [7]. Although the 1FP method is valid for the variables reported in the present study following a 7-s data recording, this relatively long duration is probably not necessary if performing DJ testing with 1FP.
Aside from the 1FP method demonstrating criterion validity when predicting actual DH and touchdown velocity, there was also no fixed or proportional bias for any of the DJ performance variables reported (Table 1 and Table 2). The comparable jump heights between methods were estimated from take-off velocity which is positive as it eliminates the error associated with flight time-estimated jump height due to differences in take-off and landing posture [24]. This is why the accuracy of the 1FP method for determining DH [5,10] which involves predicting propulsion net impulse from flight-time estimated jump height and then subtracting this from the entire net impulse to predict braking net impulse (and then using braking net impulse to predict DH), can be questionable [7,8]. The comparable braking and propulsion phase times and associated mean force and displacement illustrates that the DJ force–time record can be accurately separated into these two phases when using the 1FP method to enable the evaluation of phase-specific calculations. Although only some DJ performance variables are reported in this study, they form the basis of most other calculations of interest (e.g., power (force × velocity), stiffness (force ÷ displacement), and reactive strength index (jump height ÷ contact time [i.e., braking phase time + propulsion phase time])) and so it is reasonable to expect that the 1FP method will be valid for a range of other DJ performance variables of interest. However, additional research will be needed to confirm this.
When introducing any “new” method it is important to acknowledge its limitations. Limitations of the present study include that only FP data were considered. However, Palazzi and Williams [9] reported that the criterion 2FP method for quantifying DJ performance showed accuracy and precision (via establishing absolute and standardised mean bias) when compared to a 14-camera three-dimensional motion analysis system. Nevertheless, errors with both FP methods could have been accumulated due to, among other factors, analogue-to-digital conversion and numerical integration for the force–time record [7]. Furthermore, DJs from only two box heights were included in the present study. Although DJs are commonly performed from 0.30 m and 0.40 m [2], previous research showed that discrepancies between box and DH are noted even from 0.20 m [4,5] and can continue up to at least 0.60 m [10]. Therefore, it may be prudent for future work to include the application of the alternative 1FP method outlined here to DJ testing performed across a broader range of box heights. Furthermore, there is the possibility that commonly used portable FPs may contain a higher baseline signal noise than in-ground FPs, therefore, another future research avenue could be to explore the validity of the 1FP method when using a portable vs. an in-ground FP system. Finally, the present study only included young male participants who were injury free, had prior experience of performing DJs and performed a dynamic warm-up prior to testing. Therefore, the results of this study, with respect to the descriptive statistics, cannot be transferred to females, physically less active and older participants, and may be influenced by the type of warm-up completed. However, the participant selection and warm-up should not affect the interpretation of the concurrent validity element of the study.

5. Conclusions

The presented 1FP method of evaluating DJ performance is a valid alternative to the criterion 2FP method. It should be reasonably straightforward for the robust and clearly described 1FP method to be embedded into commercially available and open access automated force analysis software. Given the increased use of FPs in high performance sports settings, the 1FP method of assessing DJ performance will enable researchers and practitioners to account for discrepancies between box and DH and gain access to a plethora of accurately calculated performance variables. This should help to enrich the DJ testing process by facilitating a consistent approach which should lead to higher quality and more accurate interpretation of DJ force–time data, from which better training decisions can be made.

Author Contributions

Conceptualization, J.J.M.; methodology, J.J.M., C.S. and J.P.L.; software, J.J.M.; formal analysis, J.J.M., C.S. and J.P.L.; writing—original draft preparation, J.J.M. and P.C.; writing—review and editing, P.C. and J.P.L.; visualization, J.J.M. All authors have read and agreed to the published version of the manuscript.

Funding

This research received no external funding.

Institutional Review Board Statement

The study was conducted according to the guidelines of the Declaration of Helsinki, and approved by the Institutional Ethics Committee of University of Salford (protocol code: HST1718-357 and date of approval: 18 July 2018).

Informed Consent Statement

Informed consent was obtained from all subjects involved in the study.

Data Availability Statement

The data presented in this study are available on request from the corresponding author. The data are not publicly available due to this not being included in the Institutional Ethics Committee approval.

Conflicts of Interest

The authors declare no conflict of interest.

References

  1. Pedley, J.S.; Lloyd, R.S.; Read, P.; Moore, I.S.; Oliver, J.L. Drop jump: A technical model for scientific application. Strength Cond. J. 2017, 39, 36–44. [Google Scholar]
  2. Byrne, P.J.; Moran, K.; Rankin, P.; Kinsella, S. A comparison of methods used to identify â€~optimal’drop height for early phase adaptations in depth jump training. J. Strength Cond. Res. 2010, 24, 2050–2055. [Google Scholar]
  3. Schmidtbleicher, D. Training for power events. In The Encyclopedia of Sports Medicine; Komi, P.V., Ed.; Blackwell Science: Oxford, UK, 1992; pp. 381–395. [Google Scholar]
  4. Geraldo, G.F.; Bredt, S.T.; Menzel, H.J.; Peixoto, G.H.; Carvalho, L.A.; Lima, F.V.; Soares, J.S.; Andrade, A.G. Drop height is influenced by box height but not by individual stature during drop jumps. J. Phys. Educ. 2019, 30, e-3078. [Google Scholar]
  5. Costley, L.; Wallace, E.; Johnston, M.; Kennedy, R. Reliability of bounce drop jump parameters within elite male rugby players. J. Sports Med. Phys. Fit. 2018, 58, 1390–1397. [Google Scholar]
  6. Suchomel, T.J.; McMahon, J.J.; Lake, J.P. Combined assessment methods. In Performance Assessment in Strength and Conditioning; Comfort, P., Jones, P.A., McMahon, J.J., Eds.; Routledge: London, UK, 2019. [Google Scholar]
  7. Baca, A. A comparison of methods for analyzing drop jump performance. Med. Sci. Sports Exerc. 1999, 31, 437–442. [Google Scholar]
  8. Kibele, A. Technical Note: Possible errors in the comparative evaluation of drop jumps from different heights. Ergonomics 1999, 42, 1011–1014. [Google Scholar]
  9. Palazzi, D.; Williams, B. Accuracy and precision of the kinetic analysis of drop jump performance. In Proceedings of the 30 International Conference on Biomechanics in Sports (2012), Melbourne, Australia, 2–6 July 2012. [Google Scholar]
  10. Bobbert, M.F.; Huijing, P.A.; van Ingen Schenau, G.J. Drop jumping. II. The influence of dropping height on the biomechanics of drop jumping. Med. Sci. Sports Exerc. 1987, 19, 339–346. [Google Scholar]
  11. Lake, J.P.; Augustus, S.; Austin, K.; Mundy, P.; McMahon, J.J.; Comfort, P.; Haff, G.G. The Validity of the Push Band 2. 0 during Vertical Jump Performance. Sports 2018, 6, 140. [Google Scholar]
  12. Lake, J.; Mundy, P.; Comfort, P.; McMahon, J.J.; Suchomel, T.J.; Carden, P. Concurrent Validity of a Portable Force Plate Using Vertical Jump Force-Time Characteristics. J. Appl. Biomech. 2018, 34, 410–413. [Google Scholar]
  13. Stratford, C.; Dos’ Santos, T.; McMahon, J.J. The 10/5 Repeated Jumps Test: Are 10 repetitions and three trials necessary? Biomechanics 2021, 1, 1–14. [Google Scholar]
  14. Stratford, C.; Dos’Santos, T.; McMahon, J.J. Comparing drop jumps with 10/5 repeated jumps to measure reactive strength index. Prof. Strength Cond. 2020, 57, 23–28. [Google Scholar]
  15. McMahon, J.J.; Suchomel, T.J.; Lake, J.P.; Comfort, P. Relationship between reactive strength index variants in rugby league players. J. Strength Cond. Res. 2021, 35, 280–285. [Google Scholar]
  16. Laffaye, G.; Bardy, B.; Taiar, R. Upper-limb motion and drop jump: Effect of expertise. J. Sports Med. Phys. Fit. 2006, 46, 238. [Google Scholar]
  17. Owen, N.J.; Watkins, J.; Kilduff, L.P.; Bevan, H.R.; Bennett, M.A. Development of a Criterion Method to Determine Peak Mechanical Power Output in a Countermovement Jump. J. Strength Cond. Res. 2014, 28, 1552–1558. [Google Scholar]
  18. Moir, G.L. Three Different Methods of Calculating Vertical Jump Height from Force Platform Data in Men and Women. Meas. Phys. Educ. Exerc. Sci. 2008, 12, 207–218. [Google Scholar]
  19. Dowling, J.J.; Vamos, L. Identification of Kinetic and Temporal Factors Related to Vertical Jump Performance. J. Appl. Biomech. 1993, 9, 95–110. [Google Scholar]
  20. Linthorne, N.P. Analysis of standing vertical jumps using a force platform. Am. J. Phys. 2001, 69, 1198–1204. [Google Scholar]
  21. Mullineaux, D.R.; Barnes, C.A.; Batterham, A.M. Assessment of bias in comparing measurements: A reliability example. Meas. Phys. Educ. Exerc. Sci. 1999, 3, 195–205. [Google Scholar]
  22. Ludbrook, J. A primer for biomedical scientists on how to execute model II linear regression analysis. Clin. Exp. Pharmacol. Physiol. 2012, 39, 329–335. [Google Scholar]
  23. McMahon, J.J.; Lake, J.P.; Suchomel, T.J. Vertical jump testing. In Performance Assessment in Strength and Conditioning; Comfort, P., Jones, P.A., McMahon, J.J., Eds.; Routledge: London, UK, 2018; pp. 96–116. [Google Scholar]
  24. Yamashita, D.; Murata, M.Y.I. Effect of Landing Posture on Jump Height Calculated from Flight Time. Appl. Sci. 2020, 10, 776. [Google Scholar]
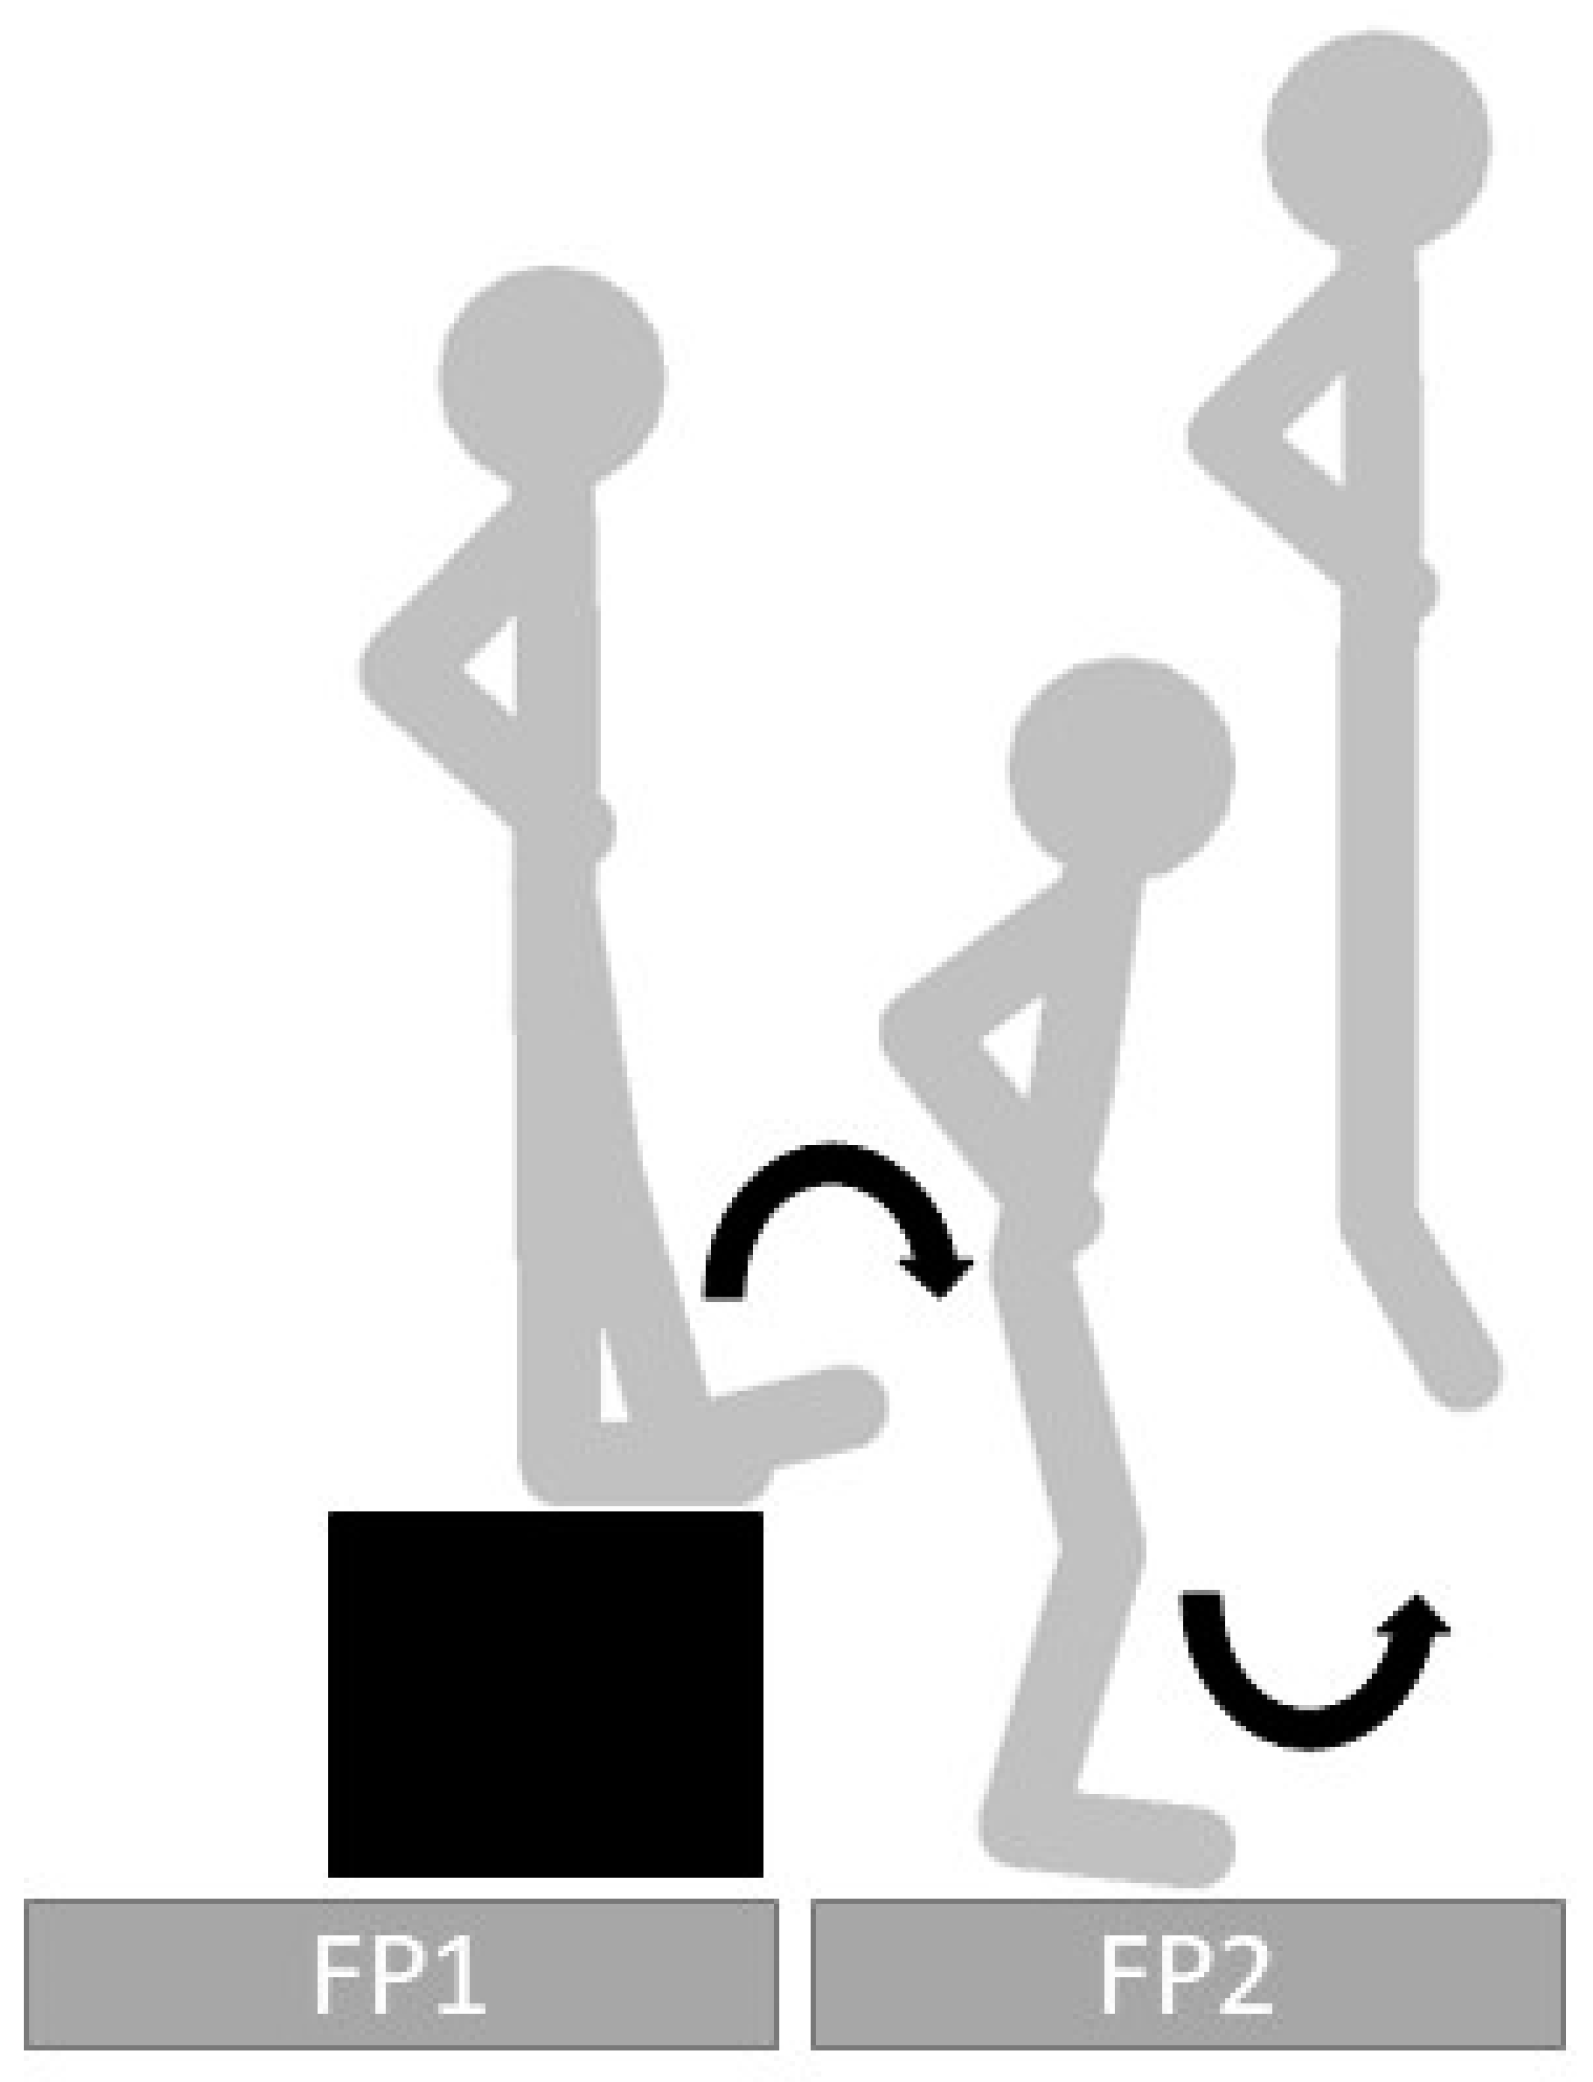
Figure 1. An illustration of the experimental setup. The participants stepped off the box (black square) placed on top of force platform one (FP1), contacted force platform two (FP2) and then immediately performed a maximal vertical jump. Please note that the right-hand stick figure (denoting the flight phase) has been shifted to the right to avoid obscuring the middle stick figure (denoting the contact phase).
Biomechanics 01 00015 g001
Figure 2. An example force record obtained from the first (black line) and second (grey line) force platforms. The black dotted line denotes the end of the initial one second weighing period on the first force platform and the grey dotted line denotes the beginning of weighing period during the final one second on the second force platform.
Biomechanics 01 00015 g002
Figure 3. An example force (top), velocity (middle), and displacement (bottom) record obtained from the first (black line) and second (grey line) force platforms. The black dashed line denotes the instant of step-off from the first force platform and the grey dashed line denotes the instant of touchdown on the second force platform. The displacement between the instants of step-off and touchdown was calculated to represent the actual drop height.
Biomechanics 01 00015 g003
Figure 4. An example force (top) and velocity (bottom) record obtained from the second force platform. The grey dashed line denotes the instant of touchdown and the dotted dashed line denotes the beginning of the weighing period during the final one second of data recording. Please note that mean velocity during the final one second is −0.12 m·s−1 rather than 0 m·s−1 when touchdown velocity was estimated from the 0.30 m box height from which they dropped (i.e., −2.43 m·s−1).
Biomechanics 01 00015 g004
Figure 5. An example force (top) and velocity (bottom) record obtained from the second force platform. The grey dashed line denotes the instant of zero velocity which was used to differentiate between the braking and propulsion phases of the rebound phase of the drop jump.
Biomechanics 01 00015 g005
Table 1. Results of the comparison between 0.30 m drop jump force–time characteristics obtained from the criterion and alternative method.
Criterion
(Mean ± SD)
Alternative
(Mean ± SD)
Mean
Difference
Slope
95% CI
Intercept
95% CI
Actual Drop Height (m)0.27 ± 0.030.27 ± 0.030.002−0.028
−0.069 to 0.013
1.112
0.960 to 1.264
Touchdown Velocity (m·s−1)2.30 ± 0.132.29 ± 0.120.010−0.263
−0.638 to 0.112
1.119
0.956 to 1.282
Jump Height (m)0.28 ± 0.060.28 ± 0.06−0.001−0.004
−0.025 to 0.018
1.009
0.931 to 1.087
Braking Phase Time (s)0.098 ± 0.0140.098 ± 0.0140.000−0.001
−0.006 to 0.004
1.015
0.958 to 1.072
Propulsion Phase Time (s)0.134 ± 0.0200.134 ± 0.0200.0000.001
−0.005 to 0.005
0.989
0.958 to 1.033
Braking Displacement (m)−0.13 ± 0.02−0.13 ± 0.02−0.0010.01
−0.008 to 0.027
1.082
0.945 to 1.219
Propulsion Displacement (m)0.23 ± 0.040.23 ± 0.04−0.001−0.001
−0.020 to 0.019
0.997
0.907 to 1.088
Mean Braking Force (N)2763.39 ± 391.782761.56 ± 393.591.83114.576
−6.610 to 35.762
0.995
0.988 to 1.003
Mean Propulsion Force (N)2223.28 ± 299.842225.55 ± 297.18−2.27123.991
−7.450 to 55.219
0.991
0.977 to 1.006
Table 2. Results of the comparison between 0.40 m drop jump force–time characteristics obtained from the criterion and alternative method.
Criterion
(Mean ± SD)
Alternative
(Mean ± SD)
Mean
Difference
Slope
95% CI
Intercept
95% CI
Actual Drop Height (m)0.35 ± 0.030.34 ± 0.030.004−0.035
−0.084 to 0.014
1.114
0.975 to 1.252
Touchdown Velocity (m·s−1)2.60 ± 0.132.59 ± 0.120.013−0.273
−0.667 to 0.120
1.110
0.961 to 1.260
Jump Height (m)0.28 ± 0.070.28 ± 0.07−0.0030.002
−0.009 to 0.012
0.982
0.943 to 1.022
Braking Phase Time (s)0.101 ± 0.0180.101 ± 0.0170.0000.000
−0.003 to 0.003
1.005
0.976 to 1.034
Propulsion Phase Time (s)0.134 ± 0.0220.135 ± 0.0220.000−0.001
−0.004 to 0.002
1.000
0.978 to 1.024
Braking Displacement (m)−0.15 ± 0.02−0.15 ± 0.02−0.001−0.001
−0.004 to 0.002
1.056
0.819 to 1.294
Propulsion Displacement (m)0.23 ± 0.040.23 ± 0.04−0.0020.002
−0.009 to 0.013
0.982
0.935 to 1.030
Mean Braking Force (N)2962.35 ± 389.962959.99 ± 391.122.35811.165
−9.216 to 31.546
0.997
0.990 to 1.004
Mean Propulsion Force (N)2208.32 ± 292.642212.73 ± 292.43−4.402−6.063
−32.025 to 19.899
1.001
0.988 to 1.013
Publisher’s Note: MDPI stays neutral with regard to jurisdictional claims in published maps and institutional affiliations.