3.1. Characterization
As shown in
Figure 1, the XRD patterns for 1 wt% Pt-GTiO
2, 1 wt% Pt-UV100, and 1 wt% Pt-P25 nanoparticles were recorded to identify the crystallographic structure and the phase composition. The recorded spectrum reveals that the diffraction patterns as well as the peak positions of 1 wt% Pt-GTiO
2 and 1 wt% Pt-UV100 nanoparticles are almost identical. Both materials exhibit distinct characteristic peaks attributed to the tetragonal crystal structure of the anatase phase (JCPDS card No. 21-1272) [
15]. The XRD spectrum of 1 wt% Pt-GTiO
2 does not show any signal for phase impurity, confirming the purity of the anatase phase. While the recorded diffraction patterns for 1 wt% Pt-P25 material exhibit the existence of a mixture of anatase and rutile phases, which is consistent with the data of JCPDS card Nos. 21-1272 and 21-1276, respectively. Our results for the synthesized GTiO
2 NPs were in agreement with the results of several research groups that reported the formation of pure anatase phase after the green synthesis of TiO
2 NPs using different plant extracts, Ti precursors, and calcination temperatures [
35,
36].
Moreover, we observed that loading of the surface of all TiO
2 materials with Pt NPs does not result in any impact or change on the XRD pattern position or features, indicating that the photodeposition method for preparing the platinized materials did not significantly alter the crystallinity or the formed TiO
2 phase [
15]. In addition, no diffraction peaks for the Pt NPs were observed in the recorded XRD diffraction for all TiO
2 materials (
Figure 1), which can be attributed to the low loading amount of Pt and the uniform distribution of these Pt NPs on the surface of the prepared materials [
15,
34]. The sharper and thinner 101 plane peak at 25.0° observed for Pt-GTiO
2, compared to Pt-UV100, indicates a higher crystalline structure and larger crystallite size of Pt-GTiO
2 nanoparticles [
36]. These observations are confirmed by estimating the crystallite size of these materials based on the Scherrer equation [
15]. The calculated average crystallite sizes of 1 wt% Pt-GTiO
2, 1 wt% Pt-UV100, and 1 wt% Pt-P25 were found to be 12.4, 7.5, and 25.0 nm, respectively (
Table 1). Several research groups reported a similar crystallite size for the plant-extract-assisted TiO
2 using TTIP as precursor [
35,
36].
In order to verify the presence of Pt NPs on the synthesized materials and determine their actual loading percentage, ICP-OES analysis was performed. The results presented in
Table 1 indicate that the actual loading percentage of Pt NPs is lower than the expected value in all samples analyzed. However, the reduction values fall in the accepted range of experimental error [
19].
In a complementary manner, the textural characteristics of the photocatalyst, particularly the specific surface area, directly influence the density of active sites, adsorption capacity for reactants and, finally, the photocatalytic efficiency [
4]. The BET surface area analysis of the synthesized and commercial Pt-TiO
2 materials reveals significant differences in their values, as summarized in
Table 1. The 1 wt% Pt-UV100 sample exhibited the highest surface area of 290 ± 5.3 m
2 g
−1, which is consistent with the known properties of Hombikat UV100, a benchmark anatase TiO
2 specifically engineered for a very high surface area [
6,
15]. In contrast, the 1 wt% Pt-P25 exhibits a considerably lower surface area of 51 ± 2.8 m
2 g
−1. In fact, this value is one of P25’s well-reported characteristics, which has a low surface area to maintain higher crystallinity, leading to better charge carrier separation compared to the UV100 [
15,
37].
The plant-extract-assisted 1 wt% Pt-GTiO
2 shows an intermediate BET surface area between Pt-P25 and Pt-UV100, with a value of 137 ± 3.9 m
2 g
−1. This value is notably higher than that of Pt-P25 and lower than Pt-UV100, suggesting that the biogenic synthesis method successfully produced a TiO
2 material with favorable properties, potentially balancing between a high density of surface active sites (compared to its surface area with that for P25) and sufficient crystallinity with special surface chemistry to reduce the rapid recombination of photogenerated electron–hole pairs [
38]. In addition, it has been observed that the surface area of plant-extract-assisted TiO
2 nanoparticles is proportionally affected by the concentration of the plant extract [
38]. In our study, we adapted the synthesis method developed by Aravind et al. [
33] to prepare the GTiO
2 nanoparticles, resulting in the production of a material with smaller particle sizes than those reported by the Aravind research group. This variation may be attributed to the higher concentration of pomegranate peel extract utilized in our research compared to that in the study by Aravind et al. Indeed, the crystallite size calculated using the Scherrer equation coincides with this textural analysis. The smaller crystallite size of Pt-GTiO
2 (12.4 nm) is directly linked to their surface areas, as reducing particle size increases the surface-to-volume ratio. From the BET specific surface area, it is possible to estimate the mean particle size of the GTiO
2 by assuming spherical and non-porous TiO
2 nanoparticles, employing Equation (1) [
39] based on the theory of Brunauer, Emmett, and Teller. The mean particle size (
dBET) was found to be 11.26, which is close to the value estimated from the XRD result based on the Scherrer equation.
where
is the measured BET surface area and
is the apparent density of anatase TiO
2.The optical absorption properties for all the platinized TiO2 materials were characterized using DRS. The reflectance data were transformed via the Kubelka–Munk function, F(R∞), to determine absorption characteristics, and Tauc plots were constructed after baseline correction, assuming indirect transitions to estimate the bandgap energy of each material.
As shown in
Figure 2, the estimated band gap for Pt-GTiO
2 and Pt-UV100 are 3.14 and 3.2 eV, respectively. Since both materials consist of the anatase phase, which is characterized by 3.2 eV, the lower band gap of Pt-GTiO
2 indicated a small redshift in its absorption edge compared to Pt-UV100. This bandgap reduction suggests that the plant-extract-assisted synthesis method in the case of Pt-GTiO
2 could introduce electronic structural modifications, such as defect-rich states and/or residual heteroatom-related states associated with the plant-derived synthesis environment, thereby altering crystallinity. This modification may arise from organic residues during plant-extract-assisted synthesis using
Punica granatum peel extract, leading to differences in the optical properties [
27,
40]. Saini et al. [
26] reported the formation of defect states such as oxygen vacancies in the plant-extract-assisted synthesized TiO
2 nanoparticles, which originated from the organic residues in the
Tinospora cordifolia plant stem extract. Recently, Mohammadi et al. [
27] synthesized ZnO nanoparticles using the
Punica granatum fruit peel extract and observed a similar redshift in the plant-extract-assisted synthesized ZnO NPs sample compared to the chemically prepared one.
On the other hand, the Pt-P25, which consists of a mixed phase of anatase and rutile, exhibits a bandgap of 3.00 eV, which is lower than the value estimated for Pt-GTiO
2. This lower bandgap value for Pt-P25 can be attributed to the difference in phase composition between the materials. TiO
2-P25 consists of a mixed phase of anatase and rutile, and its bandgap is regularly reported to be 3.00 eV [
15].
HR-TEM was employed to study the morphology of the synthesized platinized photocatalysts. The micrographs presented in
Figure 3a–f clearly indicate the structural distinctions between Pt-GTiO
2 (
Figure 3a,b), Pt-UV100 (
Figure 3c,d), and Pt-P25 (
Figure 3e,f). All TiO
2 nanocrystals are spherical with a clear difference in grain boundaries, indicating a difference in size and degree of crystallinity during the synthesis processes.
As clearly seen in
Figure 3c, the Pt-UV100 sample exhibits high agglomeration and small particles, indicating a relatively larger surface area compared to the Pt-GTiO
2 nanoparticles in
Figure 3a. The particles of Pt-GTiO
2 appear less agglomerated, more uniform, and have intermediate sizes, compared to both commercial TiO
2 materials. Based on the ImageJ software (version 1.52p) for analyzing micrographs in
Figure 3a,c,e, the average crystallite sizes of Pt-UV100, Pt-GTiO
2, and Pt-P25, respectively, are 8.9 ± 1.6, 13.5 ± 2.0, and 21 ± 1.5 nm. These values are in agreement with those that were obtained from the XRD results based on the Scherrer equation. The small crystallite size of the GTiO
2 NPs can be attributed to the advantages of the biowaste-assisted synthesis method in material preparation. Several research groups have reported similar or comparable crystallite sizes for plant-extract-assisted TiO
2 NPs obtained using various plant extracts [
26,
41].
Furthermore, analysis of the micrographs shown in
Figure 3 indicated the uniform distribution of Pt NPs on the surfaces of all the synthesized Pt-TiO
2 materials, with an average particle size of 2–4 nm. This suggests the success of the modified photodeposition method for achieving small and well-dispersed Pt NPs. We reported previously a similar particle size with uniform distribution for the Pt NPs on the surface of TiO
2, using a different photodeposition method [
34].
The FFT analysis of specific regions in
Figure 3b,d,f, obtained using the ImageJ program, revealed a well-defined d-spacing of 0.35 nm in both Pt-GTiO
2 (
Figure 3b) and Pt-UV100 (
Figure 3d). This value corresponds to the (101) plane of anatase, thus confirming the phase purity and its retention after the platinization process [
15,
34]. While similar analysis in
Figure 3f of the Pt-P25 sample showed the appearance of diffraction fringes with a d-spacing of 0.32 nm associated with (110) planes of the rutile phase. This phase was observed alongside (101) planes of the anatase phase, confirming the biphasic nature of P25.
As shown in
Figure 4, the pre-calcination ATR-FTIR spectrum reveals several transmittance bands indicative of organic functional groups derived from the plant extract, as well as TiO
2-related vibrations. The broad transmittance band between 3200 and 3600 cm
−1, associated with O–H stretching, indicates the presence of hydroxyl groups that could be related to the presence of alcohols, phenols, carboxylic acids, or adsorbed water molecules on the surface of freshly prepared GTiO
2. Indeed, Altarawneh et al. [
42] reported the presence of such organic compounds in
Punica granatum peel extracts that contain flavonoids, phenolic compounds, and other capping agents [
27,
42].
In addition, the band observed around 2850–3000 cm
−1 in the pre-calcinated GTiO
2 sample could be related to aliphatic C–H stretching, indicating the presence of organic residues like alkanes or alkyl groups in the plant extract, and O–H stretching from a carboxylic acid. The observed transmittance band at 2350 cm
−1 could be assigned to the adsorbed CO
2 on the surface of the pre-calcinated GTiO
2. Furthermore, on the surface of the pre-calcinated sample, the bands observed around 1240 and 1650 cm
−1 are related to the C–O stretching vibration of phenols and esters, and the C–H bending of aromatic compounds, respectively [
23,
25,
43]. All of these bands were significantly quenched or disappeared after the calcination of GTiO
2 (
Figure 4), indicating the removal of the organic functional groups from the plant extract used in the synthesis. Calcination at a temperature higher than 400 °C combusts organic capping agents, such as organic acids and polyphenols, that are present from the plant extract [
35,
44]. This aligns with several previous studies that reported the calcination process removes biogenic residues, enhancing TiO
2’s crystallinity, and improving photocatalytic properties [
26]. Meanwhile, the observed broad peak below 1000 cm
−1 in both materials before and after calcination can be related to Ti–O–Ti stretching vibrations in anatase [
44,
45].
Raman spectroscopy analysis was employed to identify the purity and crystallinity of the plant-extract-assisted Pt-GTiO
2 NPs phase. As shown in
Figure 5, the studied sample displays six active modes centered around 144, 197, 399, 513, 519, and 639 cm
−1. According to the literature, these vibrational bands are consistent with the anatase phase of TiO
2, which aligns perfectly with our results from the XRD analysis and HRTEM micrographs analysis. Anatase TiO
2 crystallizes in a tetragonal structure with the space group
I41/amd and exhibits
D2d point group symmetry. According to group theory, the anatase phase possesses six Raman-active modes, designated as A
1g + 2B
1g + 3Eg [
41]. The strong peak at 145 cm
−1 corresponds to the Eg symmetric stretching mode of O–Ti–O bonds, while the features at 198 cm
−1 and 397 cm
−1 are also attributed to Eg and B
1g modes, respectively. The doublet observed at 513 and 519 cm
−1 can be assigned to overlapping A
1g and B
1g modes, while the broad peak near 639 cm
−1 corresponds to the Eg mode. The obtained bands correlate well with the values in the literature for the anatase phase of TiO
2 that was greenly synthesized using gum Arabic and beta vulgaris extract [
41,
46].
PL emission spectroscopy was employed to study the dynamics and recombination process of photogenerated charge carriers. As shown in
Figure 6, a sharp feature near 335 nm appears in the bare UV100, bare GTiO
2, and Pt-loaded GTiO
2 spectra. This band can be related to residual scattering of excitation light due to its closeness to the 290 nm excitation wavelength. Moreover, another broad emission bands across the UV-visible region centered around 390 nm, as well as minor peaks near 450, 465, and ~520 nm were recorded for the three studied materials. These emissions were previously reported to various radiative recombination pathways, including intrinsic band-to-band transitions and defect-related states [
45,
47]. Since the bandgap of anatase TiO
2 was documented between 387 and 390 nm, the observed strong band around 390 nm can be related to the direct recombination of the photogenerated electron/hole after excitation [
4]. However, the observed emission bands in the visible region reflect the contributions from shallow and deep-level defect states that could be oxygen vacancies and surface hydroxyl groups [
45].
Furthermore, as observed in
Figure 6, the bare GTiO
2 sample exhibits a lower emission intensity compared to the bare UV100 at 390 nm wavelength. This decrease reflects the lower recombination process of the photogenerated charge carrier in the case of bare GTiO
2, which can be related to the benefits of the plant-extract-assisted method in forming a material with better crystallinity and fewer radiative recombination centers. This enhancement in charge-carrier separation will lead to improved photocatalytic efficiency. Sangeetha et al. [
45] observed similar PL characteristics in extract-assisted TiO
2 nanoparticles and noted that both chemical and biological synthesis routes yielded comparable optical behaviors.
Moreover, the presence of the Pt NPs on the surface of GTiO
2 exhibits a significant reduction in the PL signal compared to the bare GTiO
2 material. This quenching can be related to better separation of the charge carrier in the presence of the Pt NPs on the surface of the GTiO
2 material, which serve as a sink for the photogenerated electrons, thus reducing the recombination of electron–hole pairs. This observation highlighted the main role of the Pt NPs in the charge carrier separation. It has been reported that the formation of the Schottky barrier between Pt NPs and GTiO
2 enhances the charge carrier separation and thus improves the photocatalytic efficiency of Pt-GTiO
2 [
15].
3.2. Comparison Between Different Catalysts
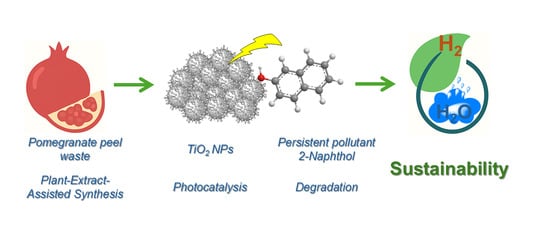
The photocatalytic performance of the plant-extract-synthesized GTiO2 was evaluated based on 2-naphthol photodegradation with simultaneous molecular H2 evolution under anaerobic conditions using simulated solar light. To evaluate the photocatalytic performance of the synthesized GTiO2 NPs before and after loading with Pt NPs, it was compared against commercial TiO2 benchmarks, Aeroxide P25 and Hombikat UV100. This comparison was designed as a control set to clarify the role of each component. Bare GTiO2 represents the pomegranate-peel-assisted TiO2 support without Pt. Bare P25 and bare UV100 represent commercial TiO2 supports without plant extract and without Pt. Pt-P25 and Pt-UV100 represent Pt-loaded TiO2 controls without the pomegranate extract, while Pt-GTiO2 contains both the plant-extract-assisted TiO2 support and Pt cocatalyst. Therefore, the comparison between bare GTiO2 and Pt-GTiO2 reflects the effect of Pt loading on the green-synthesized material, whereas the comparison between Pt-GTiO2 and Pt-P25/Pt-UV100 shows the effect of the TiO2 support under the same Pt-loading approach.
In the dark, it was observed that there was no activity for molecular hydrogen formation in the absence or presence of 2-naphthol over all types of pristine TiO
2 materials. The dark adsorption experiment showed that the 2-naphthol concentration reached a near-stable and unchanged concentration after 50 min of contact with Pt-GTiO
2 in suspension, as shown in
Figure S1. After 60 min in the dark, the adsorption removal of 2-naphthol on the surface of the Pt-GTiO
2 was around 13%. Therefore, the 60 min dark period was sufficient to approach adsorption equilibrium under the present experimental conditions. Similar behaviors and values were observed for the adsorption of 2-naphthol on the surface of TiO
2 [
48] and ZnO nanoparticles [
14]. Additionally, to distinguish the contribution of photolysis to the removal of 2-naphthol from that of photocatalytic degradation, a control experiment was performed. Therefore, dark adsorption, photolysis, and photocatalysis were compared directly. As shown in
Figure S2, the removal of 2-naphthol under illumination in the absence of the Pt-TiO
2 photocatalyst is about 15% after 240 min of irradiation. This value was found to be comparable to the adsorption value of 2-naphthol on the surface of the same catalyst in the dark. In contrast, the Pt-GTiO
2 photocatalytic system exhibited ~80% removal under the same irradiation time. These results confirm that the observed conversion is mainly photocatalytic and not caused by adsorption or direct photolysis alone.
As presented in
Figure 7, during the irradiation of the pristine and platinized TiO
2 materials studied, the H
2 evolution was not observed in the absence of 2-naphthol. This phenomenon was well documented previously, and it was attributed to the fast recombination of the charge carriers in the absence of a suitable hole scavenger, such as 2-naphthol, and the overpotential of molecular hydrogen formation on the surfaces of all types of studied TiO
2 photocatalysts [
15,
49]. Different types of pristine TiO
2 have been reported to be ineffective photocatalysts for molecular H
2 production. Hence, even in the presence of the organic pollutant, naphthalene, in the system as an electron donor, Al-Madanat et al. showed that bare Aeroxide P25 and Hombikat UV100 did not exhibit any efficiency for photocatalytic molecular H
2 formation [
4,
6,
15]. Electron paramagnetic resonance (EPR) results have confirmed that while the photogenerated holes are consumed by the electron donor during illumination, the photoexcited electrons are trapped inside or on the surface of the TiO
2 as reduced Ti(III) ions instead of catalyzing the reduction of the proton [
4].
Additionally, the bare GTiO
2 demonstrated higher and comparable degradation efficiency for 2-naphthol against commercial UV100 and P25 TiO
2 samples, respectively. However, pristine P25 showed higher photocatalytic activity in converting 2-naphthol than both UV100 and GTiO
2. This enhanced activity is attributed to the synergistic effect of the anatase–rutile heterojunction in P25 material, which promotes efficient charge separation. It has been reported that anatase TiO
2 has a greater electron affinity than rutile TiO
2, promoting the transfer of photogenerated electrons from rutile to anatase, while holes migrate to rutile, enhancing the availability of holes for oxidation reactions [
4]. These results align with the work of Hurum et al. [
37], who reported that the mixed-phase of TiO
2 in Degussa P25 improves charge separation, reduces recombination, and boosts photocatalytic performance. Qourzal et al. studied the photocatalytic degradation of 2-naphthol under different types of TiO
2 materials. The Degussa P25 was found to be the most efficient catalyst compared to the UV100 and PC-500 TiO
2 materials [
48].
On the other hand, the improvement of the 2-naphthol photocatalytic removal efficiency on the surface of pristine GTiO
2 compared to UV100 is attributed to the lower rate of
e−/
h+ recombination in GTiO
2 compared to UV100. These results are consistent with agreements with the PL analysis results, where the GTiO
2 NPs exhibited lower recombination intensity than UV100. This serves as a positive indicator of enhanced charge separation and reduced carrier recombination, resulting in greater availability of photogenerated charge carriers for surface redox reactions. Consequently, this leads to an increase in photocatalytic efficiency [
50].
As shown in
Figure 7, a significant enhancement in molecular H
2 formation was observed after platinization of all the tested photocatalysts in the presence of 2-naphthol. Under the present anaerobic conditions, this observation confirms that 2-naphthol is not only a pollutant to be removed from the system, but also an effective hole scavenger or “organic electron donor” that enables molecular hydrogen formation. During illumination, the valence-band photogenerated holes and the photoformed oxidative species oxidize the adsorbed 2-naphthol due to its electron-rich aromatic system and highly favorable oxidation potential. Thereby, consuming the photogenerated holes at the photocatalyst surface, and significantly extends the lifetime of the conduction band electrons. This will suppress electron–hole recombination. As a result, the photogenerated electrons accumulated on the Pt NPs, thus facilitating the proton reduction to H
2. Several research groups have reported the role of a similar organic pollutant to 2-naphthol as a hole scavenger during the photocatalytic degradation of organic compounds, along with H
2 production [
6,
20].
The Pt-GTiO
2 NPs showed higher H
2 evolution than P25 but lower than UV100 at the same Pt weight percentage content. The evolution of molecular H
2 after platinization can be related to effective electron trapping on the Pt NPs and Schottky barrier formation at the Pt-TiO
2 interface, which promotes proton reduction [
22]. The different activities in H
2 evolution between the tested materials align with the differences in the surface area, as shown in
Table 1. The higher the surface area, the better the rate of H
2 formation. As the surface area of the photocatalyst increases, organic substrate adsorption is enhanced due to the greater availability of the active sites, which increases the electron transfer rate to Pt NPs, and thus promotes the formation of molecular hydrogen [
6,
15]. It has been reported that surface area is one factor affecting adsorption and reaction rates, but crystallinity, phase composition, Pt dispersion, and charge separation also contribute to the observed photocatalytic behavior [
4,
29,
30]. It was observed that the platinization process leads to enhancing the photocatalytic degradation efficiency, indicating that Pt NPs not only catalyze the reduction of protons but also promote oxidation of the organic pollutants [
51].
Furthermore, as shown in
Figure 7, a different influence for the loading percentage of Pt NPs on the photocatalytic reforming of 2-naphthol was observed. By increasing the % weight of the Pt NPs from 0.5% to 1% on the surface of the tested materials, H
2 evolution and the degradation efficiency increase. The 1 wt% Pt-GTiO
2 NPs exhibited a degradation efficiency of about 70%, which was higher than that of 1 wt% Pt-UV100 and comparable to 1 wt% Pt-P25. Moreover, 1 wt% Pt-GTiO
2 showed a better H
2 evolution of about 300 µmol g
−1 than the 1 wt% Pt-P25. In addition, although Pt-P25 benefits from the anatase–rutile heterojunction, which is well known to promote charge separation and fast oxidation reactions, the superior H
2 evolution of Pt-GTiO
2 in the present system arises mainly from its textural and interfacial advantages, which balance between the higher BET surface area (137 ± 3.9 m
2 g
−1) and the smaller crystallite size. These features will lead to an increase in the number of accessible Pt-TiO
2 interfacial sites, improve the adsorption of 2-naphthol and its reforming intermediates, and facilitate electron transfer from TiO
2 to Pt for proton reduction. In addition, the biogenic synthesis route may generate beneficial surface states and hydroxyl-rich surface chemistry, further supporting interfacial charge transfer. Therefore, Pt-GTiO
2 provides a more favorable balance for hydrogen evolution, whereas Pt-P25 remains slightly more favorable for fast oxidative disappearance of the parent pollutant [
28,
40]. These presented results indicate that Pt loading is the main factor responsible for H
2 evolution, while the nature of the TiO
2 support controls the balance between pollutant oxidation and hydrogen production.
Based on the previous discussion, it was shown that Pt-GTiO
2 did not outperform all commercial Pt-TiO
2 references across all activity parameters; thus, their activity cannot be attributed only to the pomegranate peel extract. Instead, the extract-assisted synthesis appears to provide GTiO
2 with a useful combination of anatase phase, intermediate surface area, particle morphology, and lower charge recombination, which together contribute to its photocatalytic behavior. It should be noted, however, that the specific contribution of the pomegranate peel extract to the observed enhancement in the photocatalytic performance of GTiO
2 in the absence of a control TiO
2 sample synthesized under identical conditions but without the plant extract must be interpreted with caution. The absence of such baseline control limits the possibility of interpreting variation in photocatalytic activities based on the differences in crystallinity, surface chemistry, and charge-carrier dynamics solely to the biogenic extract, rather than to other synthesis parameters [
23,
25].
3.3. Comparison of Kinetic Profiles
Figure 8 shows the kinetic profiles of photocatalytic 2-naphthol degradation with simultaneous molecular H
2 production over 1 wt% Pt-GTiO
2, 1 wt% Pt-UV100, and 1 wt% Pt-P25 catalysts under the same experimental conditions. During the 60 min dark period before illumination, approximately 10% of the initial 2-naphthol concentration was adsorbed onto the surfaces of all the photocatalysts tested. In this stage, there is no activity for molecular hydrogen formation. Like other research groups’ reports, our FTIR analysis, which is presented in
Figure 4, confirmed the hydroxylated nature of the TiO
2 surface [
26,
52]. As a result, a number of 2-naphthol molecules adsorb to the surface of TiO
2 through interactions with hydroxyl (~OH) and deprotonated oxyanion (~O~) groups.
Upon irradiation, a rapid decrease in the 2-naphthol concentration in the presence of all photocatalysts during the first 60 min of illumination (
Figure 8a) was observed, with approximately 80–90% of the total converted 2-naphthol removed in this period. This fast conversion is found to be accompanied by rapid production of molecular H
2 (
Figure 8a,b). After this period to the end of illumination, a slight decrease in 2-naphthol conversion, as well as evolved H
2, was noticed. This observation suggests that the photocatalyst surface is deactivated by accumulated intermediates occupying active sites, and that 2-naphthol and its by-products compete for the remaining available active sites and the photogenerated holes. This result aligns with previous reports indicating that the degradation of aromatic compounds photocatalytically leads to the formation of different types of harsh intermediates, such as polymeric nature and coupling compounds, which deactivate the catalyst surface [
6,
15,
53].
Furthermore, the results in
Figure 8b show that Pt-UV100 exhibits the highest H
2 production, followed by Pt-GTiO
2, and Pt-P25 with the lowest yield. The trends of both kinetic profiles for Pt-UV100 and Pt-GTiO
2 are similar. The observed behavior suggests that the Pt-UV100 is most effective for H
2 production, which can be attributed to its more negative conduction band (CB) edge and its higher surface area. The typical CB edge for the Pt-UV100 has been reported around −0.5 V vs. Normal Hydrogen Electrode (NHE), compared to 0.0 V vs. NHE to rutile’s CB [
6,
37]. This higher CB energy in UV100 provides a greater tendency for proton reduction to H
2.
On the other hand, although Pt-P25 showed the highest degradation efficiency (
Figure 8a), its kinetic profile trend is very similar to that of Pt-UV100. Both materials exhibit a rapid photodegradation rate in the first 60 min of illumination, which then declines to near zero after 120 min. A different behavior was observed in the case of Pt-GTiO
2. Although its degradation rate decreases with time, it still exhibits better activity after the previously mentioned period to the end of the illumination compared to the other catalysts. This behavior can be attributed to its synthesis method, which leads to the formation of a material characterized by superior surface chemistry and lower charge carrier recombination, thus enhancing its photocatalytic activity by altering charge carrier dynamics.
To compare the photocatalysts more fairly, the initial rates for H
2 production (
), 2-naphthol degradation (
), and normalized activities based on the surface area and the initial rates were calculated for the first 30 min of irradiation, which represent the early reaction region. The initial rates and the normalized values are listed in
Table 2. Pt-UV100 showed the highest initial H
2 evolution rate per catalyst mass, while Pt-GTiO
2 gave a lower value but remained clearly higher than Pt-P25. After normalization to BET surface area, Pt-GTiO
2 and Pt-P25 showed much higher H
2 rates per surface area than Pt-UV100. This indicates that the higher accumulated H
2 over Pt-UV100 is partly related to its much larger surface area. For 2-naphthol degradation, Pt-P25 and Pt-UV100 showed similar initial degradation rates, higher than Pt-GTiO
2. However, after normalization to the BET surface area, Pt-GTiO
2 and Pt-P25 showed much higher degradation rates per surface area than Pt-UV100. Furthermore, Pt-GTiO
2 maintained activity for a longer irradiation period compared to the other catalysts.
3.4. Effect of TiO2 Dosage
It is well known that the catalyst concentration in the photocatalytic system highly affects the rate of H
2 production and the degradation of organic pollutants, due to its direct correlation with the active sites available for the reaction. Increasing the catalyst dosage in the reaction system provides more active sites for the adsorption of organic molecules, generating active species (such as ROS) that participate in the degradation of the adsorbed molecules, and the reduction of the adsorbed proton to H
2 [
26,
48].
The results presented in
Figure 9a exhibit clear dependence on catalyst concentration for both Pt-UV100 and Pt-GTiO
2 under illumination in the presence of 2-naphthol. By increasing the dose of the Pt-UV100 catalyst from 0.5 to 2.0 mg mL
−1, the H
2 evolution increases to reach approximately 400 µmol g
−1. However, increasing the concentration to 3.0 mg mL
−1 resulted in a slight decline, suggesting that the optimal dosage is around 2.0 mg mL
−1. Furthermore, the H
2 evolution over the Pt-UV100 catalyst is higher than that of the Pt-GTiO
2 at comparable dosages, which can be related to the difference in the surface area of the two materials. The surface area of the 1 wt% Pt-UV100 and the 1 wt% Pt-GTiO
2 are about 300 m
2 g
−1 and 140 m
2 g
−1, respectively. Thus, more active sites are available on the surface of the 1 wt% Pt-UV100 for the reduction of the H
+ to molecular H
2. In contrast to 1 wt% Pt-UV100, the extract-assisted 1 wt% Pt-GTiO
2 catalyst demonstrates a continuous increase in H
2 evolution with increasing dosage from 0.5 to 3.0 mg mL
−1, with its maximum reaching around 375 µmol g
−1.
On the other hand, both tested catalysts exhibit a characteristic shape similar to a volcano during the photodegradation of 2-naphthol when the catalyst concentration is increased from 0.5 to 3.0 mg mL
−1, as shown in
Figure 9b. The optimal concentration for both materials was found to be 1.5 mg mL
−1 for Pt-UV100 and 2.0 mg mL
−1 for Pt-GTiO
2. As observed in the results of the H
2 evolution, beyond the optimal values, the performance of both catalysts declined markedly during 2-naphthol conversion. In fact, this phenomenon is well known and has been previously reported in various TiO
2-based materials during the photocatalysis process [
26,
48]. Increasing the catalyst concentration results in more active sites for both the reduction and oxidation reactions on the catalyst’s surface, thereby enhancing H
2 production and pollutant conversion. However, exceeding the optimal concentration of the photocatalyst in the reaction medium leads to an increase in both light scattering during illumination and particle agglomeration. This will limit light penetration into the reaction medium, thereby reducing the number of excited particles and the photogenerated charge carriers. While the agglomeration reduces the available active sites, thus decreasing the overall photocatalytic efficiency [
15,
26].
Furthermore, as presented in
Figure 9b, Pt-GTiO
2 showed better photodegradation efficiency for 2-naphthol compared to Pt-UV100. It nearly converted 2-napthol completely in the presence of 2.0 mg mL
−1 of Pt-TiO
2, and 85% conversion was achieved at a concentration of 3.0 mg mL
−1. In the case of Pt-UV100 at the same catalyst doses, the conversion efficiencies were found to be about 70% and 50%, respectively. The higher activity of Pt-GTiO
2 can be related to its plant-extract-assisted synthesis process. This method yields a higher crystallite size with distinct surface properties and morphology, which could exhibit less susceptibility to light scattering and agglomeration, thereby enhancing the degradation of 2-naphthol [
54].
3.5. Effect of the pH
The effect of varying the pH in the range between 3.0 and 11.0 on the degradation of 2-naphthol and H
2 evolution during the photocatalytic reforming process over Pt-UV100 and Pt-GTiO
2 was evaluated. The results presented in
Figure 10 reveal the high dependence of 2-naphthol degradation and molecular H
2 formation on the system’s initial pH. As shown in
Figure 10a, increasing the initial pH of the reaction medium from 3 to 11 resulted in an enhancement in the degradation efficiency of 2-naphthol, following the same trend in both photocatalyst systems. The Pt-GTiO
2 system achieved higher degradation efficiencies than the Pt-UV100 system at all the studied pH levels. It exhibited almost complete conversion of 2-naphthol in an alkaline medium, and about 56% and 75% conversion efficiencies in acidic and neutral conditions, respectively. Meanwhile, the 2-naphthol degradation in the Pt-UV100 system was found to range from 50% to 86% when changing the initial pH of the system from acidic to basic, respectively.
The better performance of both materials in basic medium can be attributed to the interplay between the surface charge of the TiO
2 support and the acid–base properties of 2-naphthol. The point of zero charge (pzc) of anatase TiO
2 is typically around pH 6.2–6.8 [
55,
56]. At pH values below the pzc, the catalyst surface is positively charged (TiOH
2+) while, at pH values above the pzc, it becomes negatively charged (TiO~) [
22,
48]. Concurrently, 2-naphthol, with a pKa of approximately 9.5, exists in its molecular form at acidic and neutral pH and transitions to its anionic naphtholate form in strongly alkaline conditions (pH > 9.5). At this point, the adsorption of naphtholate ions is expected to be very small due to the repulsion with the negatively charged TiO
2 surface. However, this negative surface promotes the formation of hydroxyl radical (OH
•) species at the surface of the TiO
2 through the reaction of the high-concentration OH
− near the catalyst surface with photogenerated holes, which improves the efficiency of the photocatalysis process, as shown in Equations (2) and (3) [
6,
22,
48,
55].
The superior performance of Pt-GTiO2 in the photodegradation of 2-naphthol at all pH levels over Pt-UV100 is attributed to its favorable optical properties, which were formed during the plant extract synthesis method using Punica granatum peel extract. As previously discussed, the PL analysis confirms the lower rate of charge carrier combination during the excitation of Pt-GTiO2. This lower recombination rate leads to more ROS generation and efficient charge separation, thereby enhancing the degradation efficiency.
On the other hand, although H
2 production is favored in alkaline conditions, a different relationship was observed under other pH media than those in 2-naphthol degradation. Pt-GTiO
2 reached a maximum H
2 rate of approximately 520, 285, and 190 µmol g
−1 in the basic, acidic, and neutral mediums, respectively. In the same manner, but with slightly higher values than Pt-GTiO
2, the Pt-UV100 photocatalyst exhibited H
2 production of nearly 780, 335, and 220 µmol g
−1 under alkaline, acidic, and neutral pH conditions. This trend reflects the strong relationship between H
2 production and 2-naphthyl degradation, as presented in
Figure 10. The higher efficiency of hole consumption during 2-naphthol oxidation in alkaline media leads to the suppression of electron–hole recombination. This, in turn, improved charge separation, making a larger population of photogenerated electrons available at the Pt NPs to reduce protons to molecular H
2, according to Equations (4)–(6) [
6,
22,
55].
The higher performance of Pt-UV100 compared to the Pt-GTiO
2 can be attributed to the differences in the specific surface area of the two materials, as previously discussed in
Section 3.2. Higher values for the photocatalysis of molecular hydrogen were reported in a basic medium at a similar pH, as documented in the literature by several research groups [
55,
56].
The lower H
2 yield in neutral and acidic media, which is combined with moderate degradation, suggests that charge recombination or competing reductive pathways may be more prevalent in these media. In fact, the degradation of organic pollutants in acidic and neutral media often proceeds by attacking the surface-bound OH
• radicals, which are generated by the oxidation of H
2O/OH
− by the photogenerated holes. This pathway is indirect and often slow, and it is governed by the limit of the adsorption of the organic molecules on the surface of the photocatalyst, which is essentially a prerequisite for efficient degradation according to the Langmuir–Hinshelwood kinetics model [
51].


