Abstract
Crithmum maritimum, commonly known as rock samphire, is a plant species with a long history of use in traditional medicine and cuisine, especially in the Mediterranean region. Despite its potential therapeutic and commercial applications, the number of studies on this plant species are scanty and sparse. The aim of this study was to optimize the solid–liquid extraction of bioactive compounds from C. maritimum leaves through response surface methodology (RSM) and to comprehensively analyze the resulting extracts. Experimental parameters including liquid-to-solid ratio, solvent composition, extraction time, and temperature were investigated. The results of the RSM revealed a notable variation in the values of the extracted bioactive compounds (polyphenols, carotenoids, and chlorophylls), indicating the selection of optimum extraction conditions. Partial least squares analysis showed that solvent composition and extraction temperature had a significant impact on the extraction of the bioactive compounds. Consequently, these conditions required a 145-min extraction at 80 °C, using a solvent consisting of 45% v/v ethanol, and a 40:1 liquid-to-solid ratio. The optimum extract was analyzed using a range of assays to determine their polyphenol content, their content in chlorophylls and carotenoids, and their antioxidant potential via FRAP and DPPH assays. The total polyphenol content was measured at 15.11 mg gallic acid equivalents (GAE)/g. High-performance liquid chromatography–diode array detector (HPLC-DAD) analysis revealed that chlorogenic acid was the most prevalent polyphenol (9.35 mg/g) in C. maritimum leaves. Kaempferol 3-glycoside (1.81 mg/g), naringin (1.24 mg/g), and hesperidin (0.79 mg/g) were some polyphenolic compounds that had also been quantified. Total carotenoids (0.32 μg/g) and total chlorophylls (0.62 μg/g) were also measured. Multivariate correlation analysis and principal component analysis revealed that total carotenoids and chlorophylls had a strong negative correlation with total polyphenol content. The reducing power (FRAP assay) of the optimized extract had a value of 85.52 μmol ascorbic acid equivalents (AAE)/g, whereas the antiradical activity (DPPH assay) was measured at 25.57 μmol AAE/g. Given the high quantity of polyphenols, these results highlight the potential use of C. maritimum as a source of bioactive compounds in the food and pharmaceutical industries.
1. Introduction
Halophytes are salt-tolerant plants that can withstand high salinity, wind exposure, and drought conditions. They are typically found in coastal regions around the world [1]. The utilization of halophytes holds promise as a viable and sustainable strategy for agriculture in marginal locations because of their good adaptability to high salinity, low nutrient availability, and other abiotic challenges [2]. Halophyte leaves are often utilized for animal feed, fertilizers, fuels, and desalination processes, as well as for consumption [3]. Halophytes are increasingly acknowledged as an excellent source of biomolecules with significant nutritional and health benefits [2]. As a result, there is an increasing interest in researching wild halophytes in order to promote their usage for industrial purposes, as well as their consumption. They could also provide alternative options for food production, given the increasing scarcity of arable land areas, which is further reduced by the irreversible increase in salinity of soils and freshwater. Even though halophytes have the potential to be crops, particularly in regions with harsh weather and poor soil conditions, the parameters that might influence their leaf phytochemicals are still poorly understood [4].
Crithmum maritimum L. is a halophyte plant that belongs to the family Apiaceae. This plant, also known as sea fennel or rock samphire, is found on sea cliffs and sand along the Atlantic coasts of Europe, the Azores, Madeira, and Canary Islands, the Mediterranean and Black Sea coasts, north-west Africa, and western Asia [5]. C. maritimum is known for its antiscorbutic, carminative, diuretic, digestive, purgative, and vermifuge effects, particularly in its succulent aerial parts and young branches. It is also well-known as an excellent seasoning salad that fits well with seafood dishes in coastal areas [6]. C. maritimum is also known as a source of proteins, amino acids, vitamin C, minerals (potassium, salt, calcium, and magnesium), phenolic compounds, and flavonoids, according to previous studies [7,8]. Its seeds contain substantial quantities of high-quality edible oil and secondary metabolites with many possible industrial uses [9,10,11], while its leaves exhibit strong antioxidant and nutritional value [12].
In recent times, there has been a growing need for natural antioxidants owing to their potential for enhancing value in food and cosmetic products [13,14]. Certain plant species possess a substantial resource of naturally occurring compounds that exhibit antimicrobial properties, thereby exhibiting the capacity to provide health benefits to the consumers [15]. Several studies [16,17] have also provided evidence of the antimicrobial properties exhibited by dietary secondary metabolites, such as polyphenols. C. maritimum is recognized as one of the most phenolic-rich species within the Apiaceae family. The leaves of sea fennel have been identified as a significant source of chlorogenic acid and its isomers, thereby presenting a valuable alternative source of chlorogenic acids (along with other phenolic compounds) for the food industry [18]. Alongside chlorogenic acid, other phenolic acids such as gallic acid and ferulic acid, are also widely identified. C. maritimum has also been identified as a source of coumarin and hesperidin [19]. These compounds could be easily extracted even with a fast and simple conventional extraction technique. In a study conducted by Veršić Bratinčević et al. [20], it was found that conventional solvent extraction had better results than ultrasound-assisted extraction to extract polyphenols from C. maritimum, with total polyphenols measured at ~20 mg of gallic acid equivalents (GAE)/g of dried mass. Nevertheless, the content of total polyphenols can exhibit significant variations depending on the vegetation period [21].
Despite the significance of the plant, the studies related to its phytochemicals are scanty and sparse. As such, there is a need to study this species more extensively. While there may be a few studies that have explored the chemical composition of this plant, this research employes a more systematic approach, i.e., by investigating and optimizing various extraction parameters. The aim of this study was to optimize an extraction procedure (conventional stirring method) with a response surface methodology (RSM) in order to maximize the extracted polyphenols from C. maritimum leaves. Several parameters such as time, temperature, solvent composition, and liquid-to-solid ratio were considered, whereas optimum conditions were identified through a partial least squares (PLS) model. The impact of these parameters on the antioxidant activity of the extracts was evaluated. Finally, the potential of C. maritimum to be utilized as a viable source of polyphenols, particularly chlorogenic acid, was assessed in order to emphasize its prospective application in food and pharmaceutical sectors.
2. Materials and Methods
2.1. Chemicals and Reagents
Methanol, l-ascorbic acid, aluminum chloride, hydrochloric acid, 2,4,6-tris(2-pyridyl)-s-triazine (TPTZ), 2,2-diphenylpicrylhydrazyl (DPPH), β-carotene and chlorophyll-a analytical standards, and all chemical standards for the HPLC determination of polyphenols were purchased from Sigma-Aldrich (Darmstadt, Germany). Gallic acid, ethanol and the Folin–Ciocalteu reagent were purchased from Panreac Co. (Barcelona, Spain). Anhydrous sodium carbonate was purchased from Penta (Prague, Czech Republic). From Merck (Darmstadt, Germany), iron (III) chloride was purchased. Water from the deionizing column was used for all conducted experiments.
2.2. Plant Material
Fresh leaves of C. maritimum were collected in December of 2022 from Paltsi beach near Argalasti village on the SouthEast coast of Pelion mountain (39°14′8.17″ Β, 23°19′3.70″ A), as illustrated in Figure 1.
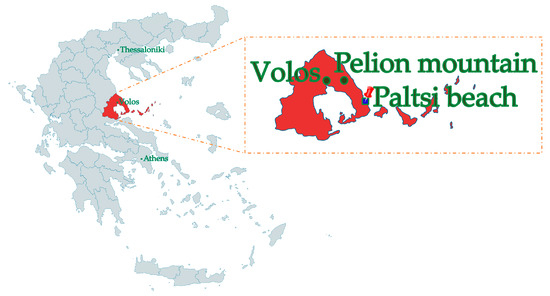
Figure 1.
The sampling point (Paltsi beach) of C. maritimum in Pelion, Greece.
The plant was washed with distilled water to remove dust and soil particles at the laboratory. Next, the aerial parts were flash-frozen using liquid nitrogen. A Biobase BK-FD10P freeze-dryer (Jinan, Shandong, China) was used to freeze-dry the sample. The moisture content of the plant was measured to be 13.36 ± 0.66%. Finally, a blender was employed to grind the dried C. maritimum plant into a fine powder (<200 μm diameter). The powder was finally stored at −40 °C until further analysis.
2.3. Plant Extraction
To determine the most effective method for extracting antioxidant polyphenols from C. maritimum, varying amounts of dried C. maritimum powder (0.25, 0.40, and 1 g) were mixed with three different ethanol–water mixtures: 100% ethanol, 50% ethanol, and 0% ethanol (v/v) in 25 mL screw-capped glass bottles. The bottles were heated at 20, 50, and 80 °C for durations varying from 30 to 150 min. The mixtures were continuously stirred at 500 rpm. Subsequently, the samples were centrifuged at 10,000 rpm for 10 min in a NEYA 16R centrifuge (Remi Elektrotechnik Ltd., Palghar, India). The supernatants were collected and preserved at −40 °C until further analysis. Table 1 displays the extraction conditions, including the coded levels.

Table 1.
The actual and coded levels of the independent variables employed to optimize the process.
2.4. Optimization through Response Surface Methodology (RSM) and Experimental Design
The extraction of total polyphenol content (TPC) and, specifically, chlorogenic acid was conducted with maximum efficiency using the RSM approach. The antioxidant activity was evaluated through the utilization of the FRAP and DPPH assays. Hence, the primary aim of the design was to optimize the levels of chlorogenic acid, as well as the values of TPC, FRAP, and DPPH scavenging activity. This was achieved by optimizing the liquid-to-solid ratio (mL/g), solvent concentration (C, % v/v), extraction time (t, min), and the extraction temperature (T, °C). An experiment using a Box–Behnken design with a major effect screening layout and 27 design points served as the basis for the optimization, with 3 central points. Three levels of process variables were established in accordance with the experimental design. The actual and coded levels are detailed in Table 1. The significance of the overall model (R2, p) and the significance of the model coefficients (equations) were evaluated at a minimum level of 95% using analysis of variance (ANOVA) and summary-of-fit tests.
A second-order polynomial model, shown in the following Equation (1), was also used to predict the response variable as a function of the examined independent factors:
where Yk is the predicted response variable; Xi and Xj are the independent variables; β0, βi, βii, and βij are the intercept, and regression coefficients of the linear, quadratic, and interaction terms of the model, respectively.
The RSM was employed to identify the greatest peak area and evaluate the impact of a significant independent variable on the response. The construction of 3D surface response graphs was undertaken in order to visually depict the model equation.
2.5. Total Polyphenol Content (TPC)
The TPC was evaluated according to a previous methodology [22]. An Eppendorf tube was used to mix 100 μL of Folin–Ciocalteu reagent with 100 μL of a sample extract. After 2 min, 800 μL of 5% w/v Na2CO3 solution was added. After vortexing, the solutions were heated for 20 min at 40 °C. The absorbance at 740 nm was measured using a Shimadzu UV-1700 PharmaSpec Spectrophotometer from Kyoto, Japan. Using a calibration curve with standard gallic acid solutions (10–100 mg/L in methanol), results (CTP) were reported as mg GAE/L. Using the following Equation (2), the extraction of TPC was expressed as mg GAE/g of dry weight (dw):
where V is the volume of the extraction medium (in L) and w is the dry weight of the sample (in g).
2.6. Reducing Power (PR, FRAP Assay)
For the investigation of FRAP, a previously described methodology was used [23,24]. Briefly, 50 μL of the extract was combined with 50 μL of FeCl3 solution (4 mM in 0.05 M HCl) in an Eppendorf tube, and the mixture was then incubated for 30 min at 37 °C. After adding 900 μL of TPTZ solution (1 mM in 0.05 M HCl), the absorbance at 620 nm was measured after 5 min. Equation (3) was used to convert the results (PR) into μmol ascorbic acid equivalents (AAE) per gram of dry weight using an ascorbic acid calibration curve (CAA, 50–500 μmol/L in 0.05 M HCl):
where V is the volume of the extraction medium (in L) and w is the dry weight of the sample (in g).
2.7. Antiradical Activity (AAR, DPPH Assay)
The assessment of DPPH radical scavenging activity was conducted using a previously established methodology [22]. The absorbance at 515 nm was measured immediately after mixing (A515(i)) and after 30 min (A515(f)) of incubation of a mixture comprised of 25 μL sample and 975 μL of DPPH solution (100 μmol/L in methanol). The capacity to scavenge the DPPH radical was expressed as
The antiradical activity (AAR) was expressed as μmol ascorbic acid equivalents (AAE), using an ascorbic acid calibration curve (CAA) and the following Equation (5):
where V is the volume of the extraction medium (in L) and w is the weight of the dry weight (in g).
2.8. Pigments (Total Carotenoids and Total Chlorophylls) and Color Analysis
The quantification of pigment in the samples, specifically carotenoids and chlorophylls, was conducted using previously established methodologies [25,26]. A method described by Ayour et al. [25] was utilized to determine the total carotenoid content of the extracts, with some modifications. In brief, all samples underwent a ten-fold dilution using the same solvent employed during their preparation, and subsequently, the absorbance was quantified at a wavelength of 450 nm. The results of total carotenoid content were expressed in mg of β-carotene equivalents per gram of dried weight, employing a calibration curve based on β-carotene. A method from Gregor et al. [26] was used for the determination of chlorophyll content of the extracts, with some modifications. All samples underwent a ten-fold dilution using the same solvent employed during their preparation, and subsequently, the absorbance was quantified at a wavelength of 670 nm. The results of total chlorophyll content were expressed in mg of chlorophyll-a equivalents per gram of dried weight, employing a calibration curve based on chlorophyll-a.
The color of the extracts was measured based on a previously established methodology [27]. The CIELAB parameters (L*, a*, and b*) were measured for the hydroalcoholic extracts using a colorimeter (Lovibond CAM-System 500, The Tintometer Ltd., Amesbury, UK). The description of color is predicated upon three parameters: The L* value represents the perceived lightness of a color, ranging from 0 (representing absolute black) to 100 (representing absolute white). The a* value quantifies the degree of greenness (positive values) or redness (negative values) in a color. Similarly, the b* value measures the extent of blueness (positive values) or yellowness (negative values) in a color. The measure of color intensity is denoted by Cab or C* (chroma, saturation). The coordinate C* can be determined by utilizing the parameters a* and b* through the equation C* = (a2 + b2)(1/2).
2.9. HPLC Determination of Polyphenolic Compounds
Polyphenolic compounds from the sample extracts were identified through high-performance liquid chromatography–diode array detector (HPLC-DAD) analysis, as established in our previous research [28]. The analysis was performed by a Shimadzu CBM-20A liquid chromatograph and a Shimadzu SPD-M20A diode array detector (DAD) (both purchased by Shimadzu Europa GmbH, Duisburg, Germany). The compounds were separated into a Phenomenex Luna C18(2) column from Phenomenex Inc. in Torrance, California, kept at 40 °C (100 Å, 5 μm, 4.6 mm × 250 mm). The mobile phase contained 0.5% aqueous formic acid (A) and a mixture of 0.5% formic acid in acetonitrile/water (3:2) (B). The gradient program required: 0 to 40% B, then to 50% B in 10 min to 70% B in another 10 min, and then held constant for 10 min. The flow rate of the mobile phase was 1 mL/min. The compounds were identified by comparing the retention time and absorbance spectrum to those of pure standards, and then quantified using calibration curves (0–50 μg/mL).
2.10. Statistical Analysis
The experimental design, statistical analysis related to the response surface methodology, and distribution analysis were conducted using JMP® Pro 16 software (SAS, Cary, NC, USA). The quantitative analysis was conducted in triplicate, and the extraction procedures were carried out at a minimum of two times, specifically for each batch of C. maritimum. The results are presented in the form of means and standard deviations.
3. Results and Discussion
Recently, there has been a significant surge of interest in the extraction and utilization of bioactive compounds derived from C. maritimum [29]. The utilization of bioactive compounds found in C. maritimum, such as polyphenols and chlorogenic acid, is of great significance in the development of value-added products. Hence, our objective was to optimize the extraction process of bioactive compounds from C. maritimum by examining crucial factors that influence the extraction efficiency.
3.1. Extraction Optimization
The primary goal of the investigation was to maximize the polyphenol recovery from C. maritimum. To optimize the extraction efficiency of the bioactive compounds, a range of extraction parameters were investigated, including the composition of the solvent (0–100% ethanol: water v/v), the duration of the extraction process (30–150 min), and the temperature in which the extraction took place (20–80 °C). To ensure the adequacy of the liquid-to-solid ratio and achieve the most favorable results, corresponding investigations were also made (ranging from 10 to 40 mL/g). In addition, to evaluate the influence of individual factors and optimize the yield of compound extraction, RSM was utilized. The effectiveness of the response surface and model fit was assessed through the use of ANOVA and summary-of-fit tests to compare the observed values with the predicted values.
3.2. Total Polyphenol Content, Antioxidant Activity, and Pigment Analysis of the Extracts
Polyphenols are one of the most well-known classes of substances that are prevalent in natural products. Polyphenols, especially chlorogenic acid, hold considerable potential for application in the food industry [30,31,32,33]. The measured responses for total polyphenol content (TPC), chlorogenic acid content, as well as of FRAP and DPPH assays for each prepared extract, are presented in Table 2. The variance in the TPC of the extract, ranging from 2.3 to 14.4 mg GAE/g dw, is evident based on the extraction conditions employed. The results from the measured total polyphenols are considered comparable to the following study from Jallali et al. [34], where TPC was measured 4.1 and 7.9 mg GAE/g dw from the Monastir and Kélibia cultivars, respectively. Nevertheless, it is essential to optimize the conditions for a more efficient extraction of total polyphenols.
Table 2.
Experimental findings for the four independent variables under investigation and the dependent variable’s responses.
The concentration of chlorogenic acid (ranging from 0.59 to 9.54 mg/g dw) and the measurement of antioxidant capacity in the extracts exhibited great variation among the various extracts. Given that it is the most abundant polyphenol in C. maritimum, its ratio to total polyphenols ranges from 0 to 66%. This ratio heavily depends on the extraction conditions, as shown in Table 2. Chlorogenic acid in design point No.9 was found at ~36% of total polyphenols. The observed difference between the TPC of 11.72 mg GAE/g and the concentration of chlorogenic acid at 4.72 mg/g in design point No. 9 in Table 2 (as well as in all other cases) can be attributed to the complex polyphenolic composition of C. maritimum leaves and the methodology employed for their quantification. TPC, measured using the Folin–Ciocalteu assay, provides a cumulative value for all polyphenols present in the extract, including chlorogenic acid, as it is a non-selective assay sensitive to a wide range of polyphenolic compounds. In contrast, the specific quantification of chlorogenic acid at 4.72 mg/g is performed using a more selective method (HPLC), which isolates and quantifies individual compounds. Chlorogenic acid was quantified in a previous study by Generalić Mekinić et al. [35] in the leaves of C. maritimum. The concentration of chlorogenic acid ranged from 5.6 to 16.3 mg/g of dry plant material, depending on the collection period. This result also demonstrates the necessity to optimize the extraction conditions. Two different assays, FRAP and DPPH, were used to evaluate the antioxidant capacity of the samples. The FRAP assay values were within the range 16.20–84.62 μmol ascorbic acid equivalents (AAE)/g, while the DPPH assay values ranged from 1.83 to 23.69 μmol AAE/g. According to the results, it was observed that design point 8 showed the highest concentration of chlorogenic acid (9.54 mg/g dw), whereas design point 27 presented the highest concentration of total polyphenols (14.4 mg/g dw). The two design points share similarities in terms of the solvent concentration (50% ethanol) and temperature (80 °C), which are going to be further examined in the following analysis (vide infra).
Chlorophylls are highly prevalent pigments found in green vegetables, exhibiting a strong correlation with color characteristics. The quantity of chlorophyll present serves as a significant quality parameter, as it directly influences the visual attributes of the end product [36]. In addition to their significance in plants’ physiological processes and their functional role in efficiently dissipating surplus solar energy for photosynthesis, carotenoids also play a role in enhancing the sensory appeal of edible fruits and vegetables. They are responsible for the vibrant colors of these food products and serve as precursors for numerous essential volatile flavor compounds [37]. The quantities of pigments (total carotenoids and total chlorophylls) present in C. maritimum extracts, along with color analysis, are shown in Table 3. Total carotenoids (0.36–11.1 μg/g) and total chlorophylls (0.26–28.45 μg/g) had significant differences between the samples, highlighting the importance of the RSM. Based on the results, design point 19 has the highest values for carotenoids and chlorophylls, while design point 8 has the lowest. Design point 19 extraction was conducted under 100% ethanol concentration at 50 °C. Design point 8 sample had the optimum conditions for polyphenol extraction, as previously mentioned, revealing a negative correlation between chlorophylls and carotenoids with total polyphenols. Regarding color analysis, the study revealed that the L* value ranged from 25 to 64, while the C* value ranged from 6.2 to 37.8. Under the extraction conditions in design point 19, color analysis showed their minimum values (L* 25, and C* 6.2). The study conducted by Renna et al. [38] examined the total chlorophyll content of C. maritimum, which was subjected to different drying methods including air oven drying, microwave drying, and freeze-drying. The results indicated that the range of chlorophyll content observed was from 0.22 to 0.73 mg/g of fresh weight. These values were found to be significantly lower compared to our measured values. In the same study, the color of the samples was also assessed, in which the L* parameter exhibited a range of 40.85–52.35, while the C* parameter had a range of 20.01–38.04. The study investigated by Labiad et al. [39] examined the impact of various treatments, specifically sodium chloride and methyl jasmonate, on the leaf tissues of C. maritimum at different concentrations. The carotenoid levels that were measured exhibited a range of 2.43–4.25 μg/g of dried weight, which aligns with the findings obtained in our study.
Table 3.
Coded values of the four independent variables under investigation, the actual concentration of pigments and coordinates of color analysis (L*, and C*).
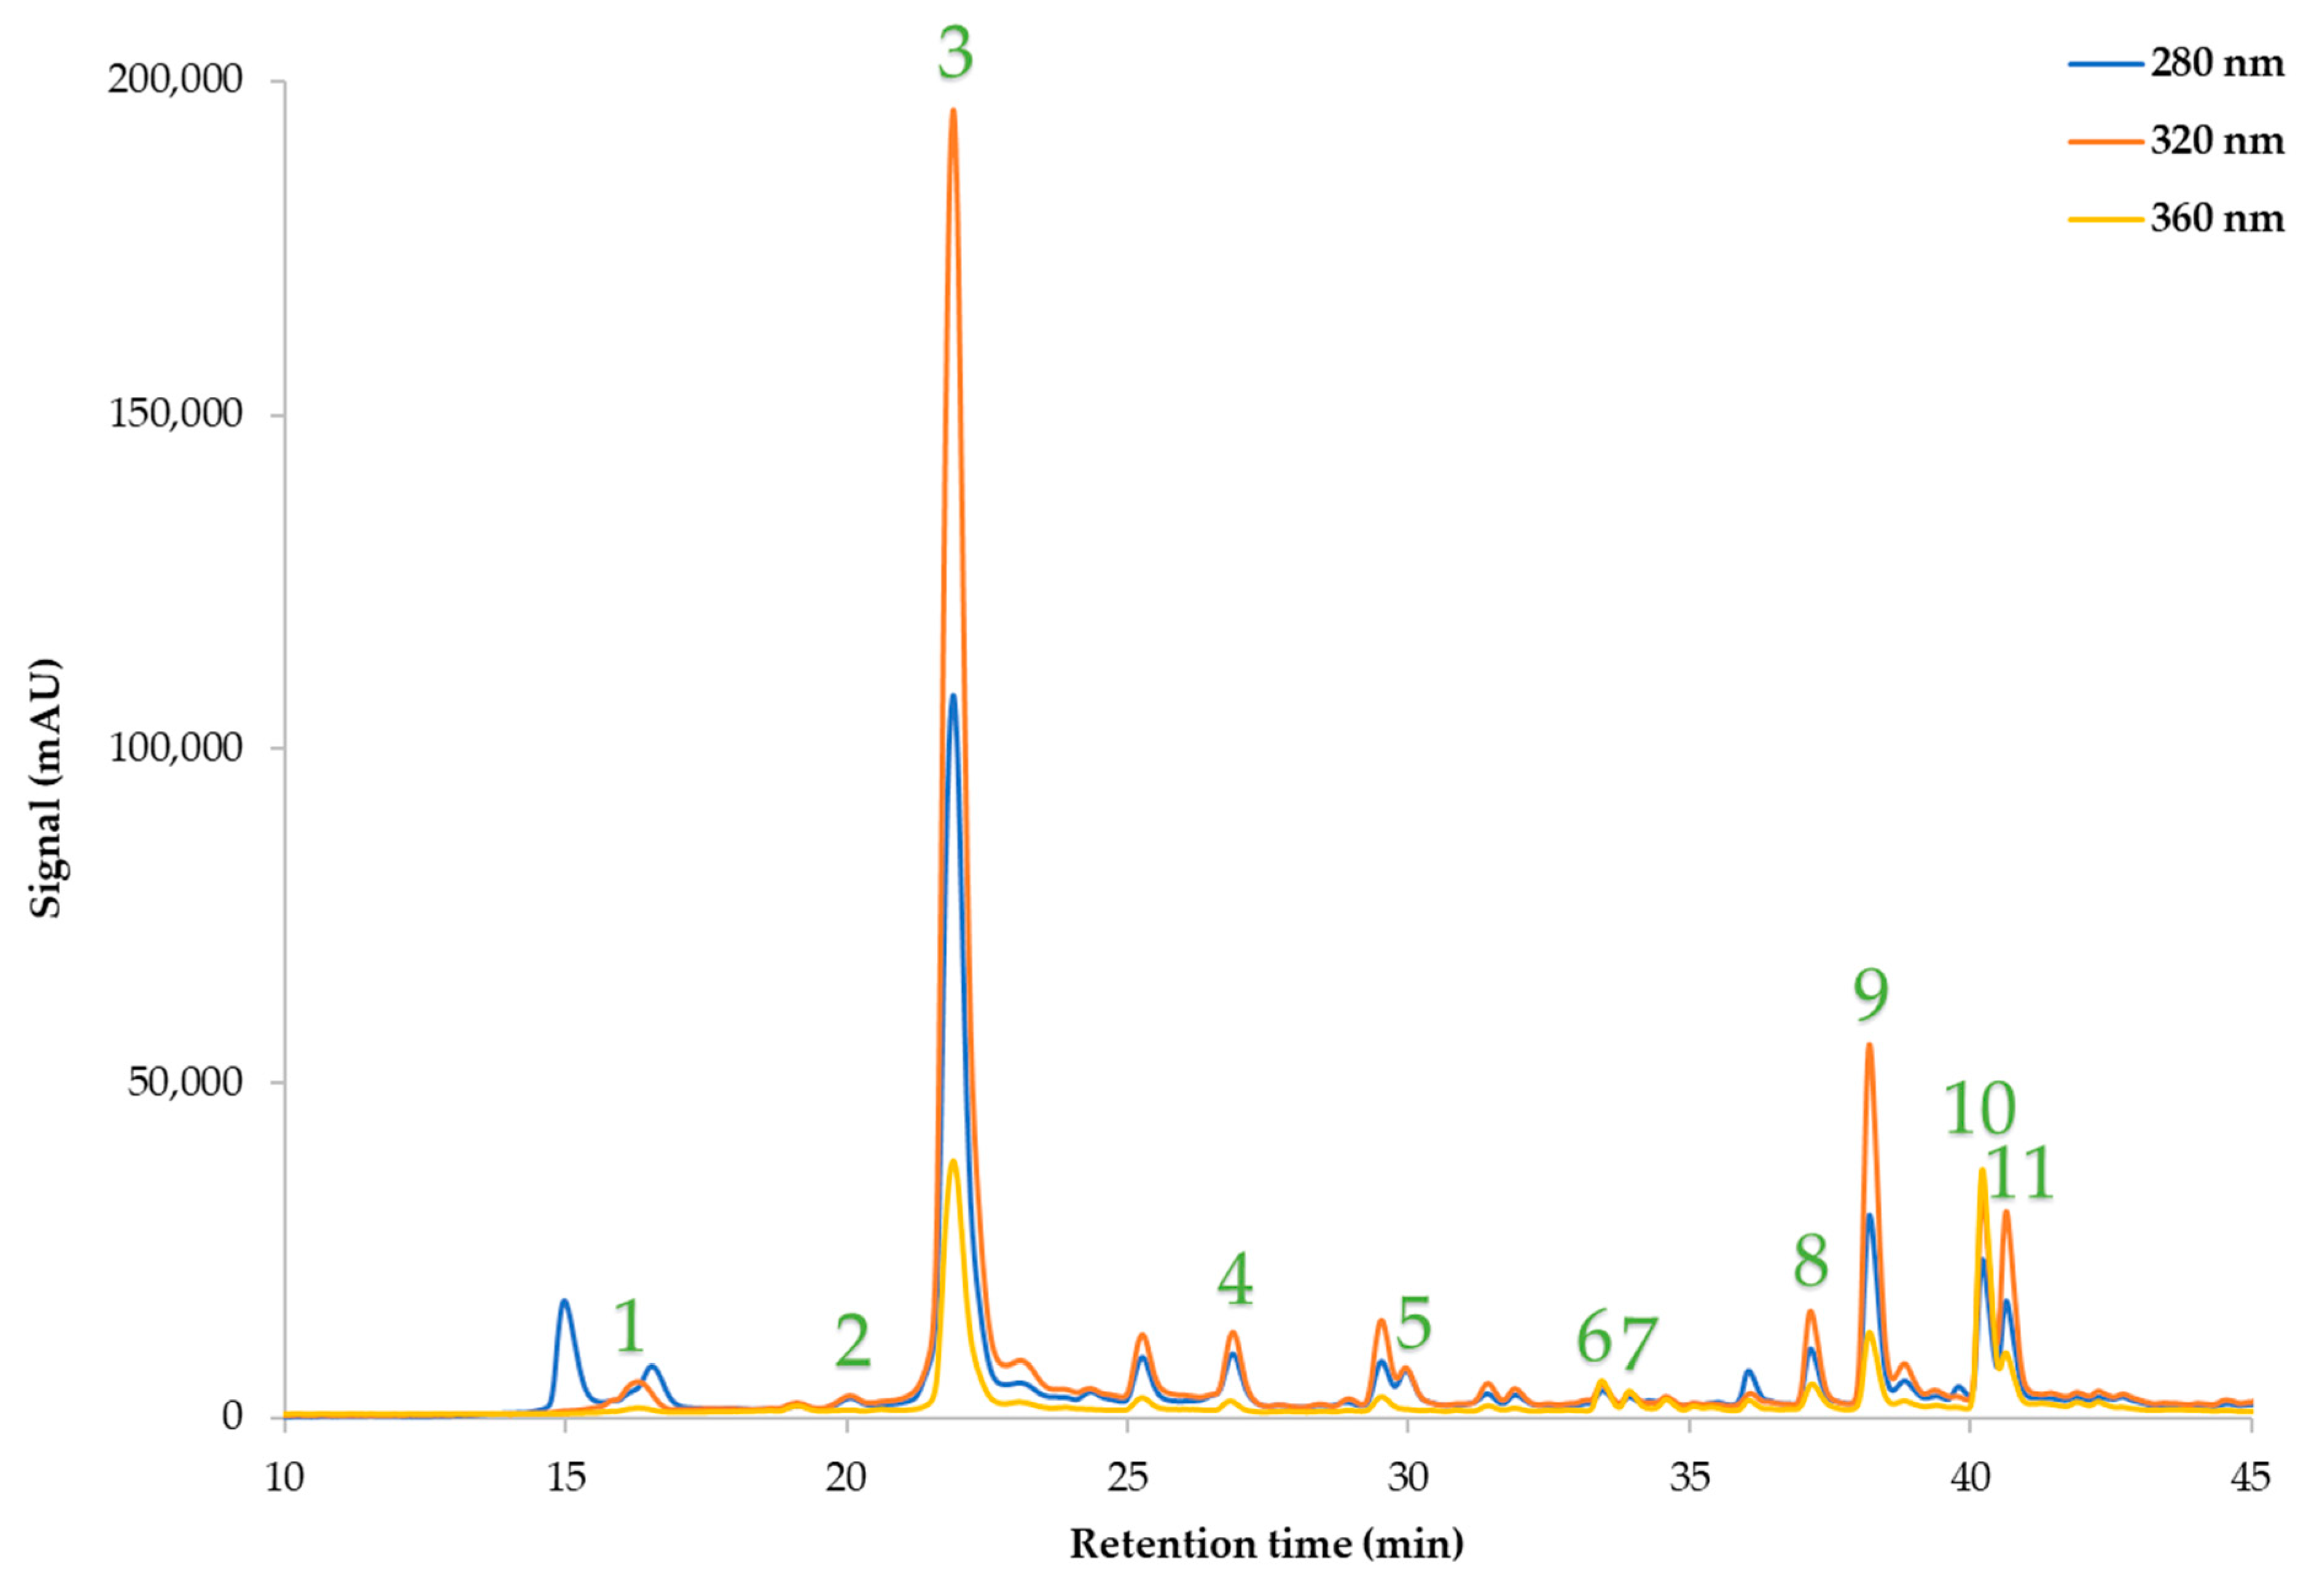
Furthermore, Table 4 presents the concentrations of the primary polyphenols identified through HPLC-DAD. Polyphenolic compounds such as neochlorogenic acid (0.01–0.49 mg/g dw), cryptochlorogenic acid (0.02–0.14 mg/g dw), caffeic acid (0.02–0.18 mg/g dw), coumaric acid (0.01–0.11 mg/g dw), quercetin 3-O-galactoside (0.01–0.10 mg/g dw), rutin (0.01–0.10 mg/g dw), ferulic acid (0.02–0.23 mg/g dw), naringin (0.01–1.58 mg/g dw), kaempferol 3-glycoside (0.01–2.26 mg/g dw), and hesperidin (0.01–0.86 mg/g dw) were identified. These compounds are illustrated in the corresponding chromatogram from design point No. 27 (X1:40, X2:50, X3:90, and X4:80) (Figure 2). A similar trend was noted as regards to the remaining polyphenols. The polyphenols displayed the highest concentration when a solvent containing 50% ethanol was utilized, while the other parameters did not have a substantial impact on the extraction of these compounds. This observation once again reveals the substantial impact of the solvent on the extraction process. Polyphenolic compounds including hydroxycinnamic acids (chlorogenic acid, ferulic acid, and caffeic acid) and flavonoids (naringin and rutin) were also identified in several studies [18,19,35,40], which will be further discussed below.
Table 4.
Coded values of the four independent variables under investigation and the actual concentration of polyphenolic compounds, represented in mg/g dw.

Figure 2.
Exemplary HPLC chromatogram at 280, 320, and 360 nm of C. maritimum extract (design point No.27) demonstrating polyphenolic compounds that were identified. 1: Neochlorogenic acid; 2: Cryptochlorogenic acid; 3: Chlorogenic acid; 4: Caffeic acid; 5: Coumaric acid; 6: Quercetin 3-O-galactoside; 7: Rutin; 8: Ferulic acid; 9: Naringin; 10: Kaempferol 3-glycoside; 11: Hesperidin.
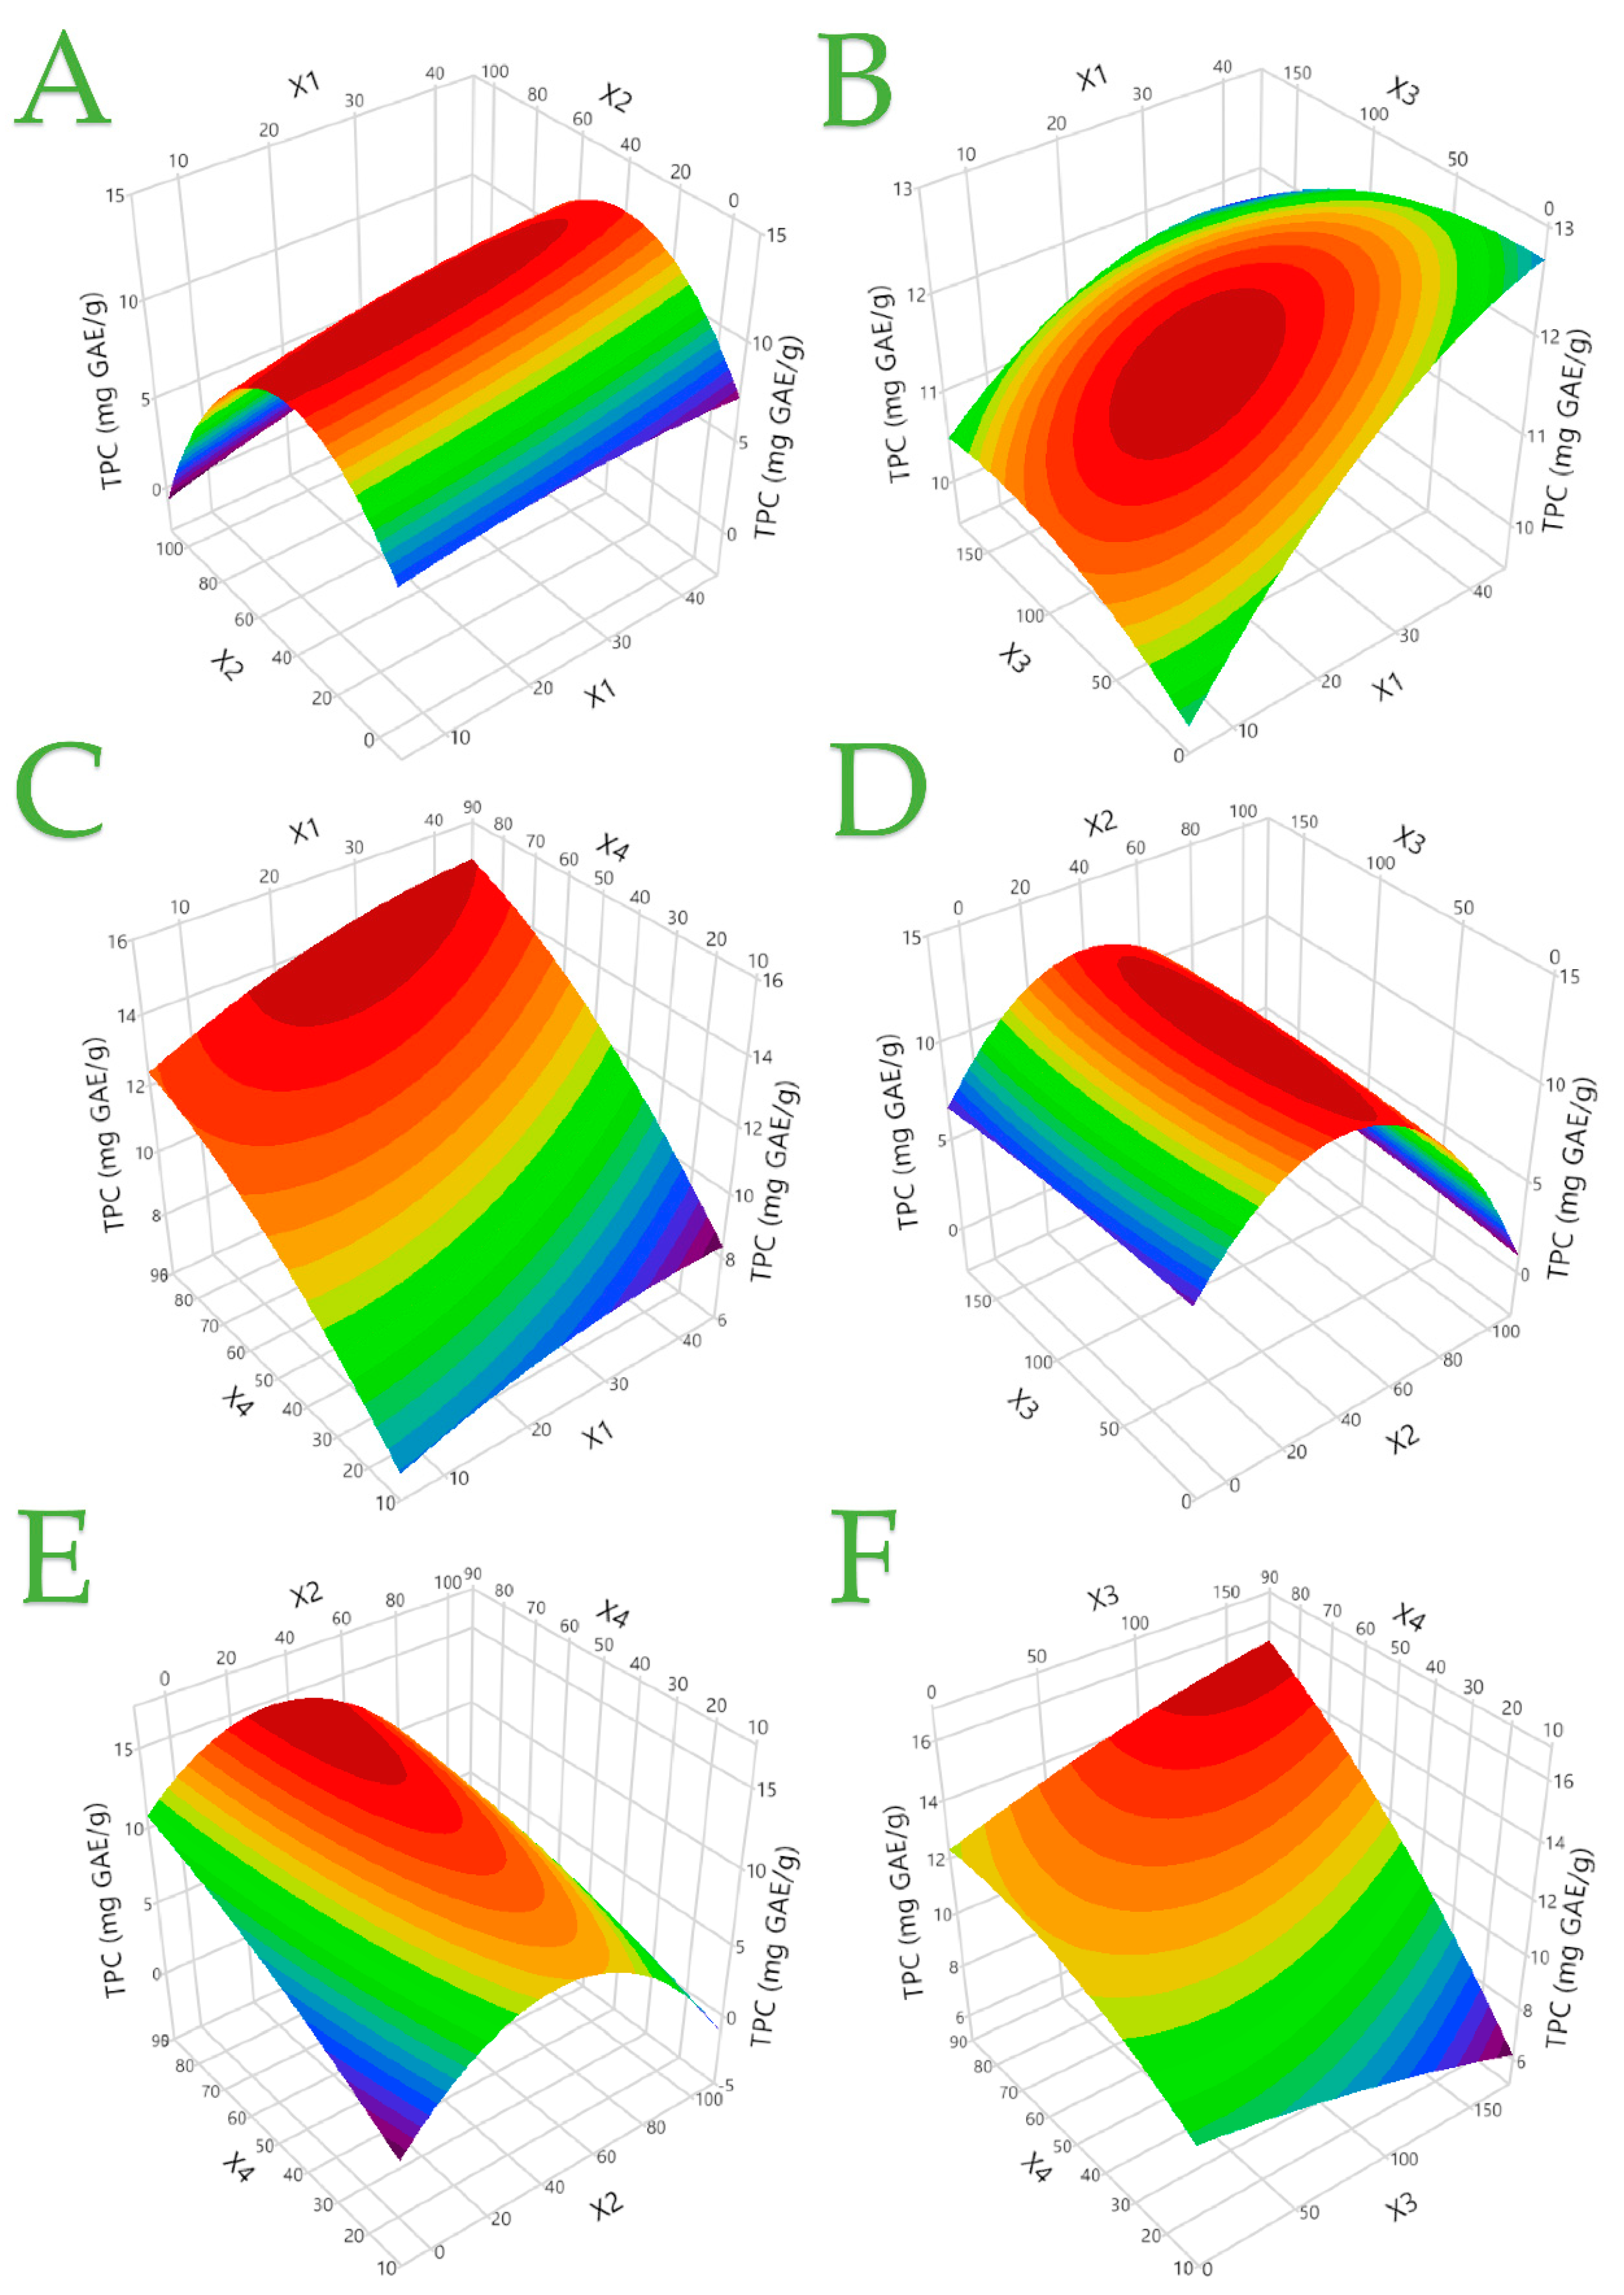
The statistical parameters, second-order polynomial equations (models), and coefficients (coefficients > 0.95) obtained for each model (the terms in each equation are real values of the factors) are presented in Table 5. These findings indicate that the developed models exhibit a strong fit. Figures S1–S4 present the plots illustrating the comparison between the actual response and the predicted response for each parameter under examination, along with the desirability functions. In all antioxidant assays, it was observed that both solid-to-liquid ratio and extraction time have minimum contribution in polyphenol recovery. Figure 3 displays the three-dimensional response plots for TPC, whereas Figures S5–S7 depict the three-dimensional response plots for the remaining responses.
Table 5.
Mathematical models created using RSM were used to optimize the extraction of C. maritimum. The models contained only significant terms.

Figure 3.
The optimal extraction of C. maritimum extracts is shown in 3D graphs that show the impact of the process variables considered in the response (total polyphenol content–TPC, mg GAE/g): plot (A), covariation of X1 and X2; plot (B), covariation of X1 and X3; plot (C), covariation of X1 and X4; plot (D), covariation of X2 and X3; plot (E), covariation of X2 and X4; plot (F), covariation of X3 and X4.
3.3. Optimal Extraction Conditions
The optimization of extraction parameters is of high importance in order to maximize effectiveness. Liquid-to-solid ratio is a frequently investigated parameter. The extraction process is carried out via two distinct phases. Initially, the solvent and solid start mixing, leading to the disruption of the cells of the sample. This disruption leads to the release of bioactive compounds, which are extracted by the solvent. According to principles of mass transfer, an increase in the liquid-to-solid ratio results in a corresponding increase in the total quantity of compounds obtained, regardless of the solvent employed [41]. Nevertheless, a higher liquid-to-solid ratio has the potential to influence the extraction procedure, resulting in higher costs [42]. The optimization of extraction time and temperature is crucial in order to minimize the energy cost associated with the process. It is widely accepted that elevated temperatures have a positive impact on extraction processes, as they promote greater solubility of solutes and enhance diffusion coefficients. However, it is important to note that there exists a threshold beyond which phenolic compounds can undergo denaturation [41]. The impact of time on individual extraction, however, necessitates thorough examination, as prior research has demonstrated the efficacy of both short [43] and extended [44] extraction durations [41]. In conventional extraction methods, the optimal temperature range for achieving the highest polyphenol yield usually lies between 60 and 80 °C. Ethanol, methanol, and acetone are the most frequently employed solvents in these extraction processes, though only ethanol is a food-grade solvent [45]. Due to the potential loss of solvent at temperatures exceeding 60–80 °C, previous studies [46,47] examining the effects of extraction temperatures omitted treatment temperatures beyond the range of 80–90 °C [45]. Due to this rationale, polyphenols are commonly acknowledged as thermally unstable compounds [45]. The composition of the solvent is a critical factor that exerts a substantial influence on the extraction of compounds [41]. In many cases, it is observed that polar solvents such as water show low effectiveness in the extraction of moderately polar molecules such as polyphenols. Consequently, ethanol is frequently employed as a way to decrease solvent polarity and improve the extraction procedure. Based on the findings (vide infra), it was proven that solvent composition and the extraction temperature were the most influential parameters for the effective extraction of polyphenols.
To determine the maximum predicted values for chlorogenic acid, TPC, and antioxidant activity (FRAP and DPPH assay), the desirability function was utilized, and the results are presented in Table 6. Under these conditions, the highest quantity of total polyphenols was extracted from C. maritimum, achieved by a moderate liquid-to-solid ratio (25 mL/g), ethanol concentration (40% v/v), high extraction time (145 min) and temperature (80 °C). Chlorogenic acid also exhibited its maximum extraction at a high temperature (80 °C) and high extraction time (135 min) with a moderately low ethanol concentration (35% v/v) but required a high liquid-to-solid ratio (35 mL/g). FRAP and DPPH antioxidant assays required similar extraction conditions. Moderate ethanol concentration (50 and 40% v/v, respectively) and extraction time (90 and 100 min, respectively) were required. On the other hand, high extraction temperature (75 and 80 °C, respectively) and high liquid-to-solid ratio (35 and 40 mL/g, respectively) were required.
Table 6.
Maximum predicted responses and optimum extraction conditions for the dependent variables.
3.4. Principal Component Analysis (PCA) and Multivariate Correlation Analysis (MCA)
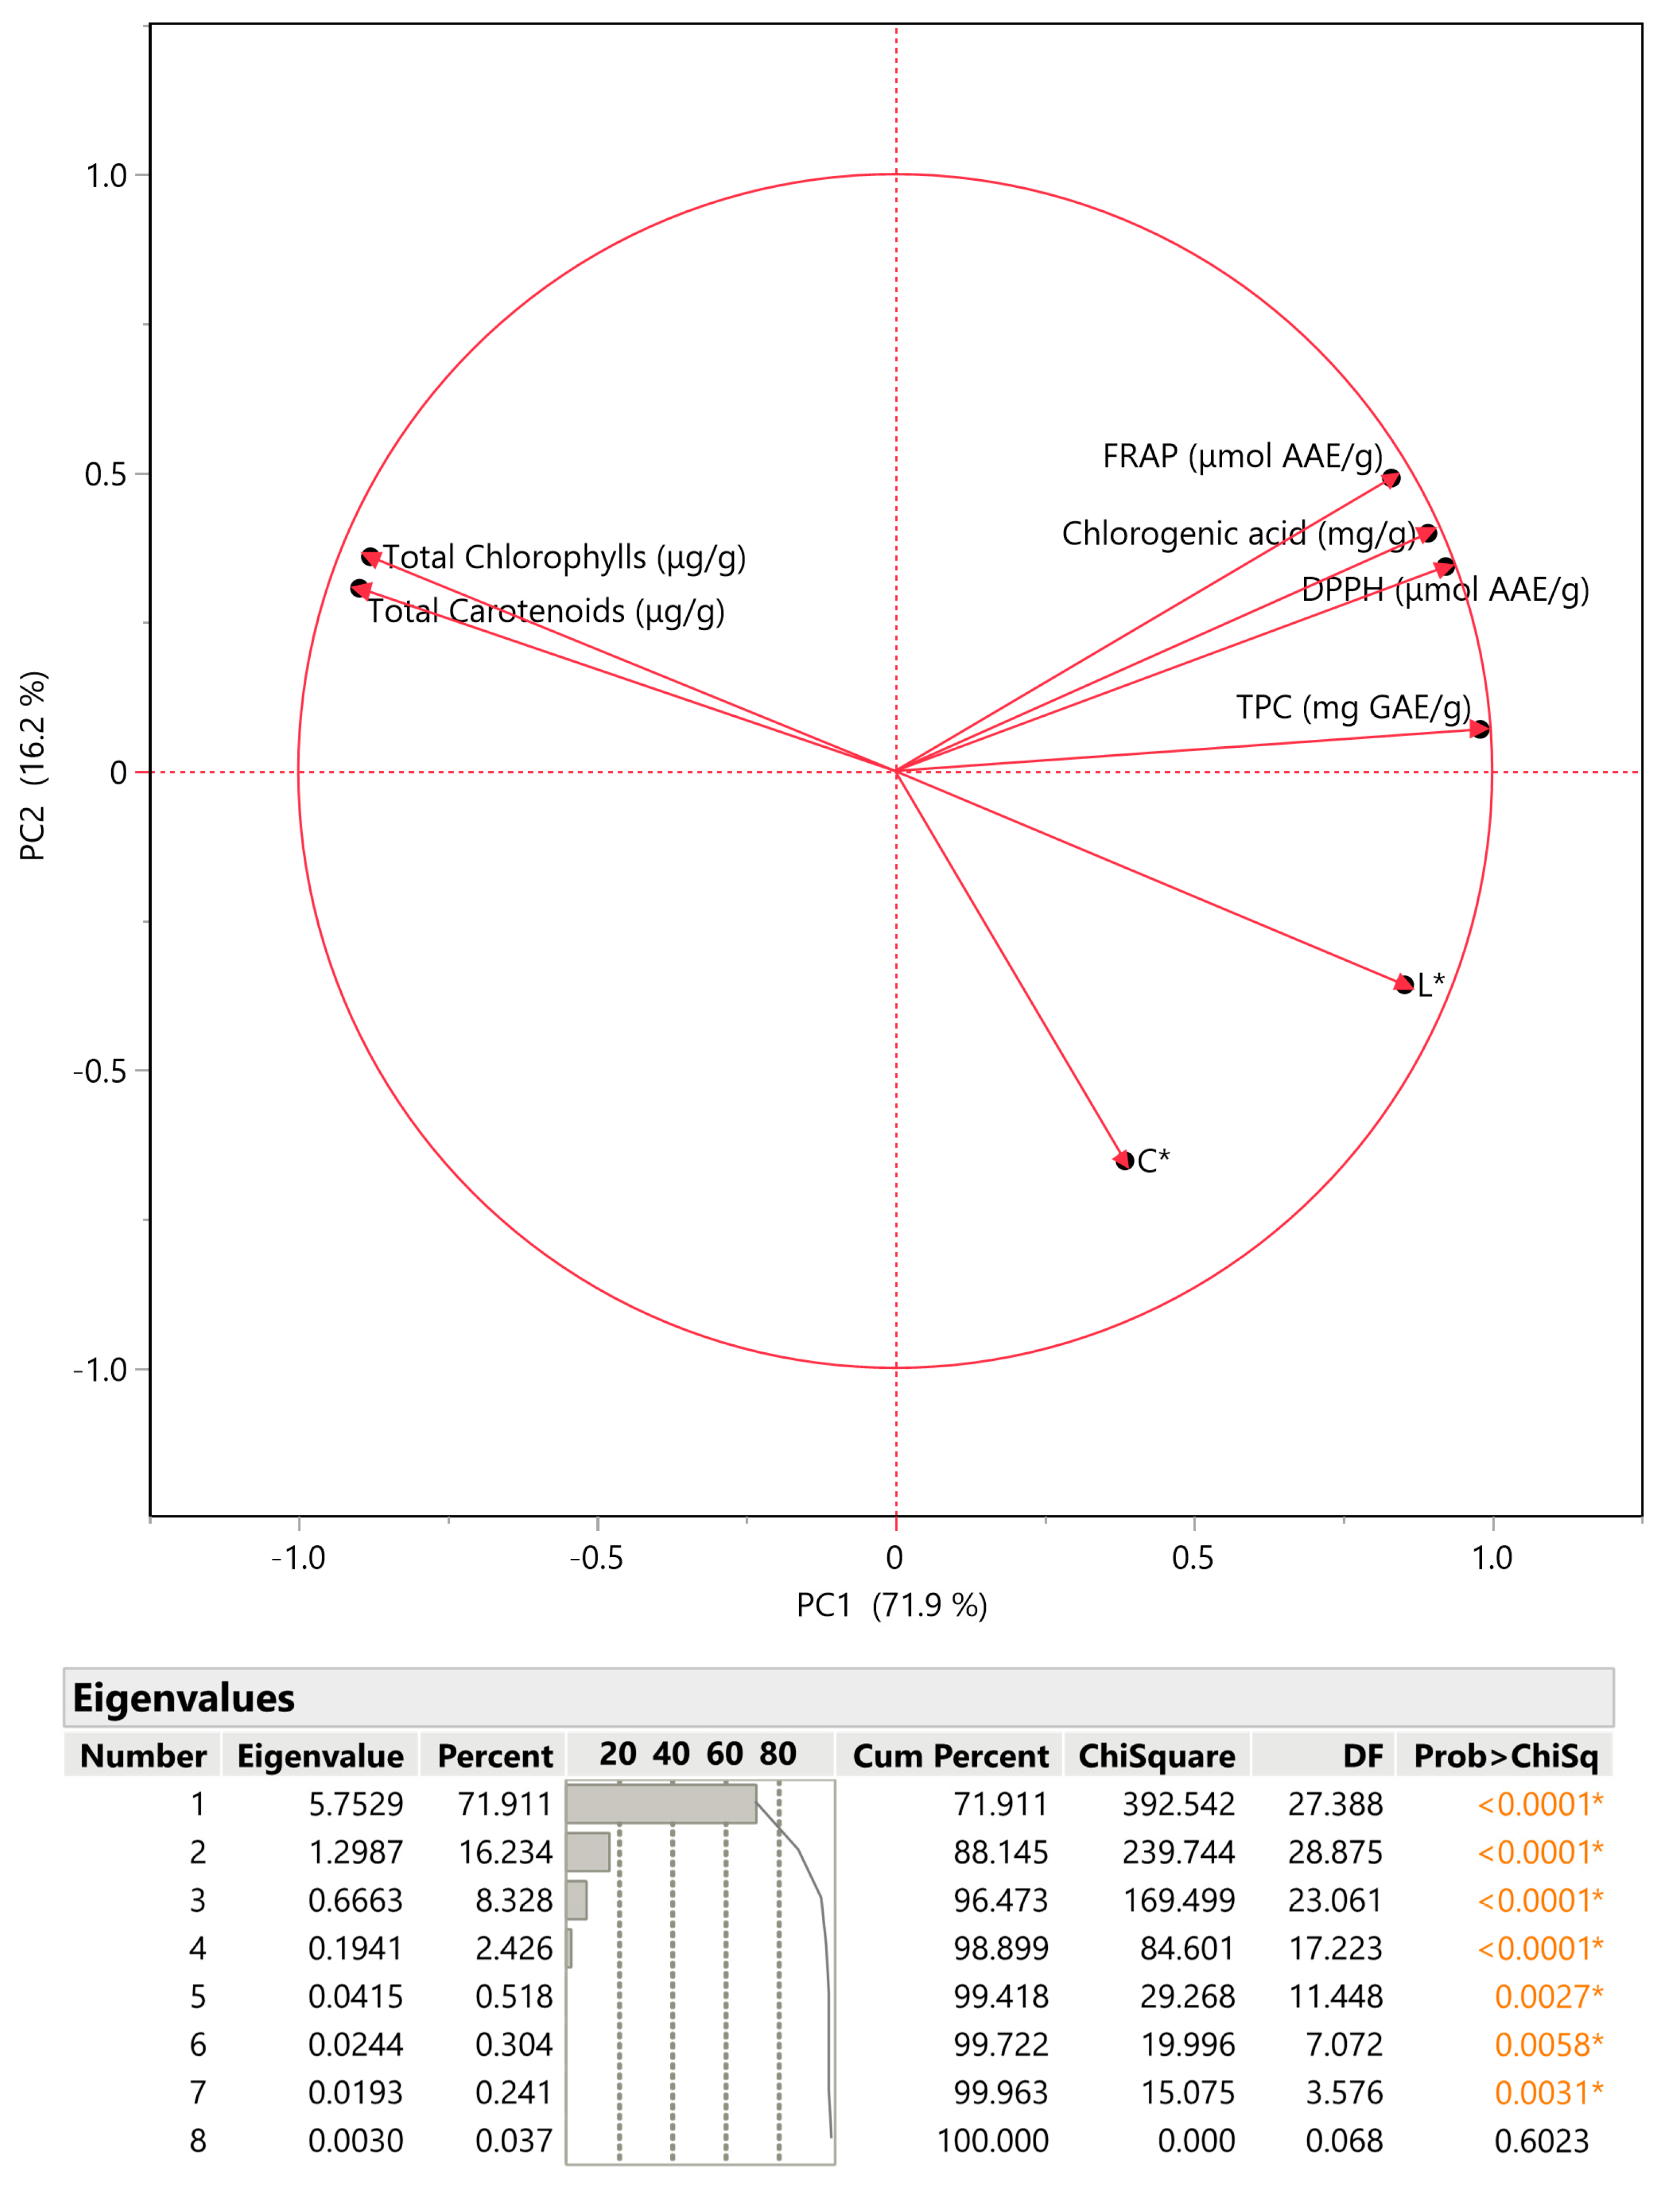
PCA was utilized for a more comprehensive data analysis and enhanced information extraction from variables. The goal was to investigate whether any correlation with polyphenol content (along with chlorogenic acid), antioxidant assays (i.e., FRAP and DPPH), pigment (i.e., total chlorophylls and total carotenoids), and color analysis was observed. Figure 4 depicts the selection of two principal components based on their eigenvalues > 1, which collectively accounted for 88.15% of the variance. The outcomes revealed that the parameters had a positive or negative correlation with each other. For instance, it was found that total pigments correlated positively among them, whereas they correlated negatively from the L* and C* parameters. Same pattern was observed in the study of Ayour et al. [48], where chlorophyll pigments correlated negatively with a* and b* parameters.
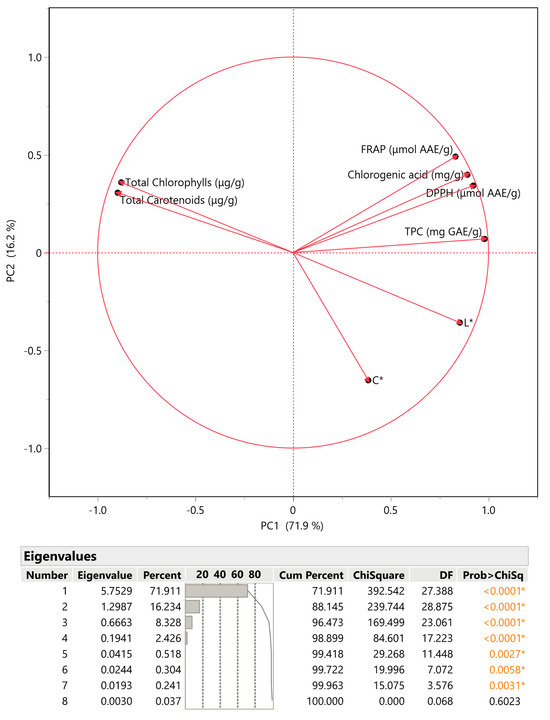
Figure 4.
Principal component analysis (PCA) for the measured variables. The inset table includes the eigenvalues. Asterisks and colored values denote statistically significant values.
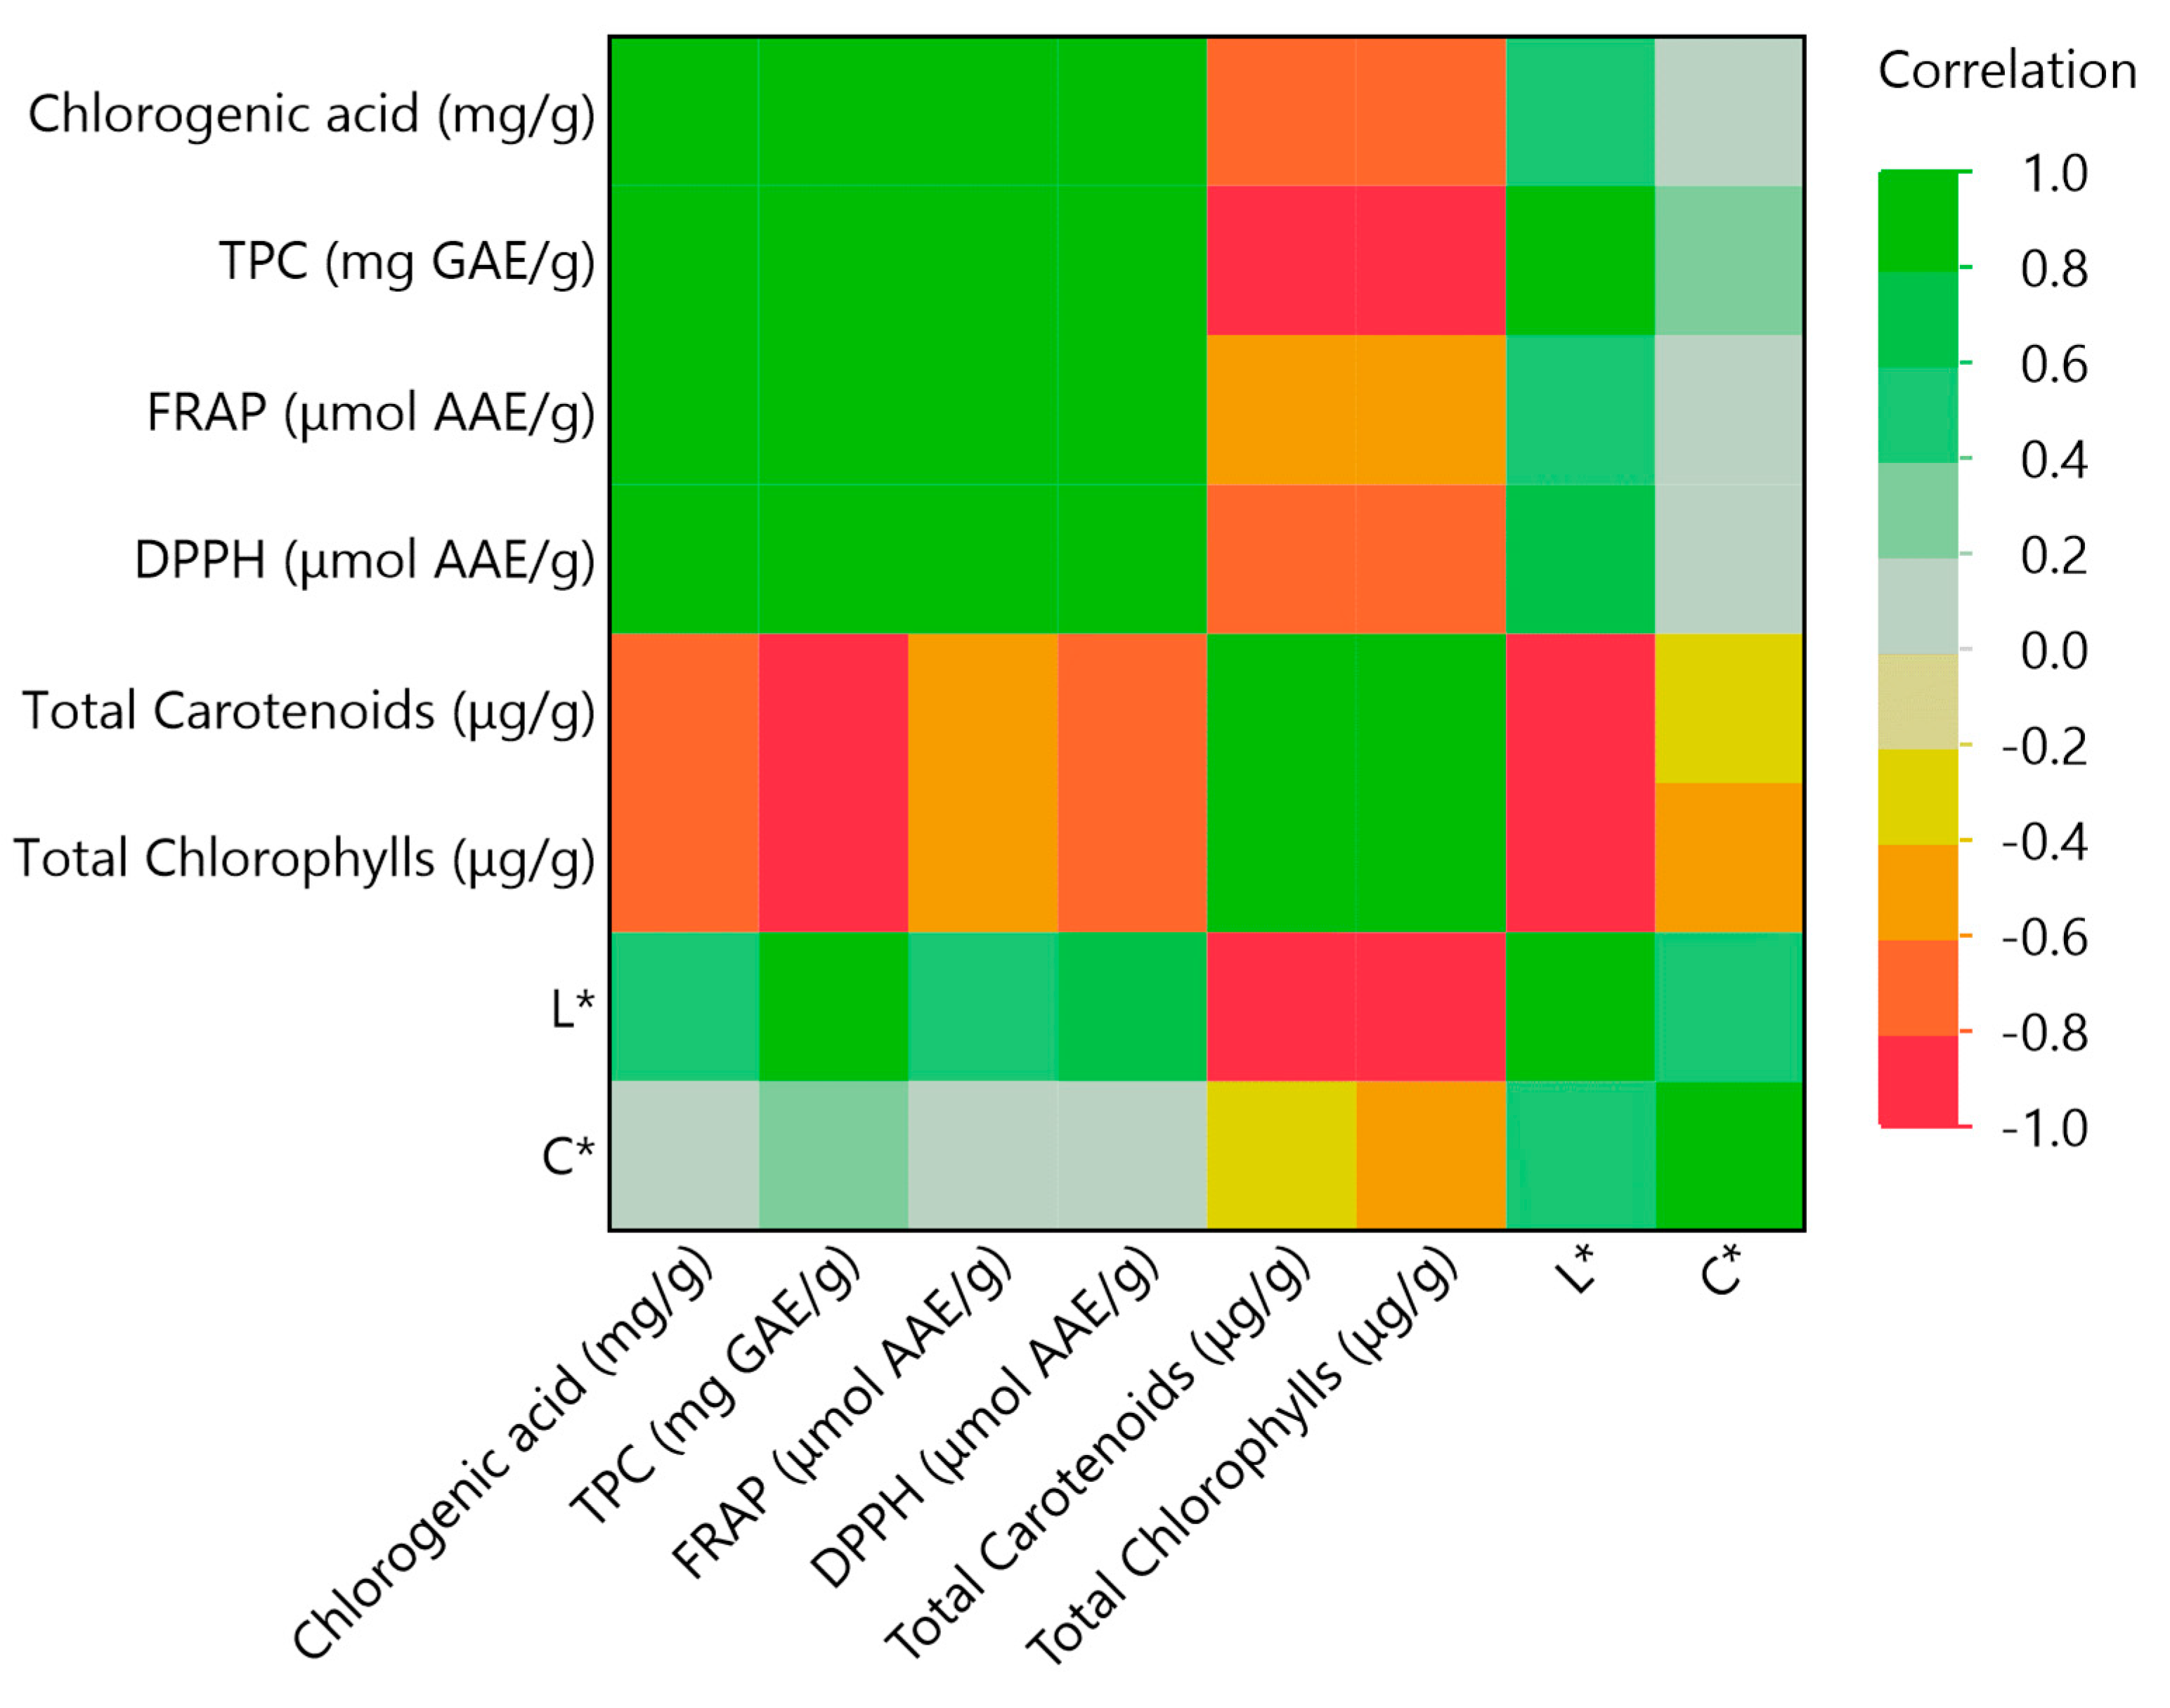
Additionally, a multivariate correlation analysis (MCA) was conducted to provide further elucidation on the correlation between the variables under investigation. The color scale in this color map has correlation values ranging from −1 to 1. The more intense the green color, the stronger the positive correlation between the variables. The more intense red color, on the other hand, indicates a strong negative correlation between the variables. The outcomes of this analysis are depicted in Figure 5 and reveal a notable positive correlation between chlorogenic acid and both TPC and antioxidant assays. This result was expected, as chlorogenic acid is a part of the total polyphenols. In addition, the lightness of an extract (L*) has a positive correlation with polyphenols. It was also revealed that TPC had strong negative correlation with total pigments, with pigments also showing strong negative correlation with L* value. The same pattern was observed in a previously mentioned study by Renna et al. [38], in which total chlorophylls of C. maritimum were found to have negative correlation with L* value.

Figure 5.
Multivariate correlation analysis of measured variables.
3.5. Partial Least Squares (PLS) Analysis
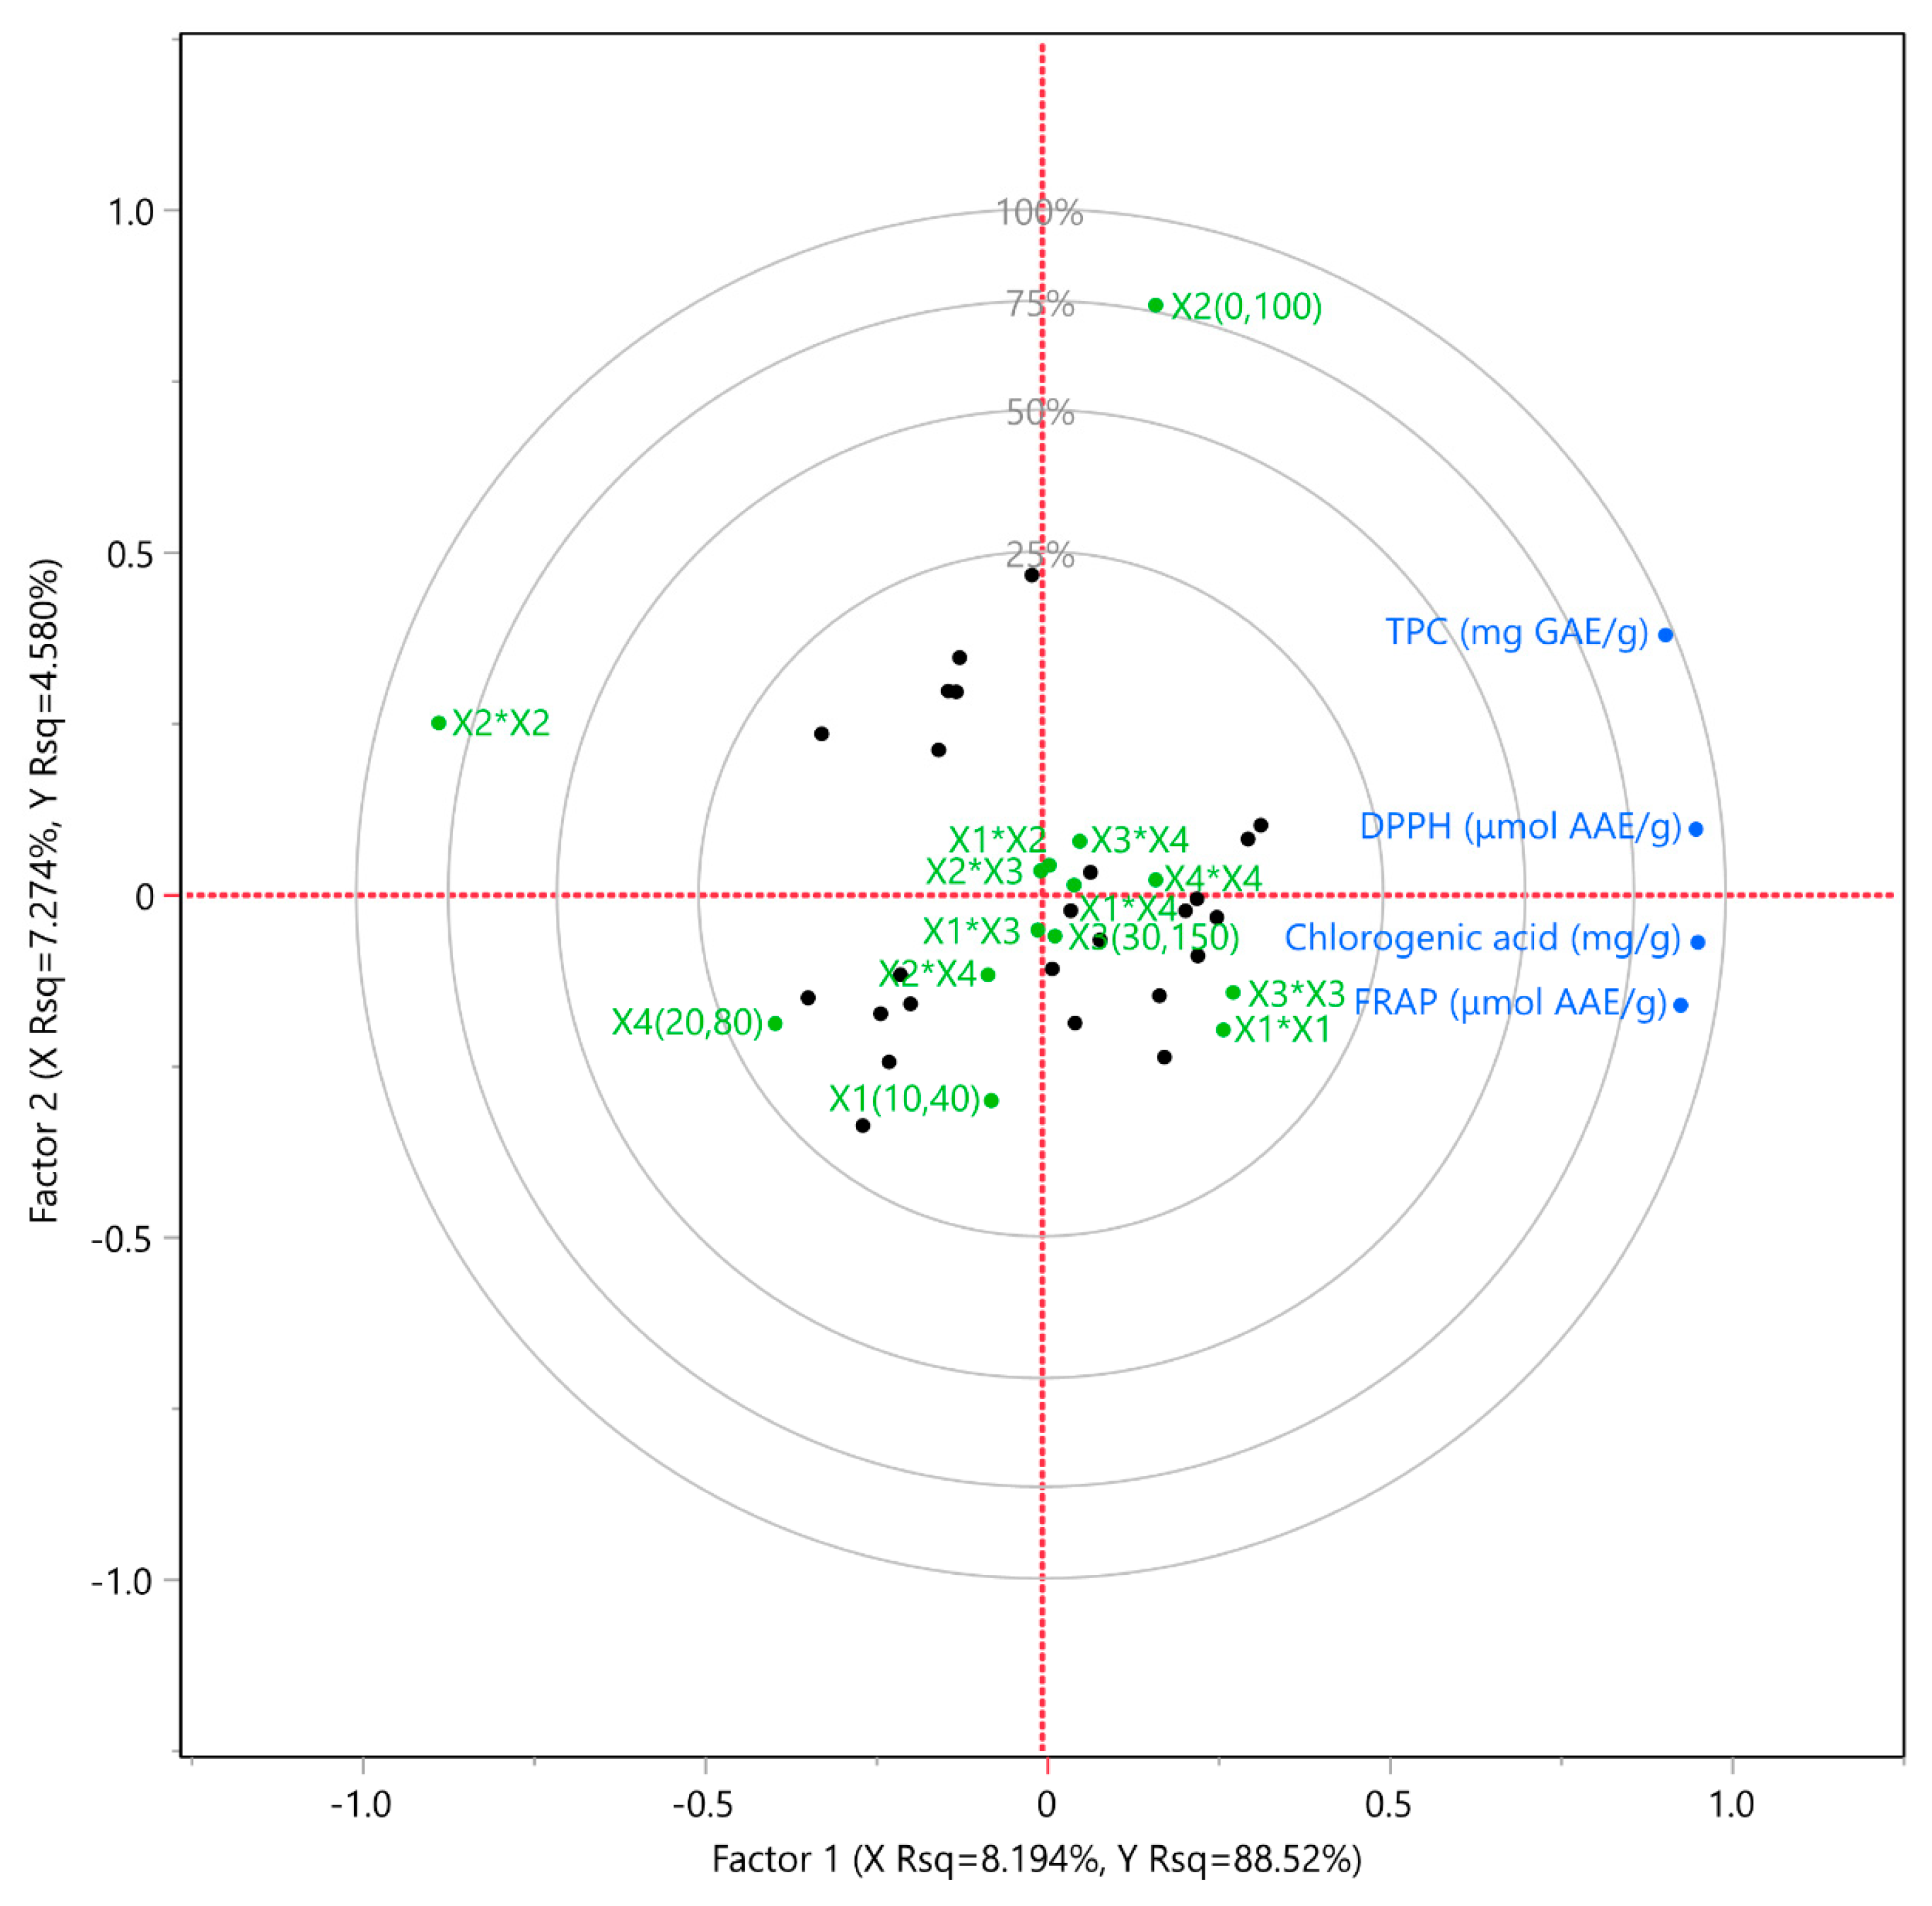
To determine the key extraction parameters (X1, X2, X3, X4), a PLS analysis was performed (Figure 6 and Figure 7). Figure 6 illustrates the utilization of PLS analysis to construct a correlation loading plot, which visually represents the extraction conditions of C. maritimum. The greater the variable importance for the projection (VIP) factor (specifically greater than 0.8), the greater the contribution of this factor. Based on the outcomes, factor X2 (solvent concentration) emerged as the primary determinant in the extraction of bioactive compounds, showing significantly greater significance in comparison to the other factors. As previously indicated, it is recommended that the solvent have a moderate ethanol concentration to guarantee optimal outcomes for the majority of substances. The factor X4 (extraction temperature) also seems to have an influence, albeit not a significant one. The variables X1 and X3 (liquid-to-solid ratio and extraction time, respectively) do not appear to have a significant impact on the extraction process. For instance, it is reported that extraction time above 45 min does not have significant impact on the polyphenol extraction process [49,50].

Figure 6.
PLS (partial least squares) analysis was used to create a graph (correlation loading plot) showing C. maritimum different extraction conditions.

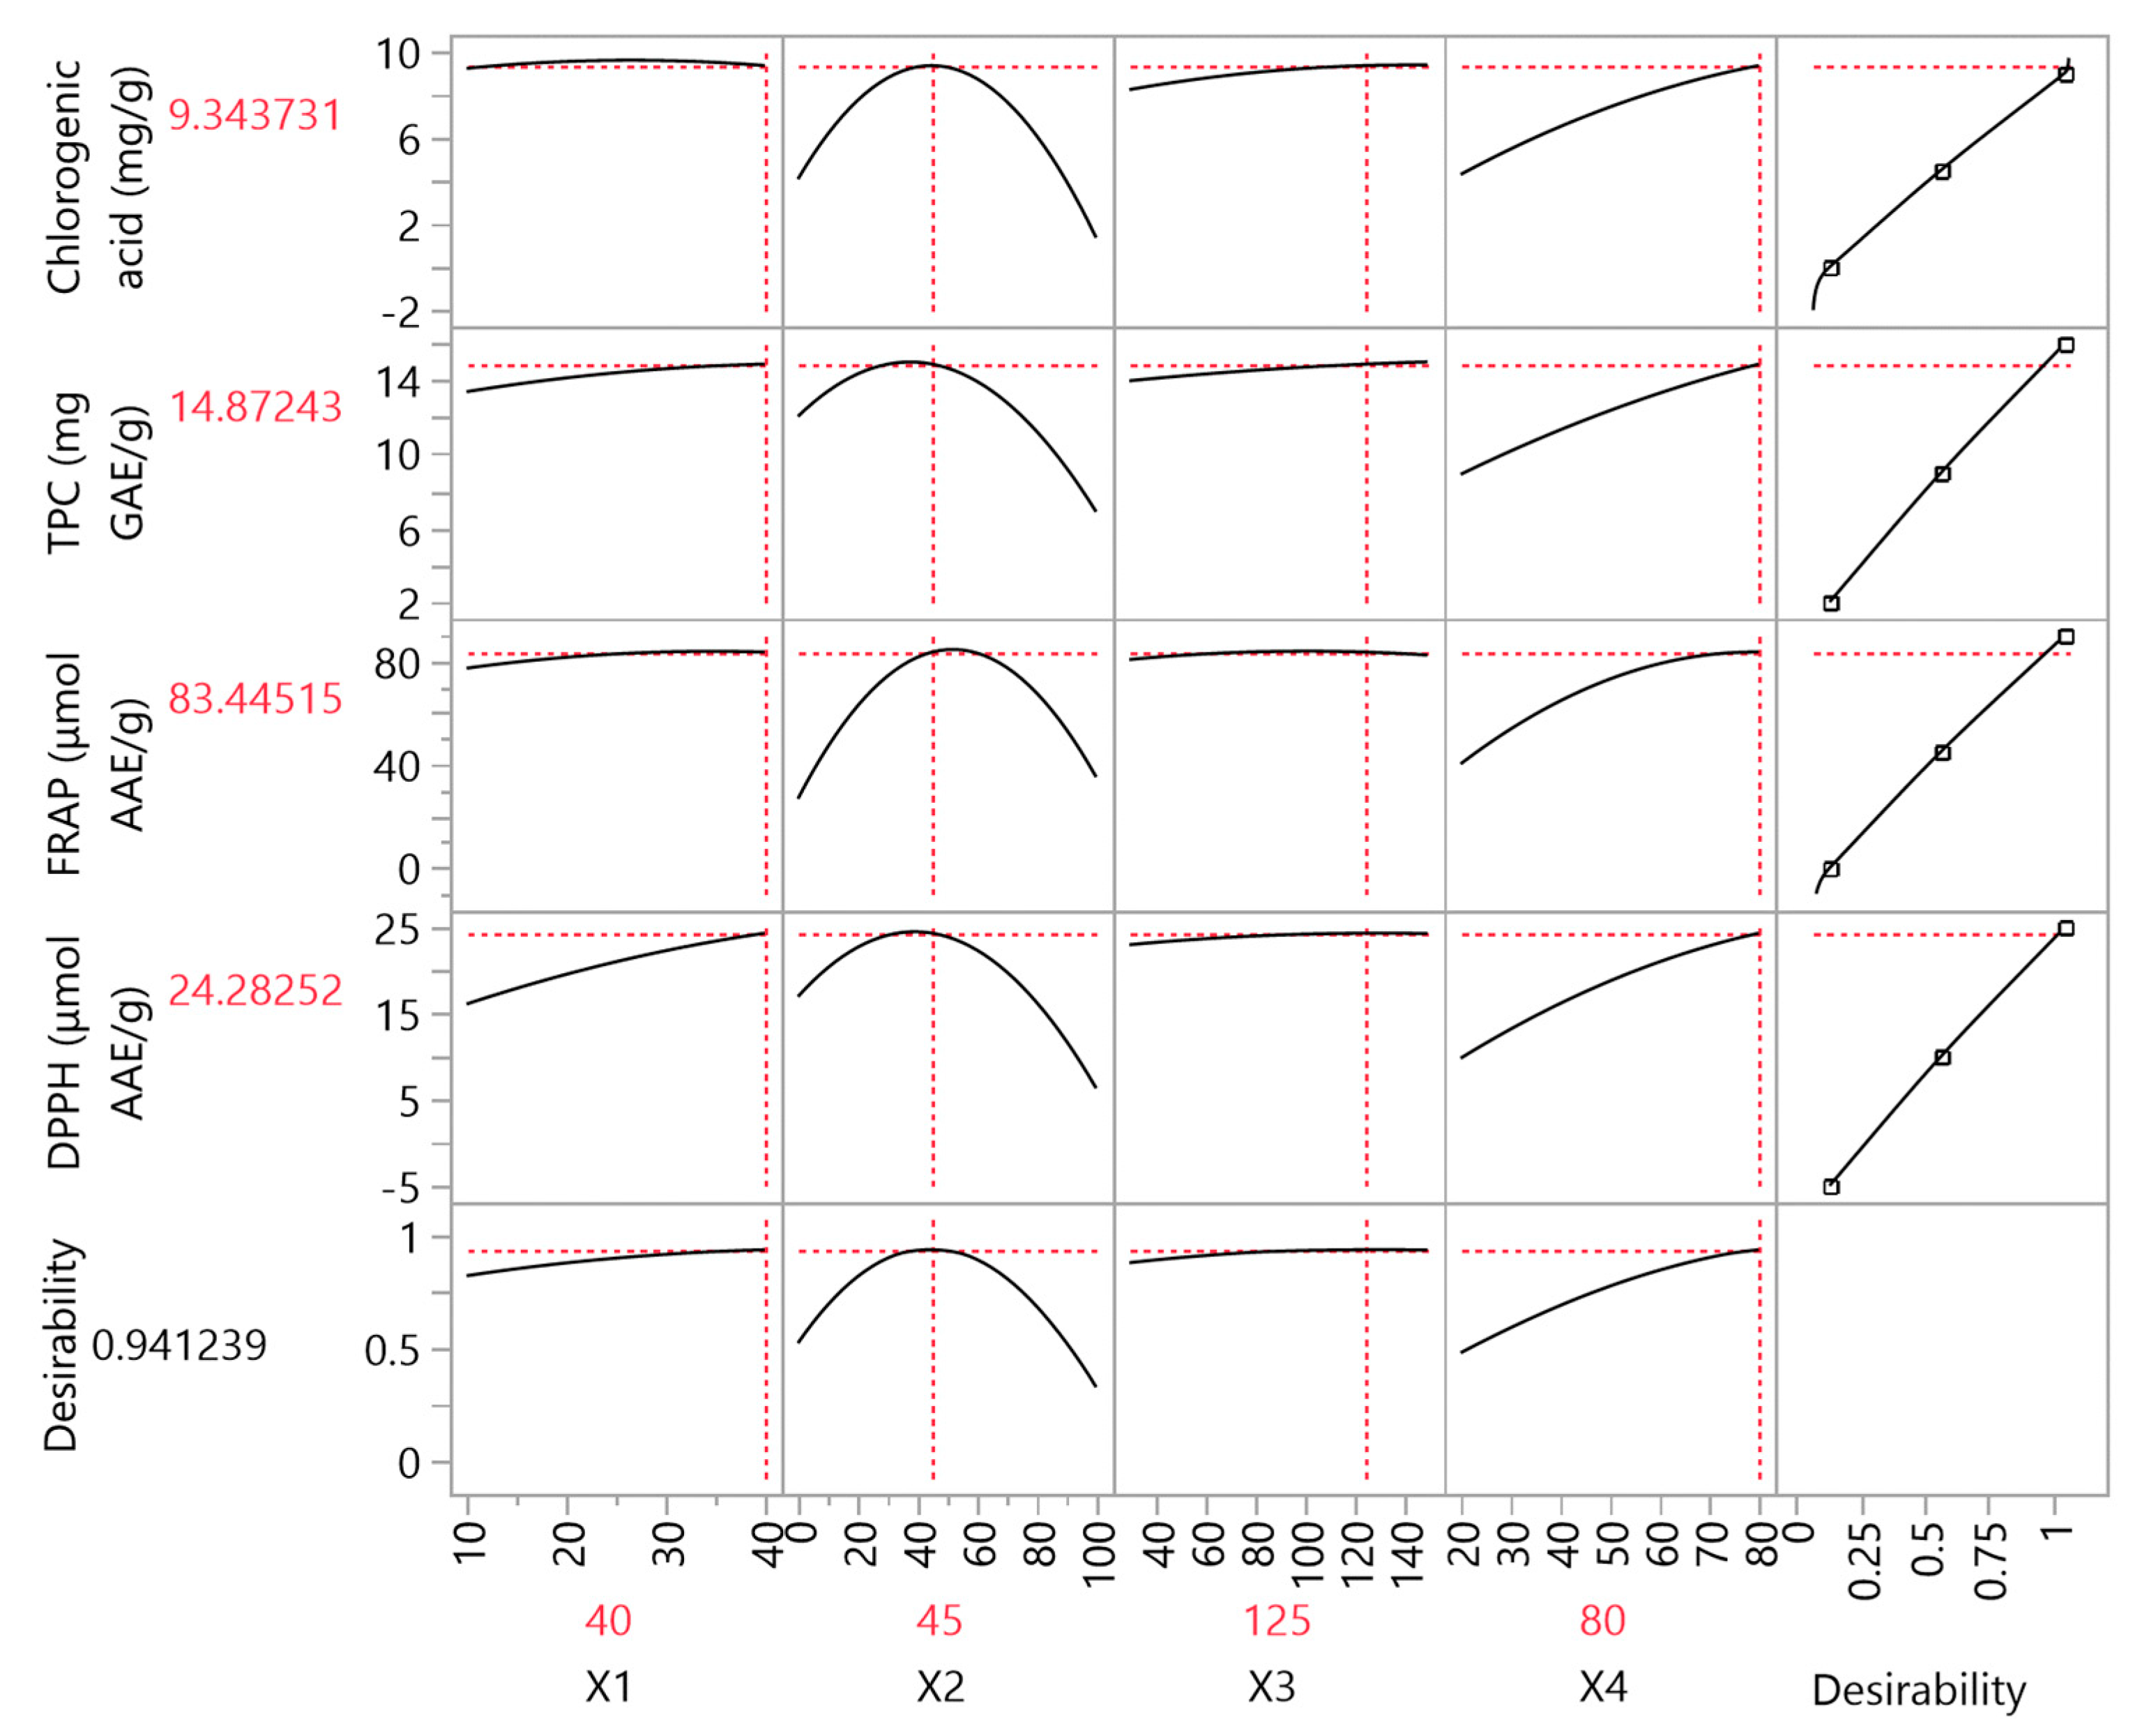
Figure 7.
Partial least squares (PLS) prediction profiler of each variable and desirability function with extrapolation control for the optimization of C. maritimum extracts.
Figure 7 illustrates the PLS prediction profiler for each variable and the desirability function, including extrapolation control, in the optimization of C. maritimum extract under different extraction conditions. The concentration of the solvent (X2) and the extraction temperature (X4) emerged as more important than other factors in the extraction of bioactive compounds. A moderate concentration of ethanol content (45%) resulting in medium polarity of the extraction solvent produced the best results for most compounds. A high temperature (80 °C) was also required for the efficient polyphenol recovery. The impact of the liquid-to-solid ratio and extraction time (factors X1 and X3, respectively) on the recovery of polyphenols was determined to be insignificant. Table 6 presents a summary of the optimized extraction conditions for C. maritimum plant. The experimental values obtained were observed to exhibit a strong correlation with the values predicted by the PLS model.
To maximize the experimental values, the optimum conditions were chosen for the extraction process. It included 40 mL/g, 45% v/v ethanol, 125 min of extraction, and 80 °C. Table 7 presents the measured polyphenols and the measured antioxidant activity of the extract obtained when employing optimal extraction conditions. When the values from the PLS model were compared to those from the experimental analysis, the correlation was found to be 0.9999, and there are no deviations with a p-value of 0.0001.
Table 7.
Maximum desirability for all variables using the partial least squares (PLS) prediction profiler under the optimal extraction conditions (X1:40, X2:45, X3:125, and X4:80).
Following optimization, a notable enhancement in TPC was observed, with concentrations ranging from ~5% to ~557% when compared to the RSM samples. TPC was measured at 15.11 mg GAE/g dw, whereas chlorogenic acid was measured 9.35 mg/g dw. In a study conducted by Jallali et al. [21], the polyphenol content of C. maritimum was measured and compared based on the extraction method and physiological stage of the plant with 80% v/v aqueous acetone as solvent. Within the vegetative stage, the Soxhlet extract yielded 3.68 mg GAE/g dw and the maceration method yielded 7.16 mg GAE/g. Elevated values were observed within the flowering stage, where the Soxhlet extract yielded 4.33 mg GAE/g dw and the maceration method yielded 8.27 mg GAE/g dw. All of the above values were lower than we found in this study, but this difference could be a matter of cultivar. Another study by Meot-Duros et al. [19] determined the antioxidant content of C. maritimum leaves. Plants from cliffs that were collected in winter were found to have ~10 mg GAE/g dw and ~4 mg chlorogenic acid/g dw.
Pigments and color analysis, along with polyphenolic compounds concentration, are shown in Table 8. Based on the displayed optimal extraction conditions defined by the PLS model, it is evident that the concentrations of pigments (total carotenoids and total chlorophylls) are fairly low, ranging from 0.3 to 0.6 mg/kg dw. This outcome is in accordance with the above results, as evidenced by the MCA plot, which indicates a negative association between total polyphenols and pigments. The L* value has an observed elevated value at 69.7, as it shows a positive correlation with the concentration of total polyphenols. The elevated lightness value has the potential to increase the feasibility of incorporating the extract into a food or cosmetic product without negatively affecting its color, thereby making it more attractive. Giungato et al. [51] studied the L* parameter in samples of C. maritimum that were exposed to air-drying process at temperatures of 40 and 60 °C, as well as freeze-drying process. The measured values of the L* parameter ranged from 41.7 to 53.6.
Table 8.
Pigments, color analysis, and polyphenolic compounds under optimal extraction conditions.
The concentration of other polyphenolic compounds in the leaves of C. maritimum is influenced by the collection period of the sample, as previously mentioned, as well as by the plant cultivars, which also has a significant impact. Generalić Mekinić et al. [35] observed that the concentration of caffeic acid varied between 0.1 and 0.2 mg/g dw, which is similar to our results. The highest concentration was detected in a sample collected in April, while the lowest concentration was observed when the sample was collected in August. A study conducted by Souid et al. [18] investigated the nutraceutical potential of C. maritimum hydroethanolic leaves extract. Regarding the flavonoids naringin and rutin, major variations in their concentration were observed in comparison to our study. Naringin was measured at 1.24 mg/g dw and rutin at 0.15 mg/g, whereas in the above study, they were measured 0.14 mg/g dw and 1.75 mg/g dw via LC-ESI-MS, respectively. Martins-Noguerol et al. [40] observed differences in the chemical composition of several C. maritimum cultivars (El Toyo, Los Muertos, Calblanque, Roche under field conditions, and Roche under optimal conditions). Ferulic acid ranged from 0.2 to 0.4 mg/g dw, a range similar to our results (0.26 mg/g dw). In the same study, kaempferol 3-glycoside was among the major polyphenols alongside chlorogenic acid and was identified only in the Roche (optimal) sample at 1.6 mg/g dw, 12.5% lower than our results. Apart from antioxidant activity, the main polyphenol chlorogenic acid has shown antidiabetic, anti-hypertension, and antimicrobial properties [52], whereas naringin and kaempferol have been associated with anti-inflammatory and anti-cancer activity [53].
4. Conclusions
This study aimed to comprehensively investigate and optimize different conditions in order to determine the most efficient extraction scheme by which to recover bioactive components from C. maritimum leaves. The use of RSM enabled the appropriate modification of extraction conditions, whilst PLS analysis revealed the conditions that had significant impact on the extraction process. Extraction solvent and temperature were more influential on the overall efficacy of the extraction procedure. The utilization of aqueous ethanol solution with moderate polarity as a solvent enhanced the extraction efficiency. In addition, this efficiency was shown to be increased with increasing temperature. Overall, a combination of moderate ethanol concentration (45% v/v) with high liquid-to-solid ratio (40:1), extraction time (145 min), and temperature (80 °C) were found optimum. Furthermore, the findings of this study indicated a strong negative correlation between total carotenoids and chlorophylls with total polyphenol content, as proven through the use of MCA and PCA. Our study provides significant findings regarding the potential of C. maritimum as a promising source of bioactive compounds in food and pharmaceutical sectors.
Supplementary Materials
The following supporting information can be downloaded at: https://www.mdpi.com/article/10.3390/compounds3040038/s1. Figures S1–S4 comprise plots that illustrate the comparison between the actual response and the predicted response for each parameter under examination, accompanied by the desirability functions. Figures S5–S7 present three-dimensional response plots for the remaining responses.
Author Contributions
Conceptualization, T.C., V.A. and S.I.L.; methodology, V.A. and T.C.; software, V.A.; validation, T.C., I.M. and V.A.; formal analysis, I.M., E.B., V.A. and T.C.; investigation, I.M. and E.B.; resources, S.I.L.; data curation, I.M. and E.B.; writing—original draft preparation, I.M., V.A., D.K. and T.C.; writing—review and editing, V.A., T.C., I.M., D.K., E.B. and S.I.L.; visualization, V.A.; supervision, S.I.L.; project administration, S.I.L. All authors have read and agreed to the published version of the manuscript.
Funding
This research received no external funding.
Data Availability Statement
All related data and methods are presented in this paper. Additional inquiries should be addressed to the corresponding author.
Conflicts of Interest
The authors declare no conflict of interest.
References
- Lokhande, V.H.; Suprasanna, P. Prospects of Halophytes in Understanding and Managing Abiotic Stress Tolerance. In Environmental Adaptations and Stress Tolerance of Plants in the Era of Climate Change; Ahmad, P., Prasad, M.N.V., Eds.; Springer: New York, NY, USA, 2012; pp. 29–56. ISBN 978-1-4614-0815-4. [Google Scholar]
- Agudelo, A.; Carvajal, M.; del Carmen Martinez-Ballesta, M. Halophytes of the Mediterranean Basin—Underutilized Species with the Potential to Be Nutritious Crops in the Scenario of the Climate Change. Foods 2021, 10, 119. [Google Scholar] [CrossRef]
- Shaer, H.; Attia-Ismail, S. Halophytic and Salt Tolerant Feedstuffs in the Mediterranean Basin and Arab Region: An Overview; CRC Press; Taylor & Francis Group: Boca Raton, FL, USA, 2015; pp. 21–36. ISBN 978-1-4987-0921-7. [Google Scholar]
- Martins-Noguerol, R.; Matías, L.; Pérez-Ramos, I.M.; Moreira, X.; Francisco, M.; Pedroche, J.; DeAndrés-Gil, C.; Gutiérrez, E.; Salas, J.J.; Moreno-Pérez, A.J.; et al. Soil Physicochemical Properties Associated with the Yield and Phytochemical Composition of the Edible Halophyte Crithmum maritimum. Sci. Total Environ. 2023, 869, 161806. [Google Scholar] [CrossRef]
- Marongiu, B.; Maxia, A.; Piras, A.; Porcedda, S.; Tuveri, E.; Gonçalves, M.J.; Cavaleiro, C.; Salgueiro, L. Isolation of Crithmum maritimum L. Volatile Oil by Supercritical Carbon Dioxide Extraction and Biological Assays. Nat. Prod. Res. 2007, 21, 1145–1150. [Google Scholar] [CrossRef] [PubMed]
- Accogli, R.; Tomaselli, V.; Direnzo, P.; Perrino, E.V.; Albanese, G.; Urbano, M.; Laghetti, G. Edible Halophytes and Halo-Tolerant Species in Apulia Region (Southeastern Italy): Biogeography, Traditional Food Use and Potential Sustainable Crops. Plants 2023, 12, 549. [Google Scholar] [CrossRef] [PubMed]
- Vekiari, S.; Ouzounidou, G. An Overview of the Wild Plants Consumed in the Island of Crete, Greece. In Global Perspectives on Underutilized Crops; Ozturk, M., Hakeem, K.R., Ashraf, M., Ahmad, M.S.A., Eds.; Springer International Publishing: Cham, Switzerland, 2018; pp. 259–285. ISBN 978-3-319-77776-4. [Google Scholar]
- Petropoulos, S.A.; Karkanis, A.; Martins, N.; Ferreira, I.C.F.R. Edible Halophytes of the Mediterranean Basin: Potential Candidates for Novel Food Products. Trends Food Sci. Technol. 2018, 74, 69–84. [Google Scholar] [CrossRef]
- Pavela, R.; Maggi, F.; Lupidi, G.; Cianfaglione, K.; Dauvergne, X.; Bruno, M.; Benelli, G. Efficacy of Sea Fennel (Crithmum maritimum L., Apiaceae) Essential Oils against Culex quinquefasciatus Say and Spodoptera littoralis (Boisd.). Ind. Crops Prod. 2017, 109, 603–610. [Google Scholar] [CrossRef]
- Martins-Noguerol, R.; Pérez-Ramos, I.M.; Matías, L.; Moreira, X.; Francisco, M.; García-González, A.; Troncoso-Ponce, A.M.; Thomasset, B.; Martínez-Force, E.; Moreno-Pérez, A.J. Crithmum maritimum Seeds, a Potential Source for High-Quality Oil and Phenolic Compounds in Soils with No Agronomical Relevance. J. Food Compos. Anal. 2022, 108, 104413. [Google Scholar] [CrossRef]
- Sousa, G.; Alves, M.I.; Neves, M.; Tecelão, C.; Ferreira-Dias, S. Enrichment of Sunflower Oil with Ultrasound-Assisted Extracted Bioactive Compounds from Crithmum maritimum L. Foods 2022, 11, 439. [Google Scholar] [CrossRef] [PubMed]
- Nabet, N.; Boudries, H.; Chougui, N.; Loupassaki, S.; Souagui, S.; Burló, F.; Hernández, F.; Carbonell-Barrachina, Á.A.; Madani, K.; Larbat, R. Biological Activities and Secondary Compound Composition from Crithmum maritimum Aerial Parts. Int. J. Food Prop. 2017, 20, 1843–1855. [Google Scholar] [CrossRef]
- Lorenzo, J.M.; Mousavi Khaneghah, A.; Gavahian, M.; Marszałek, K.; Eş, I.; Munekata, P.E.S.; Ferreira, I.C.F.R.; Barba, F.J. Understanding the Potential Benefits of Thyme and Its Derived Products for Food Industry and Consumer Health: From Extraction of Value-Added Compounds to the Evaluation of Bioaccessibility, Bioavailability, Anti-Inflammatory, and Antimicrobial Activities. Crit. Rev. Food Sci. Nutr. 2019, 59, 2879–2895. [Google Scholar] [CrossRef]
- Sharma, P.; Vishvakarma, R.; Gautam, K.; Vimal, A.; Kumar Gaur, V.; Farooqui, A.; Varjani, S.; Younis, K. Valorization of Citrus Peel Waste for the Sustainable Production of Value-Added Products. Bioresour. Technol. 2022, 351, 127064. [Google Scholar] [CrossRef] [PubMed]
- Brewer, M.S. Natural Antioxidants: Sources, Compounds, Mechanisms of Action, and Potential Applications. Compr. Rev. Food Sci. Food Saf. 2011, 10, 221–247. [Google Scholar] [CrossRef]
- Daglia, M. Polyphenols as Antimicrobial Agents. Curr. Opin. Biotechnol. 2012, 23, 174–181. [Google Scholar] [CrossRef]
- Delgado Adámez, J.; Gamero Samino, E.; Valdés Sánchez, E.; González-Gómez, D. In Vitro Estimation of the Antibacterial Activity and Antioxidant Capacity of Aqueous Extracts from Grape-Seeds (Vitis vinifera L.). Food Control 2012, 24, 136–141. [Google Scholar] [CrossRef]
- Souid, A.; Della Croce, C.M.; Frassinetti, S.; Gabriele, M.; Pozzo, L.; Ciardi, M.; Abdelly, C.; Hamed, K.B.; Magné, C.; Longo, V. Nutraceutical Potential of Leaf Hydro-Ethanolic Extract of the Edible Halophyte Crithmum maritimum L. Molecules 2021, 26, 5380. [Google Scholar] [CrossRef] [PubMed]
- Meot-Duros, L.; Magné, C. Antioxidant Activity and Phenol Content of Crithmum maritimum L. Leaves. Plant Physiol. Biochem. 2009, 47, 37–41. [Google Scholar] [CrossRef]
- Veršić Bratinčević, M.; Kovačić, R.; Popović, M.; Radman, S.; Generalić Mekinić, I. Comparison of Conventional and Green Extraction Techniques for the Isolation of Phenolic Antioxidants from Sea Fennel. Processes 2023, 11, 2172. [Google Scholar] [CrossRef]
- Jallali, I.; Megdiche, W.; M’Hamdi, B.; Oueslati, S.; Smaoui, A.; Abdelly, C.; Ksouri, R. Changes in Phenolic Composition and Antioxidant Activities of the Edible Halophyte Crithmum maritimum L. with Physiological Stage and Extraction Method. Acta Physiol. Plant. 2012, 34, 1451–1459. [Google Scholar] [CrossRef]
- Makrygiannis, I.; Athanasiadis, V.; Bozinou, E.; Chatzimitakos, T.; Makris, D.P.; Lalas, S.I. Combined Effects of Deep Eutectic Solvents and Pulsed Electric Field Improve Polyphenol-Rich Extracts from Apricot Kernel Biomass. Biomass 2023, 3, 66–77. [Google Scholar] [CrossRef]
- Athanasiadis, V.; Chatzimitakos, T.; Kotsou, K.; Palaiogiannis, D.; Bozinou, E.; Lalas, S.I. Optimization of the Extraction Parameters for the Isolation of Bioactive Compounds from Orange Peel Waste. Sustainability 2022, 14, 13926. [Google Scholar] [CrossRef]
- Chatzimitakos, T.; Athanasiadis, V.; Kotsou, K.; Bozinou, E.; Lalas, S.I. Response Surface Optimization for the Enhancement of the Extraction of Bioactive Compounds from Citrus limon Peel. Antioxidants 2023, 12, 1605. [Google Scholar] [CrossRef] [PubMed]
- Ayour, J.; Alahyane, A.; Harrak, H.; Neffa, M.; Taourirte, M.; Benichou, M. Assessment of Nutritional, Technological, and Commercial Apricot Quality Criteria of the Moroccan Cultivar “Maoui” Compared to Introduced Spanish Cultivars “Canino” and “Delpatriarca” towards Suitable Valorization. J. Food Qual. 2021, 2021, e6679128. [Google Scholar] [CrossRef]
- Gregor, J.; Maršálek, B. Freshwater Phytoplankton Quantification by Chlorophyll a: A Comparative Study of In Vitro, In Vivo and In Situ Methods. Water Res. 2004, 38, 517–522. [Google Scholar] [CrossRef]
- Cesa, S.; Carradori, S.; Bellagamba, G.; Locatelli, M.; Casadei, M.A.; Masci, A.; Paolicelli, P. Evaluation of Processing Effects on Anthocyanin Content and Colour Modifications of Blueberry (Vaccinium spp.) Extracts: Comparison between HPLC-DAD and CIELAB Analyses. Food Chem. 2017, 232, 114–123. [Google Scholar] [CrossRef]
- Chatzimitakos, T.; Athanasiadis, V.; Kotsou, K.; Palaiogiannis, D.; Bozinou, E.; Lalas, S.I. Optimized Isolation Procedure for the Extraction of Bioactive Compounds from Spent Coffee Grounds. Appl. Sci. 2023, 13, 2819. [Google Scholar] [CrossRef]
- Sultana, H.; Chetia, A.; Saikia, A.; Khan, N. An Updated Review on Extraction, Isolation, and Identification of Bioactive Compounds from Plant Extracts. Sch. Acad. J. Pharm. 2023, 12, 2320–4206. [Google Scholar] [CrossRef]
- Fadjare Frempong, T.; Owusu Boadi, N.; Badu, M. Optimization of Extraction Conditions for Polyphenols from the Stem Bark of Funtumia elastica (Funtum) Utilizing Response Surface Methodology. AAS Open Res. 2021, 4, 46. [Google Scholar] [CrossRef] [PubMed]
- Zhumakanova, B.S.; Korona-Głowniak, I.; Skalicka-Woźniak, K.; Ludwiczuk, A.; Baj, T.; Wojtanowski, K.K.; Józefczyk, A.; Zhaparkulova, K.A.; Sakipova, Z.B.; Malm, A. Phytochemical Fingerprinting and In Vitro Antimicrobial and Antioxidant Activity of the Aerial Parts of Thymus marschallianus Willd. and Thymus seravschanicus Klokov Growing Widely in Southern Kazakhstan. Molecules 2021, 26, 3193. [Google Scholar] [CrossRef]
- Bonifácio-Lopes, T.; Vilas-Boas, A.; Machado, M.; Costa, E.M.; Silva, S.; Pereira, R.N.; Campos, D.; Teixeira, J.A.; Pintado, M. Exploring the Bioactive Potential of Brewers Spent Grain Ohmic Extracts. Innov. Food Sci. Emerg. Technol. 2022, 76, 102943. [Google Scholar] [CrossRef]
- Cicci, A.; Bravi, M. Chapter 14—Leveraging Novel Green Solvents to Drive Conceptual and Practical Biorefinery Innovation. In Studies in Surface Science and Catalysis; Basile, A., Centi, G., Falco, M.D., Iaquaniello, G., Eds.; Catalysis, Green Chemistry and Sustainable Energy; Elsevier: Amsterdam, The Netherlands, 2020; Volume 179, pp. 243–259. [Google Scholar]
- Jallali, I.; Zaouali, Y.; Missaoui, I.; Smeoui, A.; Abdelly, C.; Ksouri, R. Variability of Antioxidant and Antibacterial Effects of Essential Oils and Acetonic Extracts of Two Edible Halophytes: Crithmum maritimum L. and Inula crithmoїdes L. Food Chem. 2014, 145, 1031–1038. [Google Scholar] [CrossRef]
- Generalić Mekinić, I.; Šimat, V.; Ljubenkov, I.; Burčul, F.; Grga, M.; Mihajlovski, M.; Lončar, R.; Katalinić, V.; Skroza, D. Influence of the Vegetation Period on Sea Fennel, Crithmum maritimum L. (Apiaceae), Phenolic Composition, Antioxidant and Anticholinesterase Activities. Ind. Crops Prod. 2018, 124, 947–953. [Google Scholar] [CrossRef]
- Shin, L.E.R.; Zzaman, W.; Kuang, Y.T.; Bhat, R. Influence of Dehydration Techniques on Physicochemical, Antioxidant and Microbial Qualities of Ipomoea aquatica Forsk.: An Underutilized Green Leafy Vegetable. J. Food Process. Preserv. 2015, 39, 1118–1124. [Google Scholar] [CrossRef]
- Sarrou, E.; Siomos, A.S.; Riccadona, S.; Aktsoglou, D.-C.; Tsouvaltzis, P.; Angeli, A.; Franceschi, P.; Chatzopoulou, P.; Vrhovsek, U.; Martens, S. Improvement of Sea Fennel (Crithmum maritimum L.) Nutritional Value through Iodine Biofortification in a Hydroponic Floating System. Food Chem. 2019, 296, 150–159. [Google Scholar] [CrossRef]
- Renna, M.; Gonnella, M.; Caretto, S.; Mita, G.; Serio, F. Sea Fennel (Crithmum maritimum L.): From Underutilized Crop to New Dried Product for Food Use. Genet. Resour. Crop Evol. 2017, 64, 205–216. [Google Scholar] [CrossRef]
- Labiad, M.H.; Giménez, A.; Varol, H.; Tüzel, Y.; Egea-Gilabert, C.; Fernández, J.A.; Martínez-Ballesta, M. del C. Effect of Exogenously Applied Methyl Jasmonate on Yield and Quality of Salt-Stressed Hydroponically Grown Sea Fennel (Crithmum maritimum L.). Agronomy 2021, 11, 1083. [Google Scholar] [CrossRef]
- Martins-Noguerol, R.; Matías, L.; Pérez-Ramos, I.M.; Moreira, X.; Muñoz-Vallés, S.; Mancilla-Leytón, J.M.; Francisco, M.; García-González, A.; DeAndrés-Gil, C.; Martínez-Force, E.; et al. Differences in Nutrient Composition of Sea Fennel (Crithmum maritimum) Grown in Different Habitats and Optimally Controlled Growing Conditions. J. Food Compos. Anal. 2022, 106, 104266. [Google Scholar] [CrossRef]
- Spigno, G.; Tramelli, L.; De Faveri, D.M. Effects of Extraction Time, Temperature and Solvent on Concentration and Antioxidant Activity of Grape Marc Phenolics. J. Food Eng. 2007, 81, 200–208. [Google Scholar] [CrossRef]
- Sridhar, A.; Ponnuchamy, M.; Kumar, P.S.; Kapoor, A.; Vo, D.-V.N.; Prabhakar, S. Techniques and Modeling of Polyphenol Extraction from Food: A Review. Environ. Chem. Lett. 2021, 19, 3409–3443. [Google Scholar] [CrossRef]
- Yilmaz, Y.; Toledo, R.T. Oxygen Radical Absorbance Capacities of Grape/Wine Industry Byproducts and Effect of Solvent Type on Extraction of Grape Seed Polyphenols. J. Food Compos. Anal. 2006, 19, 41–48. [Google Scholar] [CrossRef]
- Lapornik, B.; Prošek, M.; Golc Wondra, A. Comparison of Extracts Prepared from Plant By-Products Using Different Solvents and Extraction Time. J. Food Eng. 2005, 71, 214–222. [Google Scholar] [CrossRef]
- Antony, A.; Farid, M. Effect of Temperatures on Polyphenols during Extraction. Appl. Sci. 2022, 12, 2107. [Google Scholar] [CrossRef]
- Larrauri, J.A.; Sánchez-Moreno, C.; Saura-Calixto, F. Effect of Temperature on the Free Radical Scavenging Capacity of Extracts from Red and White Grape Pomace Peels. J. Agric. Food Chem. 1998, 46, 2694–2697. [Google Scholar] [CrossRef]
- Ross, C.F.; Hoye, C., Jr.; Fernandez-Plotka, V.C. Influence of Heating on the Polyphenolic Content and Antioxidant Activity of Grape Seed Flour. J. Food Sci. 2011, 76, C884–C890. [Google Scholar] [CrossRef]
- Ayour, J.; Sagar, M.; Alfeddy, M.N.; Taourirte, M.; Benichou, M. Evolution of Pigments and Their Relationship with Skin Color Based on Ripening in Fruits of Different Moroccan Genotypes of Apricots (Prunus armeniaca L.). Sci. Hortic. 2016, 207, 168–175. [Google Scholar] [CrossRef]
- Pham, H.N.T.; Tang Nguyen, V.; Van Vuong, Q.; Bowyer, M.C.; Scarlett, C.J. Bioactive Compound Yield and Antioxidant Capacity of Helicteres hirsuta Lour. Stem as Affected by Various Solvents and Drying Methods. J. Food Process. Preserv. 2017, 41, e12879. [Google Scholar] [CrossRef]
- Costa, C.; Padalino, L.; Spinelli, S.; Serio, F.; Del Nobile Matteo, A.; Conte, A. Study of the Efficacy of Two Extraction Techniques from Crithmum maritimum and Salicornia europaea. J. Food Nutr. Res. 2018, 6, 456–463. [Google Scholar] [CrossRef]
- Giungato, P.; Renna, M.; Rana, R.; Licen, S.; Barbieri, P. Characterization of Dried and Freeze-Dried Sea Fennel (Crithmum maritimum L.) Samples with Headspace Gas-Chromatography/Mass Spectrometry and Evaluation of an Electronic Nose Discrimination Potential. Food Res. Int. 2019, 115, 65–72. [Google Scholar] [CrossRef]
- Naveed, M.; Hejazi, V.; Abbas, M.; Kamboh, A.A.; Khan, G.J.; Shumzaid, M.; Ahmad, F.; Babazadeh, D.; FangFang, X.; Modarresi-Ghazani, F.; et al. Chlorogenic Acid (CGA): A Pharmacological Review and Call for Further Research. Biomed. Pharmacother. 2018, 97, 67–74. [Google Scholar] [CrossRef]
- Tripoli, E.; Guardia, M.L.; Giammanco, S.; Majo, D.D.; Giammanco, M. Citrus Flavonoids: Molecular Structure, Biological Activity and Nutritional Properties: A Review. Food Chem. 2007, 104, 466–479. [Google Scholar] [CrossRef]

Disclaimer/Publisher’s Note: The statements, opinions and data contained in all publications are solely those of the individual author(s) and contributor(s) and not of MDPI and/or the editor(s). MDPI and/or the editor(s) disclaim responsibility for any injury to people or property resulting from any ideas, methods, instructions or products referred to in the content. |
© 2023 by the authors. Licensee MDPI, Basel, Switzerland. This article is an open access article distributed under the terms and conditions of the Creative Commons Attribution (CC BY) license (https://creativecommons.org/licenses/by/4.0/).