
Glucose Oxidation Performance of Zinc Nano-Hexagons Decorated on TiO2 Nanotube Arrays


Abstract
1. Introduction
2. Experimental Methods
2.1. Titania Nanotube Arrays Fabrication
2.2. Electrodeposition of Zinc on TiO2 NTAs
2.3. Microstructure and Compositional Characterization
2.4. Electrochemical Measurements
3. Results
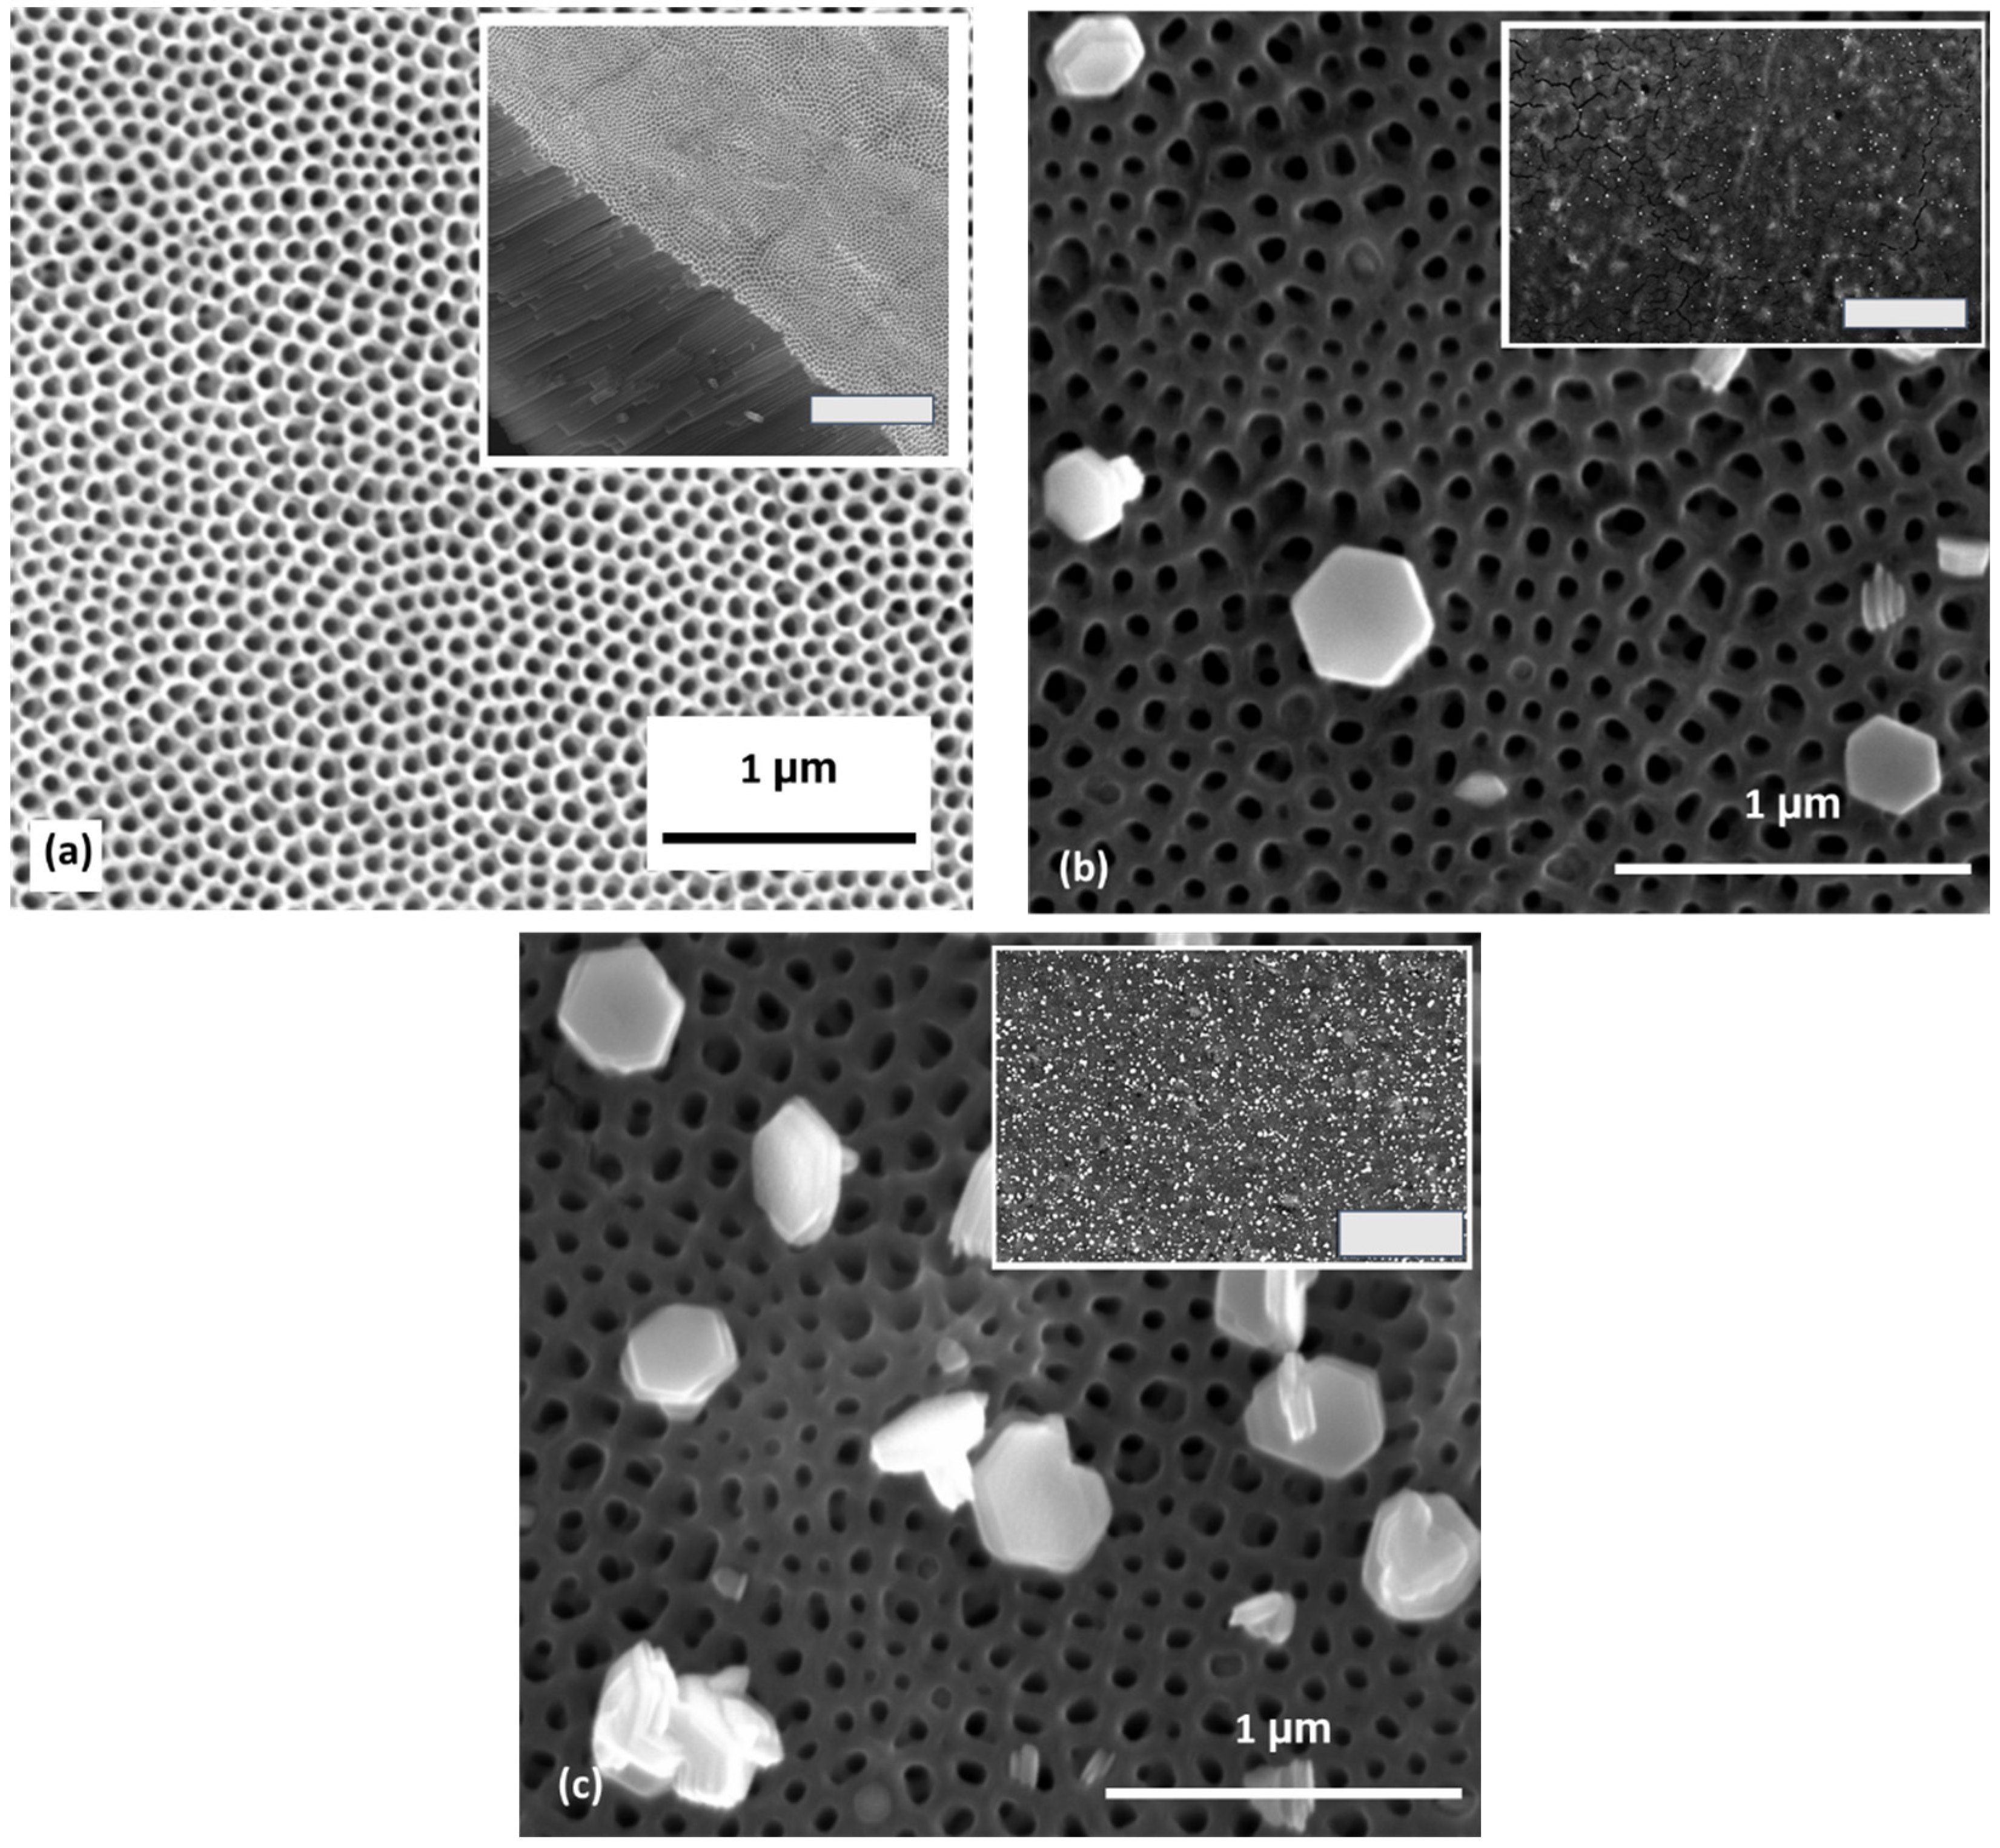
3.1. SEM Results
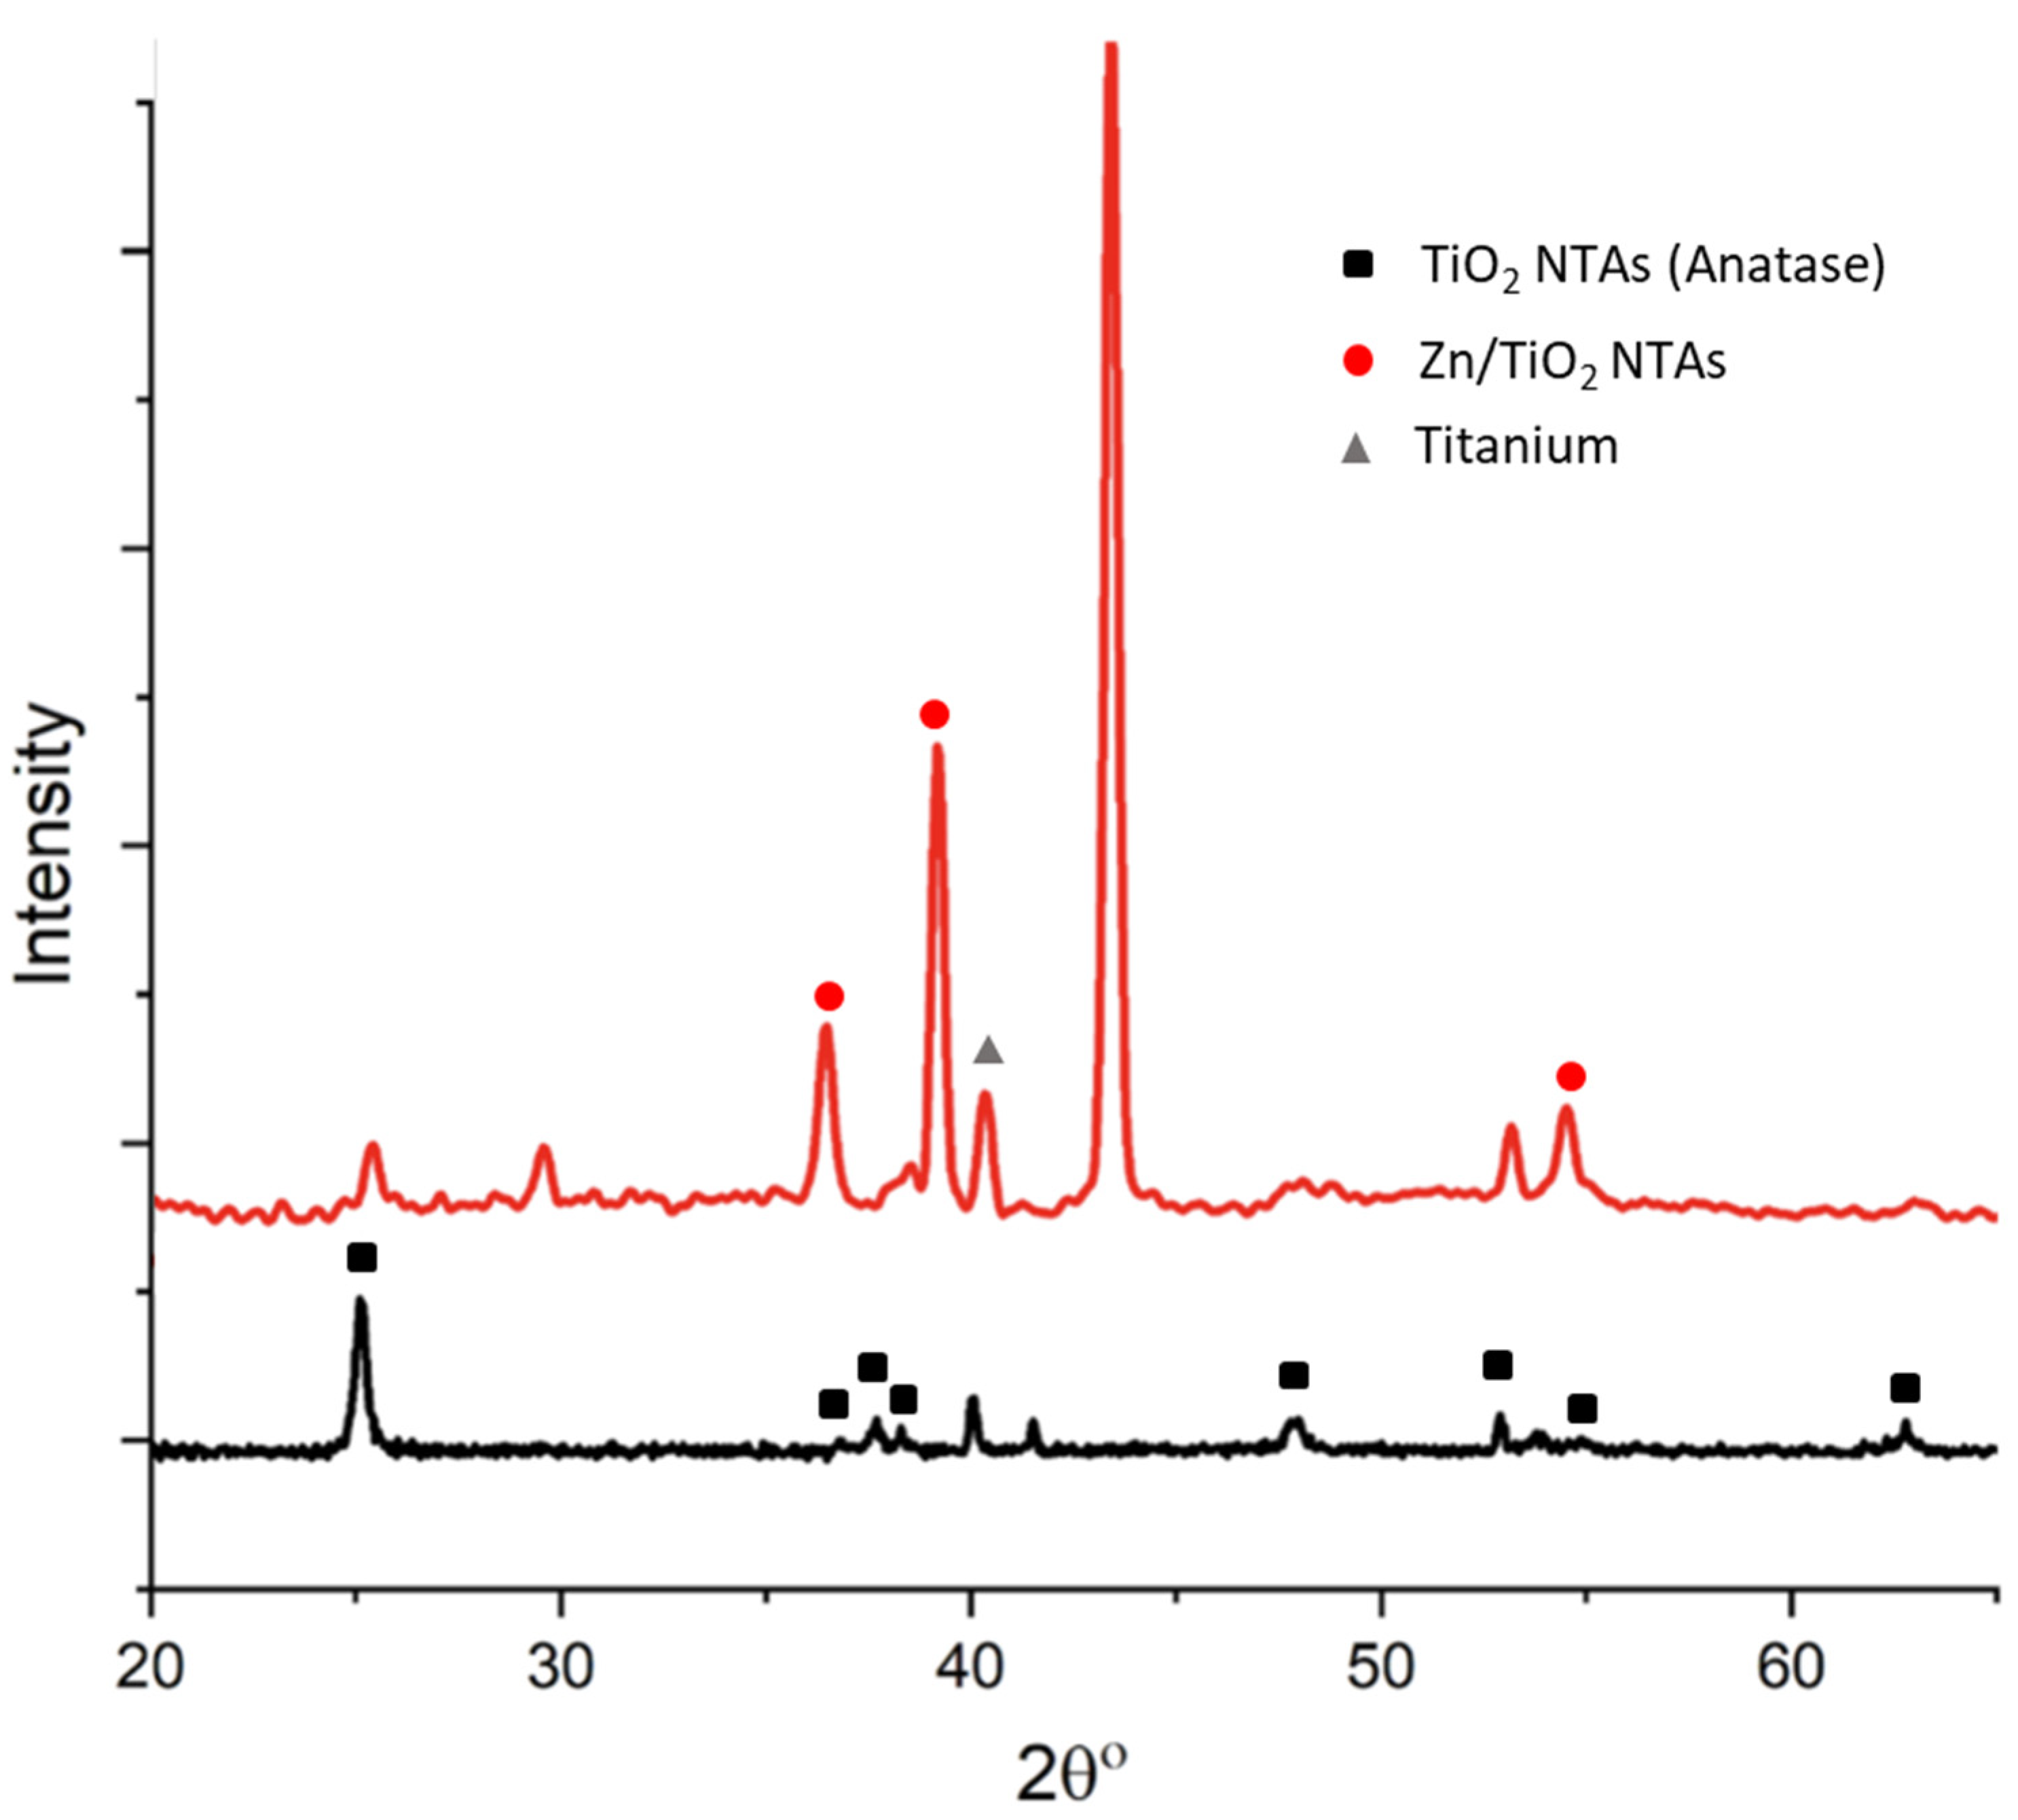
3.2. XRD Results
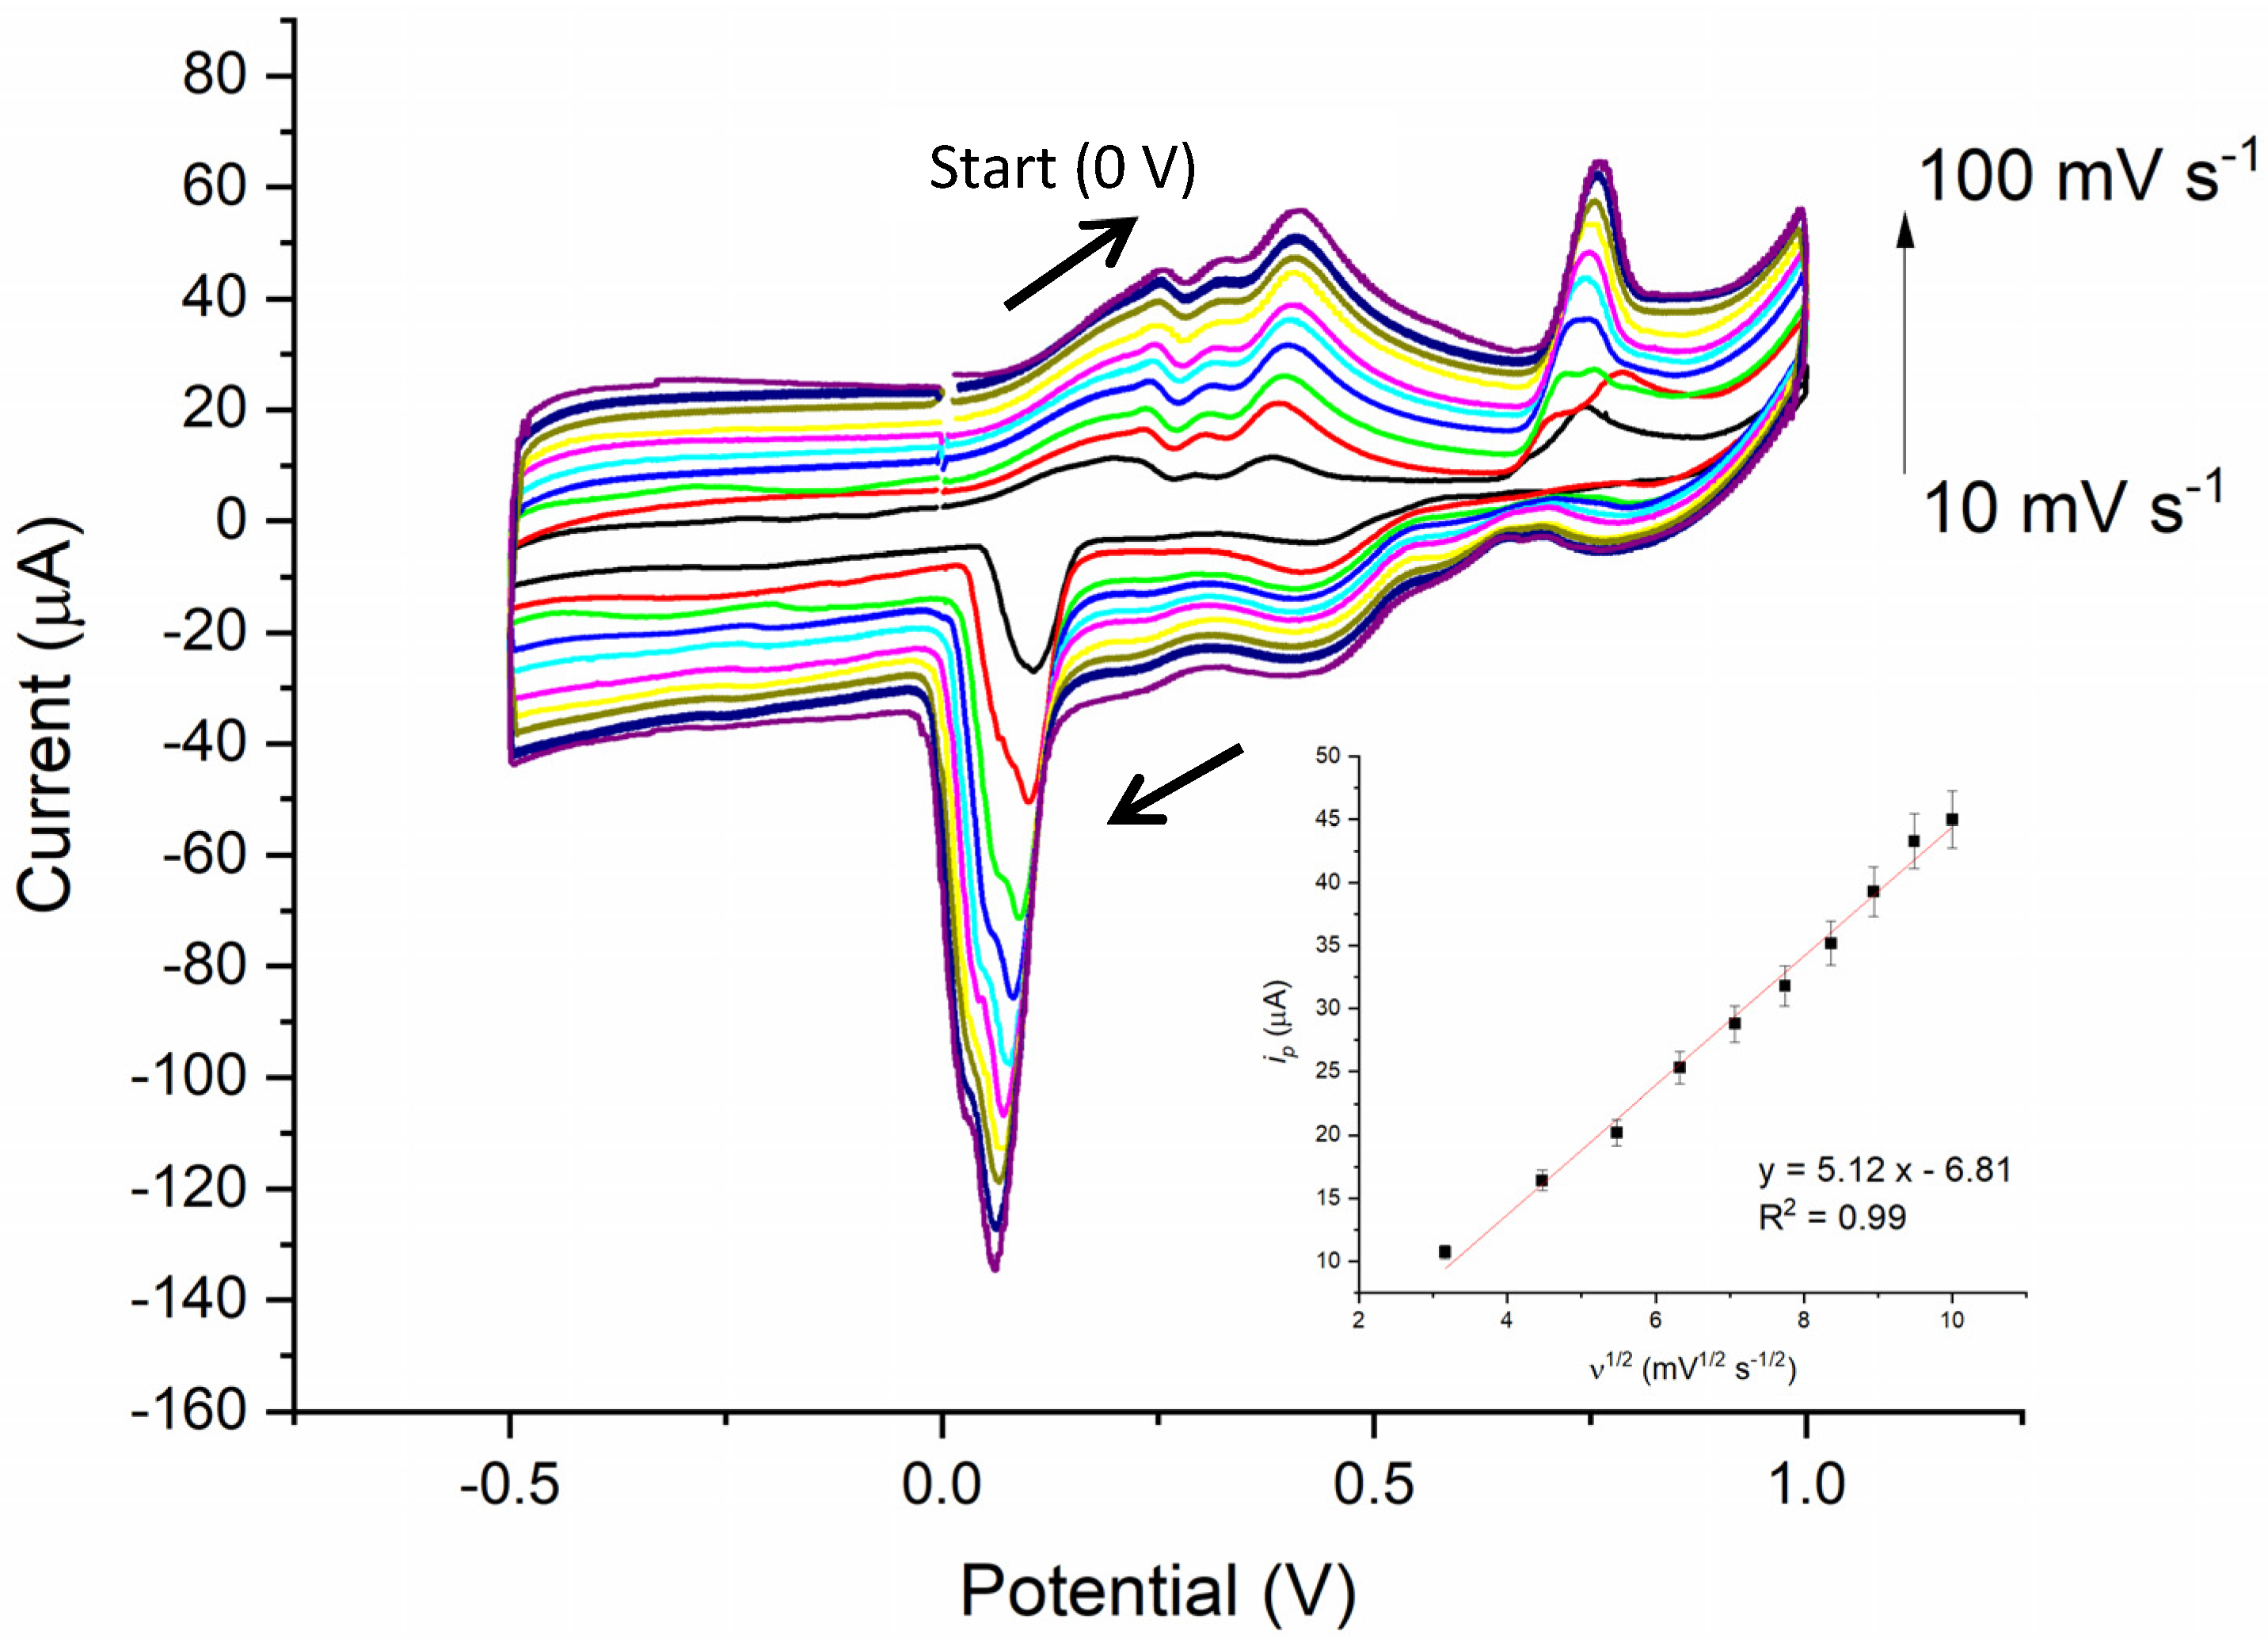
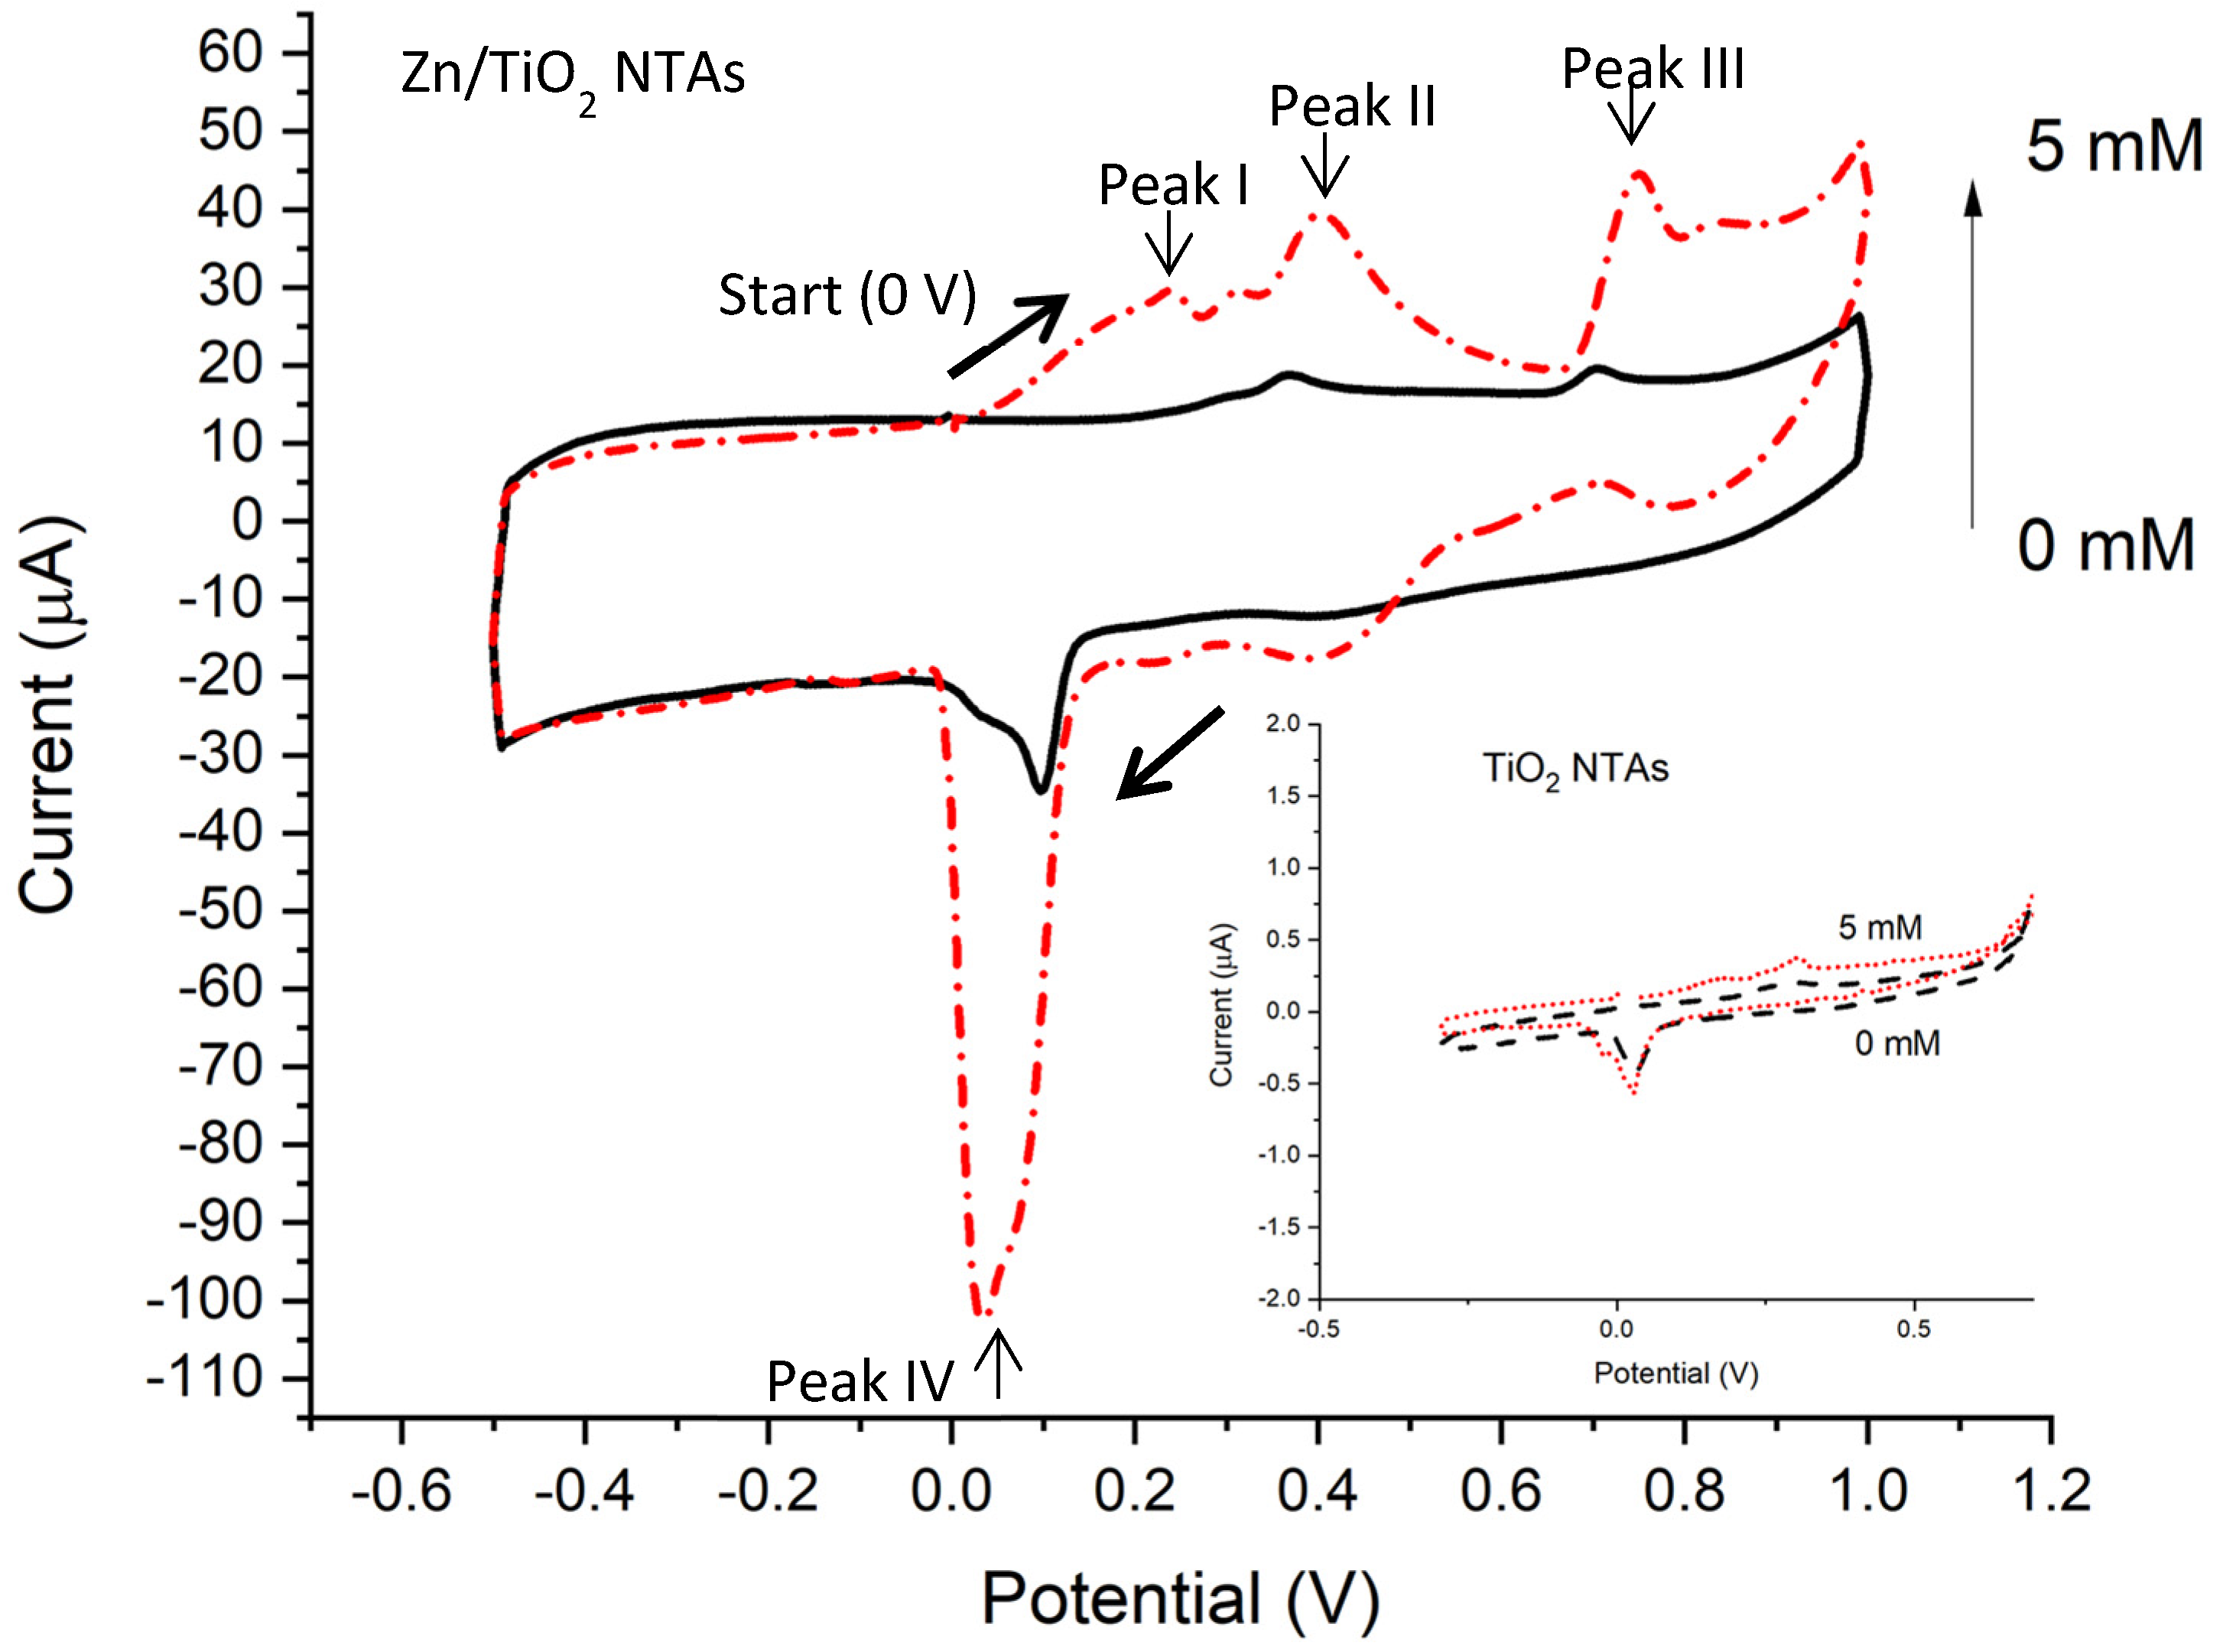
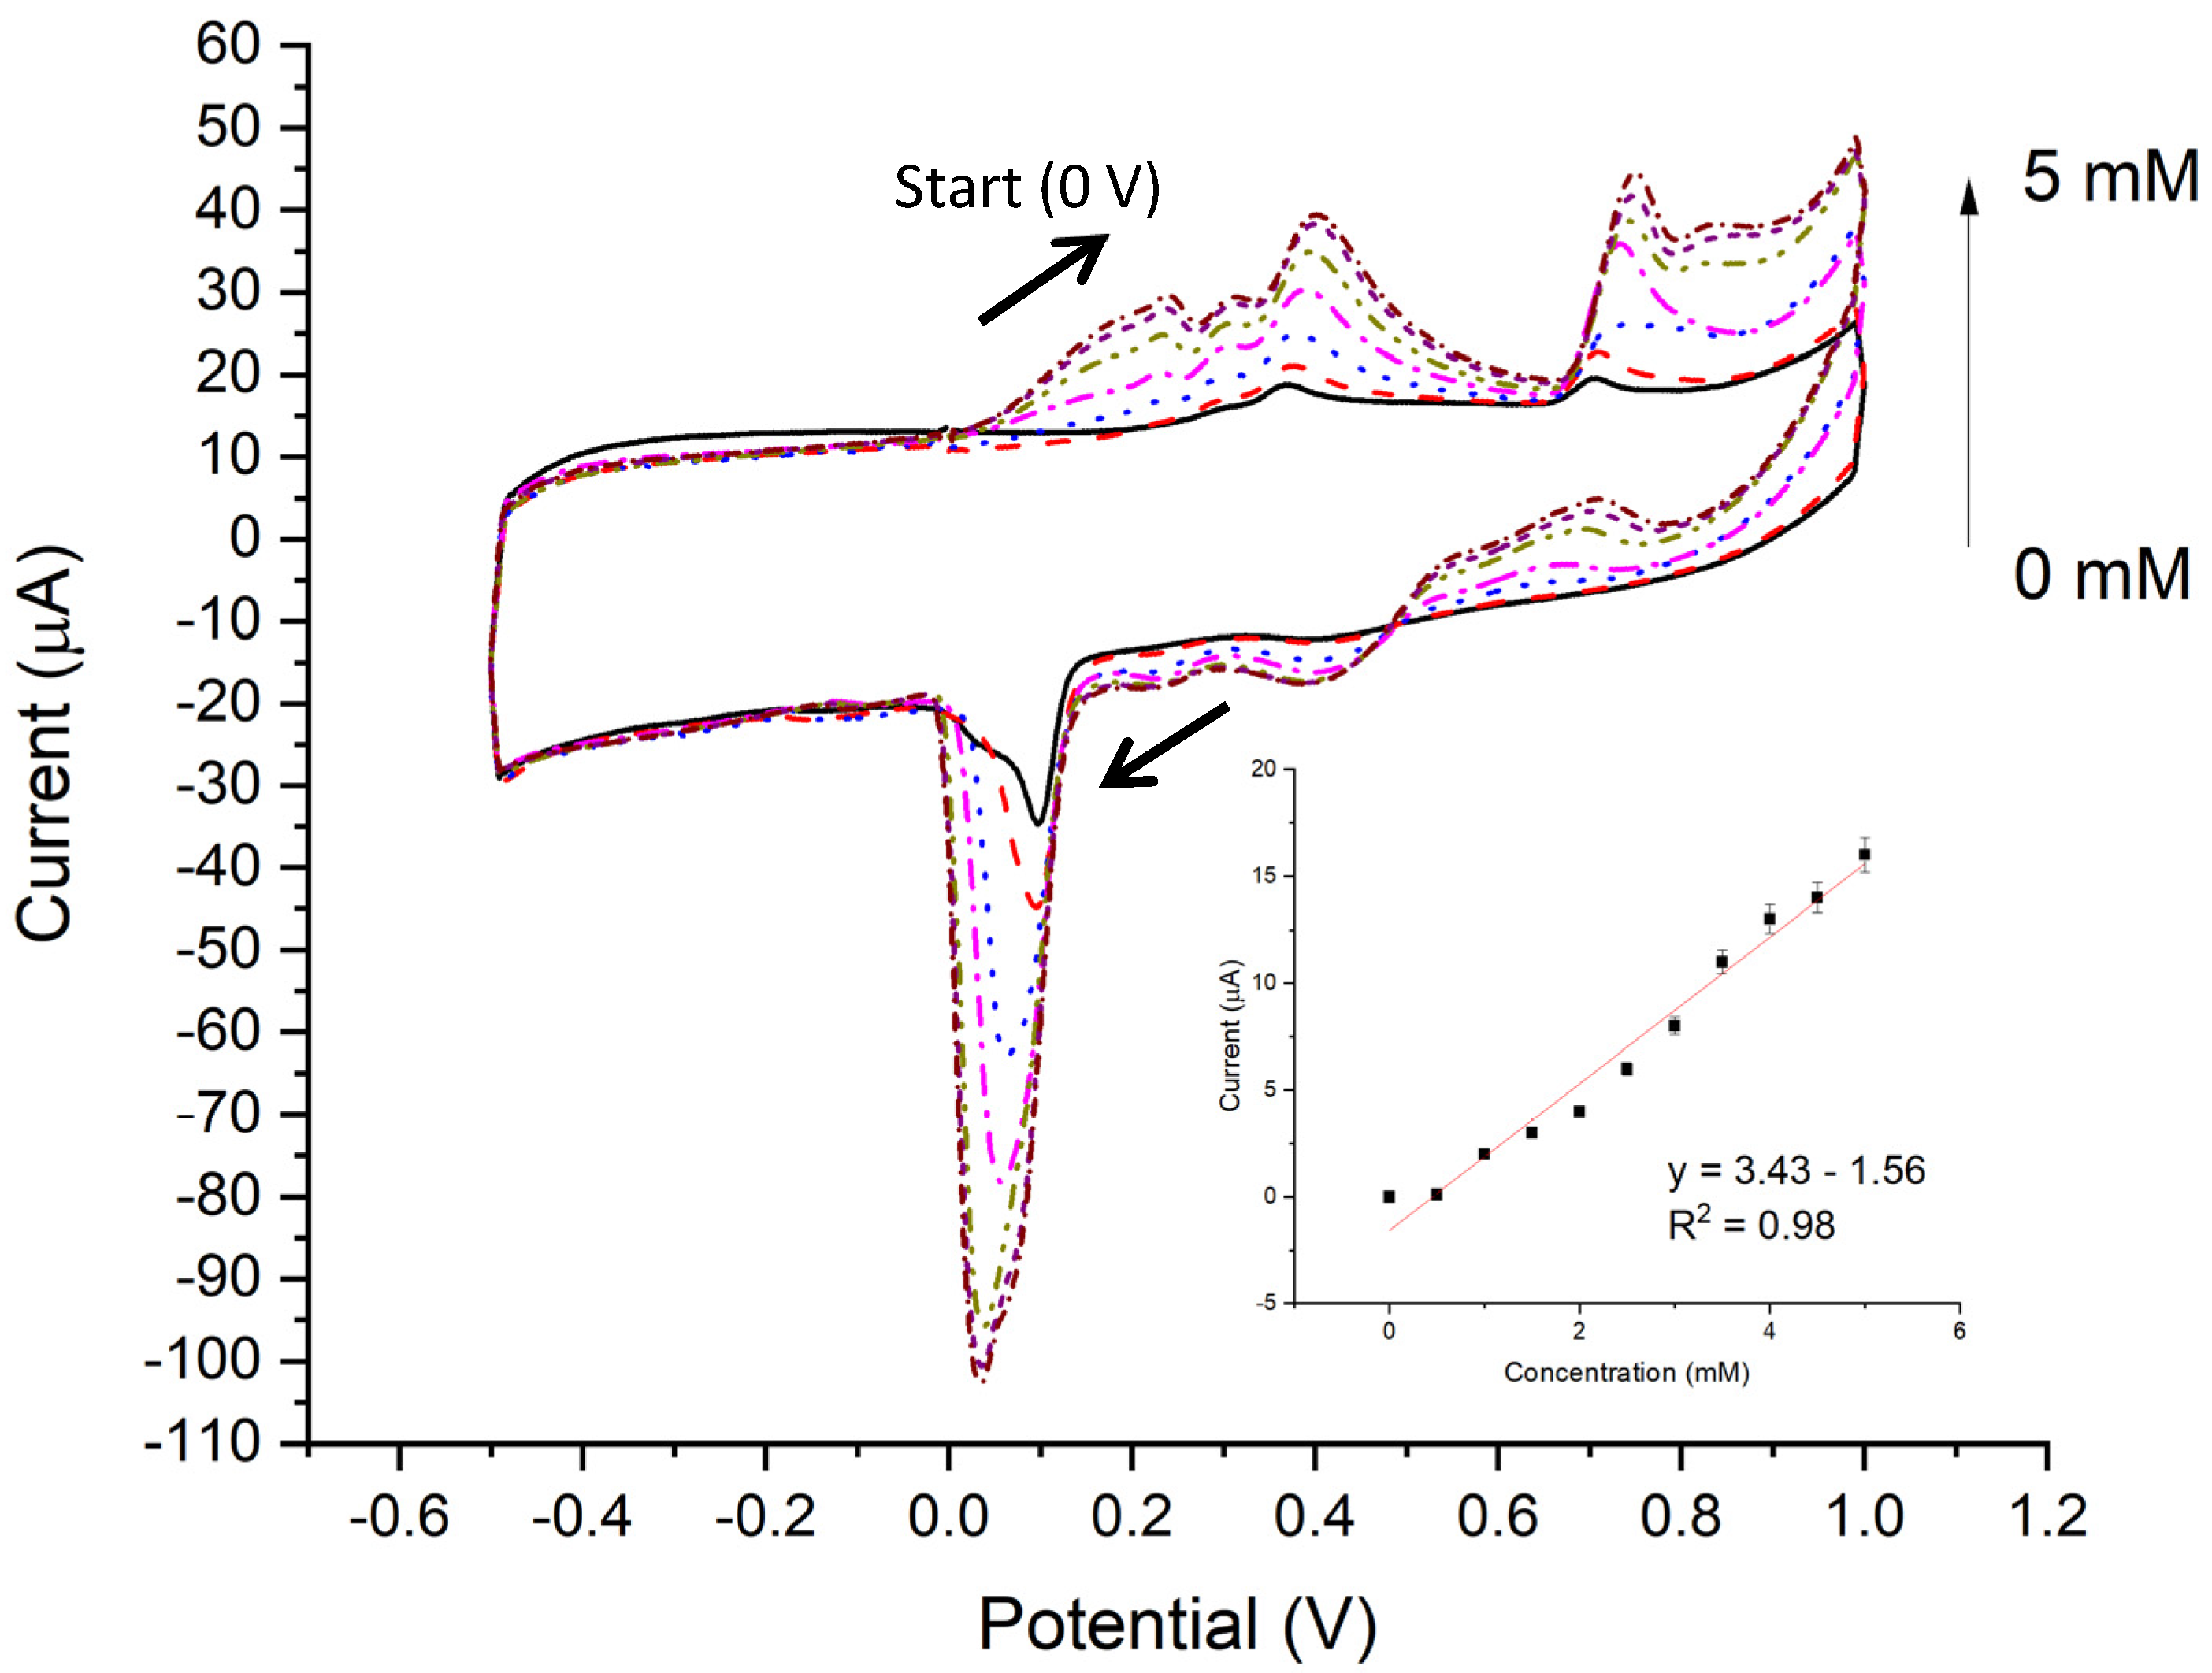
3.3. CV Results
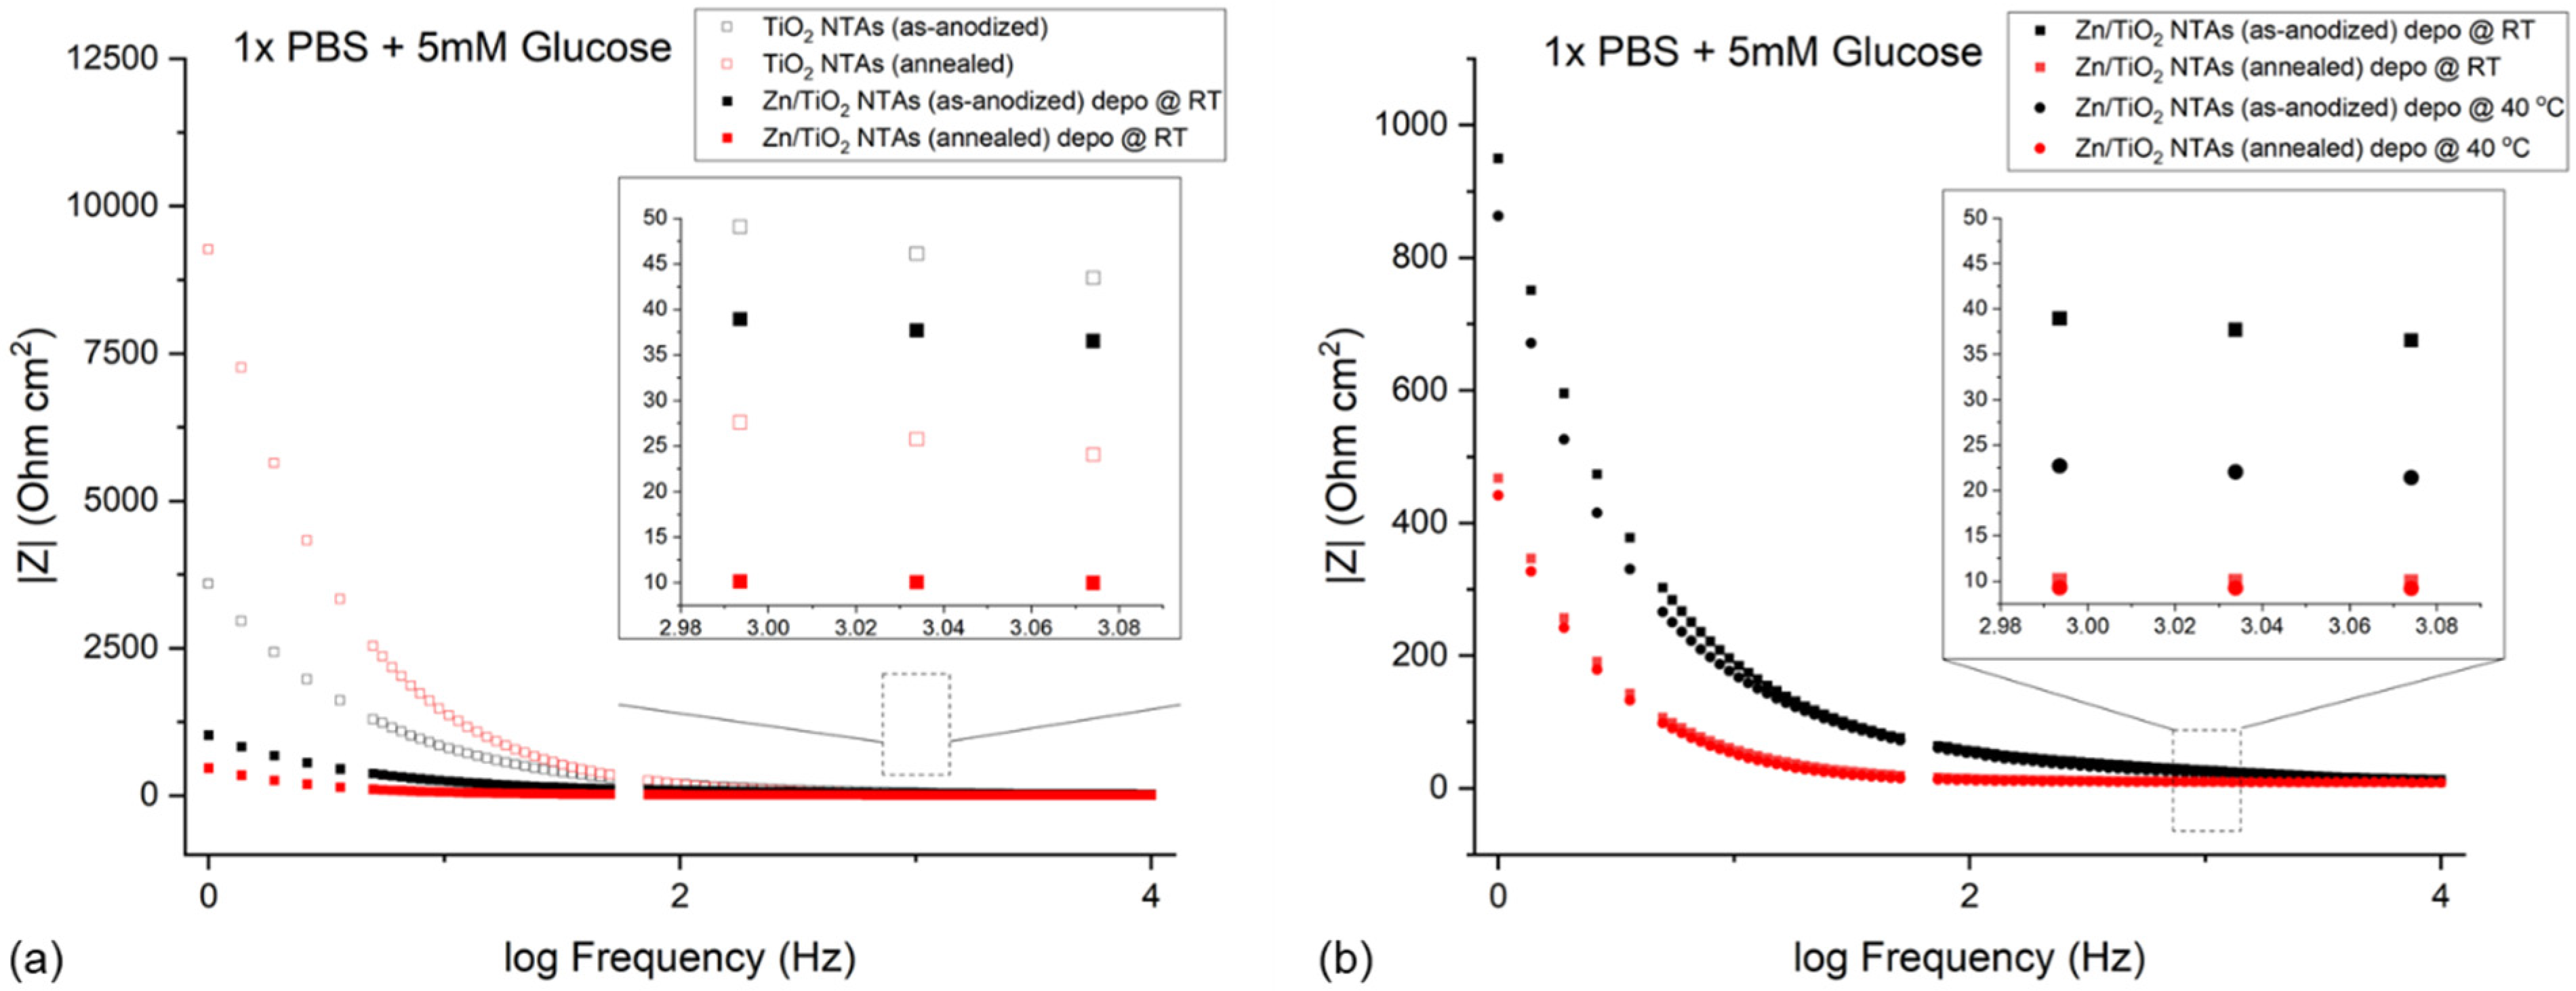
3.4. EIS Results
3.5. Chronoamperometry Results
4. Discussion
4.1. Microstructure and Compositional Characterization
4.2. CV of Zn/TiO2 NTAs
4.3. EIS of Zn/TiO2 NTAs
4.4. Glucose Sensing Performance of Zn/TiO2 NTAs
5. Conclusions
Author Contributions
Funding
Data Availability Statement
Acknowledgments
Conflicts of Interest
References
- Heller, A.; Feldman, B. Electrochemical Glucose Sensors and Their Applications in Diabetes Management. Chem. Rev. 2008, 108, 2482–2505. [Google Scholar] [CrossRef] [PubMed]
- Yoo, E.-H.; Lee, S.-Y. Glucose Biosensors: An Overview of Use in Clinical Practice. Sensors 2010, 10, 4558–4576. [Google Scholar] [CrossRef] [PubMed]
- Lee, H.; Hong, Y.J.; Baik, S.; Hyeon, T.; Kim, D.-H. Enzyme-Based Glucose Sensor: From Invasive to Wearable Device. Adv. Healthc. Mater. 2018, 7, 1701150. [Google Scholar] [CrossRef]
- Hassan, M.H.; Vyas, C.; Grieve, B.; Bartolo, P. Recent Advances in Enzymatic and Non-Enzymatic Electrochemical Glucose Sensing. Sensors 2021, 21, 4672. [Google Scholar] [CrossRef] [PubMed]
- Riddell, M.C.; Scott, S.N.; Fournier, P.A.; Colberg, S.R.; Gallen, I.W.; Moser, O.; Stettler, C.; Yardley, J.E.; Zaharieva, D.P.; Adolfsson, P.; et al. The competitive athlete with type 1 diabetes. Diabetologia 2020, 63, 1475–1490. [Google Scholar] [CrossRef]
- Nichols, S.P.; Koh, A.; Storm, W.L.; Shin, J.H.; Schoenfisch, M.H. Biocompatible Materials for Continuous Glucose Monitoring Devices. Chem. Rev. 2013, 113, 2528–2549. [Google Scholar] [CrossRef]
- Si, P.; Huang, Y.; Wang, T.; Ma, J. Nanomaterials for electrochemical non-enzymatic glucose biosensors. RSC Adv. 2013, 3, 3487–3502. [Google Scholar] [CrossRef]
- Wang, G.; He, X.; Wang, L.; Gu, A.; Huang, Y.; Fang, B.; Geng, B.; Zhang, X. Non-enzymatic electrochemical sensing of glucose. Microchim. Acta 2013, 180, 161–186. [Google Scholar] [CrossRef]
- Park, S.; Boo, H.; Chung, T.D. Electrochemical non-enzymatic glucose sensors. Anal. Chim. Acta 2006, 556, 46–57. [Google Scholar] [CrossRef]
- Govindaraj, M.; Srivastava, A.; Muthukumaran, M.K.; Tsai, P.-C.; Lin, Y.-C.; Raja, B.K.; Rajendran, J.; Ponnusamy, V.K.; Selvi, J.A. Current advancements and prospects of enzymatic and non-enzymatic electrochemical glucose sensors. Int. J. Biol. Macromol. 2023, 253, 126680. [Google Scholar] [CrossRef]
- Gloeb-McDonald, R.G.; Fridman, G. Glucose Fuel Cells: Electricity from Blood Sugar. IEEE Rev. Biomed. Eng. 2024. online ahead of prints. [Google Scholar] [CrossRef] [PubMed]
- Dong, Q.; Ryu, H.; Lei, Y. Metal oxide based non-enzymatic electrochemical sensors for glucose detection. Electrochim. Acta 2021, 370, 137744. [Google Scholar] [CrossRef]
- Jiang, J.; Li, Y.; Liu, J.; Huang, X.; Yuan, C.; Lou, X.W. Recent Advances in Metal Oxide-based Electrode Architecture Design for Electrochemical Energy Storage. Adv. Mater. 2012, 24, 5166–5180. [Google Scholar] [CrossRef] [PubMed]
- Zhang, G.; Xiao, X.; Li, B.; Gu, P.; Xuea, H.; Pang, H. Transition metal oxides with one-dimensional/one-dimensional-analogue nanostructures for advanced supercapacitors. J. Mater. Chem. A Mater. 2017, 5, 8155–8186. [Google Scholar] [CrossRef]
- Kant, K.; Priest, C.; Shapter, J.; Losic, D. The Influence of Nanopore Dimensions on the Electrochemical Properties of Nanopore Arrays Studied by Impedance Spectroscopy. Sensors 2014, 14, 21316–21328. [Google Scholar] [CrossRef]
- Fazio, E.; Spadaro, S.; Corsaro, C.; Neri, G.; Leonardi, S.G.; Neri, F.; Lavanya, N.; Sekar, C.; Donato, N.; Neri, G. Metal-Oxide Based Nanomaterials: Synthesis, Characterization and Their Applications in Electrical and Electrochemical Sensors. Sensors 2021, 21, 2494. [Google Scholar] [CrossRef]
- Yuan, F.; Xia, Y.; Lu, Q.; Xu, Q.; Shu, Y.; Hu, X. Recent advances in inorganic functional nanomaterials based flexible electrochemical sensors. Talanta 2022, 244, 123419. [Google Scholar] [CrossRef]
- He, C.; Asif, M.; Liu, Q.; Xiao, F.; Liu, H.; Xia, B.Y. Noble Metal Construction for Electrochemical Nonenzymatic Glucose Detection. Adv. Mater. Technol. 2023, 8, 2200272. [Google Scholar] [CrossRef]
- Wang, Y.; Chen, J.; Zhou, C.; Zhou, L.; Kong, Y.; Long, H.; Zhong, S. A novel self-cleaning, non-enzymatic glucose sensor working under a very low applied potential based on a Pt nanoparticle-decorated TiO2 nanotube array electrode. Electrochim. Acta 2014, 115, 269–276. [Google Scholar] [CrossRef]
- Grochowska, K.; Ryl, J.; Karczewski, J.; Śliwiński, G.; Cenian, A.; Siuzdak, K. Non-enzymatic flexible glucose sensing platform based on nanostructured TiO2–Au composite. J. Electroanal. Chem. 2019, 837, 230–239. [Google Scholar] [CrossRef]
- Bertel, L.; Miranda, D.A.; García-Martín, J.M. Nanostructured Titanium Dioxide Surfaces for Electrochemical Biosensing. Sensors 2021, 21, 6167. [Google Scholar] [CrossRef] [PubMed]
- Cheng, Y.; Yang, H.; Yang, Y.; Huang, J.; Wu, K.; Chen, Z.; Wang, X.; Lin, C.; Lai, Y. Progress in TiO2 nanotube coatings for biomedical applications: A review. J. Mater. Chem. B 2018, 6, 1862–1886. [Google Scholar] [CrossRef] [PubMed]
- Ndolomingo, M.J.; Bingwa, N.; Meijboom, R. Review of supported metal nanoparticles: Synthesis methodologies, advantages and application as catalysts. J. Mater. Sci. 2020, 55, 6195–6241. [Google Scholar] [CrossRef]
- Li, Z.; Xin, Y.; Zhang, Z.; Wu, H.; Wang, P. Rational design of binder-free noble metal/metal oxide arrays with nanocauliflower structure for wide linear range nonenzymatic glucose detection. Sci. Rep. 2015, 5, 10617. [Google Scholar] [CrossRef] [PubMed]
- Wang, J.; Zhang, W.-D. Fabrication of CuO nanoplatelets for highly sensitive enzyme-free determination of glucose. Electrochim. Acta 2011, 56, 7510–7516. [Google Scholar] [CrossRef]
- Kumar, B.; Sinha, S.K. Nanostructured Cu2O deposited on TiO2 nanotube arrays for ultra-sensitive non-enzymatic glucose electrochemical biosensor. Ionics 2022, 29, 793–805. [Google Scholar] [CrossRef]
- Song, L.; Connolly, M.; Fernández-Cruz, M.L.; Vijver, M.G.; Fernández, M.; Conde, E.; de Snoo, G.R.; Peijnenburg, W.J.; Navas, J.M. Species-specific toxicity of copper nanoparticles among mammalian and piscine cell lines. Nanotoxicology 2014, 8, 383–393. [Google Scholar] [CrossRef]
- Wang, J.X.; Sun, X.W.; Wei, A.; Lei, Y.; Cai, X.P.; Li, C.M.; Dong, Z.L. Zinc oxide nanocomb biosensor for glucose detection. Appl. Phys. Lett. 2006, 88, 233106. [Google Scholar] [CrossRef]
- Dang, T.K.; Van Toan, N.; Hung, C.M.; Van Duy, N.; Viet, N.N.; Thong, L.V.; Son, N.T.; Van Hieu, N.; Le Manh, T. Investigation of zinc electronucleation and growth mechanisms onto platinum electrode from a deep eutectic solvent for gas sensing applications. J. Appl. Electrochem. 2022, 52, 299–309. [Google Scholar] [CrossRef]
- Wang, K.; Phelps, J.; Abdolvand, R.; Carter, J.; Amani Hamedani, H. Zinc Nanoparticles Electrodeposited on TiO2 Nanotube Arrays Using Deep Eutectic Solvents for Implantable Electrochemical Sensors. ACS Appl. Nano Mater. 2023, 6, 8238–8249. [Google Scholar] [CrossRef]
- Lavanya, N.; Leonardi, S.; Marini, S.; Espro, C.; Kanagaraj, M.; Reddy, S.L.; Sekar, C.; Neri, G. MgNi2O3 nanoparticles as novel and versatile sensing material for non-enzymatic electrochemical sensing of glucose and conductometric determination of acetone. J. Alloys Compd. 2020, 817, 152787. [Google Scholar] [CrossRef]
- Long, M.; Tan, L.; Liu, H.; He, Z.; Tang, A. Novel helical TiO2 nanotube arrays modified by Cu2O for enzyme-free glucose oxidation. Biosens. Bioelectron. 2014, 59, 243–250. [Google Scholar] [CrossRef] [PubMed]
- Pradhan, R.; Mitra, A.; Das, S. Impedimetric characterization of human blood using three-electrode based ECIS devices. J. Electr. Bioimped. 2012, 3, 12–19. [Google Scholar] [CrossRef]
- Hanzu, I.; Djenizian, T.; Knauth, P. Electrical and Point Defect Properties of TiO2 Nanotubes Fabricated by Electrochemical Anodization. J. Phys. Chem. C 2011, 115, 5989–5996. [Google Scholar] [CrossRef]
- Doche, M.-L.; Hihn, J.-Y.; Touyeras, F.; Lorimer, J.; Mason, T.; Plattes, M. Electrochemical behaviour of zinc in 20 kHz sonicated NaOH electrolytes. Ultrason. Sonochem. 2001, 8, 291–298. [Google Scholar] [CrossRef]
- Burke, L.D. Premonolayer oxidation and its role in electrocatalysis. Electrochim. Acta 1994, 39, 1841–1848. [Google Scholar] [CrossRef]
- Liang, Z.; Zhang, X. Zn–ZnO@TiO2 nanocomposite: A direct electrode for nonenzymatic biosensors. J. Mater. Sci. 2018, 53, 7138–7149. [Google Scholar] [CrossRef]
- Song, Y.-Y.; Zhang, D.; Gao, W.; Xia, X.-H. Nonenzymatic Glucose Detection by Using a Three-Dimensionally Ordered, Macroporous Platinum Template. Chem.-Eur. J. 2005, 11, 2177–2182. [Google Scholar] [CrossRef]
- Bard, A.J.; Faulkner, L.R.; White, H.S. Electrochemical Methods: Fundamentals and Applications; John Wiley & Sons: Hoboken, NJ, USA, 2022. [Google Scholar]
- Li, X.; Yao, J.; Liu, F.; He, H.; Zhou, M.; Mao, N.; Xiao, P.; Zhang, Y. Nickel/Copper nanoparticles modified TiO2 nanotubes for non-enzymatic glucose biosensors. Sens. Actuators B Chem. 2013, 181, 501–508. [Google Scholar] [CrossRef]
- Arthanari, S.; Sivaprakasam, R.; Park, J.; Yang, M.; Lee, H.; Kim, B.; Hwang, J.S. Fabrication of Porous Non-Enzymatic Glucose Sensing Electrodes Through Nanosecond-Laser Patterning of Metal–Organic Frameworks. Adv. Mater. Technol. 2024, 9, 98563–98580. [Google Scholar] [CrossRef]
- Yadav, M.; Singh, G.; Lata, S. Polyvinylpyrrolidone/TiO2 composites’ preparation via sol–gel procedure furthered with non-enzymatic glucose sensing and antibacterial effectiveness. Environ. Sci. Pollut. Res. 2022, 25, 708–714. [Google Scholar] [CrossRef] [PubMed]
- Wang, W.; Zhang, L.; Tong, S.; Li, X.; Song, W. Three-dimensional network films of electrospun copper oxide nanofibers for glucose determination. Biosens. Bioelectron. 2009, 25, 708–714. [Google Scholar] [CrossRef]
- Li, F.-H.; Wang, W.; Gao, J.-P.; Wang, S.-Y. Electrochemical Reduction Process of Sb(III) on Au Electrode Investigated by CV and EIS. J. Electrochem. Soc. 2009, 156, D84. [Google Scholar] [CrossRef]
- Zhou, Z.; Zhu, Z.; Cui, F.; Shao, J.; Zhou, H.S. CuO/Cu composite nanospheres on a TiO2 nanotube array for amperometric sensing of glucose. Microchim. Acta 2020, 187, 123. [Google Scholar] [CrossRef] [PubMed]
- Lin, K.-C.; Lin, Y.-C.; Chen, S.-M. A highly sensitive nonenzymatic glucose sensor based on multi-walled carbon nanotubes decorated with nickel and copper nanoparticles. Electrochim. Acta 2013, 96, 164–172. [Google Scholar] [CrossRef]
- Chung, R.-J.; Wang, A.-N.; Liao, Q.-L.; Chuang, K.-Y. Non-Enzymatic Glucose Sensor Composed of Carbon-Coated Nano-Zinc Oxide. Nanomaterials 2017, 7, 36. [Google Scholar] [CrossRef]
- Li, X.; Zhao, C.; Liu, X. A paper-based microfluidic biosensor integrating zinc oxide nanowires for electrochemical glucose detection. Microsyst. Nanoeng. 2015, 1, 15014. [Google Scholar] [CrossRef]


| Material Name | Linear Range (mM) | Detection Limit (mM) | Sensitivity (μA mM−1 cm−2) | Potential (V) | Medium | Ref. |
|---|---|---|---|---|---|---|
| Zn/TiO2 NTAs | 0.5–5 | 0.44 | 4.38 | 0.7 | 0.1 M NaOH/Glucose | This Work |
| CuO/Cu/TNT | 0.2–90.4 | 0.019 | 234 | 0.42 | Acetonitrile/ 0.1 M TEAP | [45] |
| ZnO/GCE | 0.02–4.5 | 0.02 | 15.33 | 0.8 | 1X PBS/Glucose | [28] |
| ZnO@C/GCE | 0.1–10 | 1 | 2.97 | 0.38 | 0.1 M NaOH/Glucose | [47] |
| ZnO nanowire/EµPAD | 0–15 | 5.95 × 10⁻² | 8.24 | 0.8 | 1X PBS/Glucose | [48] |
| CuO/GCE | 0.006–2.5 | 0.8 | 431.3 | 0.4 | 0.1 M NaOH/Glucose | [43] |
| Ni/Cu/MWCNT | 2.5 × 10⁻⁵–0.8 | 0.025 × 10⁻³ | 2633 | 0.575 | 0.1 M NaOH/Glucose | [46] |
| Au/CuO | 10−3–30 | 3 × 10⁻⁴ | 708.7 | 0.35 | 1.0 M NaOH/Glucose | [24] |
| CuO/Cu | 0–0.8 | 5 × 10⁻⁴ | 3218.5 | 0.55 | 1.0 M NaOH/Glucose | [25] |
| Cu2O/TiO2 | 5–35 | 8.85 × 10⁻⁵ | 101.65 | 0.7 | 0.1 M NaOH/Glucose | [26] |
| PVP/TiO2 | 0–13 | 0.76 | 360.13 | 0.63 | 0.1 M NaOH/Glucose | [42] |
Disclaimer/Publisher’s Note: The statements, opinions and data contained in all publications are solely those of the individual author(s) and contributor(s) and not of MDPI and/or the editor(s). MDPI and/or the editor(s) disclaim responsibility for any injury to people or property resulting from any ideas, methods, instructions or products referred to in the content. |
© 2024 by the authors. Licensee MDPI, Basel, Switzerland. This article is an open access article distributed under the terms and conditions of the Creative Commons Attribution (CC BY) license (https://creativecommons.org/licenses/by/4.0/).
Share and Cite
Wang, K.; Amani Hamedani, H. Glucose Oxidation Performance of Zinc Nano-Hexagons Decorated on TiO2 Nanotube Arrays. Nanomanufacturing 2024, 4, 187-201. https://doi.org/10.3390/nanomanufacturing4040013
Wang K, Amani Hamedani H. Glucose Oxidation Performance of Zinc Nano-Hexagons Decorated on TiO2 Nanotube Arrays. Nanomanufacturing. 2024; 4(4):187-201. https://doi.org/10.3390/nanomanufacturing4040013
Chicago/Turabian StyleWang, Ke, and Hoda Amani Hamedani. 2024. "Glucose Oxidation Performance of Zinc Nano-Hexagons Decorated on TiO2 Nanotube Arrays" Nanomanufacturing 4, no. 4: 187-201. https://doi.org/10.3390/nanomanufacturing4040013
APA StyleWang, K., & Amani Hamedani, H. (2024). Glucose Oxidation Performance of Zinc Nano-Hexagons Decorated on TiO2 Nanotube Arrays. Nanomanufacturing, 4(4), 187-201. https://doi.org/10.3390/nanomanufacturing4040013