Article

Modeling the Overdispersion of Pasteuria penetrans Endospores

by
Ioannis Vagelas
1,* and
Stefanos Leontopoulos
2
1
Department of Agriculture Crop Production and Rural Development, University of Thessaly, Fytokou Str., Nea Ionia, GR-38446 Magnesia, Greece
2
Department of Agricultural Engineering Technologists, School of Agricultural Technology, University of Thessaly, Gaiopolis, GR-41500 Larissa, Greece
*
Author to whom correspondence should be addressed.
Parasitologia 2022, 2(3), 206-227; https://doi.org/10.3390/parasitologia2030018
Submission received: 27 May 2022 / Revised: 11 July 2022 / Accepted: 19 July 2022 / Published: 23 July 2022

Abstract

:
This paper discusses a process of developing the data analysis and modeling of Pasteuria penetrans spore attachment in vitro and in planta, based on the observation that the number of spores attaching to juveniles within a given time increased by increasing the time of exposure to spores and the spores dose. Based on this, the P. penetrans spore attachment in vitro was modeled using the negative binomial distribution which permits decomposing the observation’s variability into three components: randomness, internal differences between individuals, and the presence of other external factors, e.g., the soil type. Additionally, we developed case-detection methods to explain P. penetrans spores’ attachment variability. The statistical methods developed in this paper show that a nematodes invasion is significant limited when second stage juveniles (J2s) are encumbered with seven P. penetrans spores. This research study concludes that the number of spores attached in J2s, the time of exposure of J2s to P. penetrans spores, and the soil texture are important factors affecting the invasion of root-knot nematodes in tomato plants.

1. Introduction

Plant-parasitic nematodes are recognized as major agricultural pathogens and are known to attack plants and cause great economic losses in crops worldwide [1,2,3]. Among plant-parasitic nematodes, there are sedentary endoparasites, which include the genera Heterodera and Globodera (cyst nematodes) and Meloidogyne, which are species better known as root-knot nematodes. Vegetables and ornamental crops are usually among the most susceptible cultivated plants that are affected by root-knot nematodes [4]. Among root-knot nematodes, Meloidogyne javanica is one of the most damaging plant parasites, often causing heavy losses, especially in plants grown in coarse-textured sandy soils. Nowadays, alternatives including the use of chemical substances, agricultural practices for managing pests, and the disease incorporation of organic amendments are either environmentally unacceptable or technically demanding. Thus, resistant varieties may potentially provide the most effective means of controlling nematode invasion. Despite the aforementioned control methods, the use of biological control agents such as the obligate hyperparasitic bacterium Pasteuria penetrans [5,6,7] has been recognized as one of the most effective biological control agents against root-knot nematodes [8,9], showing quite promising results [10,11,12]. The potential use of P. penetrans as a biological control agent against important plant-parasitic species has been widely studied in the past [13,14,15,16]. These studies include the distribution rate, host range, host specificity, as well as biotic and abiotic factors [17,18,19,20]. To date, it has been mentioned that successful parasitism depends on the attachment of 5–10 spores per juvenile (J2), which is sufficient to initiate infection without reducing the ability of the nematode to invade the root system [21,22,23]. However, studies have shown that there may be little or no root invasion if there are more than 15 spores attached to the nematode’s body, inferring that spore attachment will affect the ability of J2s to locate and/or invade the root [24,25,26]. The results of these studies imply high variances in the numbers of spores attached to the nematode’s body but no attempt has been made to examine this variability in detail, e.g., as shown by the target parameter of variability. This research is important since plant protectionists could use it as a prediction model to decide whether infected nematodes can cause plant damage and thus, yield losses.
Studies focused on the biology of P. penetrans mentioned that, during the infective stage, the endospores of P. penetrans attach to the extremal nematode body wall (cuticle) of free-living of Meloidogyne populations. As observed in many relevant studies [27,28], as soon as J2s are attracted by the root exudates of a host plant, the nematodes begin to become attached by the bacterium spores which penetrate the nematode’s cuticle and begin to grow and develop within the invaded nematode [6,29,30]. Eventually, the female nematode body becomes filled with spores [10,30]. As it has been remarkably noted, each infected female may contain up to 2.5 million spores [31], which are finally released back into the soil environment.
Overall, in this study, the main objective was to calculate the P. penetrans spore attachment process as a distribution, providing a model that allows the variance to be divided into components and offer an explanation in vitro and in planta.

2. Results

2.1. Modeling P. penetrans Spore Attachment Data—Water Bioassay

The results of our study of P. penetrans spores’ attachment show that a J2 of root-knot nematode may be encumbered with one or more spores over a fixed period (Figure 1). If every J2 were equally exposed to the chance of being encumbered with P. penetrans spores over a fixed period, the distribution would follow the Poisson series and the expected variance (s2) is equal to a mean. As Table 1 shows, the observed variance (s2) is significantly larger than the mean at 3, 6, and 9 h of incubation. Therefore, successful events of the attachment of P. penetrans to the nematode cuticle cannot be formulated with a Poisson process as the parameter s2 is not smaller than or equal to the mean.
As shown in Table 1, mean numbers, (e.g., at 9 h of nematode exposure to a P. penetrans spore suspension), indicating strong overdispersion. This suggests that P. penetrans spores are clumped, and more than one spore sticks on the cuticle of each J2. This observation agrees with relevant research studies wherein it was indicated that the ‘overdispersion’ phenomenon is common for living organisms [32,33,34] such as plant-parasitic nematodes [24,26,35] and can be explained by the negative binomial distribution.
Based on these results, data show that a better fit is obtained with the negative binomial distribution for P. penetrans spore attachment per juvenile at 3, 6, and 9 h after application (Figure 2). According to the data presented in previous research work [24,26], in all cases (3, 6, and 9 h), it was observed that the negative binomial distribution proved to be a better model for predicting the observed values compared with the Poisson distribution (Figure 3). The chi-square test of the hypothesis shows that the negative binomial (NegBin) model was the most appropriate to fit the observed counts (Table 1).
Moreover, the results presented in Figure 2 show that the negative binomial is the most appropriate distribution, mostly fitting all observations. This could be explained due to (a) the observed variance (s2) which is larger than the mean (Table 1); and (b) as time increases, the overdispersion becomes excessively large for the Poisson distribution (Table 2).

2.2. Estimating Root-Knot Nematodes Development by Water Bioassay

Results of the study of P. penetrans spores’ attachment show that the means at 9 and 36 h of nematode exposure to P. penetrans spore suspension are smaller (Table 3), e.g., equal to half the variance and thus indicating strong overdispersion. The J2s attachment range was 8.6 spores per J2 after 9 h and 28.2 spores per J2 after 36 h (Table 3). The 25th and 75th percentile provide an accurate picture of the attachment boundaries, e.g., since 6–11.2 spores were attached per J2 after 9 h (Table 3), meaning that half of the nematodes achieved either above or below the 50th percentile (median), which is equal to 8.5 (Table 3). These are the same values plotted in boxplots with violins and jittered data (Figure 4). In both cases (9 and 36 h), it was observed that the negative binomial distribution proved to be a better model for predicting the observed values compared with the Poisson distribution. Figure 5 indicates that, after a long period, the nematode only encounters clumps of spores. In a 36 h bioassay (Table 3), the most suppressive effect was achieved by J2s encumbered with 24 - 32 P. penetrans spores (25–75th percentile). Based on this observation, when J2s were encumbered with 24–32 spores of P. penetrans, these nematodes could not reset the gall and egg mass (Figure 6 and Figure 7), suggesting that P. penetrans spores probably halt J2s invasion when high numbers of spores are attached to the nematode’s cuticle. In the 9 h bioassay, when J2s were encumbered with 6–11 P. penetrans spores (Table 3, 25–75th percentile), and the nematodes produced significantly higher values of gall and egg masses compared to the 36 h attachment data (Figure 6 and Figure 7), suggesting that the P. penetrans spores’ density affects the root-knot invasion.
Figure 8 demonstrates the relationship between the nematodes gall and egg masses. More specifically, in Figure 8, the “Ghost Line” from the middle panel (J2s treated with 6–11 P. penetrans spores) is repeated in red across the other two panels. In more detail, the “Ghost Line” clearly suggests that the relationship between the gall and the egg masses differs among the panels. With the “Ghost Line,” it can be easily recognized that J2s encumbered with high numbers (24–32) of P. penetrans spores cannot enter plant tissue, probably due to their immobility in the soil.

2.3. Modeling P. penetrans Spore Attachment Data—Soil Bioassay

The data presented in Figure 9 show that, in a sandy loam bioassay for P. penetrans spore attachment at 5000 and 15,000 P. penetrans spores/J2, the best fit was obtained with the negative binomial (Figure 10), and not with the Poisson distribution (Figure 11).
The Poisson distribution is assumed for modeling for loam bioassay (Table 4). The data presented in Figure 12 show that, for the loam bioassay, the best fit is obtained with both the Poisson and the negative binomial distributions (Figure 13 and Figure 14), suggesting that the P. penetrans spore is not attached in clumps or a failure has occurred due to the soil stress environment.
Figure 10 and Figure 11 showed that the negative binomial is the more appropriate distribution fitting all observations only for sandy loam bioassay treatment (Table 5). A possible explanation could be that (i) as time increases, the overdispersion was excessively large for sandy loam bioassay, whereas (ii) the Poisson distribution (Figure 13 and Figure 14) is also considered an appropriate model to fit the loam bioassay data, suggesting an ‘underdispersion’ or a failure of P. penetrans spores in the attachment ability due the stress environment which occurred in the loam soil.

2.4. Estimainge J2s Root Invasion Rate Encumbered with Different Doses of P. penetrans Spores in Sandy Loam and Loam Soil

The data presented in Figure 15 show that (i) less J2s invaded the plants roots when encumbered with high rates of P. penetrans spores, e.g., 15,000 spores/mL; (ii) and the soil type attract different rates of J2s to invade the root system. For J2s’ invasion, soil type and P. penetrans spores have a significant impact (Table 6). These results suggest that J2s do not differentiate in terms of the invasion in the sandy loam soil (when treated with 5000 Pp spores’/mL) compared with the J2s invasion in loam soil treated with 5000 or 15,000 Pp spores’/mL (Figure 15).
The data presented in Figure 16 show that (i) attachment is influenced by the soil type and P. penetrans spore density; and (ii) the nematodes in sandy loam treated with 15,000 Pp spores/mL were three times more attached with P. penetrans spores/mL compared with those (J2s) in the loam soil treated with 15,000 Pp spores/mL. Soil type has a significant impact on the ability of P. penetrans spores to attach the J2s cuticle. (Table 7), suggesting that environmental factors such as soil texture influence the J2s invasion when they are encumbered with P. penetrans spores.
In the study of J2s’ invasion, fewer nematodes invade roots when they are treated with 15,000 P. penetrans spores/mL (Figure 15 and Figure 17). The nematodes invasion was significantly reduced when the J2s were encumbered with more than 6 P. penetrans spores (Figure 17, blue line). The “Ghost Line” in Figure 17 and Figure 18 represents this influence over J2s invasion when J2s are encumbered with more than six spores of P. penetrans.
The data presented in Figure 17 show that even the lowest P. penetrans concentration, (5000 P. penetrans spores/mL) significantly reduced the J2s invasion when nematodes were encumbered with >7 P. penetrans spores (blue arrows). At the highest P. penetrans concentration (15,000 P. penetrans spores/mL), a lower rate of nematode invasion was observed, particularly when J2s were encumbered with >15 P. penetrans spores (Figure 17, red line). In order to better understand how each of the levels of the factors (soil type and P. penetrans spores’ density) related to the number of P. penetrans spores attached to J2 we examined, the ordinary linear regression using the Minitab statistical program. The positive coefficient of 6.375 for sandy loam soil (Table 8) indicates that more P. penetrans spores became attached in sandy loam soil compared to in loam soil. The coefficient value for the Poisson regression model fit is very small (0.808, Table 8), indicating poor model fit. In fact, the Poisson model estimates were more erratic due to the overdispersion. This was observed as the variance of the fitted values were nearly two times greater than the mean (Table 9).
The data presented in Figure 18 show that, in the two examined soil types, fewer nematodes invade plant roots when they are encumbered with >7 P. penetrans spores (blue arrows) and possibly halt in soil when encumbered with approximately 15 P. penetrans spores’ (Figure 18, red arrow).
All the aforementioned results are graphically presented with generalized linear modeling (Figure 19) using the JASP Statistical Program through the flexplot module. The data presented in Figure 19 show that the gamma (γ) distribution can handle the ‘overdispersion’ as presented in Table 9, suggesting that the gamma (γ) distribution is probably the most appropriate. As data (counts) presented in Table 9 have values > 0, and exhibit overdispersion (variance > mean), the statistical distribution used to model those counts needs to be calculated and regression with a gamma (γ) distribution seems to be the most appropriate for modeling these counts. The negative binomial cannot provide useful and interpretable information as values (counts) are >0. Using the observations mentioned above, Figure 20 shows that the distribution with data points that roughly follow a straight line fits in a better way the data and appears to have a highest p-value, which is the gamma (γ) distribution (p = 0.123) followed by Weibull distribution (p = 0.083). It is well known that the Weibull and gamma (γ) distributions are commonly used for modeling life systems with monotone failure rates. Physically, this might correspond to a situation in which the object (in our case, the nematode population) fails if a sufficiently large environmental stress occurs (such stresses being distributed according to a Poisson process, as mentioned above in Table 4). In our research, it is reasonable to expect that the soil type with a low sand content, e.g., the loam soil, has the ability to suppress P. penetrans attachment. The difference in P. penetrants spores’ attachment is presented in Table 9. In more detail, the loam soil may indicate that the adhesive properties of these spores are influenced by the soil type, especially the content of the sand. The results presented in this study show the estimation of the P. penetrans attachment median for the difference in the number of the two soil types (sandy loam and loam soil): in greater detail, these are the 7 P. penetrans spores attached/J2-based on a Mann–Whitney test (Table 10) and 6.25 P. penetrans spores attached/J2-based on a Wilcoxon signed rank test—with differences between the population medians of 3–10 and 4.5–8 P. penetrans spores, respectively.
Finally, it is believed that this study offers strong evidence for solving the optimization problems of the negative binomial and the gamma (γ) distribution using a nonlinear model with four parameters which provides an adequate fit. Figure 21 shows that the fitted line plot follows the observed values which visually indicate that the model fits data for 96.3% R-Sq(adj), (Figure 21). The regression equation is (b1 + b2 × P. penetrans spores/J2 + b3 × P. penetrans spores/J2^2 + b3 × P. penetrans spores/J2^3) where b1 = 64.4; b2 = −7.436; b3 = 0.4774 and b4 = −001151. Table 11 shows the estimates of its four parameters of the nonlinear model.
In order to better understand the effect of the attachment of P. penetrans spores, the authors of this study used the odds ratio of a binary logistic regression model using the Minitab statistical software where the odds ratio for P. penetrans spores/J2 (Table 12) is 2.831. In our binary logistic model, the response was the soil type (loam or sandy loam), the categorical predictor was P. penetrans spores’ density (5000 or 15,000 spores), and the continuous predictors were J2/root and P. penetrans spores/J2.

3. Discussion

Poisson model is usually used to model data. If the observed variability in counts is much larger than the mean, a phenomenon termed overdispersion occurs, and the negative binomial model is often used as a replacement for overdispersed count data.
The application of the Poisson and negative binomial distributions for modeling P. penetrans attachment data was also studied by Vagelas et al. [24]. In the aforementioned research [24], evidence is provided of the P. penetrans attachment counts being characterized by a significantly larger variance than the mean. This phenomenon in biology is called “overdispersion” [36]. In addition to the aforementioned study [24], the results of the presented study are in agreement with other relevant research studies [23,24,25,26], which concluded that in analyzing P. penetrans attachment counts, the variance is significantly larger than the mean, and negative binomial distribution is the most appropriate model to fit the observed data. All previous studies [23,24,25,26] which modeled P. penetrans overdispersed attachment with data set in water bioassays only provided the simplest answer to the issues that the negative binomial distribution is the only model to explain data variability regarding the overdispersion of P. penetrans. This research provided evidence that apart from in the water bioassay, P. penetrans overdispersion is related to soil counts suggesting that the negative binomial distribution is the most appropriate model for solving the overdispersion problem.
Overdispersed data can lead to underestimated standard errors and inflated test statistics and in such circumstances, the negative binomial model can be utilized.
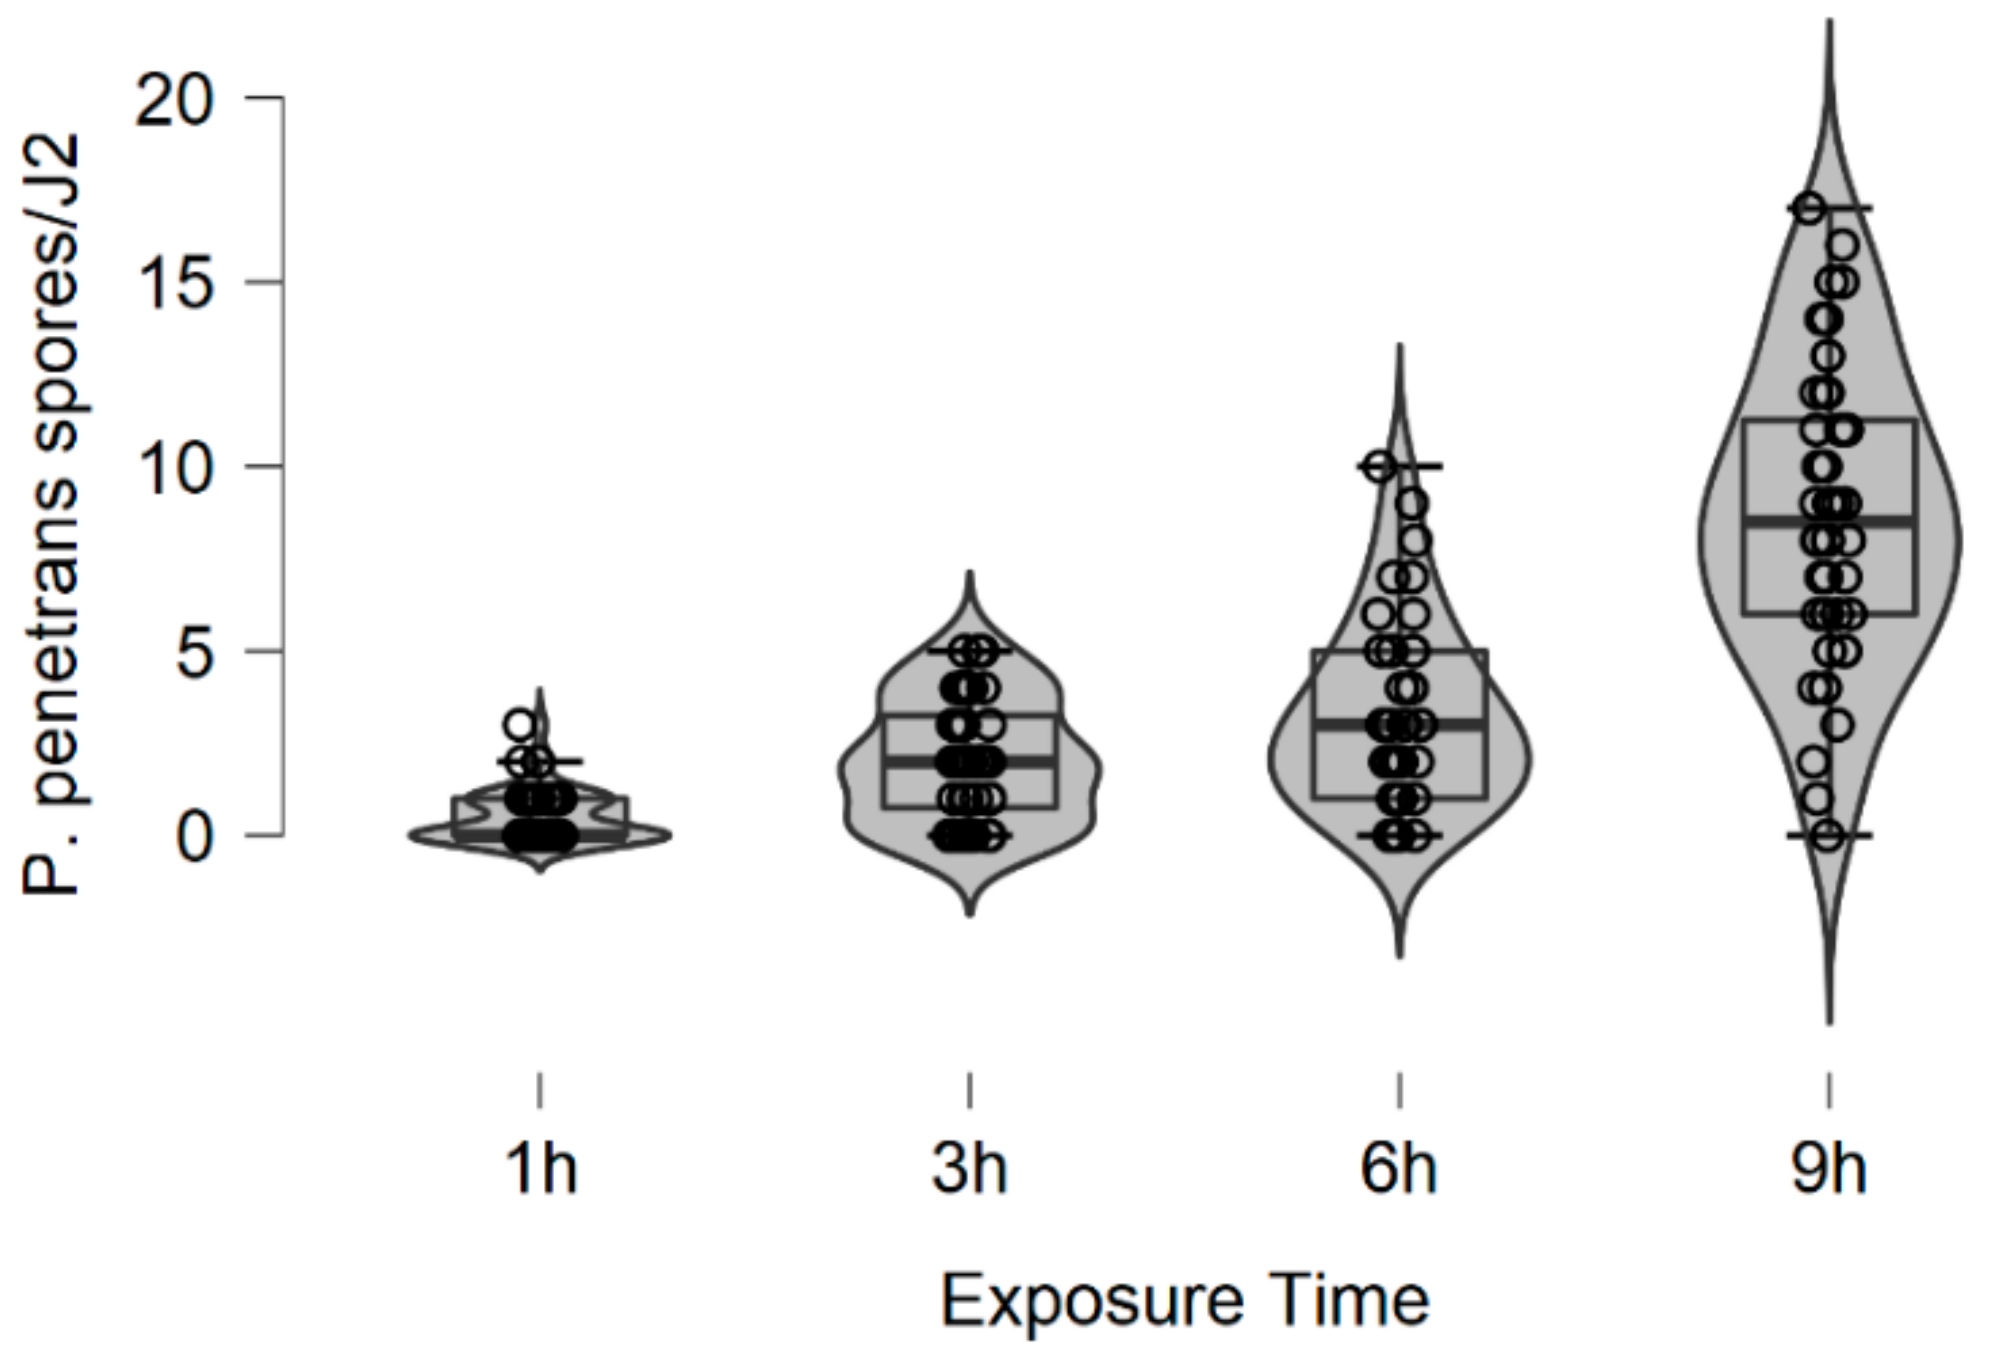
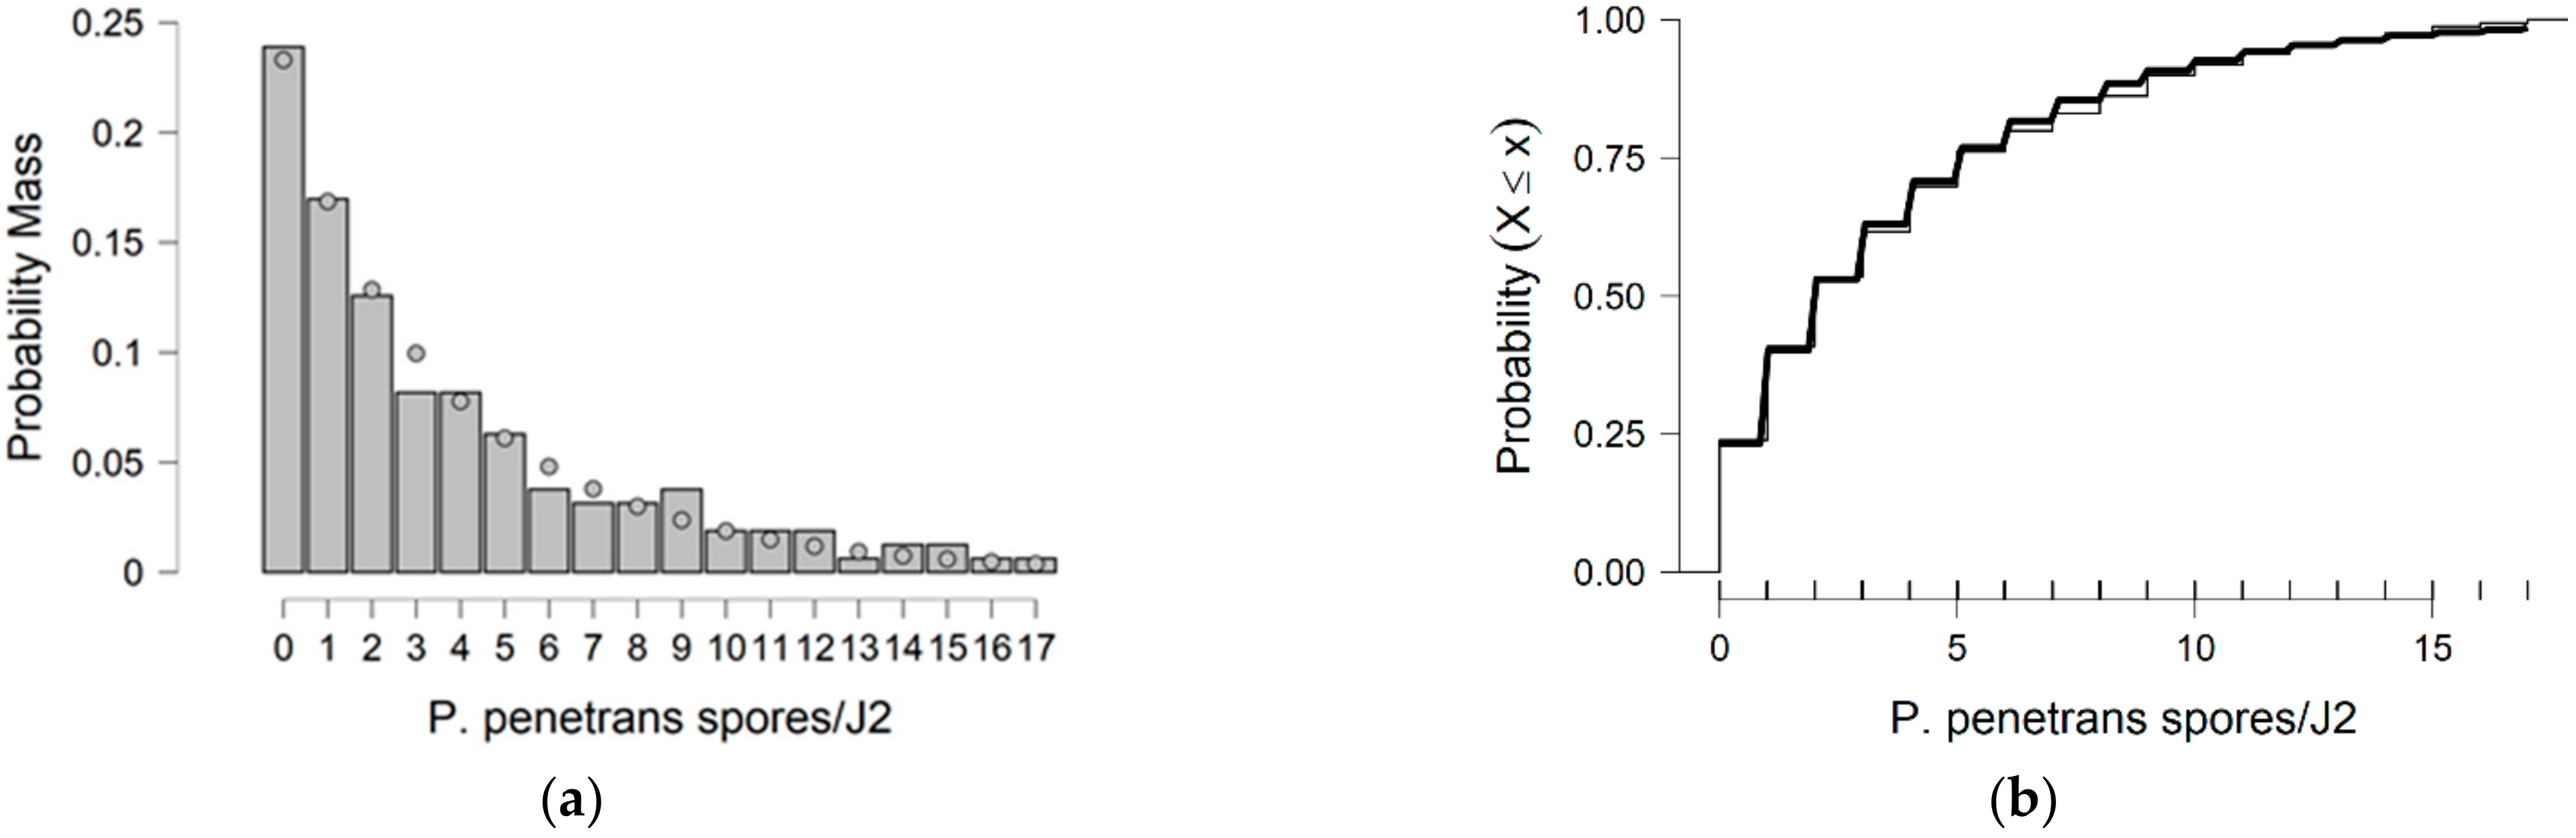
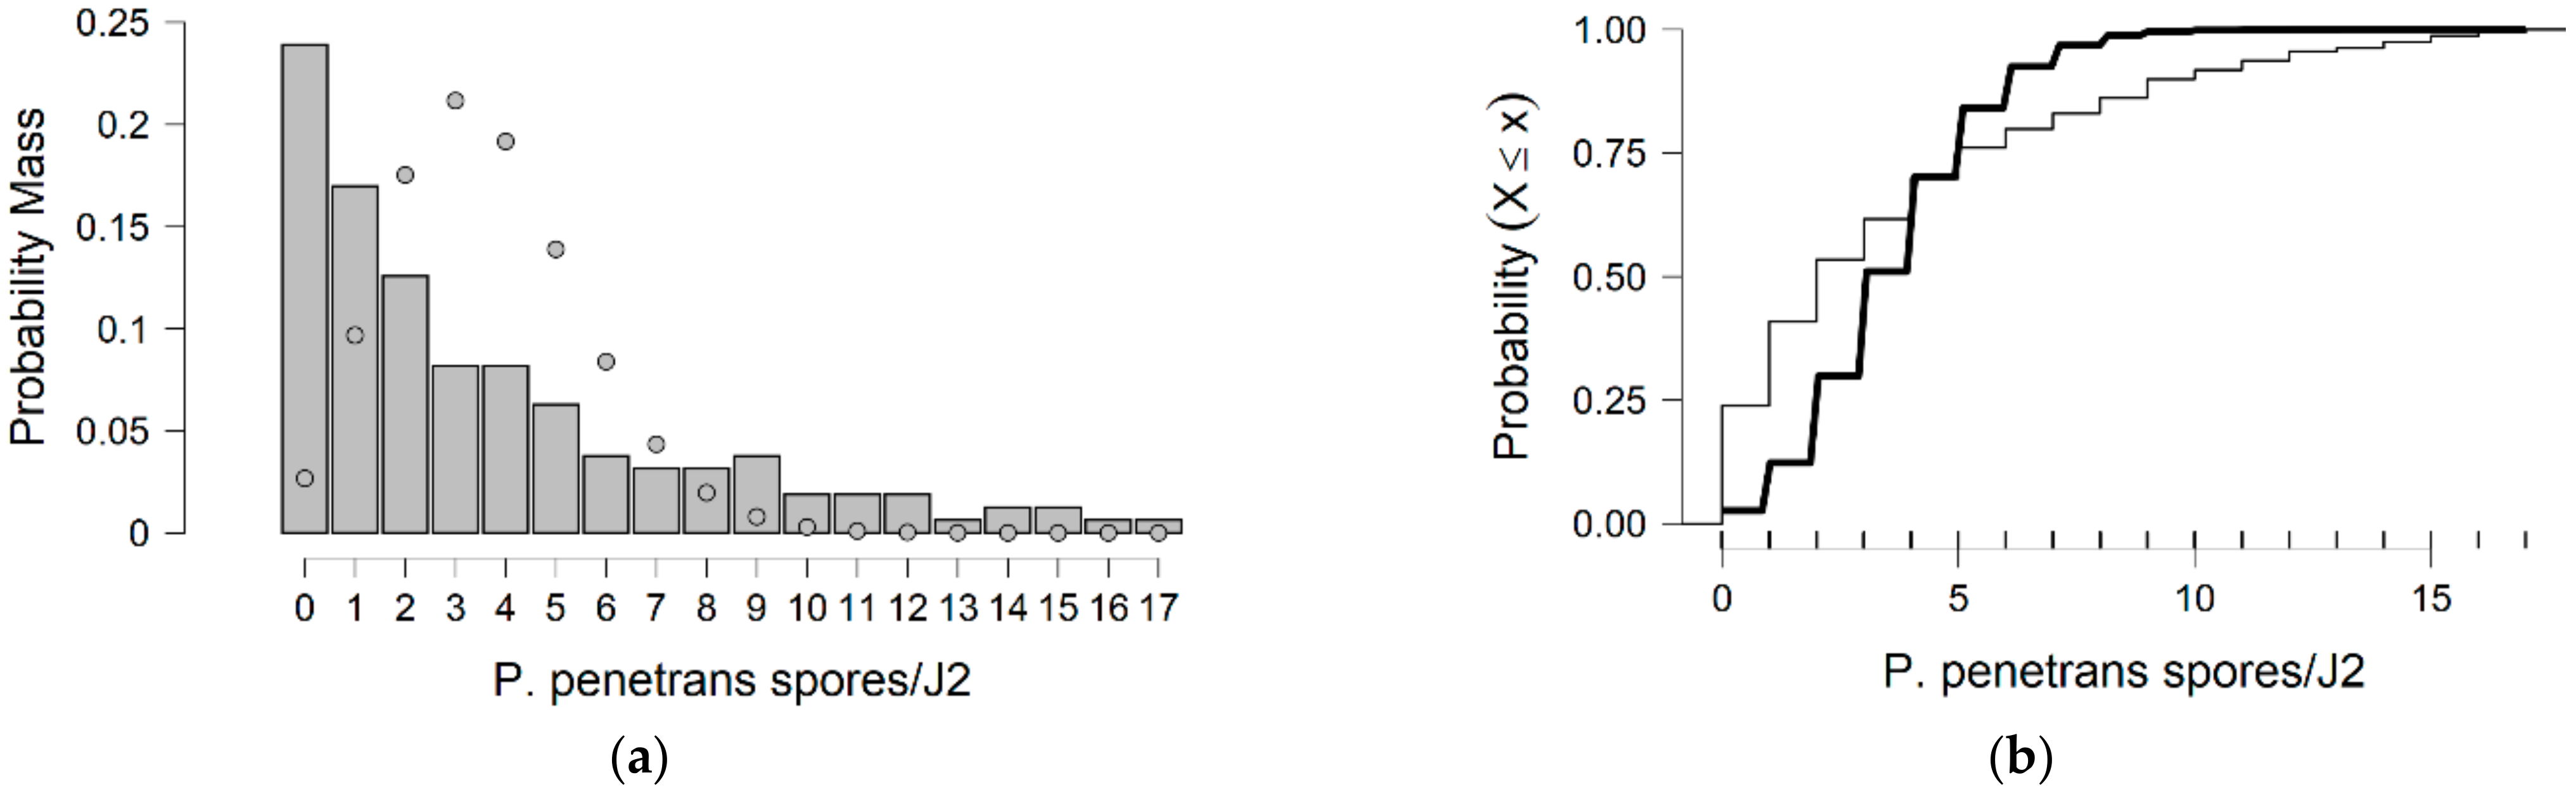
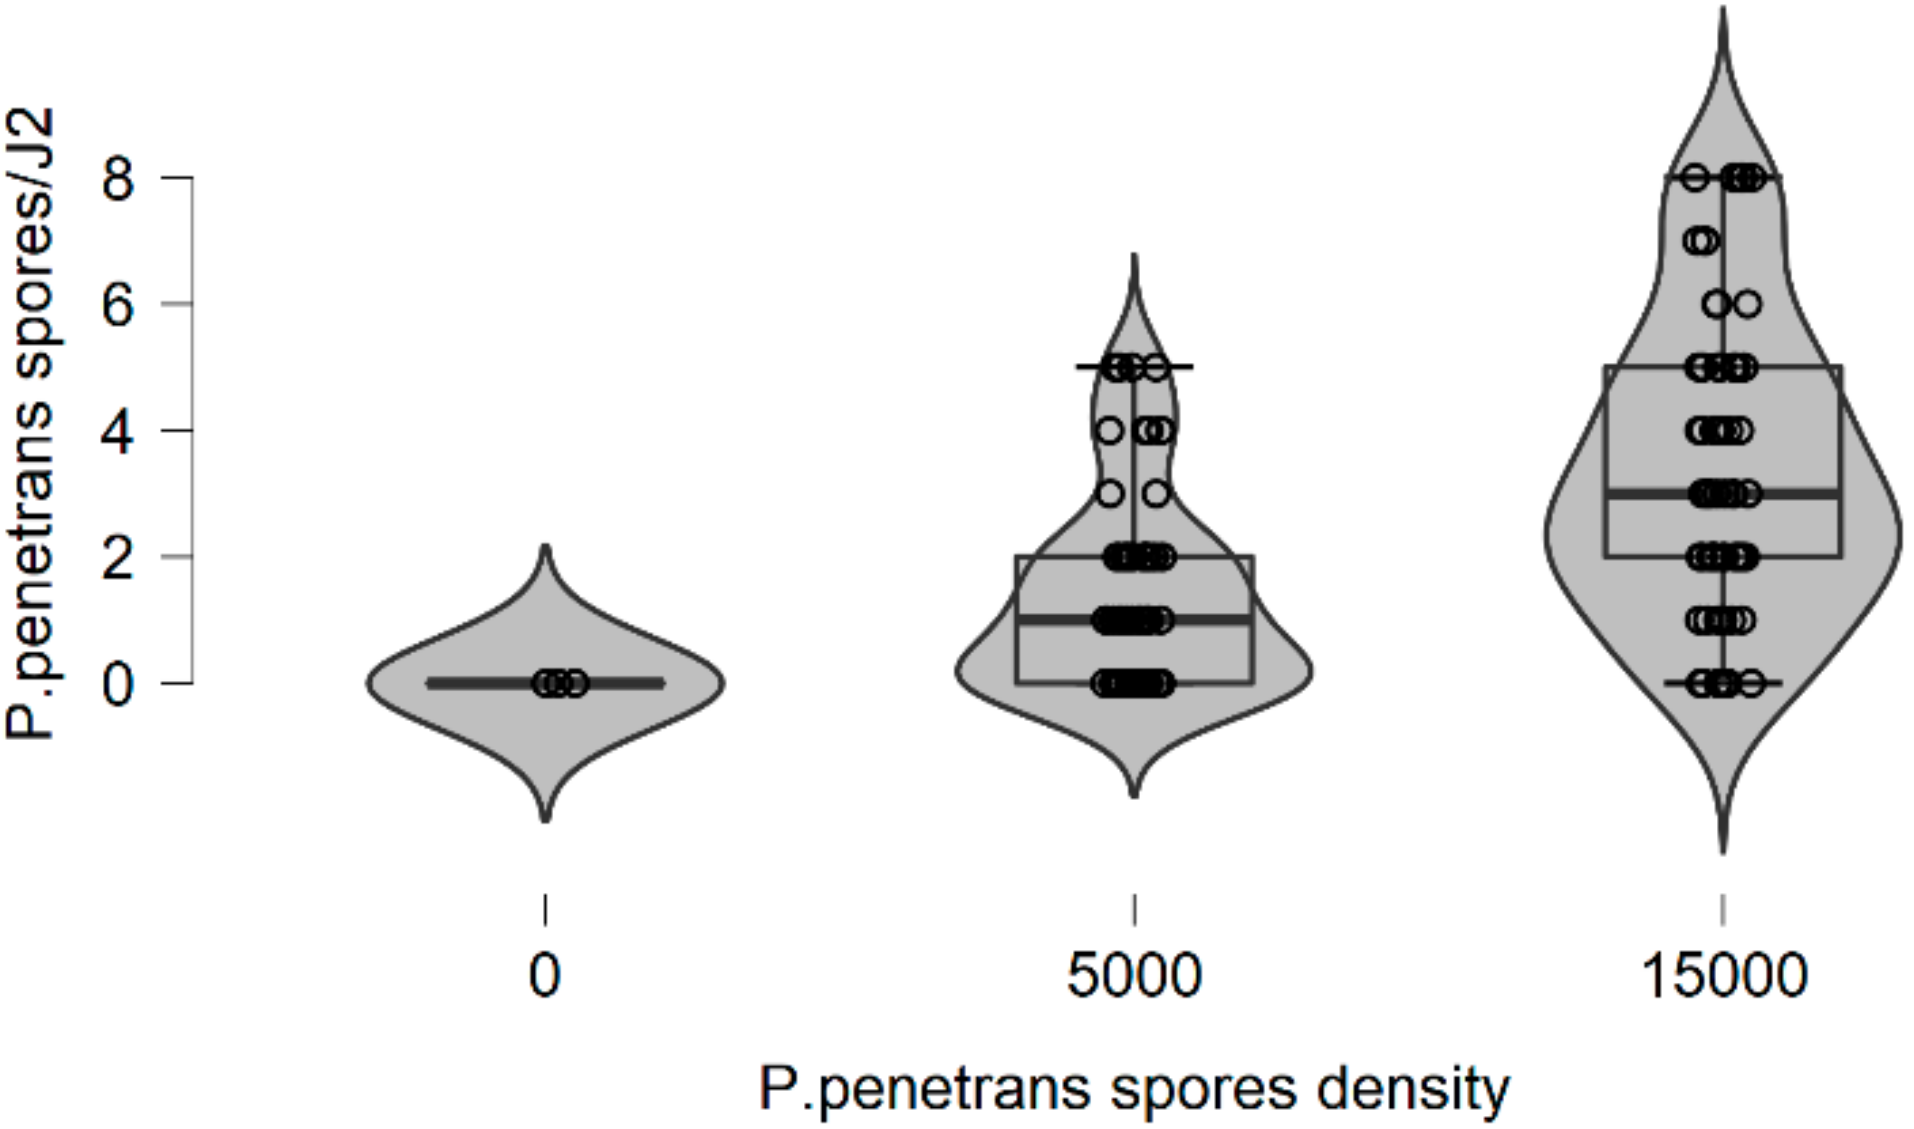
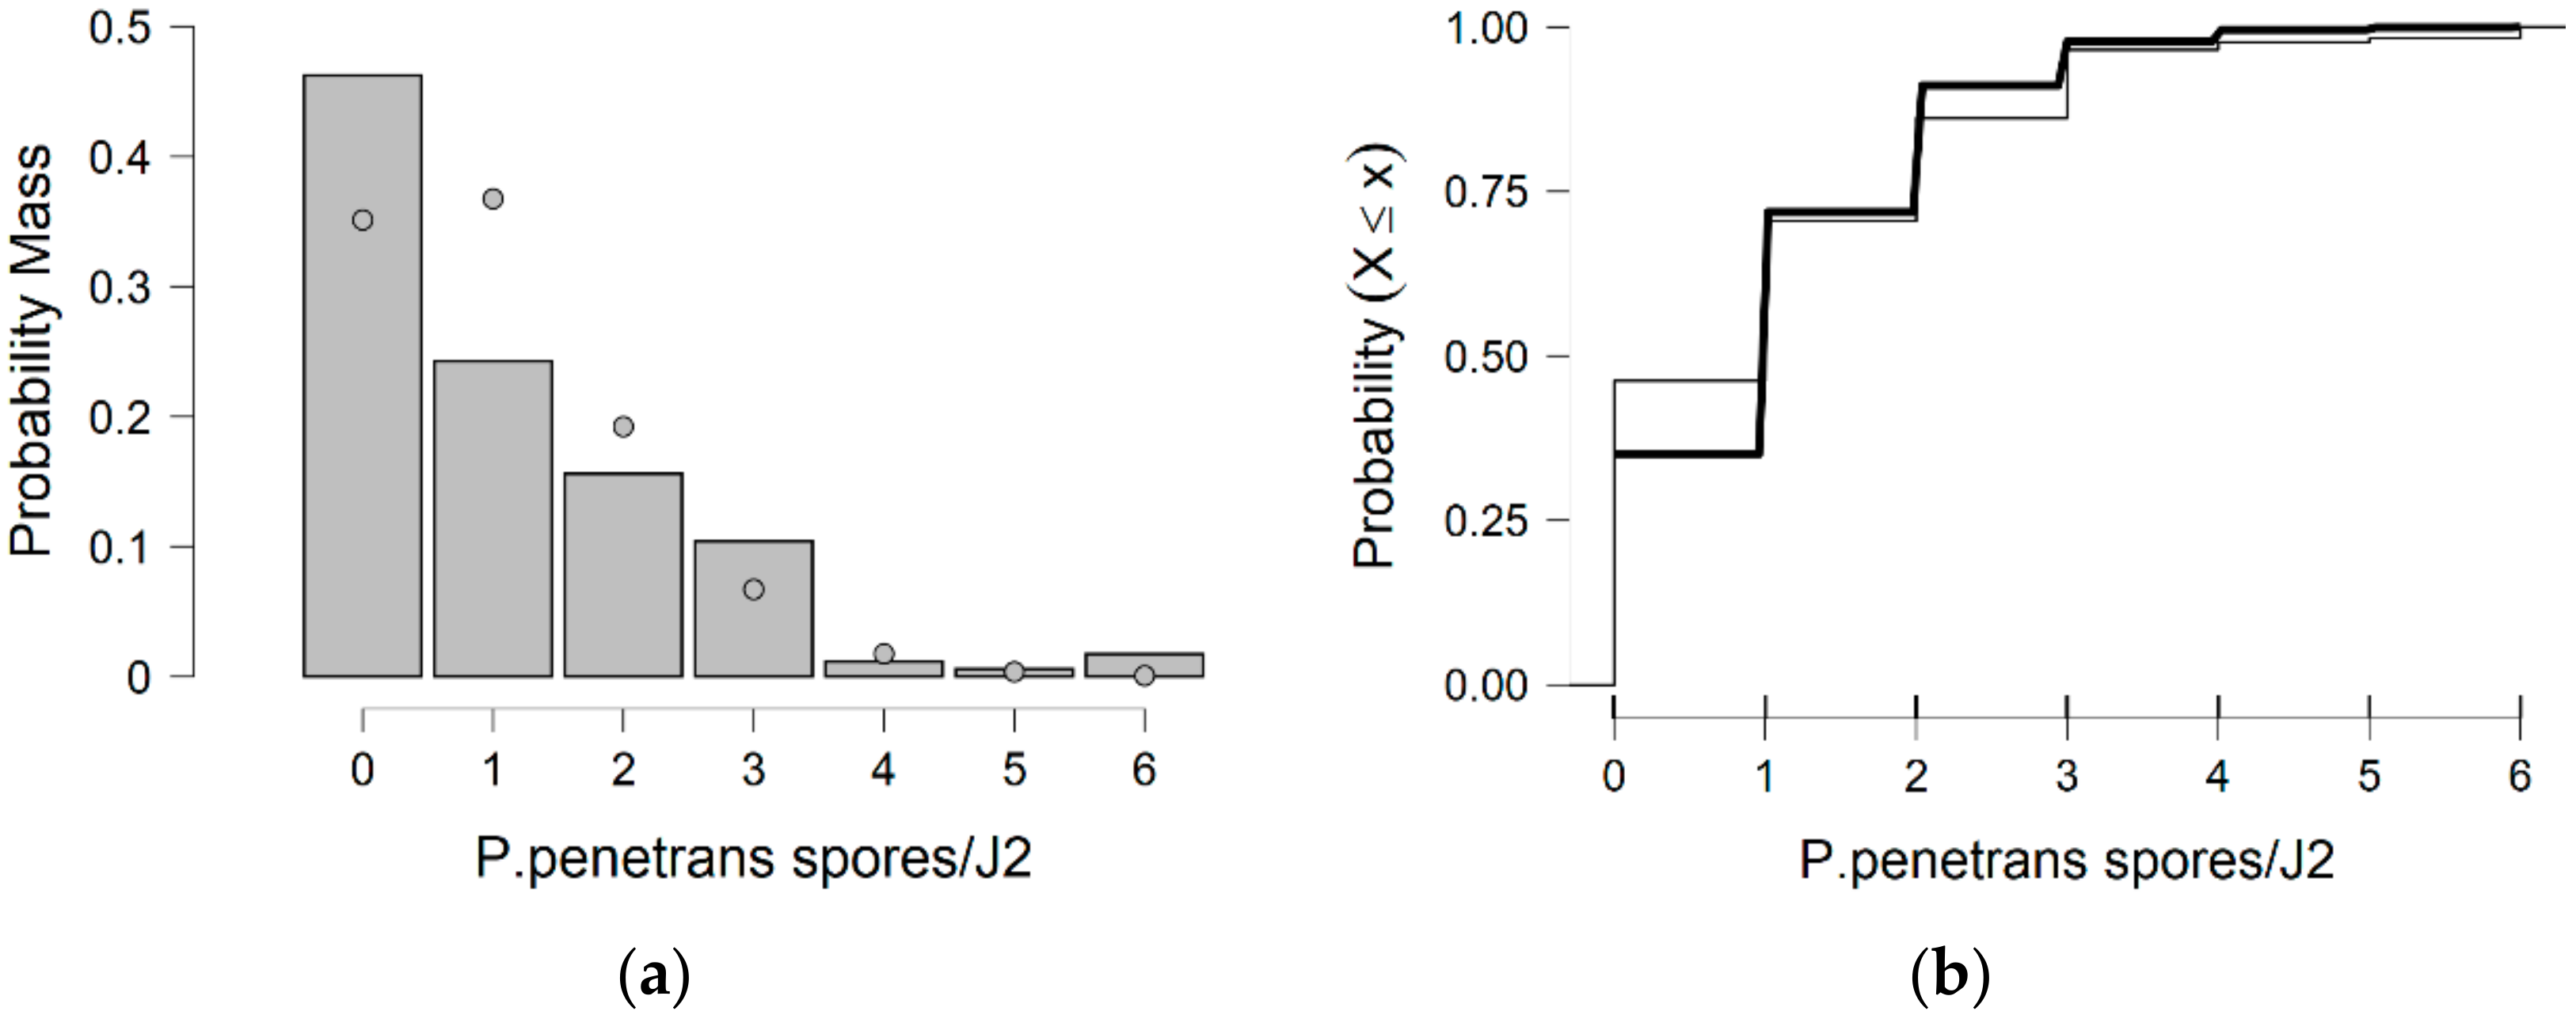
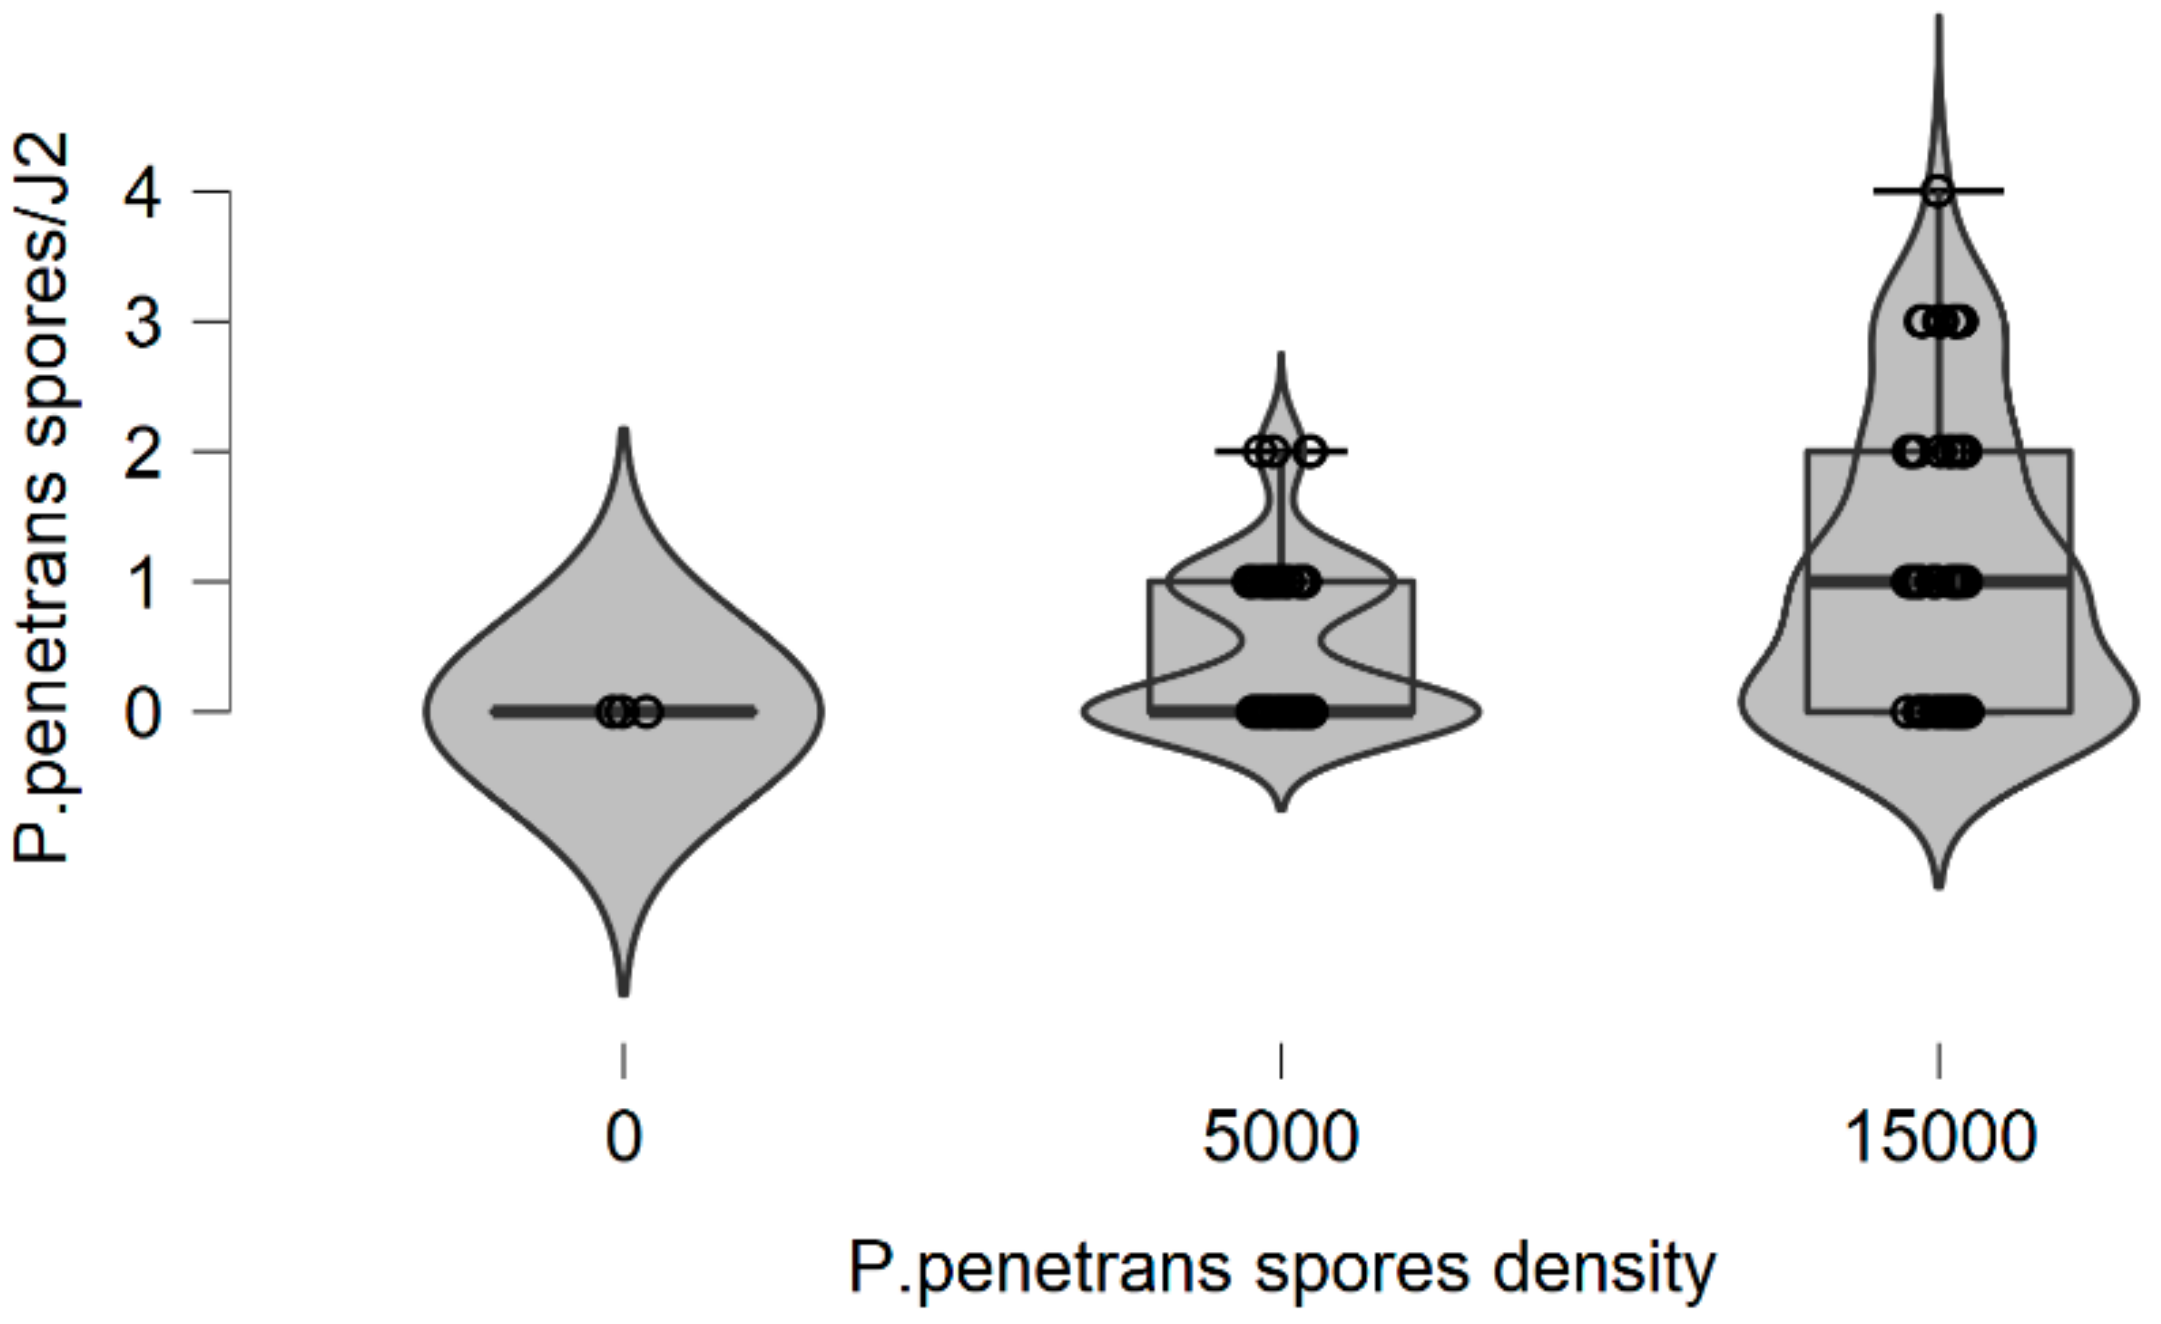
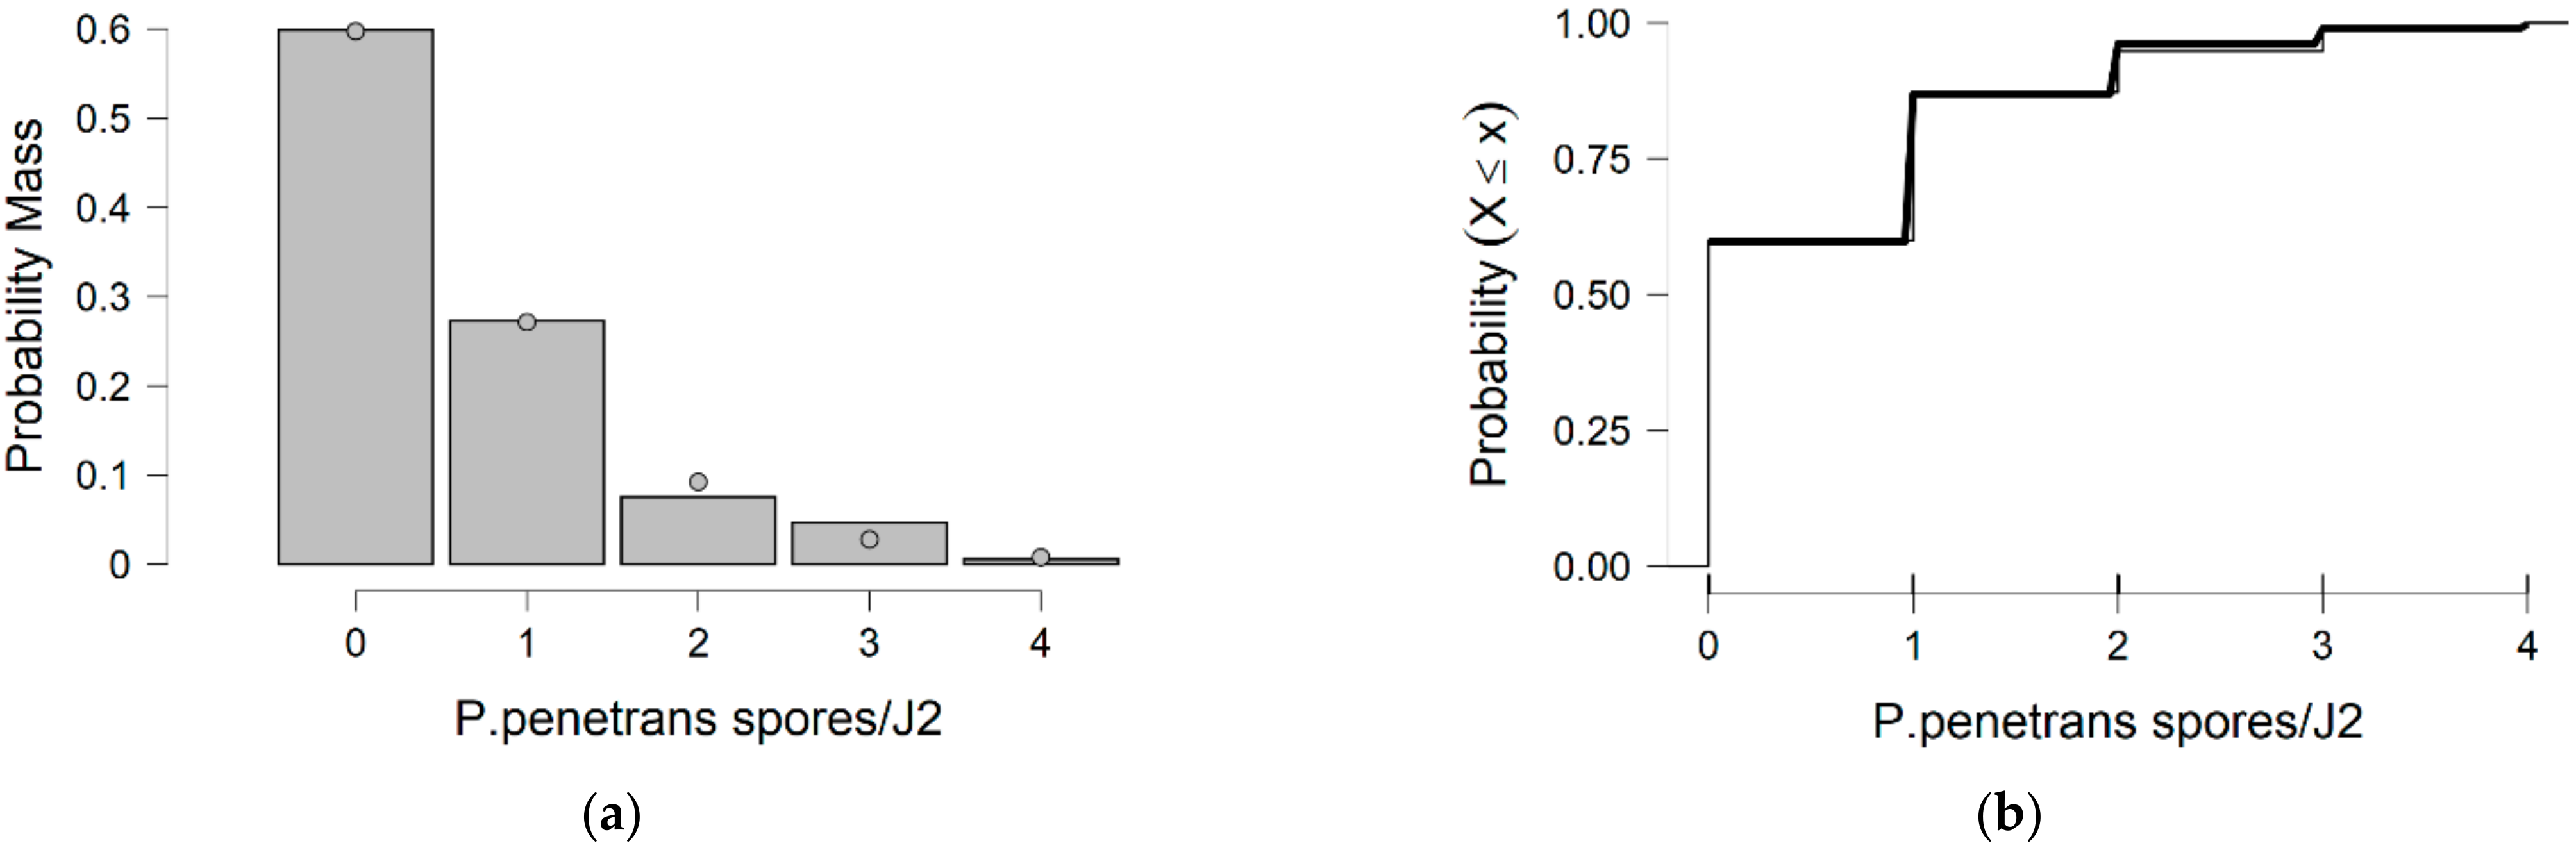
In more detail, the data presented in this study were collected from the observed values of P. penetrans spore’s attachment to nematodes and the predicted values were mainly developed by the Poisson and negative binomial distributions. The P. penetrans spore’s attachment was modeled at one concentration (5000 spores), in water and the soil bioassay, at four times of exposure (1, 3, 6, and 9 h) and (12, 24, 26, and 48 h), respectively. In the water bioassay, the modeling approaches discussed above confirmed that the Poisson distribution is a sufficient model for nematode populations limited to 1 h of exposure. Interestingly, the mean is equal to the variance suggesting ‘under-dispersion’. The same results were presented for the loam soil bioassay, suggesting the ‘under-dispersion’ phenomenon.
The negative binomial distribution is considered the most appropriate model to fit the data sets for the sandy loam soil and in the water bioassay at 3, 6, and 9 h of exposure. The data show that for sandy loam soil and in a water bioassay, the negative binomial distribution can model ‘overdispersed’ data sets. It is well known that, in nature, several distributions—which were devised for series in which the variance is significantly higher than the mean—showed that the ‘overdispersion’ phenomenon is mainly explained by the negative binomial model [34,36,37,38,39,40] or other discrete distributions such as the extended biparametric Waring and the univariate generalized Waring distributions [41,42,43,44].
In general, for the inference of the count data, the four most commonly used statistical model distributions are the Poisson, negative binomial, hurdle, and zero-inflated regression models. The hurdle and zero-inflated regression models are used to handle the distribution of the count outcome with excess zeroes, a phenomenon that did not occur in our data. The negative binomial model addresses the issue of overdispersion by including a dispersion parameter that relaxes the presumption of equal mean and variance in the distribution.
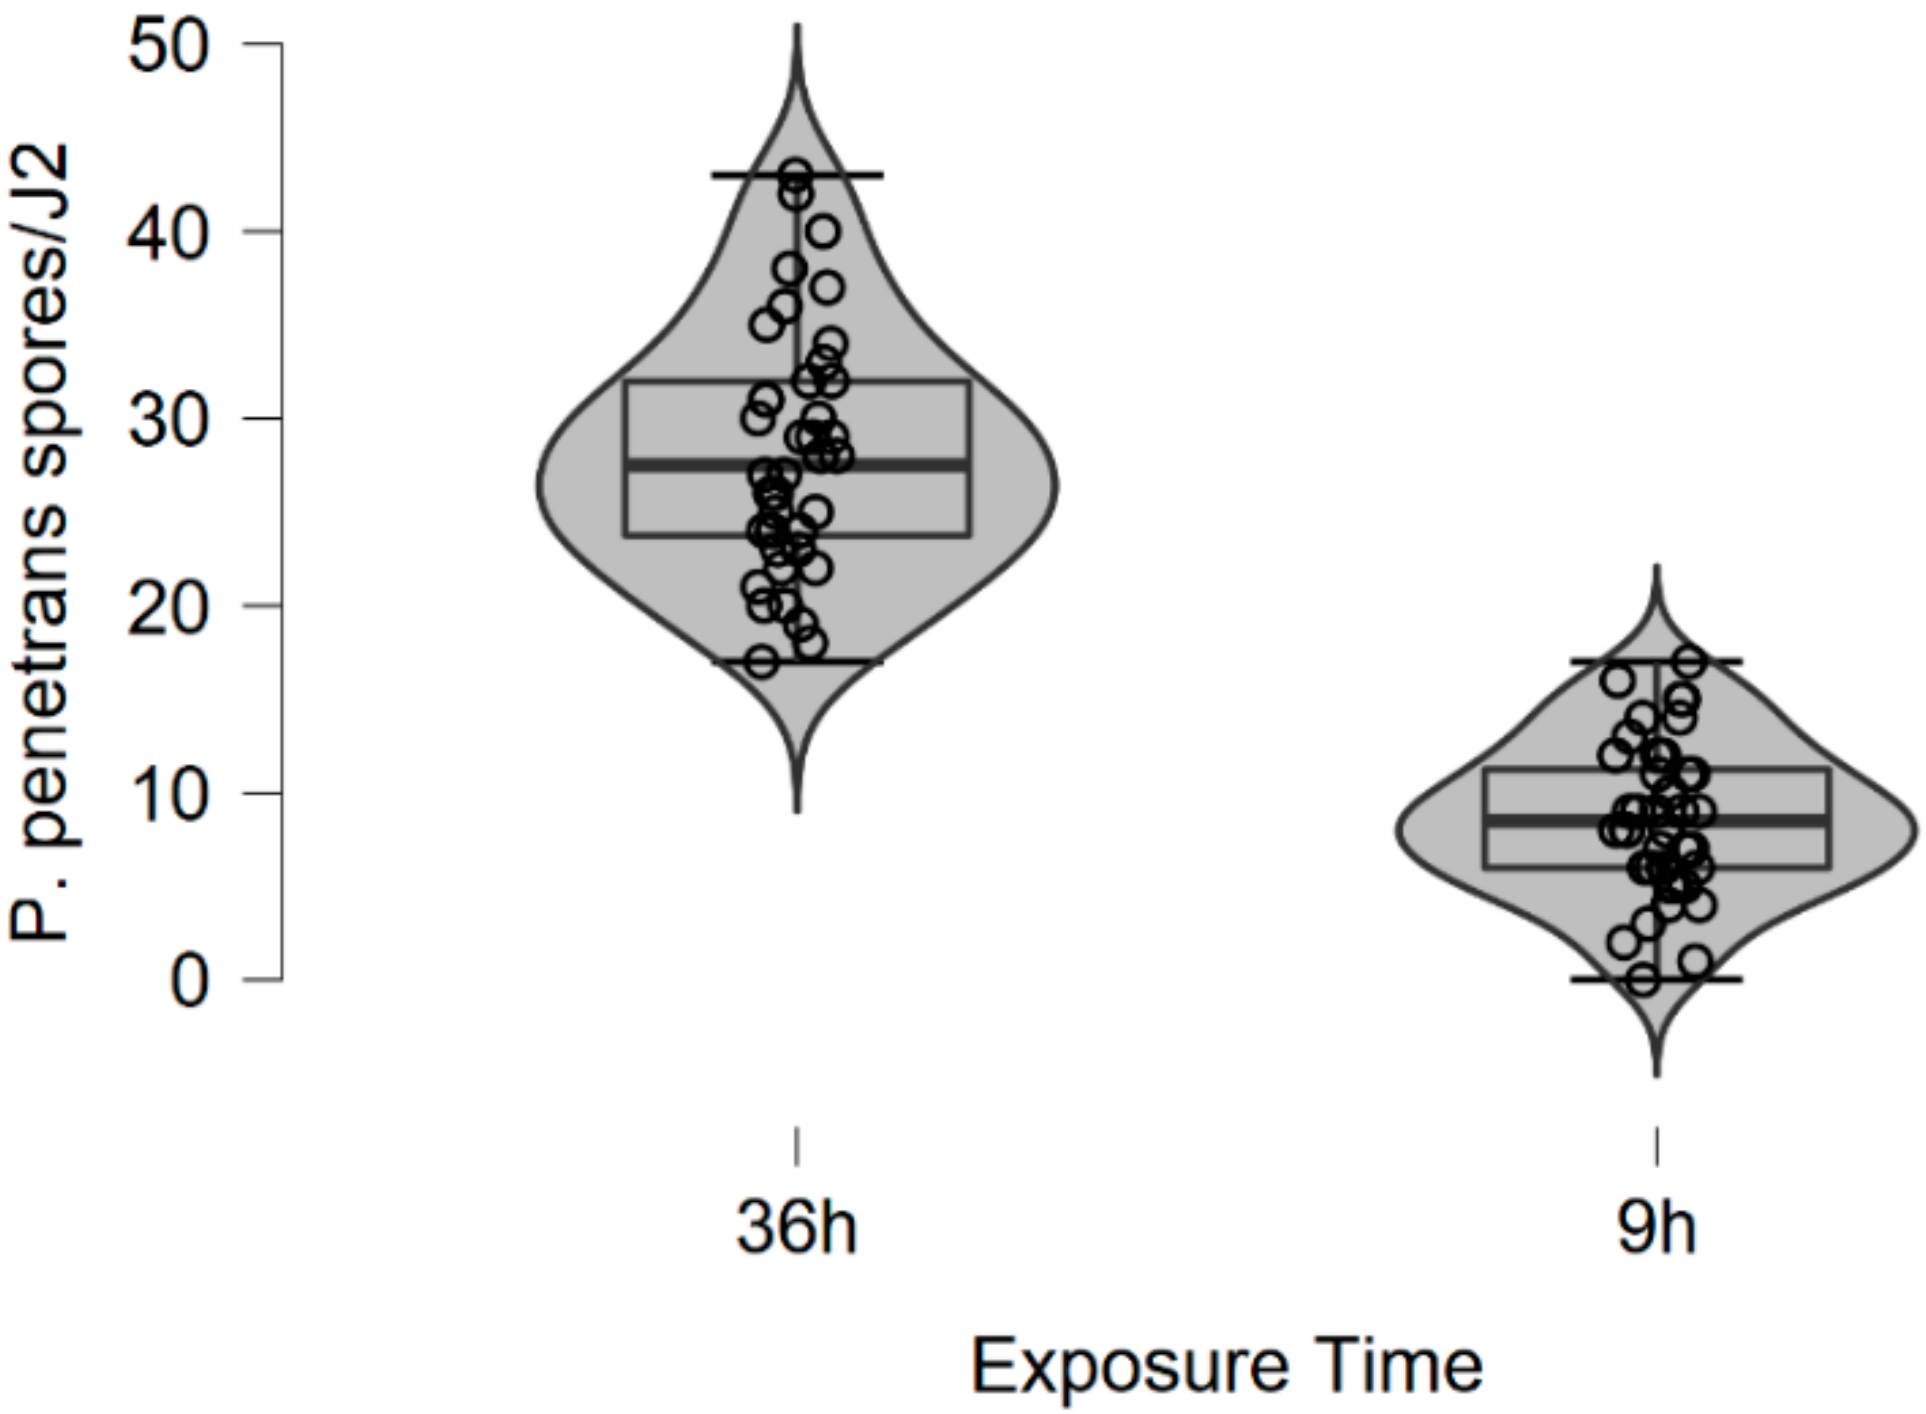
In this research, soil data show that, after 36 h of J2s exposure to P. penetrans spores, high numbers of P. penetrans spores/nematodes were observed and the negative binomial distribution was proposed as the most efficient model for overdispersed data sets, particularly for sandy loam soil. A thorough classification of the negative binomial distribution could be evidence of nematodes encountering clumps of spores. This is true as the odds ratio is 2.831, indicating that these nematodes encounter clumps of nearly three spores, an important result which corrects previous research studies [22,25,26]. Moreover, in the sandy loam soil bioassay, it was demonstrated that those clumps of P. penetrans spores affected the nematodes invasion rate.
In this paper, we focused on determining the number of P. penetrans attached to J2s cuticle. From this study, it was assumed that the water bioassay observation agrees with the study completed by sandy loam soil, suggesting that when J2s encumbered with >15 spores/juvenile, a possible halt of nematode in the soil could be caused. The same results were reported by Davies et al. [24], where it was commented that when J2s encumbered with >15 spores/juvenile, resulting in a reduction in the invasion level of >70%. The same observation was also mentioned in a previous research study completed by the authors [25,26], where it was shown that the P. penetrans spores attached to the nematode cuticle appeared to have a significant impact on nematode’s movement (nematode turns, etc.,) which may play a significant role in the nematode distribution and mobility. These results are also observed in the soil. Our data present that when nematodes are encumbered with 3–10 spores of P. penetrans then they are always overdispersed. On the other hand, when nematodes are encumbered with >10 P. penetrans spores, the invasion rate is less than 70%, a result which corrects a previous research study [22,26].
In this research, there is evidence that the soil type, (particularly the sandy soil), appears to have a significant impact on P. penetrans spore’s attachment and thus nematode invasion. Based upon this, significant data are presented suggesting that fewer nematodes invade plant roots when they are encumbered with 3–10 or 4.5–8 P. penetrans spores.
This impact of the soil type also significantly affected the nematodes‘ establishment on the tomato root system when J2s were encumbered with 6–7 P. penetrans spores, and possibly immobilized them in the soil when encumbered with >12 or 15 P. penetrans spores, especially in the sandy loam soil.
In the examination of the variability of the attachment among sandy loam and loam soil, the negative binomial was not the most appropriate model to fit the loam bioassay data, suggesting an ‘under-dispersion’ or a probability of a failure [45,46] of P. penetrans spores attachment due to the stress environment occurred in the loam soil. A possible explanation caused the low rate of P. penetrans attachment at the loam soil may be due to sand contents. Sandy soils may exhibit an increasing rate of P. penetrans spores’ attachment whereas the absence of sand in loam soil causes attachment failure in clumps of spores. This can be seen as a particular case of our research concluded that the failure rate of attachment, e.g., nematodes being encumbered with fewer than three spores, is characterized by an increasing rate of invasion. At this point, we proposed that the gamma (γ) distribution can be used for modeling this phenomenon. Gamma (γ) distribution (as well as Weibull distribution, which was introduced as a second model in our data) may be considered as an under-dispersed extension of Poisson distribution. It is clear that if data exhibit overdispersion, then the variance is larger than the mean. On the other hand, if the data are under-dispersed and if mean = variance = λ, then the number of events in a given time period of length t follows a Poisson distribution with parameter λt. Whereas the Poisson distribution is the answer to this issue, any one step of Poisson mixture distributions assumes that there are only two sources of variability, the negative binomial distribution (which is a Poisson–gamma (γ) mixture) and the gamma (γ) distribution [44,47]. Based on that conclusion, it is necessary to mention here that, as the distribution of 
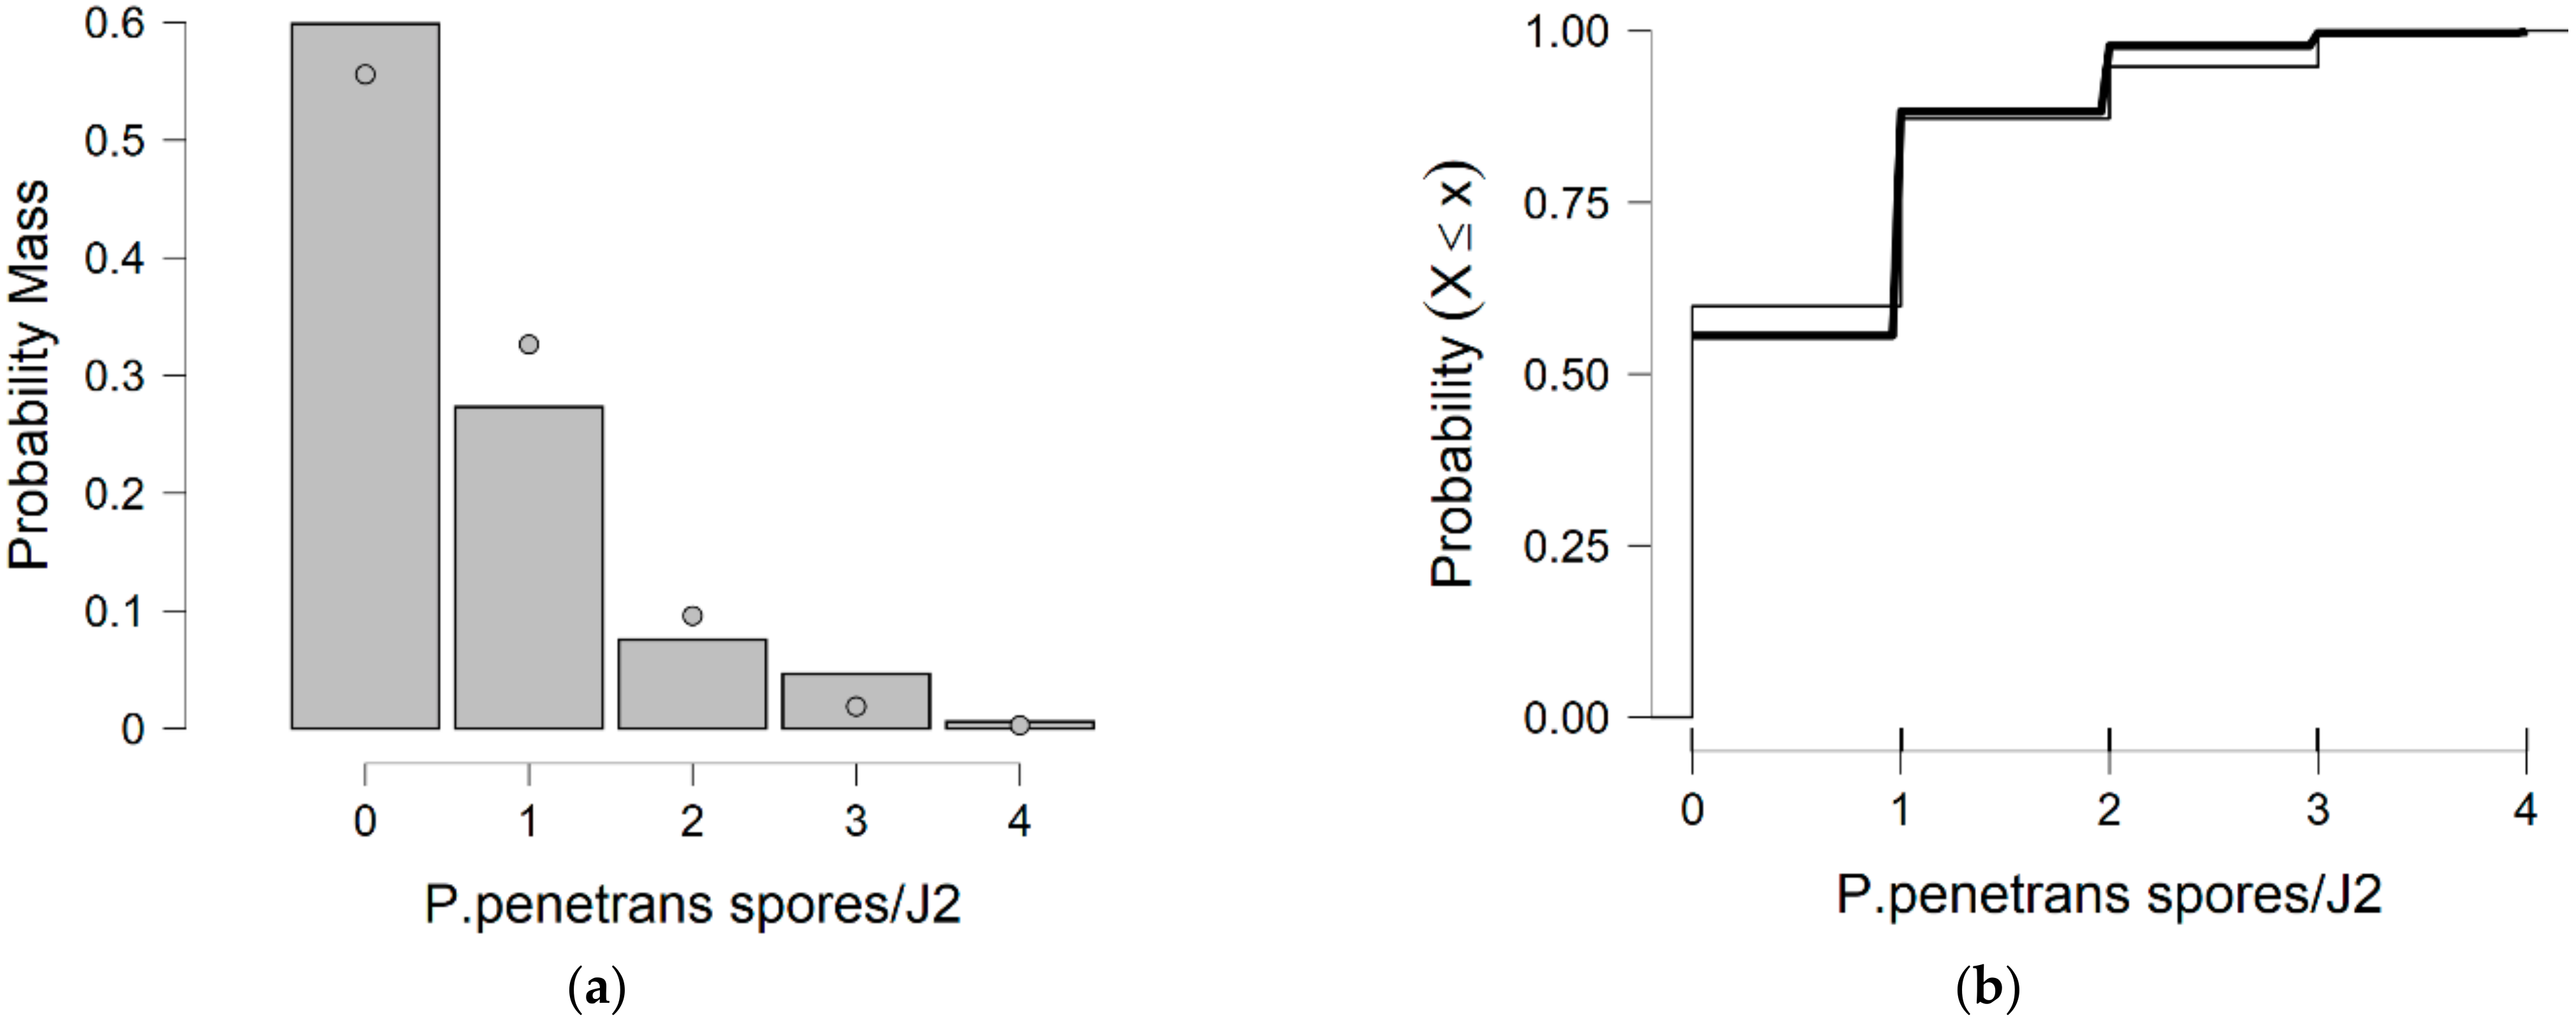
P. penetrans spores attachment is exposed to variance data (which make it of great interest for modeling overdispersed count data sets), a serious draw back to the variance decomposition occurs (as shown in Figure 13 and Figure 14), and it is difficult to determine which model is the most appropriate for referring to data proneness (e.g., the clumps of spores).
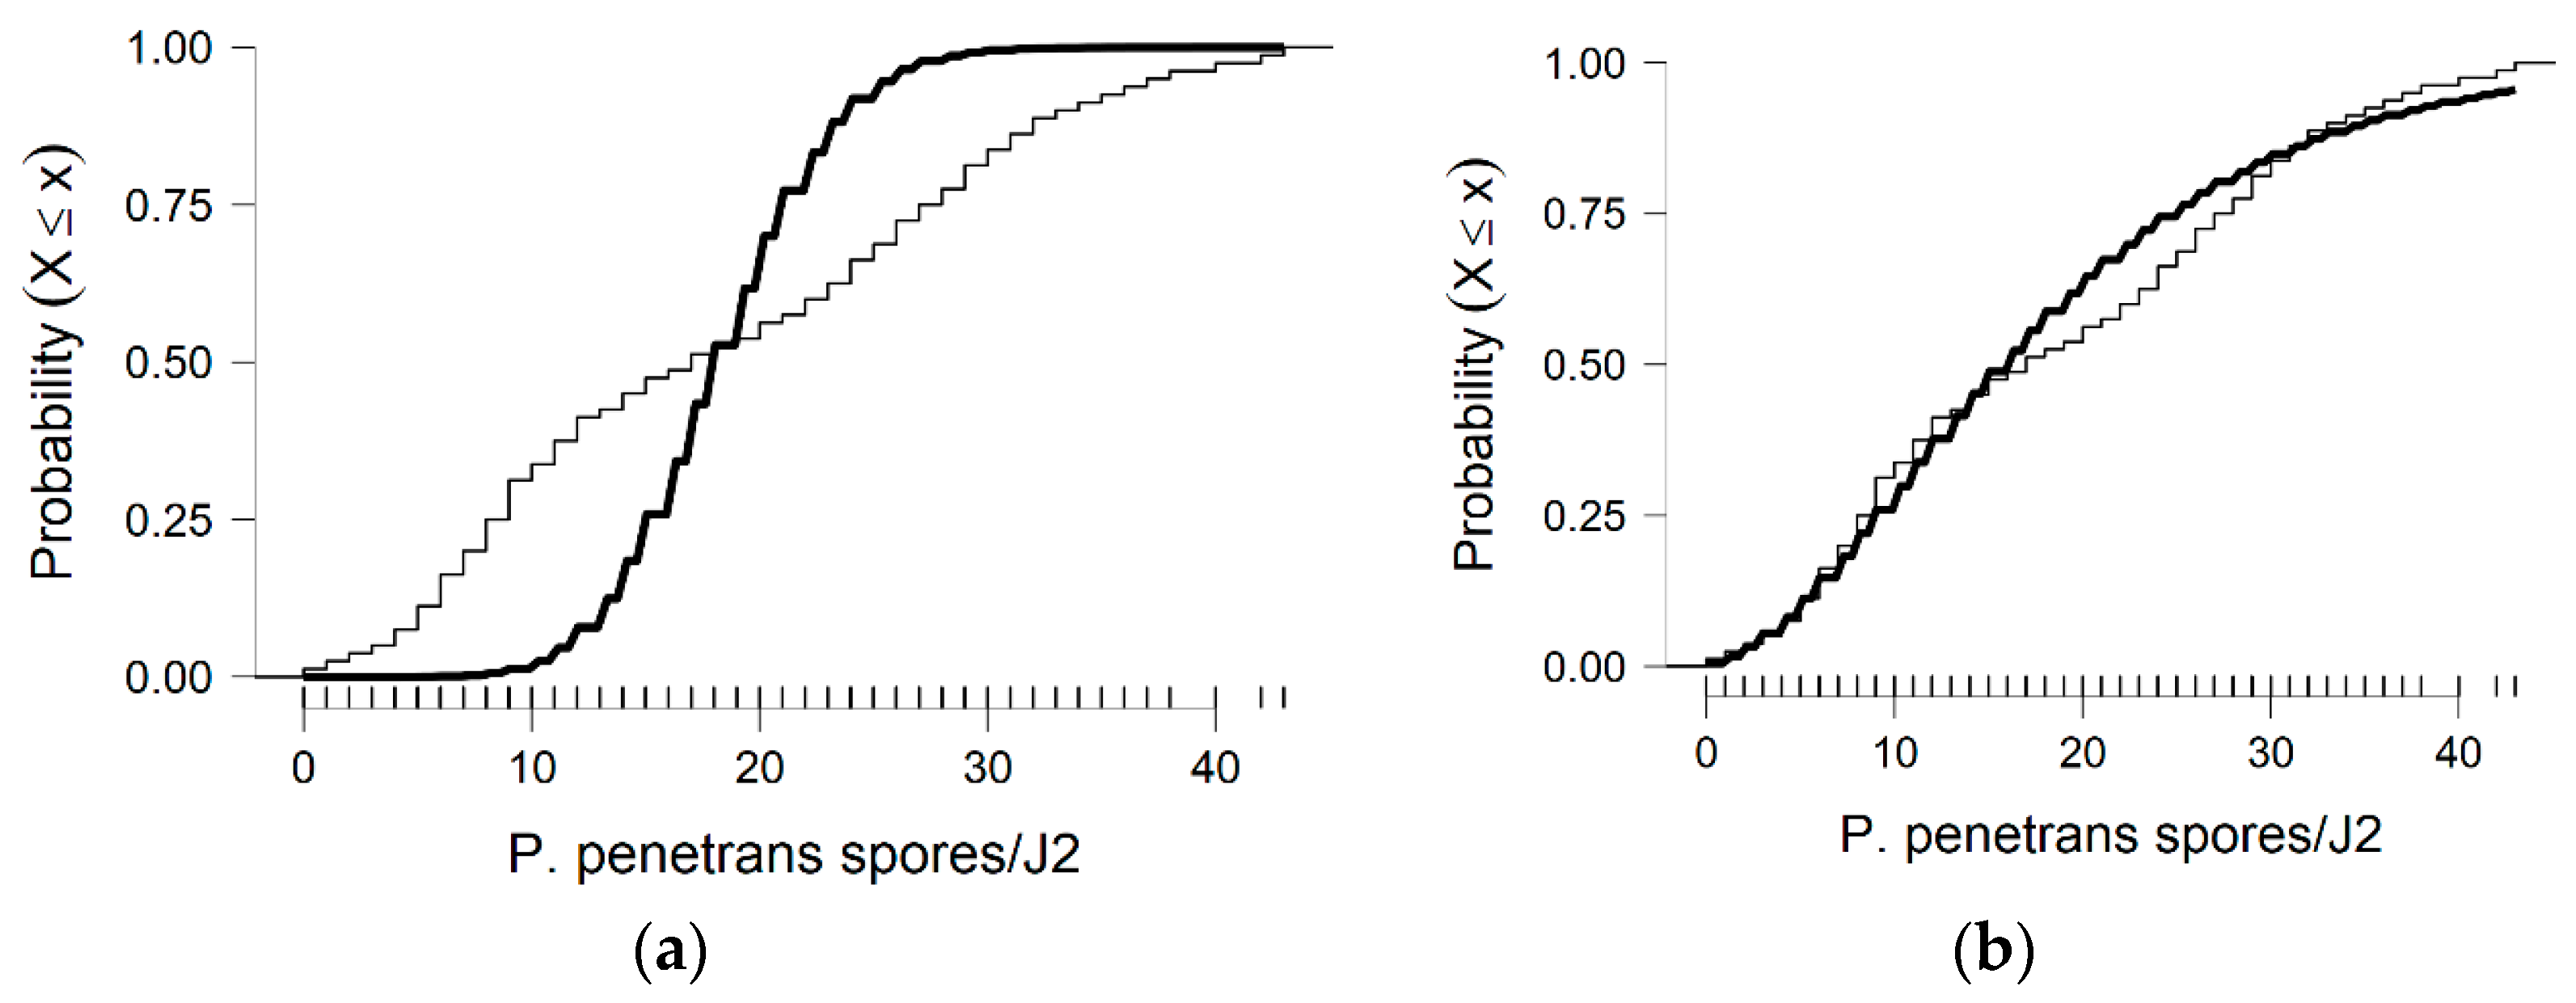
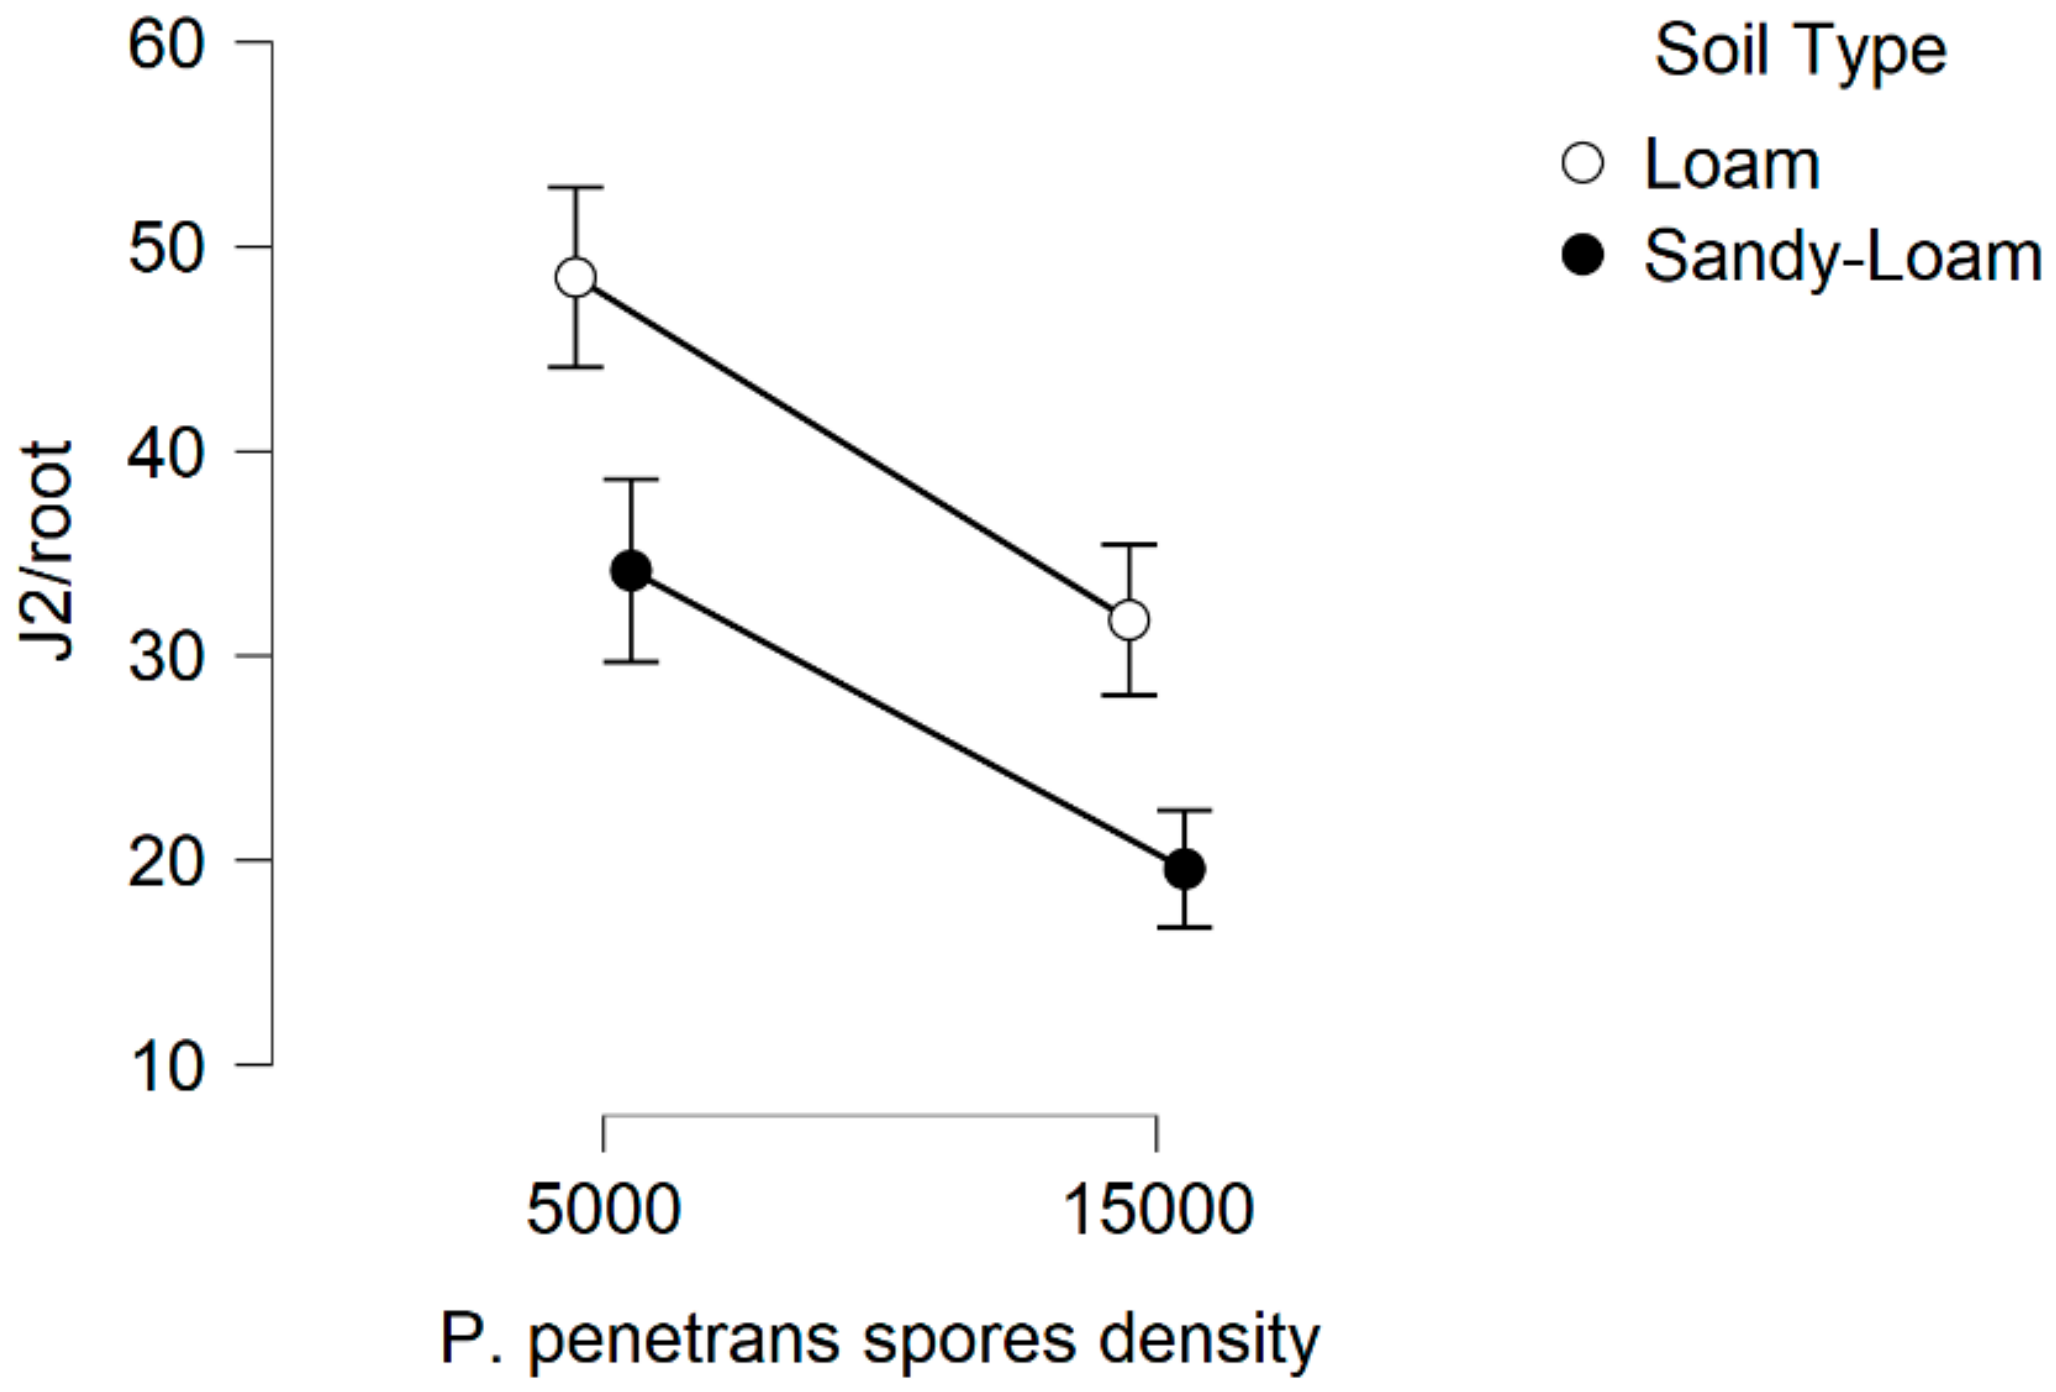
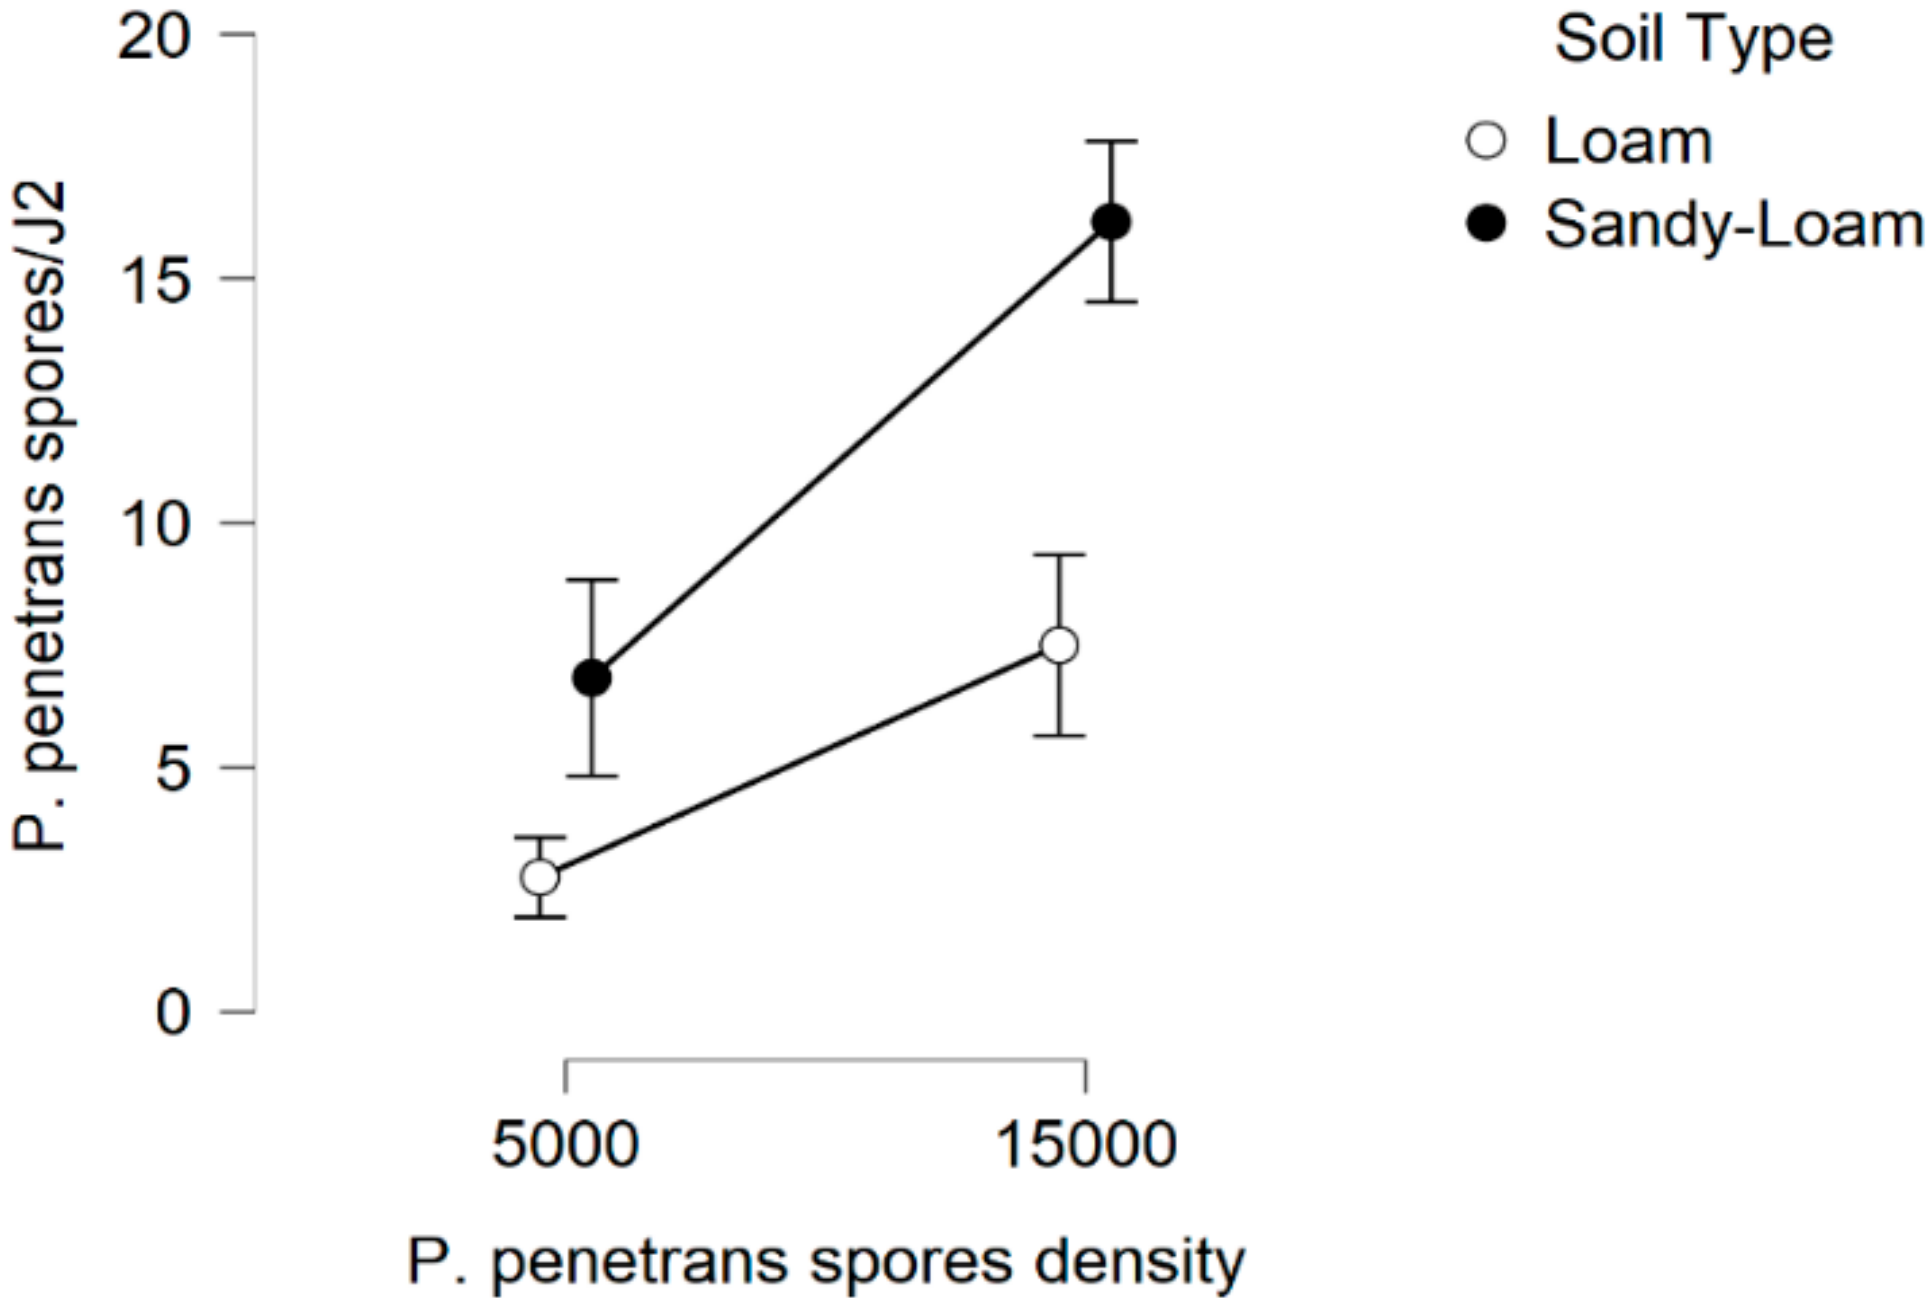
The estimates in the x and y axes of Figure 15 and 
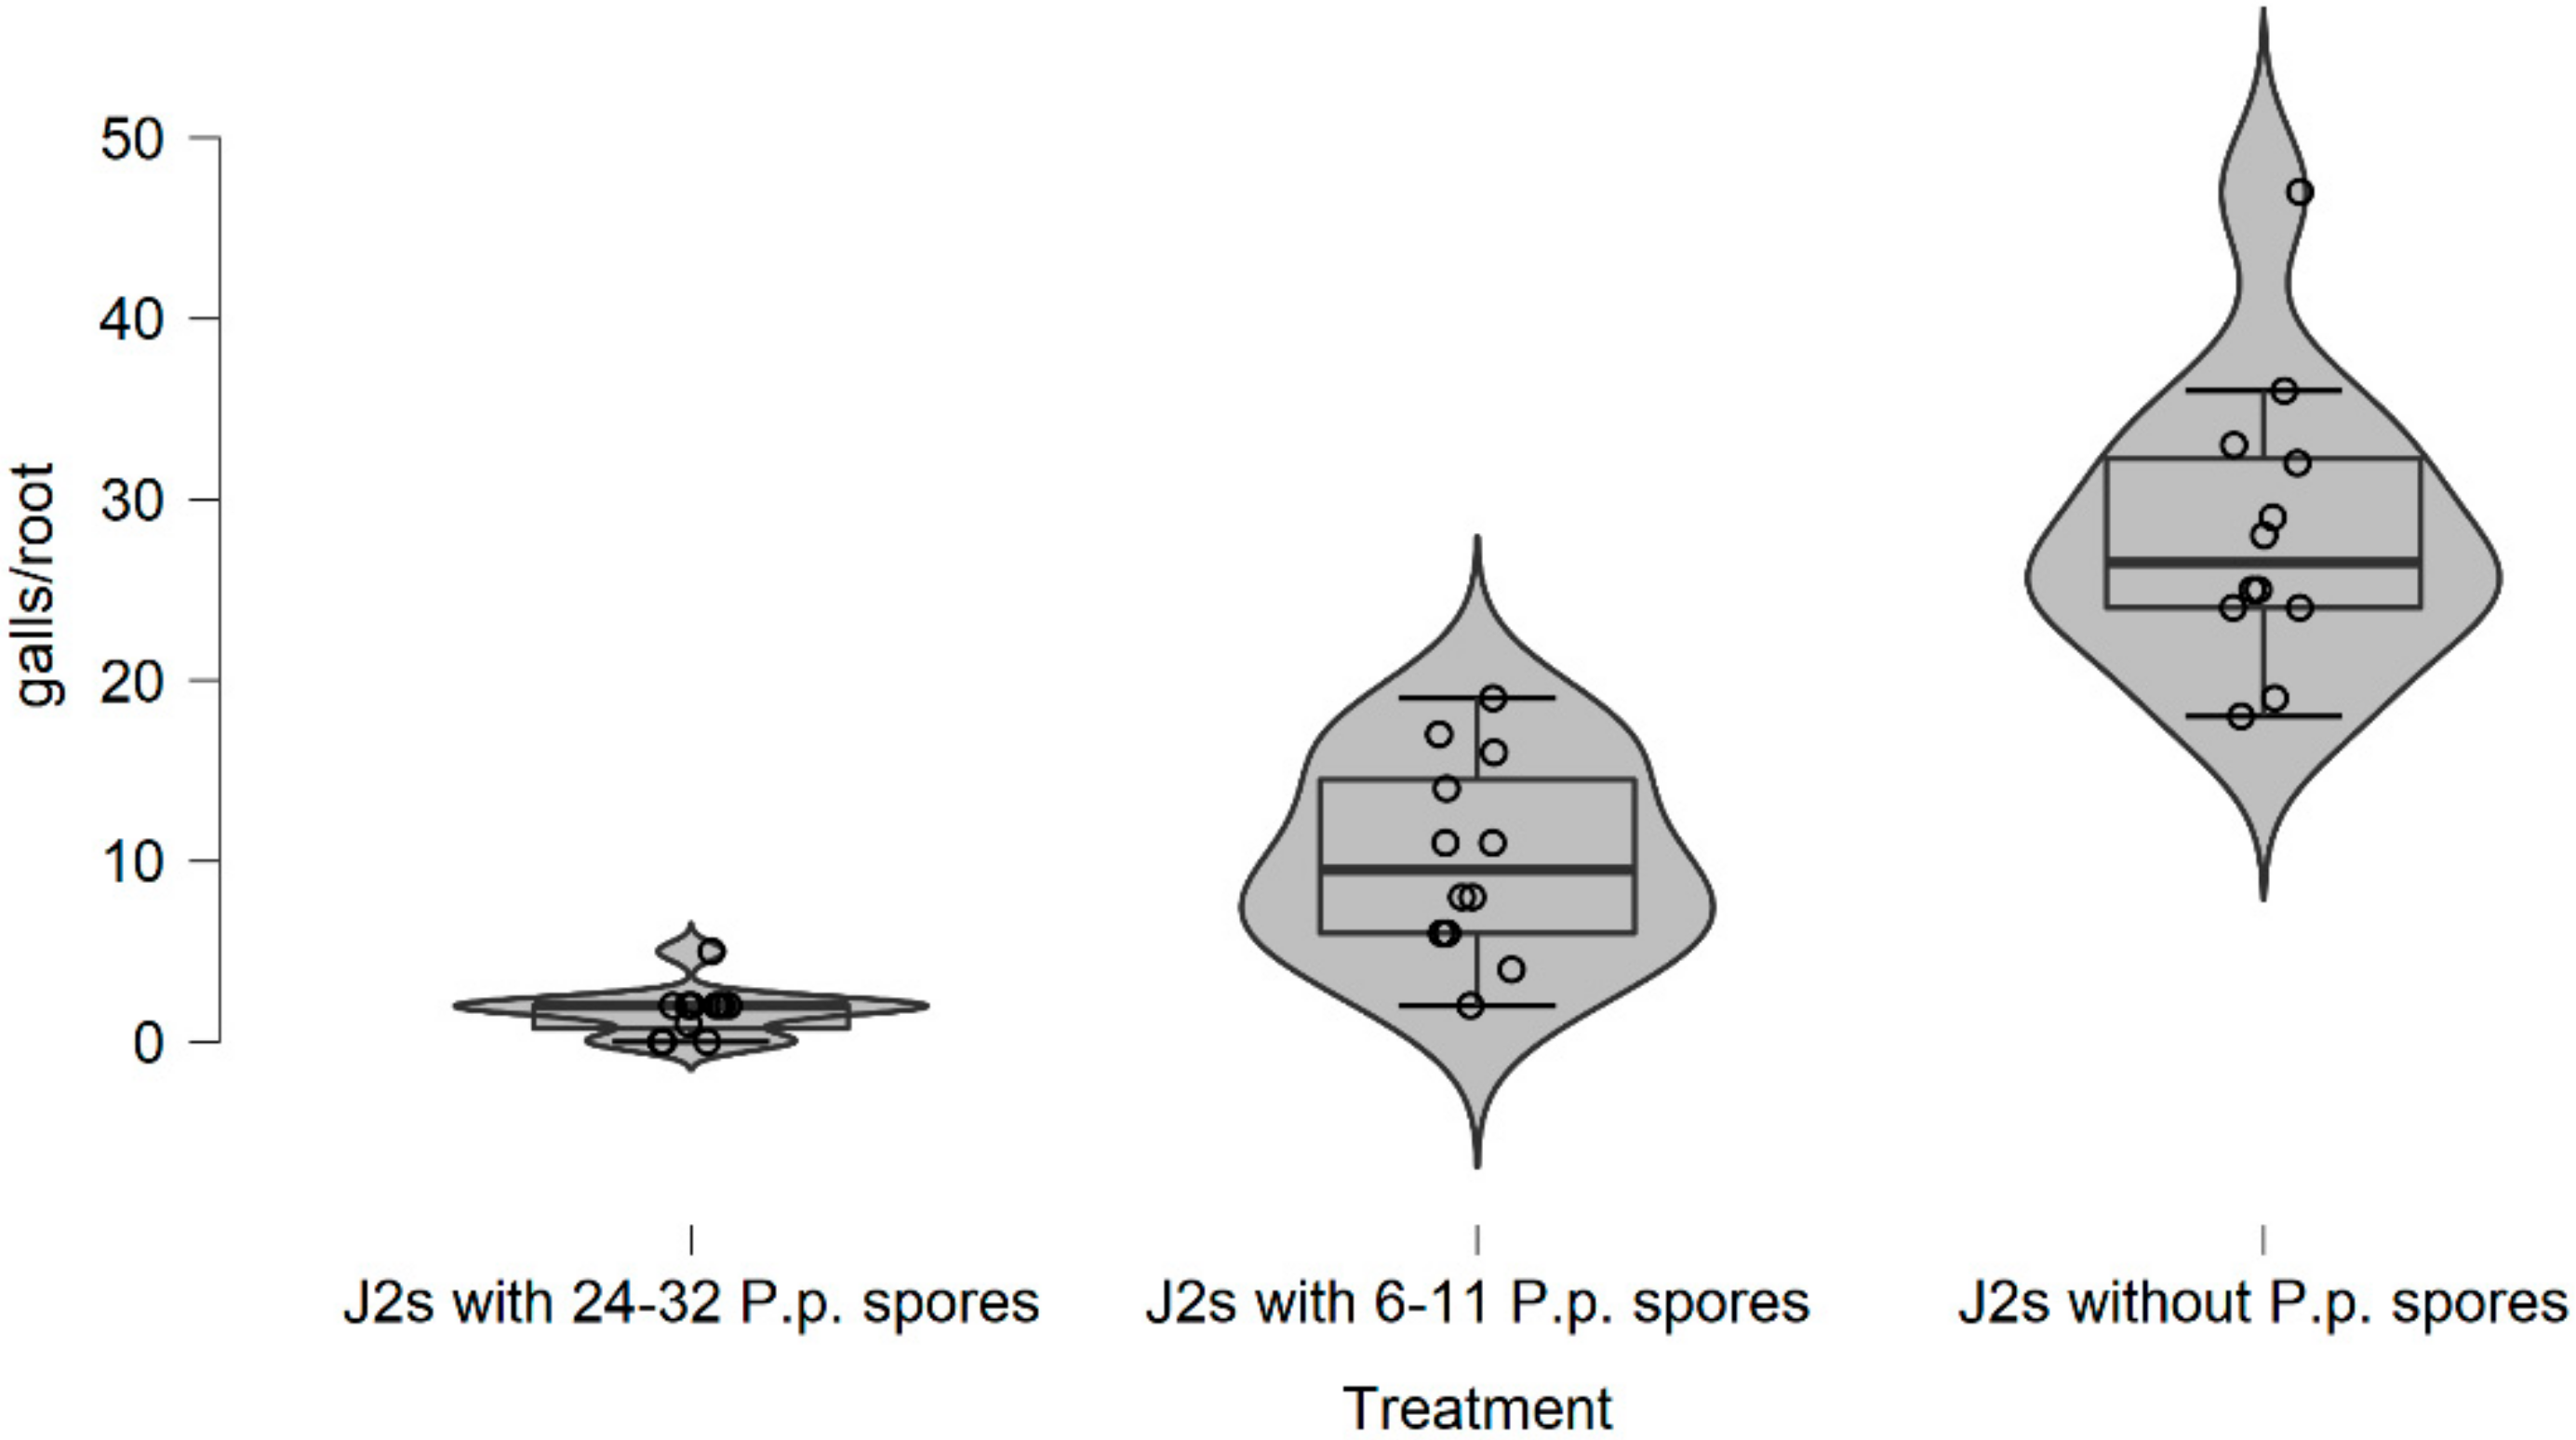
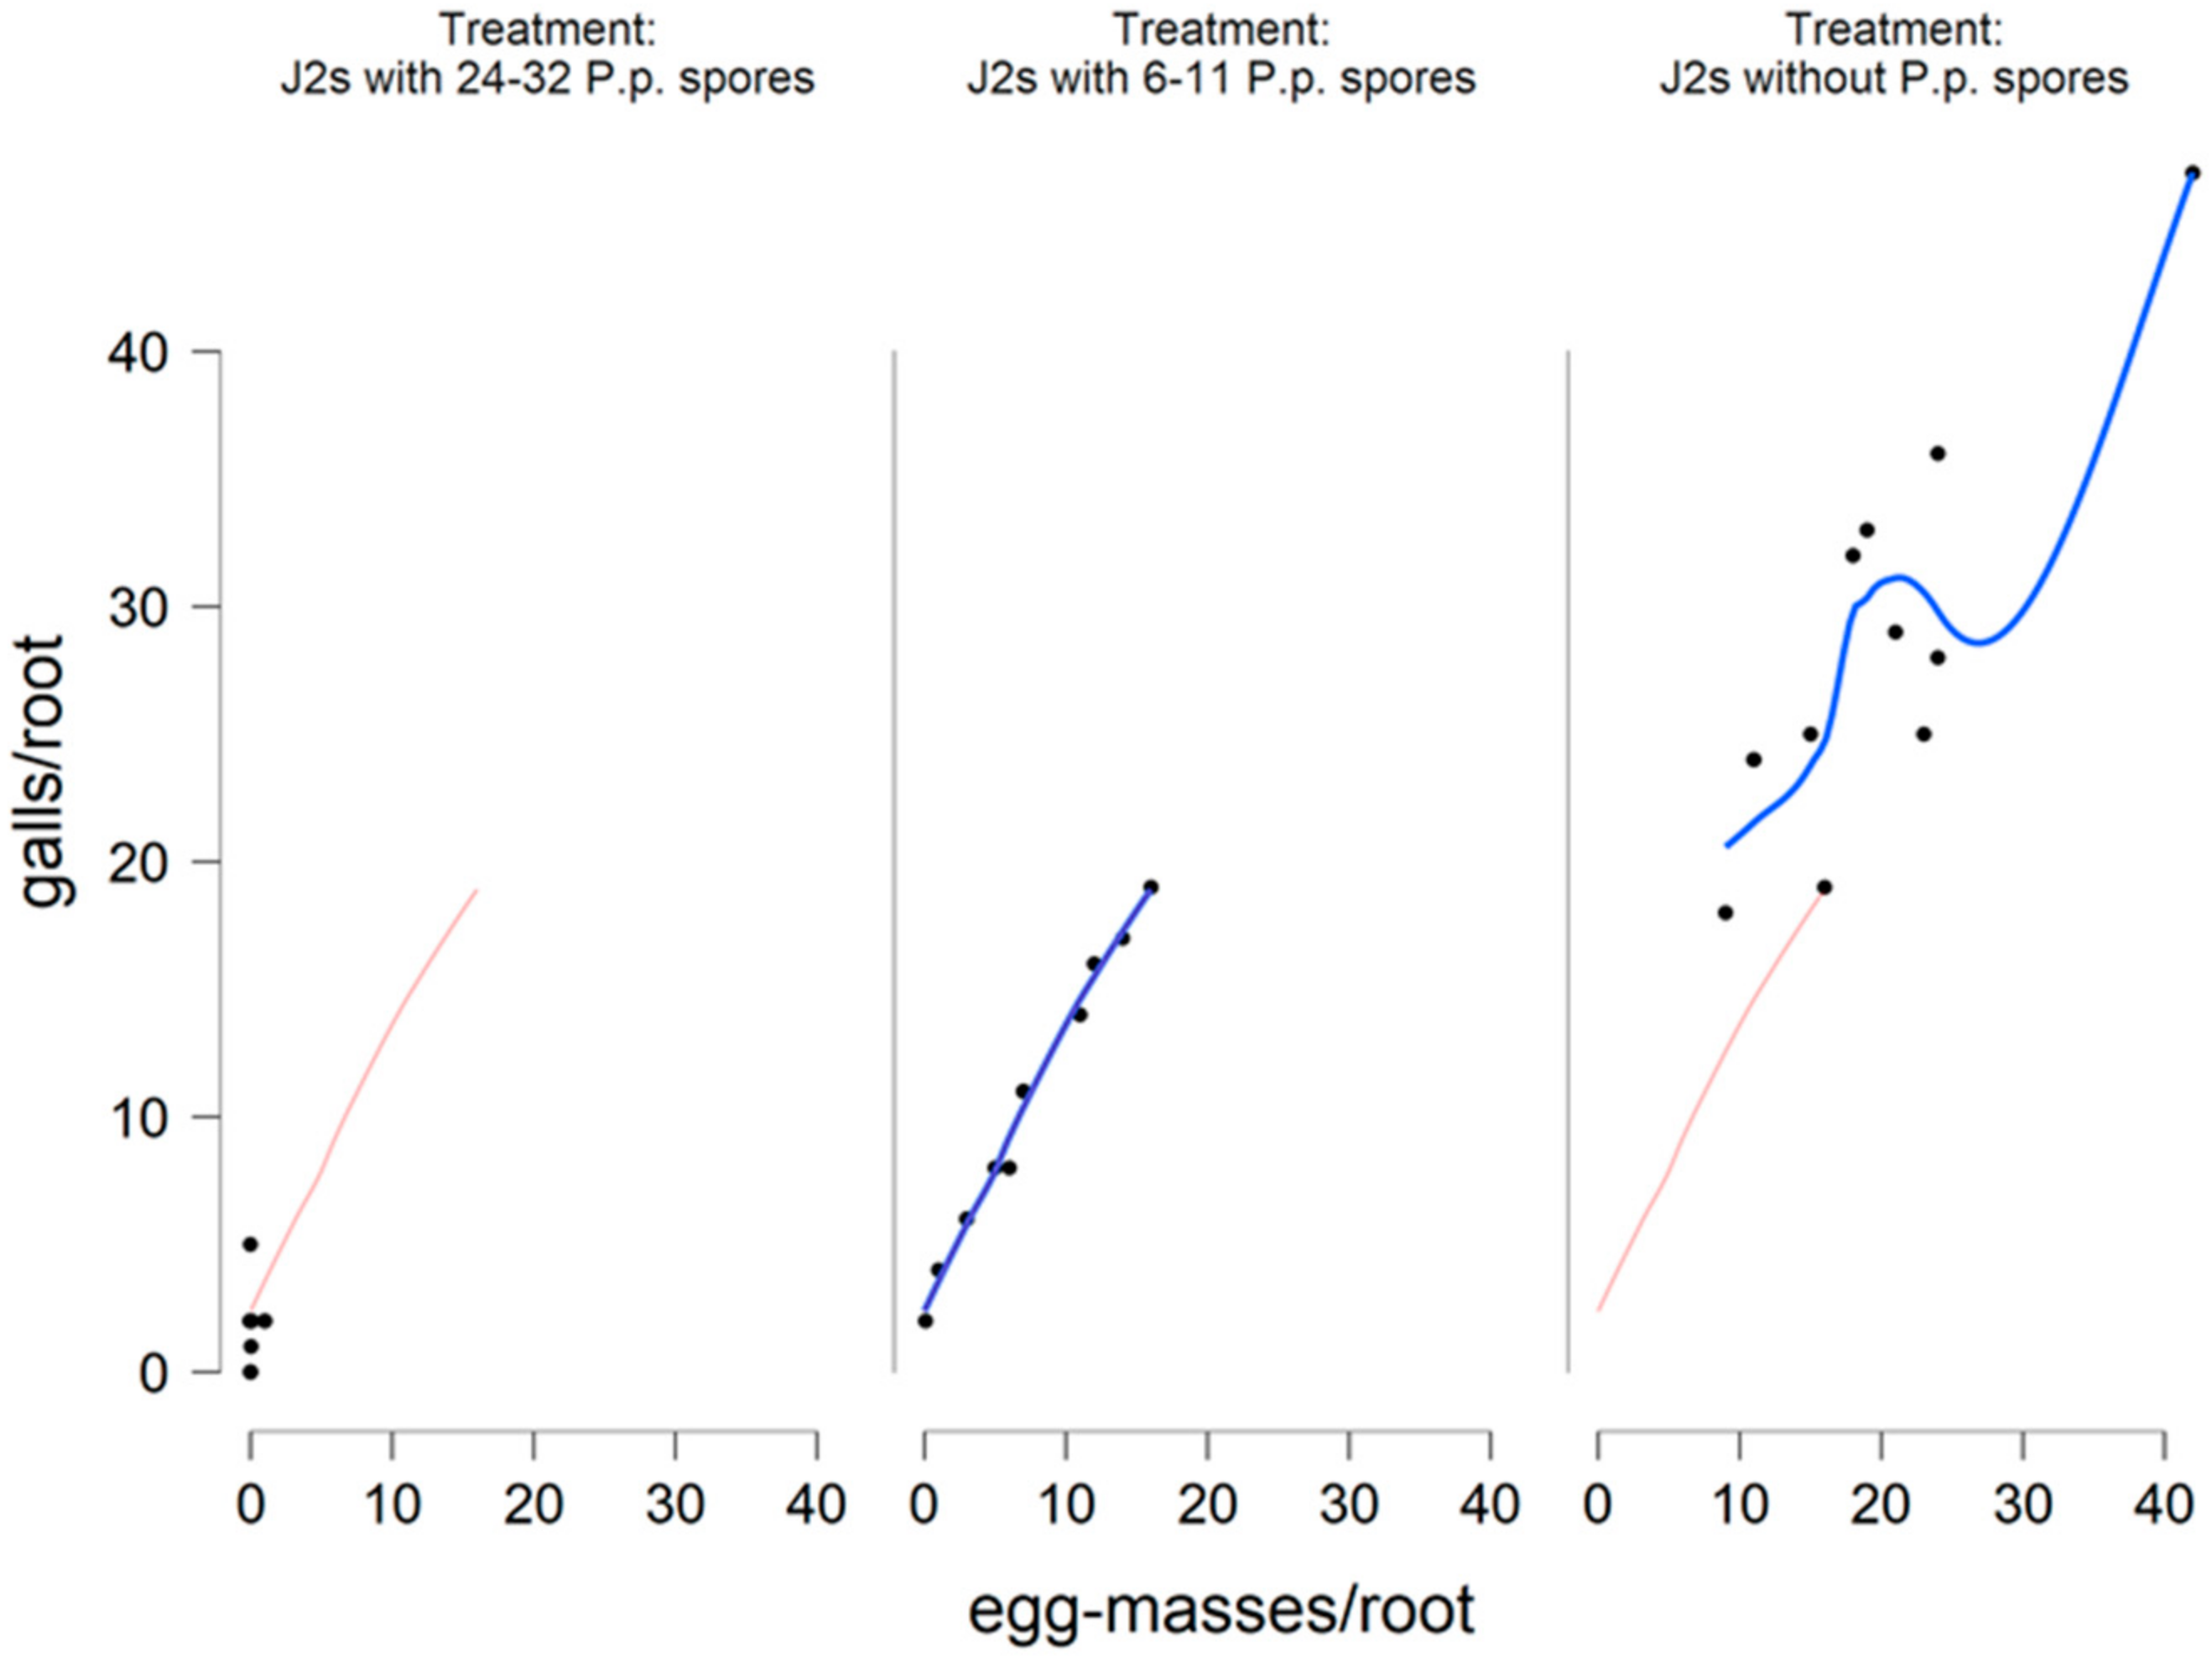
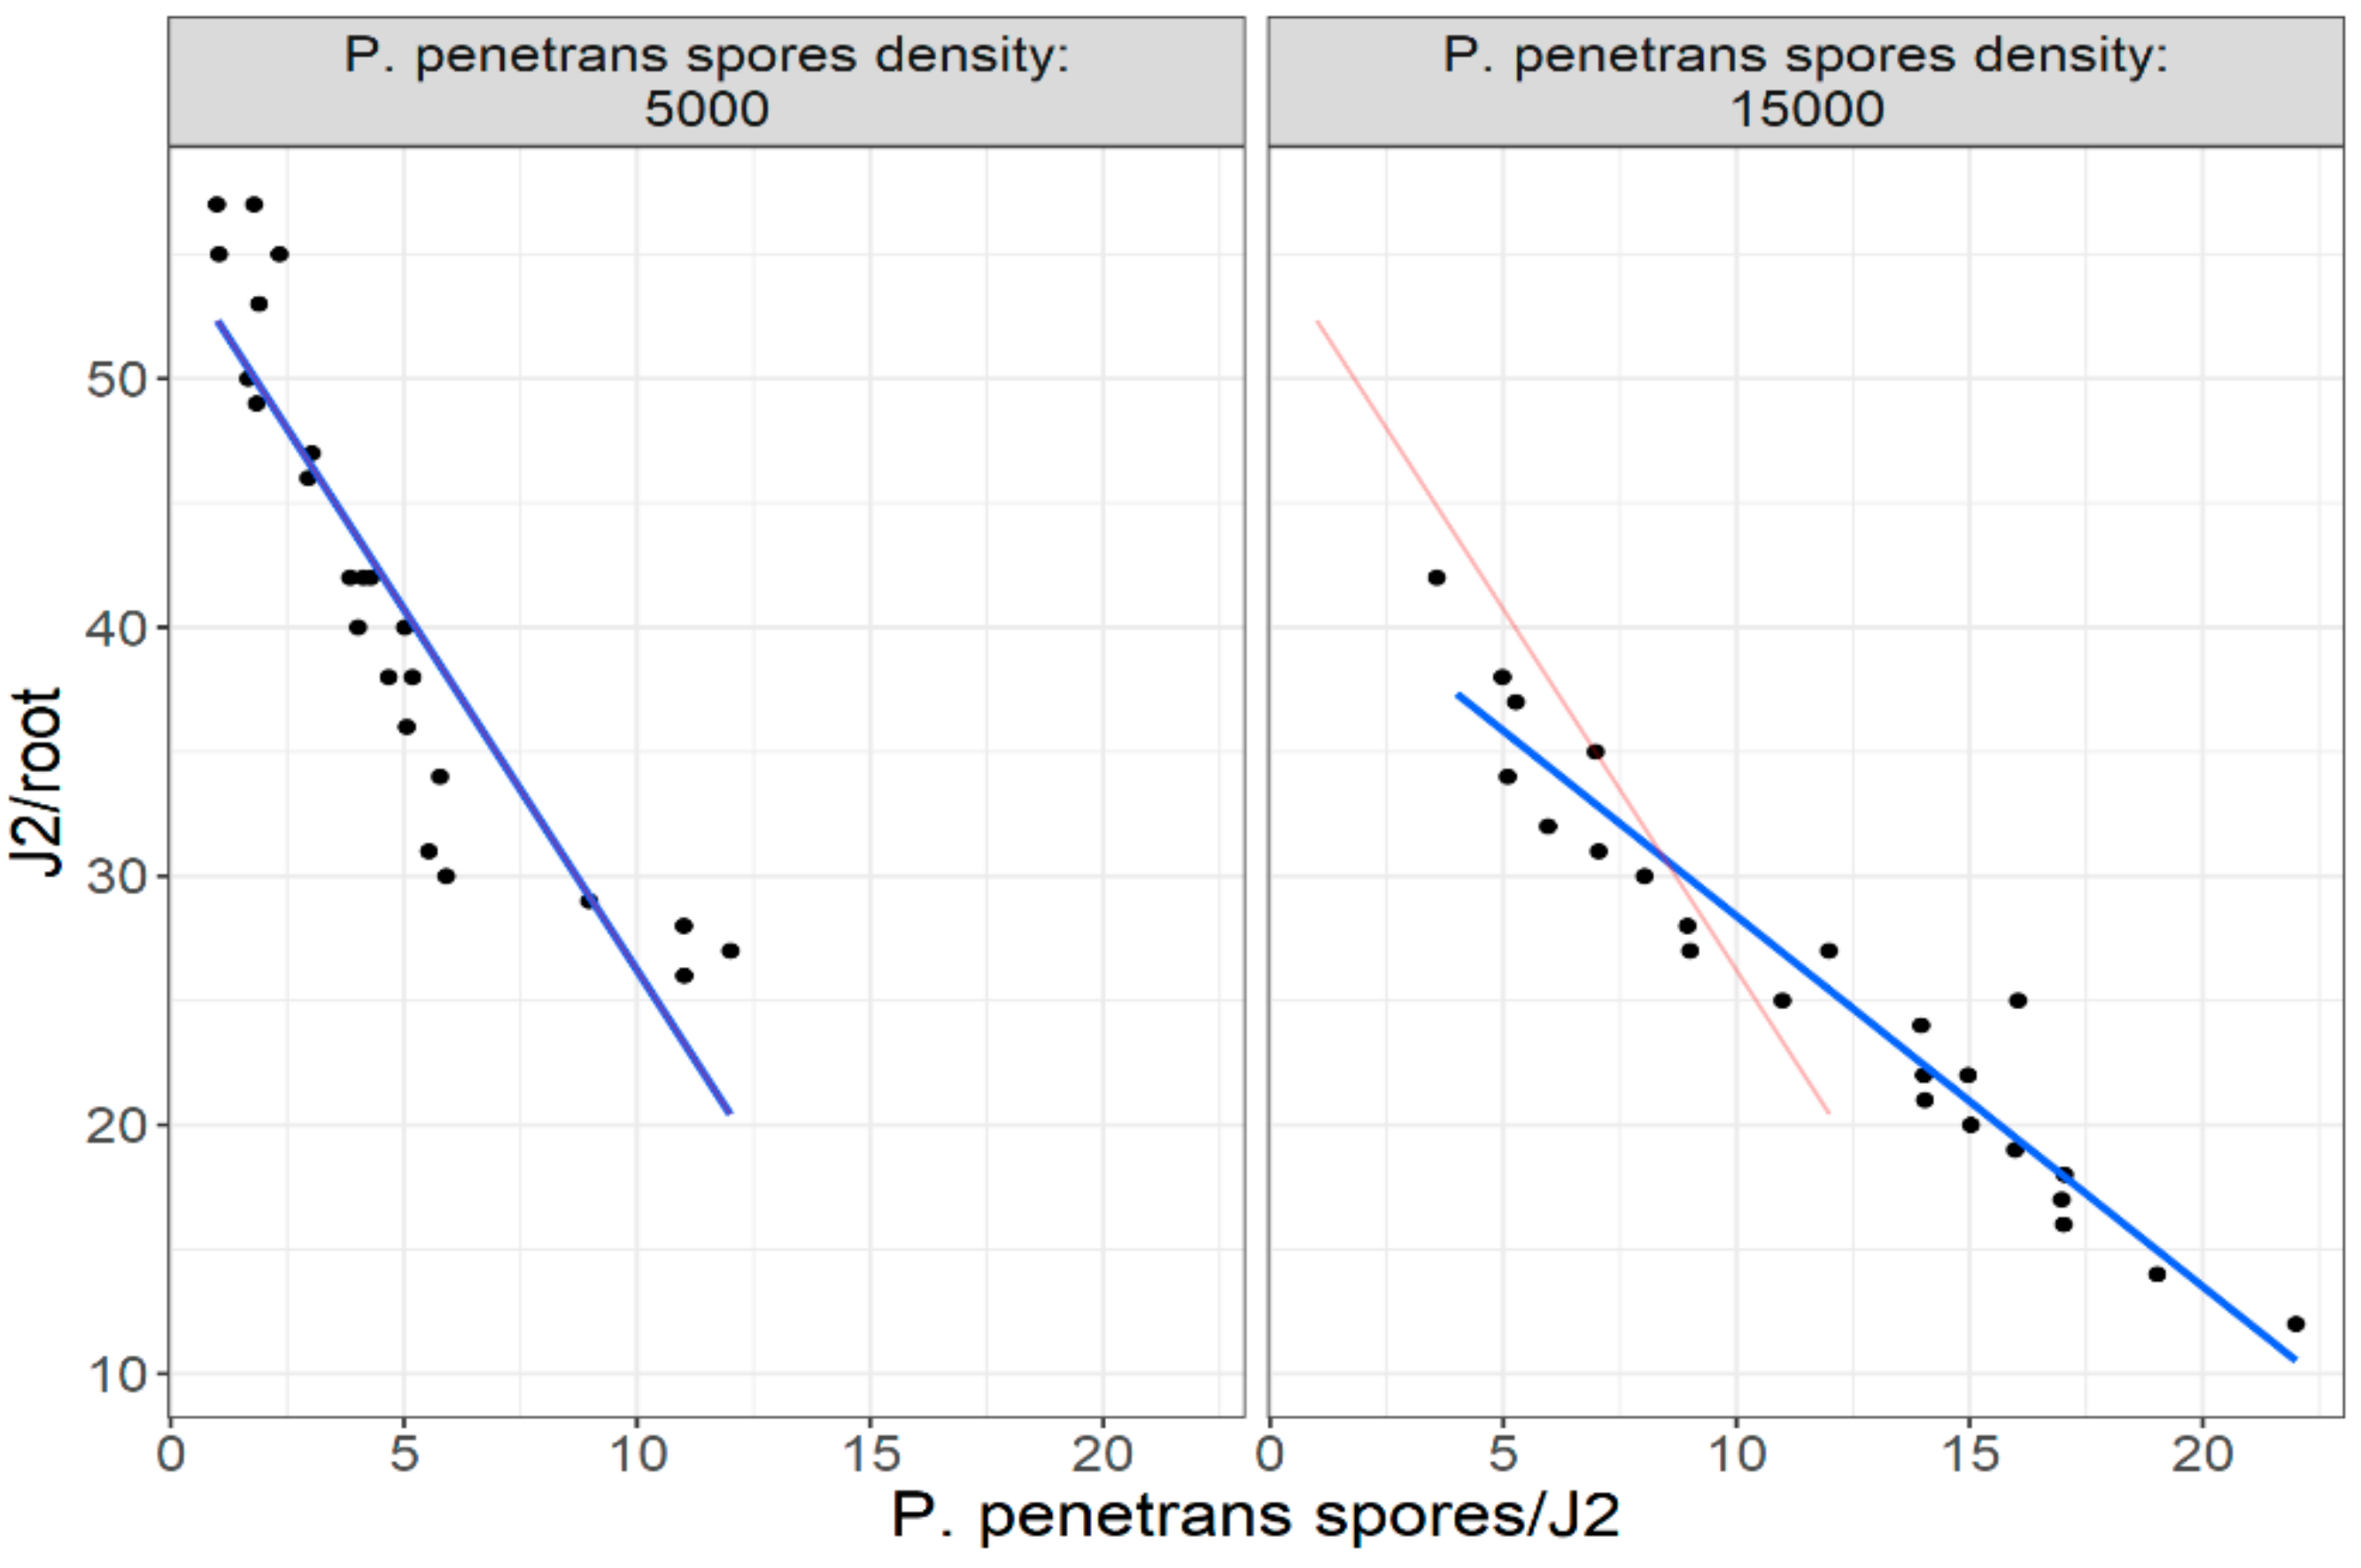
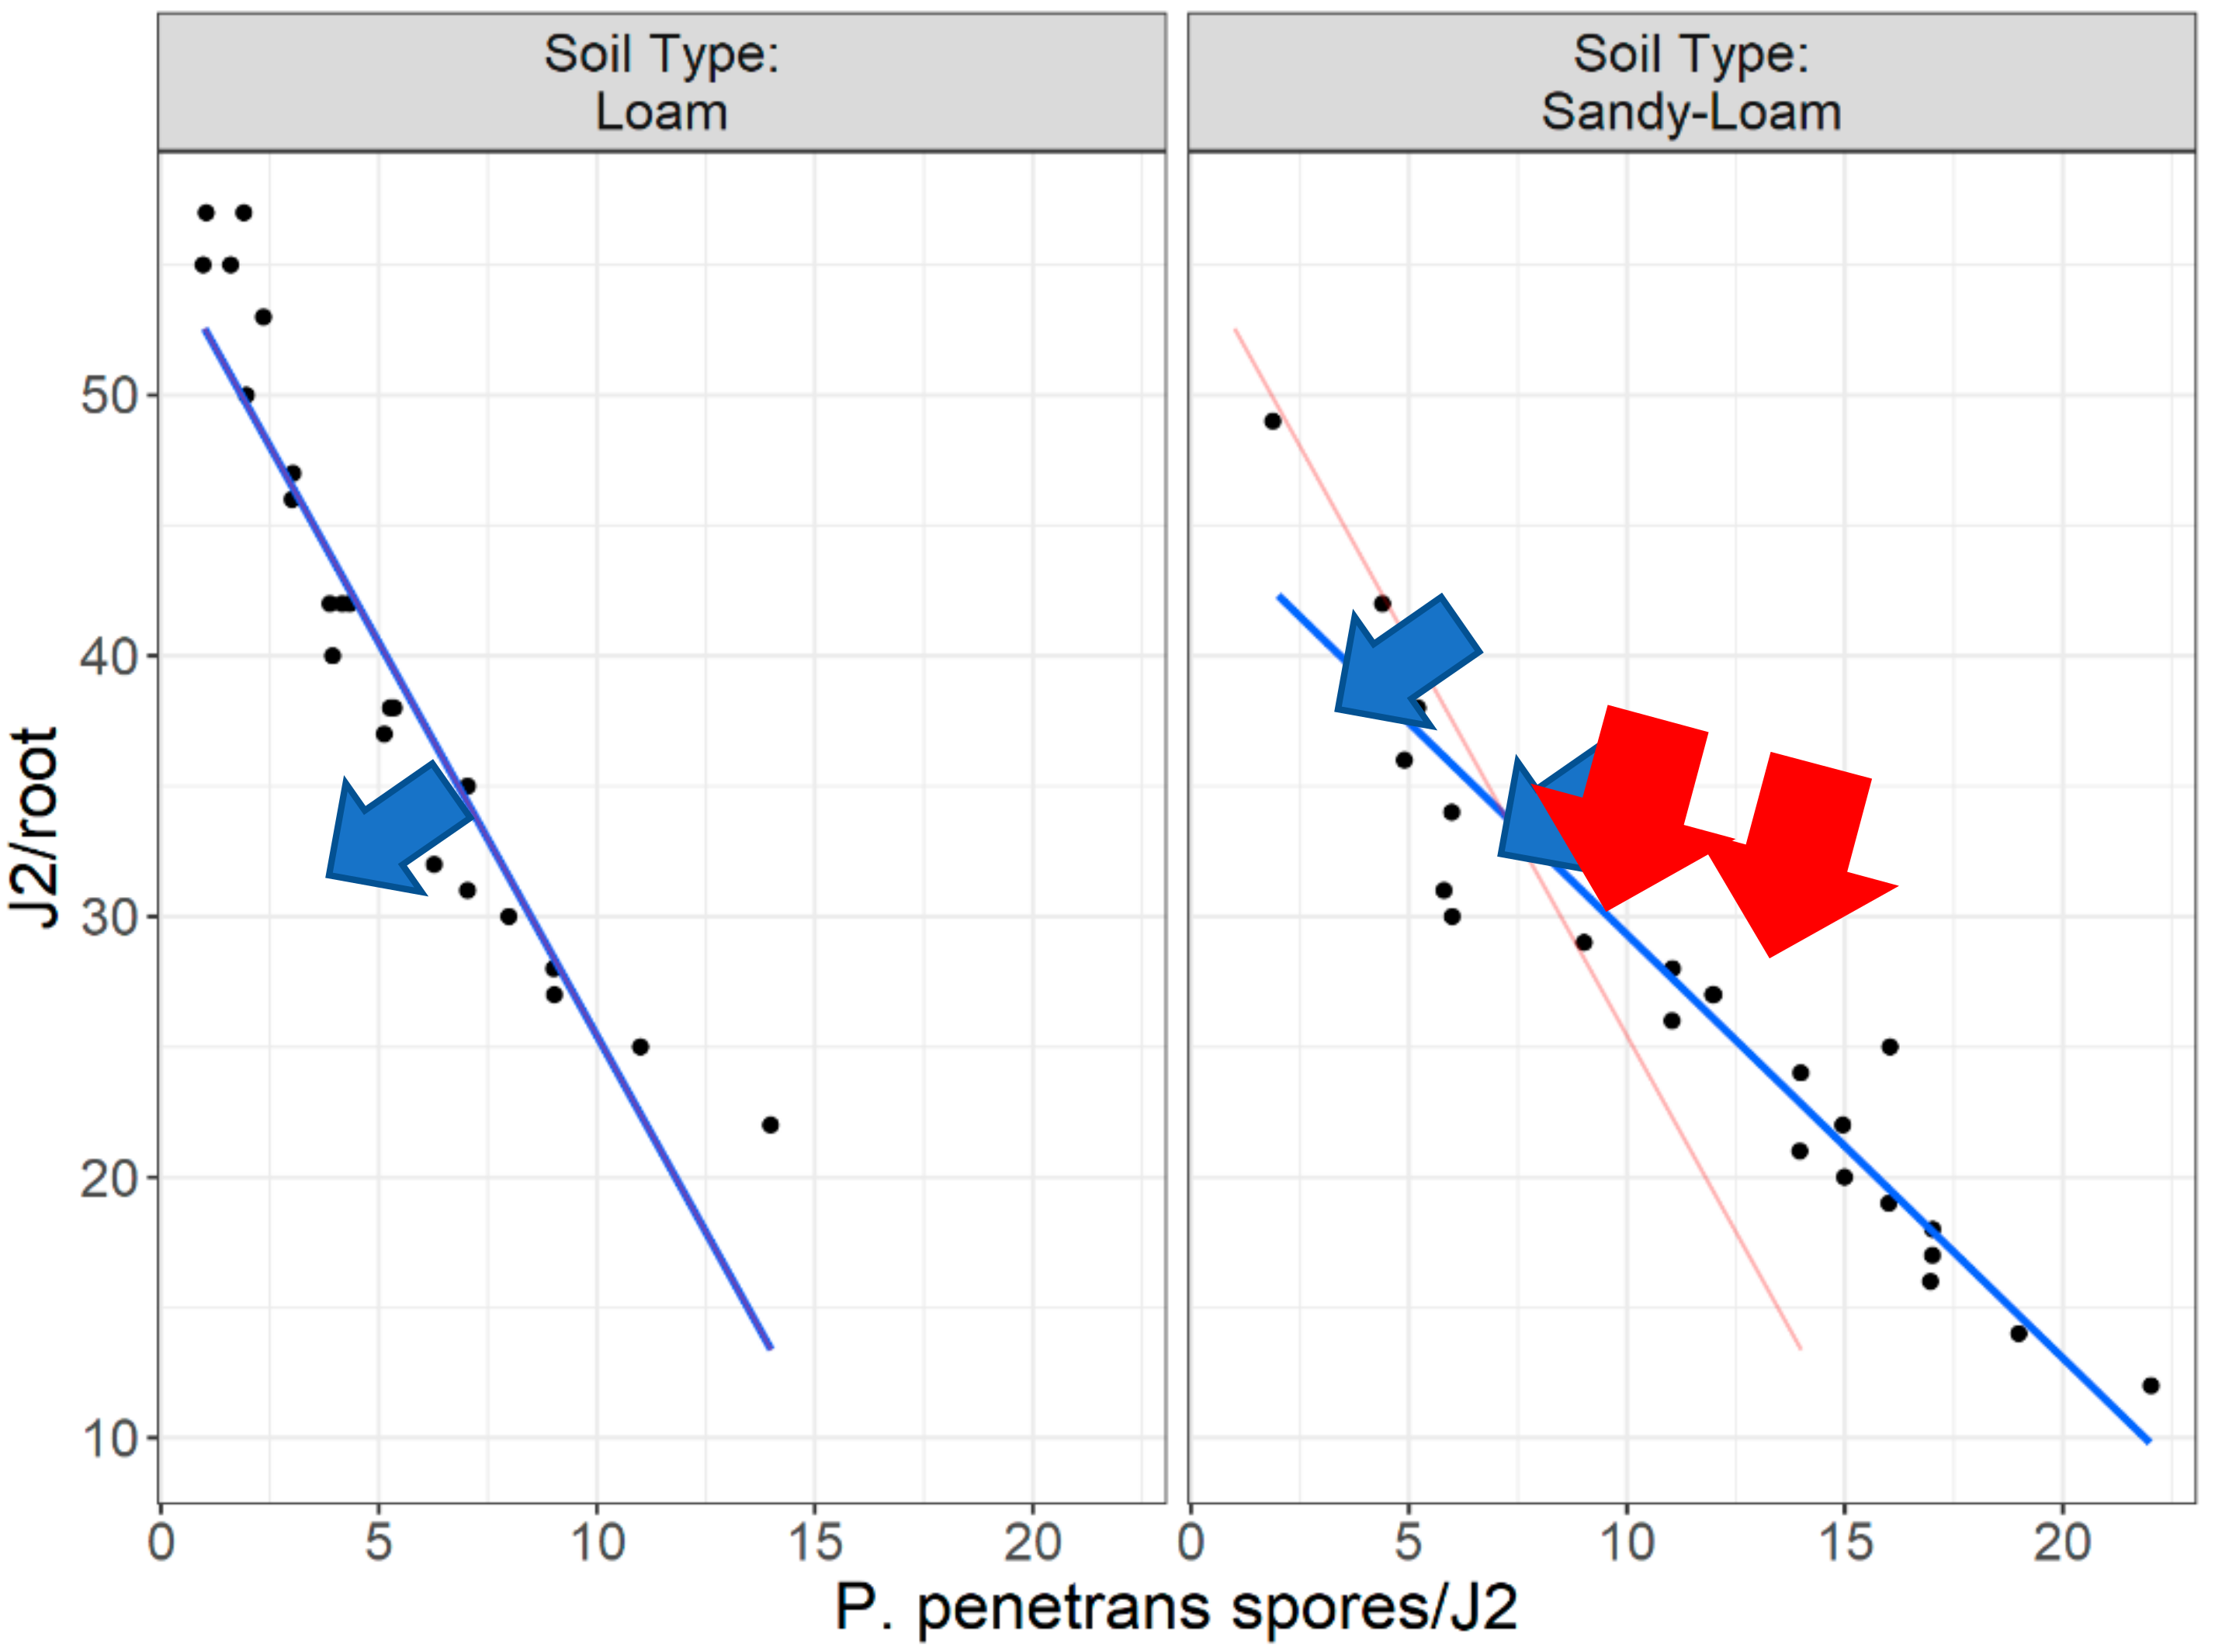
Figure 16 are of interest as the variance is a multiple of the mean which is consistent with the negative binomial model. The linear regression plots presented with
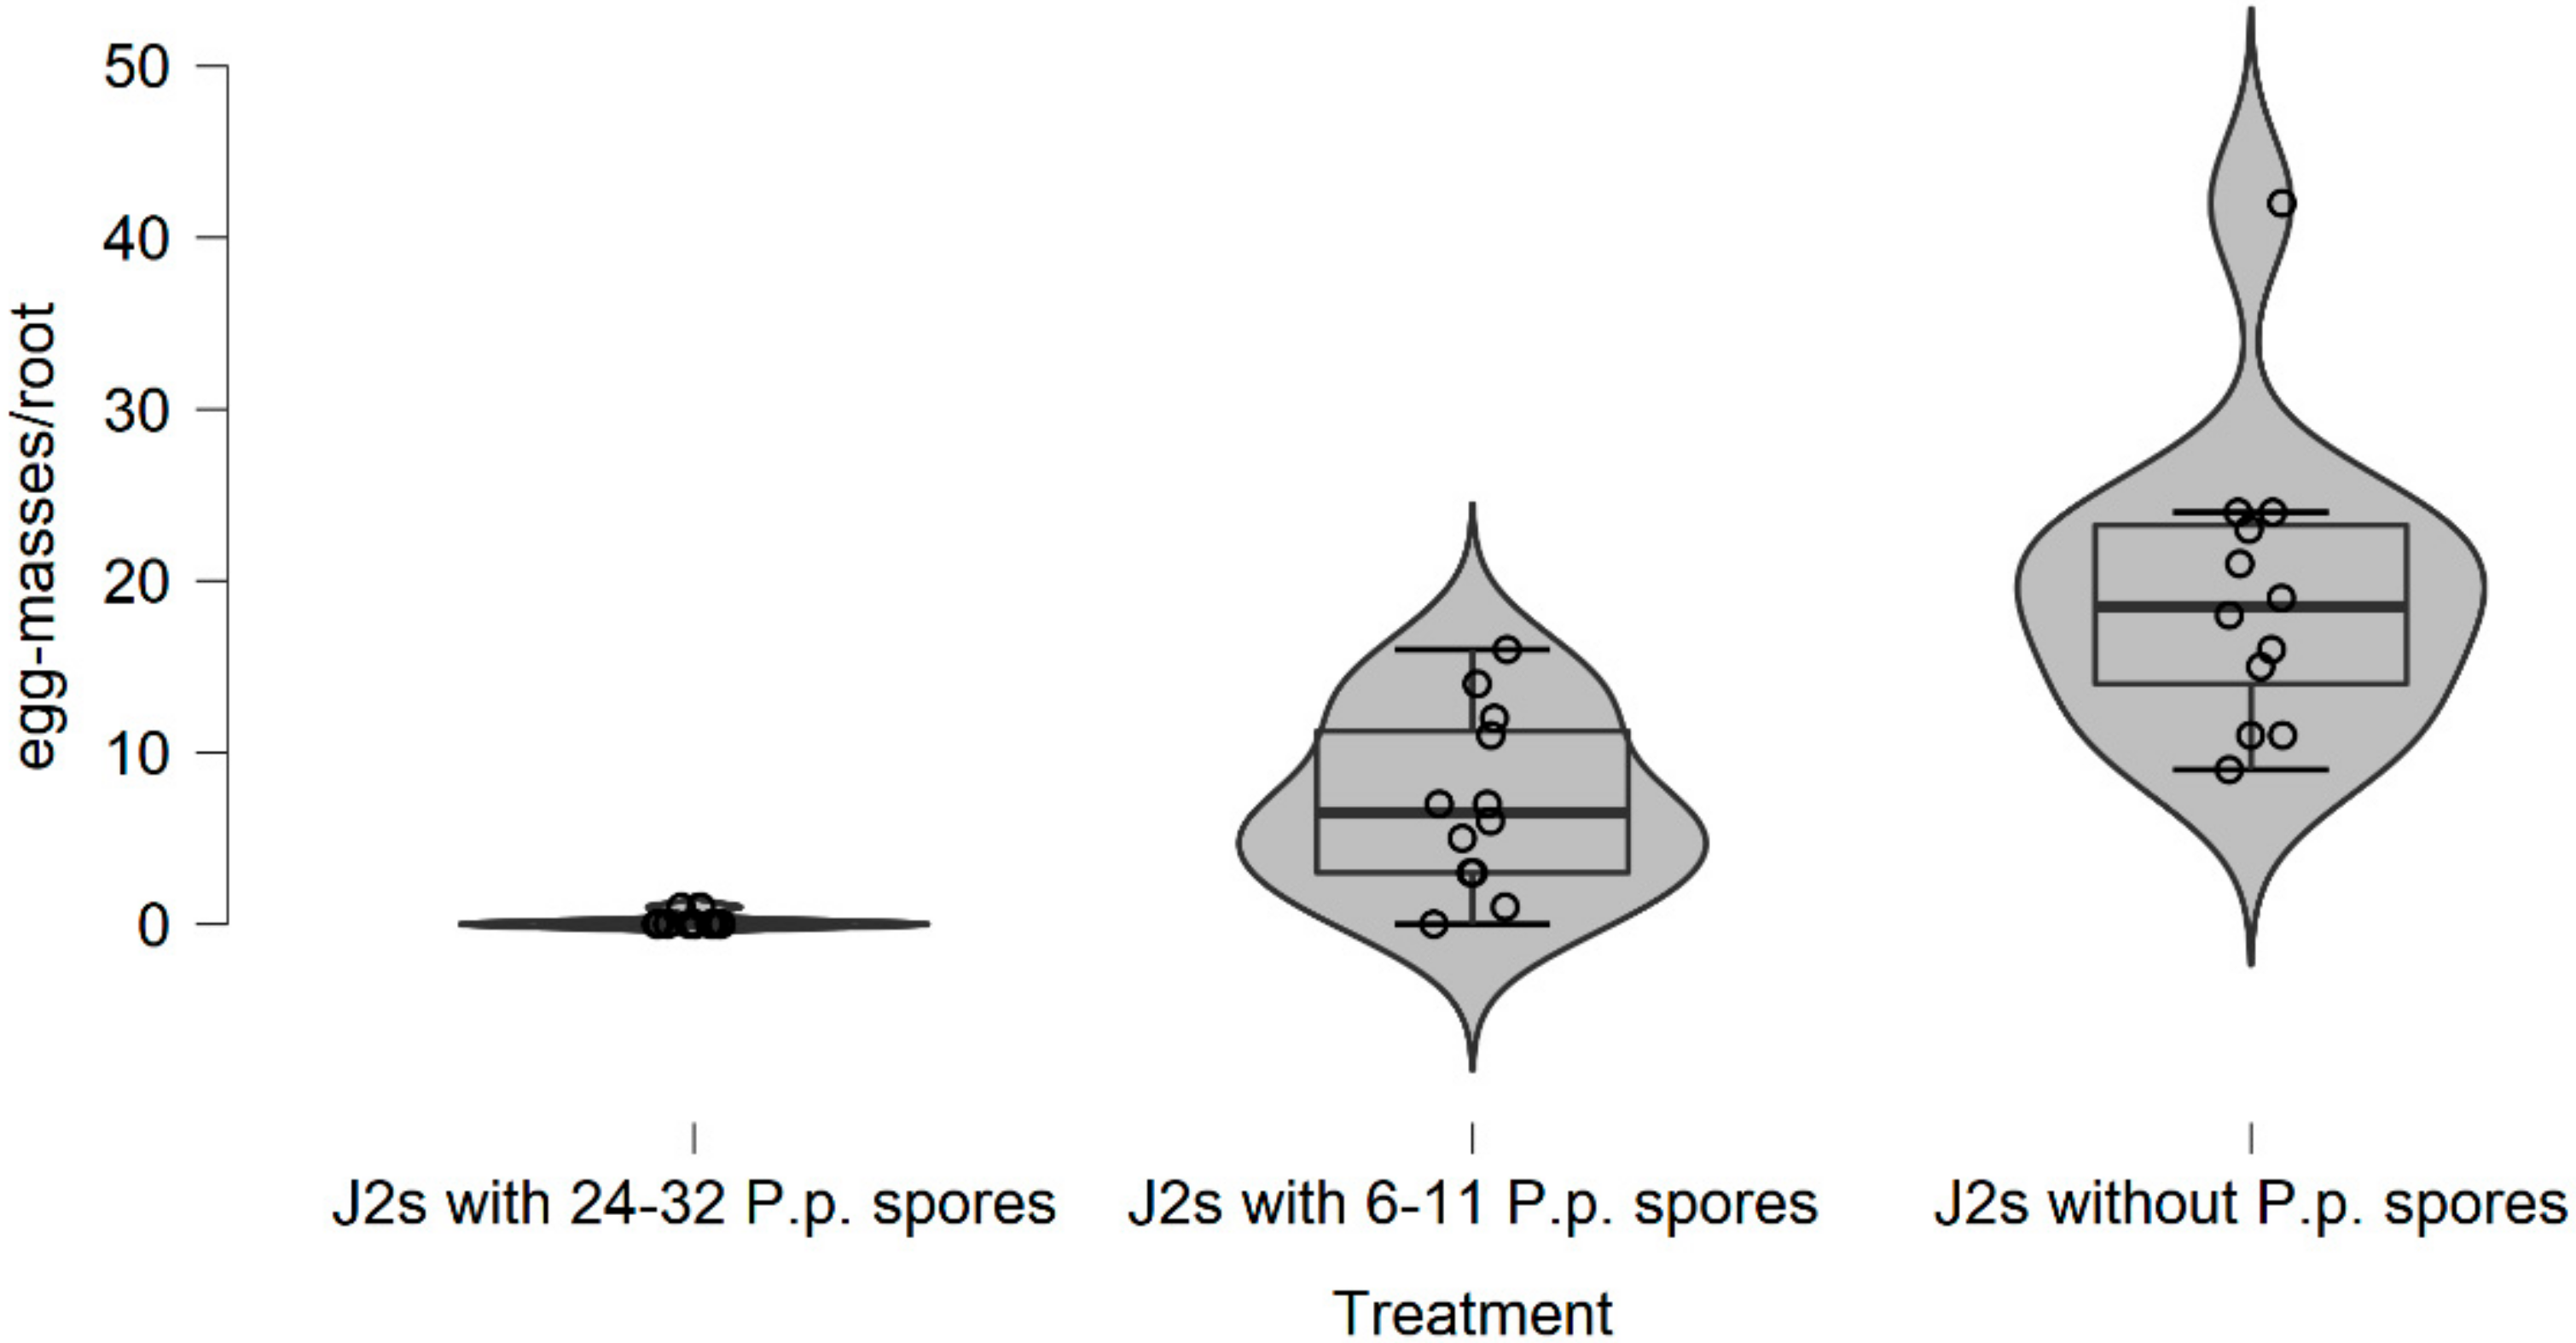
 Figure 17 and Figure 18 clearly support (with the “Ghost Line”) the hypothesis that the reduction in the invasion level (by approximately 70%) is observed when J2s are encumbered with more than seven (7) 
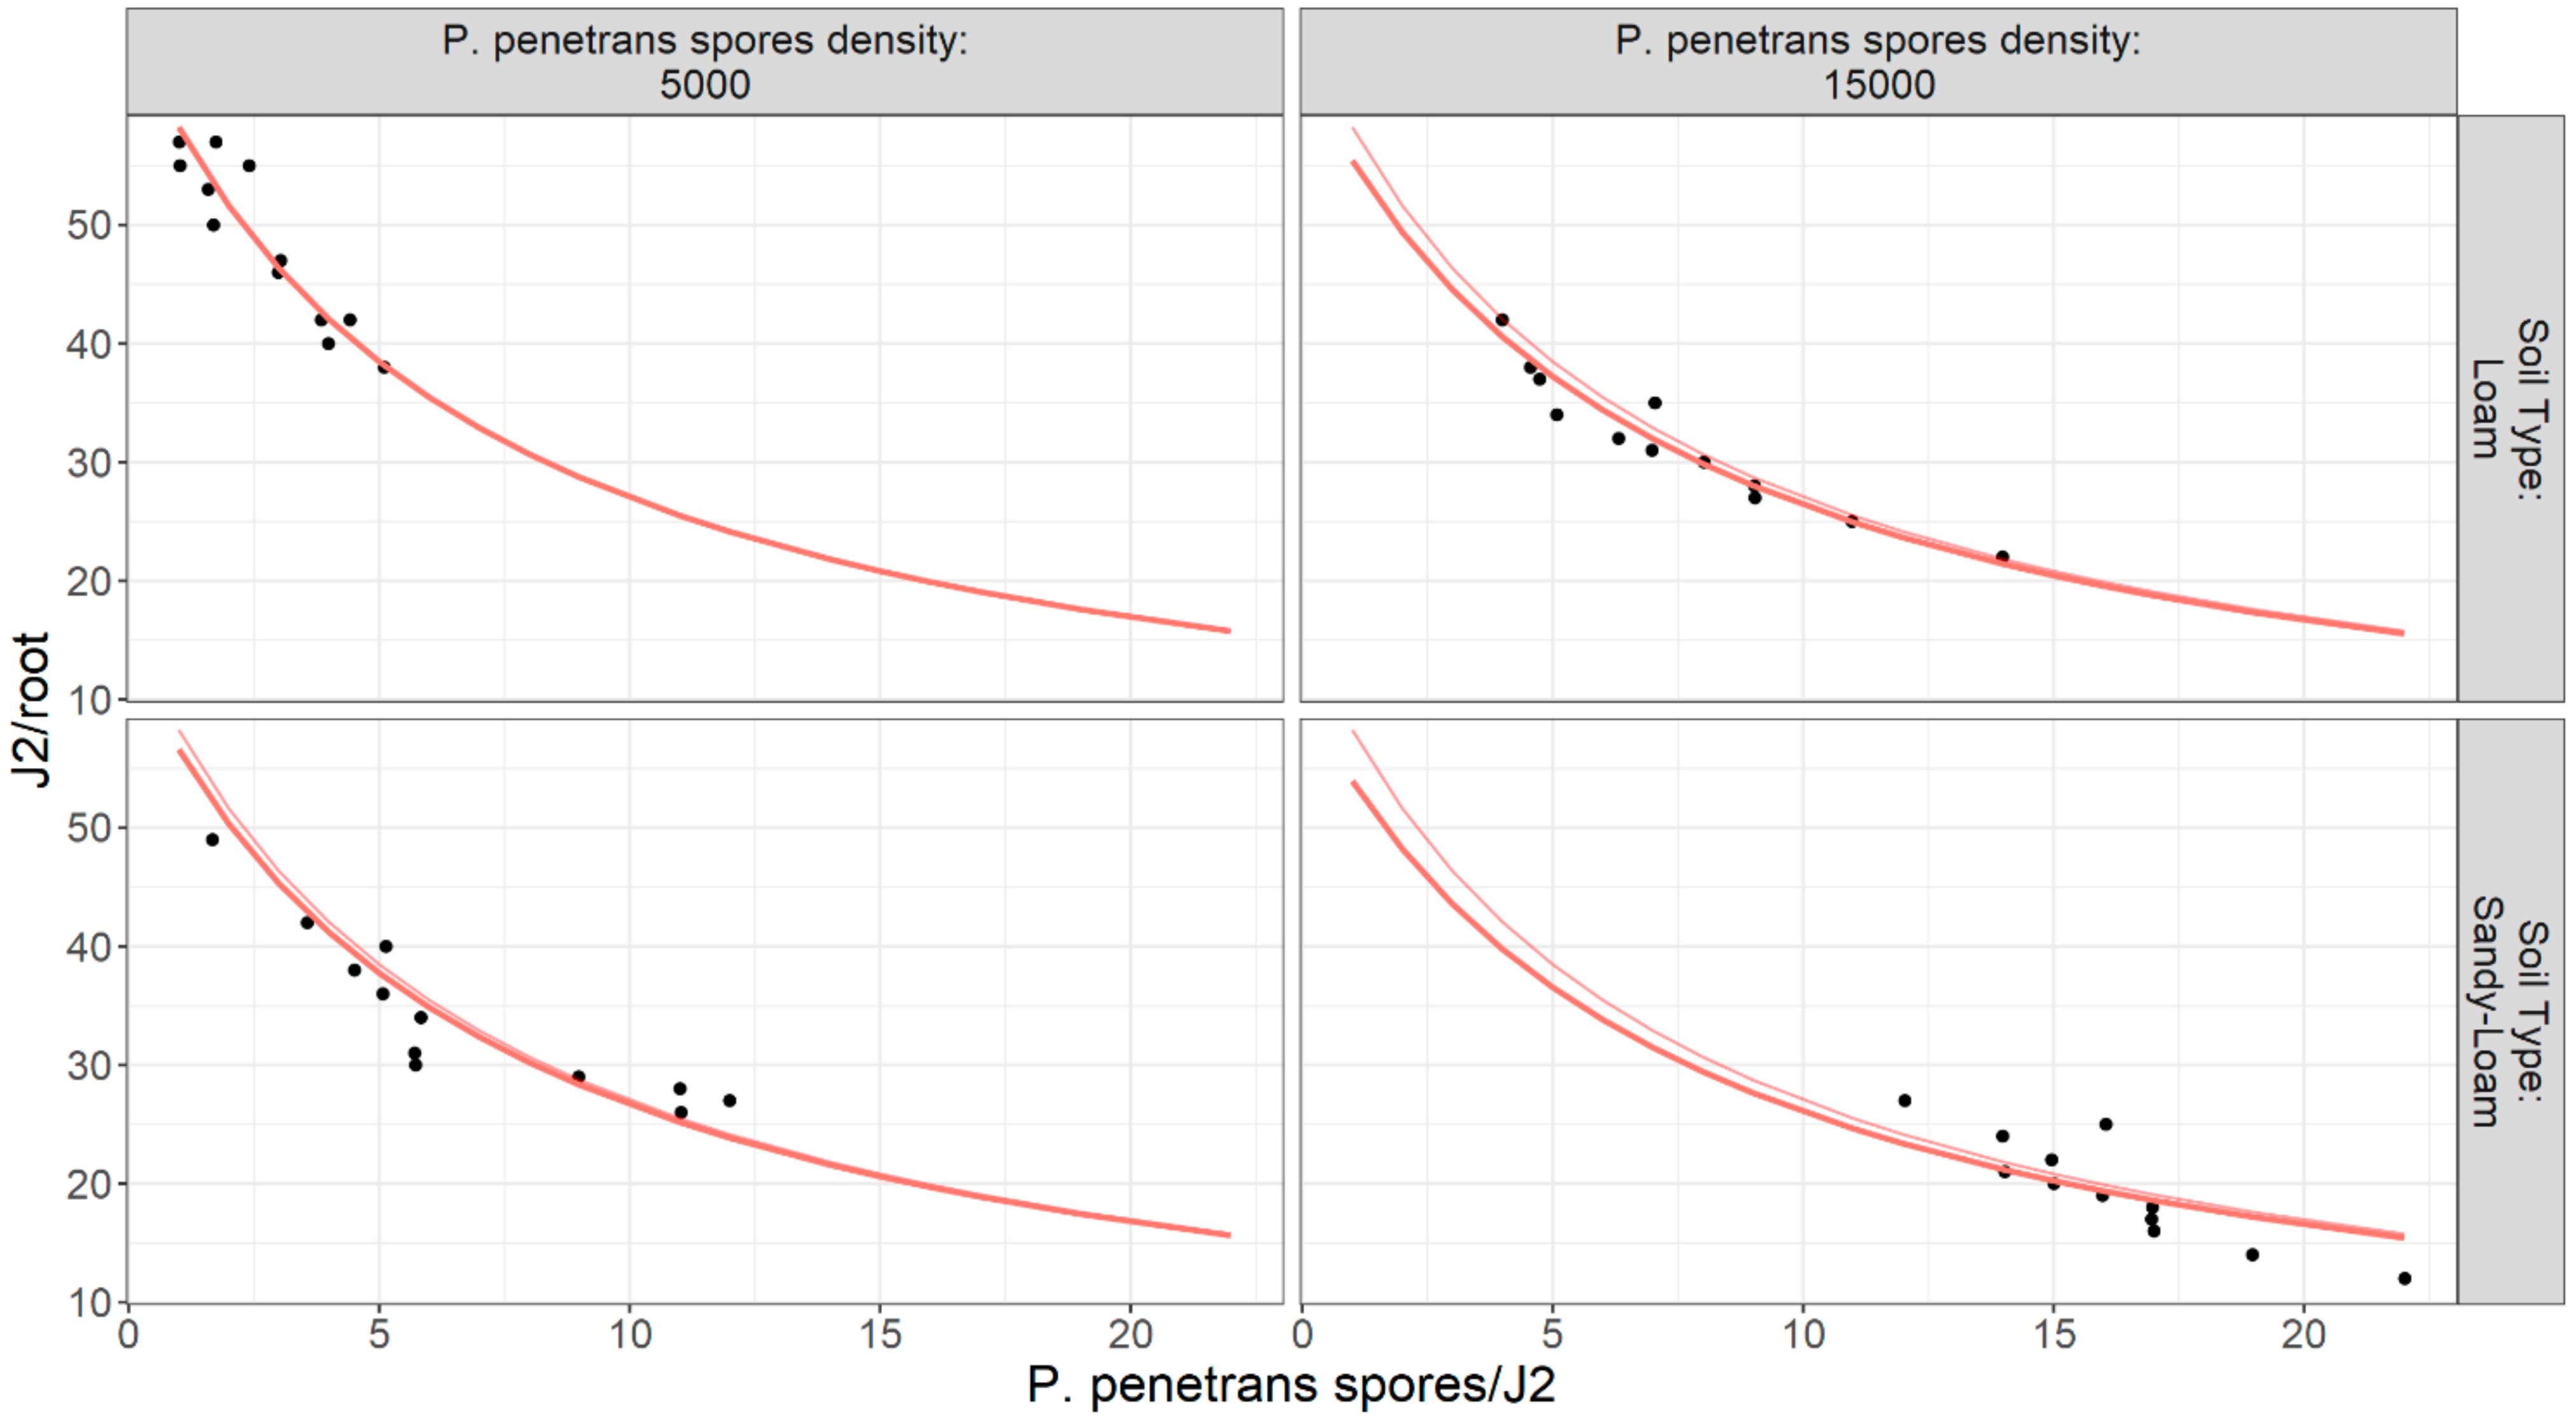
P. penetrans spores. Moreover, the generalized linear modeling plot in Figure 18 clearly reflects the relationship between nematodes invasion (J2s/root) and J2s encumbered with P. penetrans spores (P. penetrans spores/J2) in two soil types (sandy loam and loam soil), suggesting that the sand content affects the reduction in the invasion level. Furthermore, the high positive coefficient value of sandy loam soil (6.375) clearly indicates that more P. penetrans spores are attached in the sandy loam soil. The coefficient of 6.375 (Table 8) is not only positive but also significant from the coefficient of 0.808 (
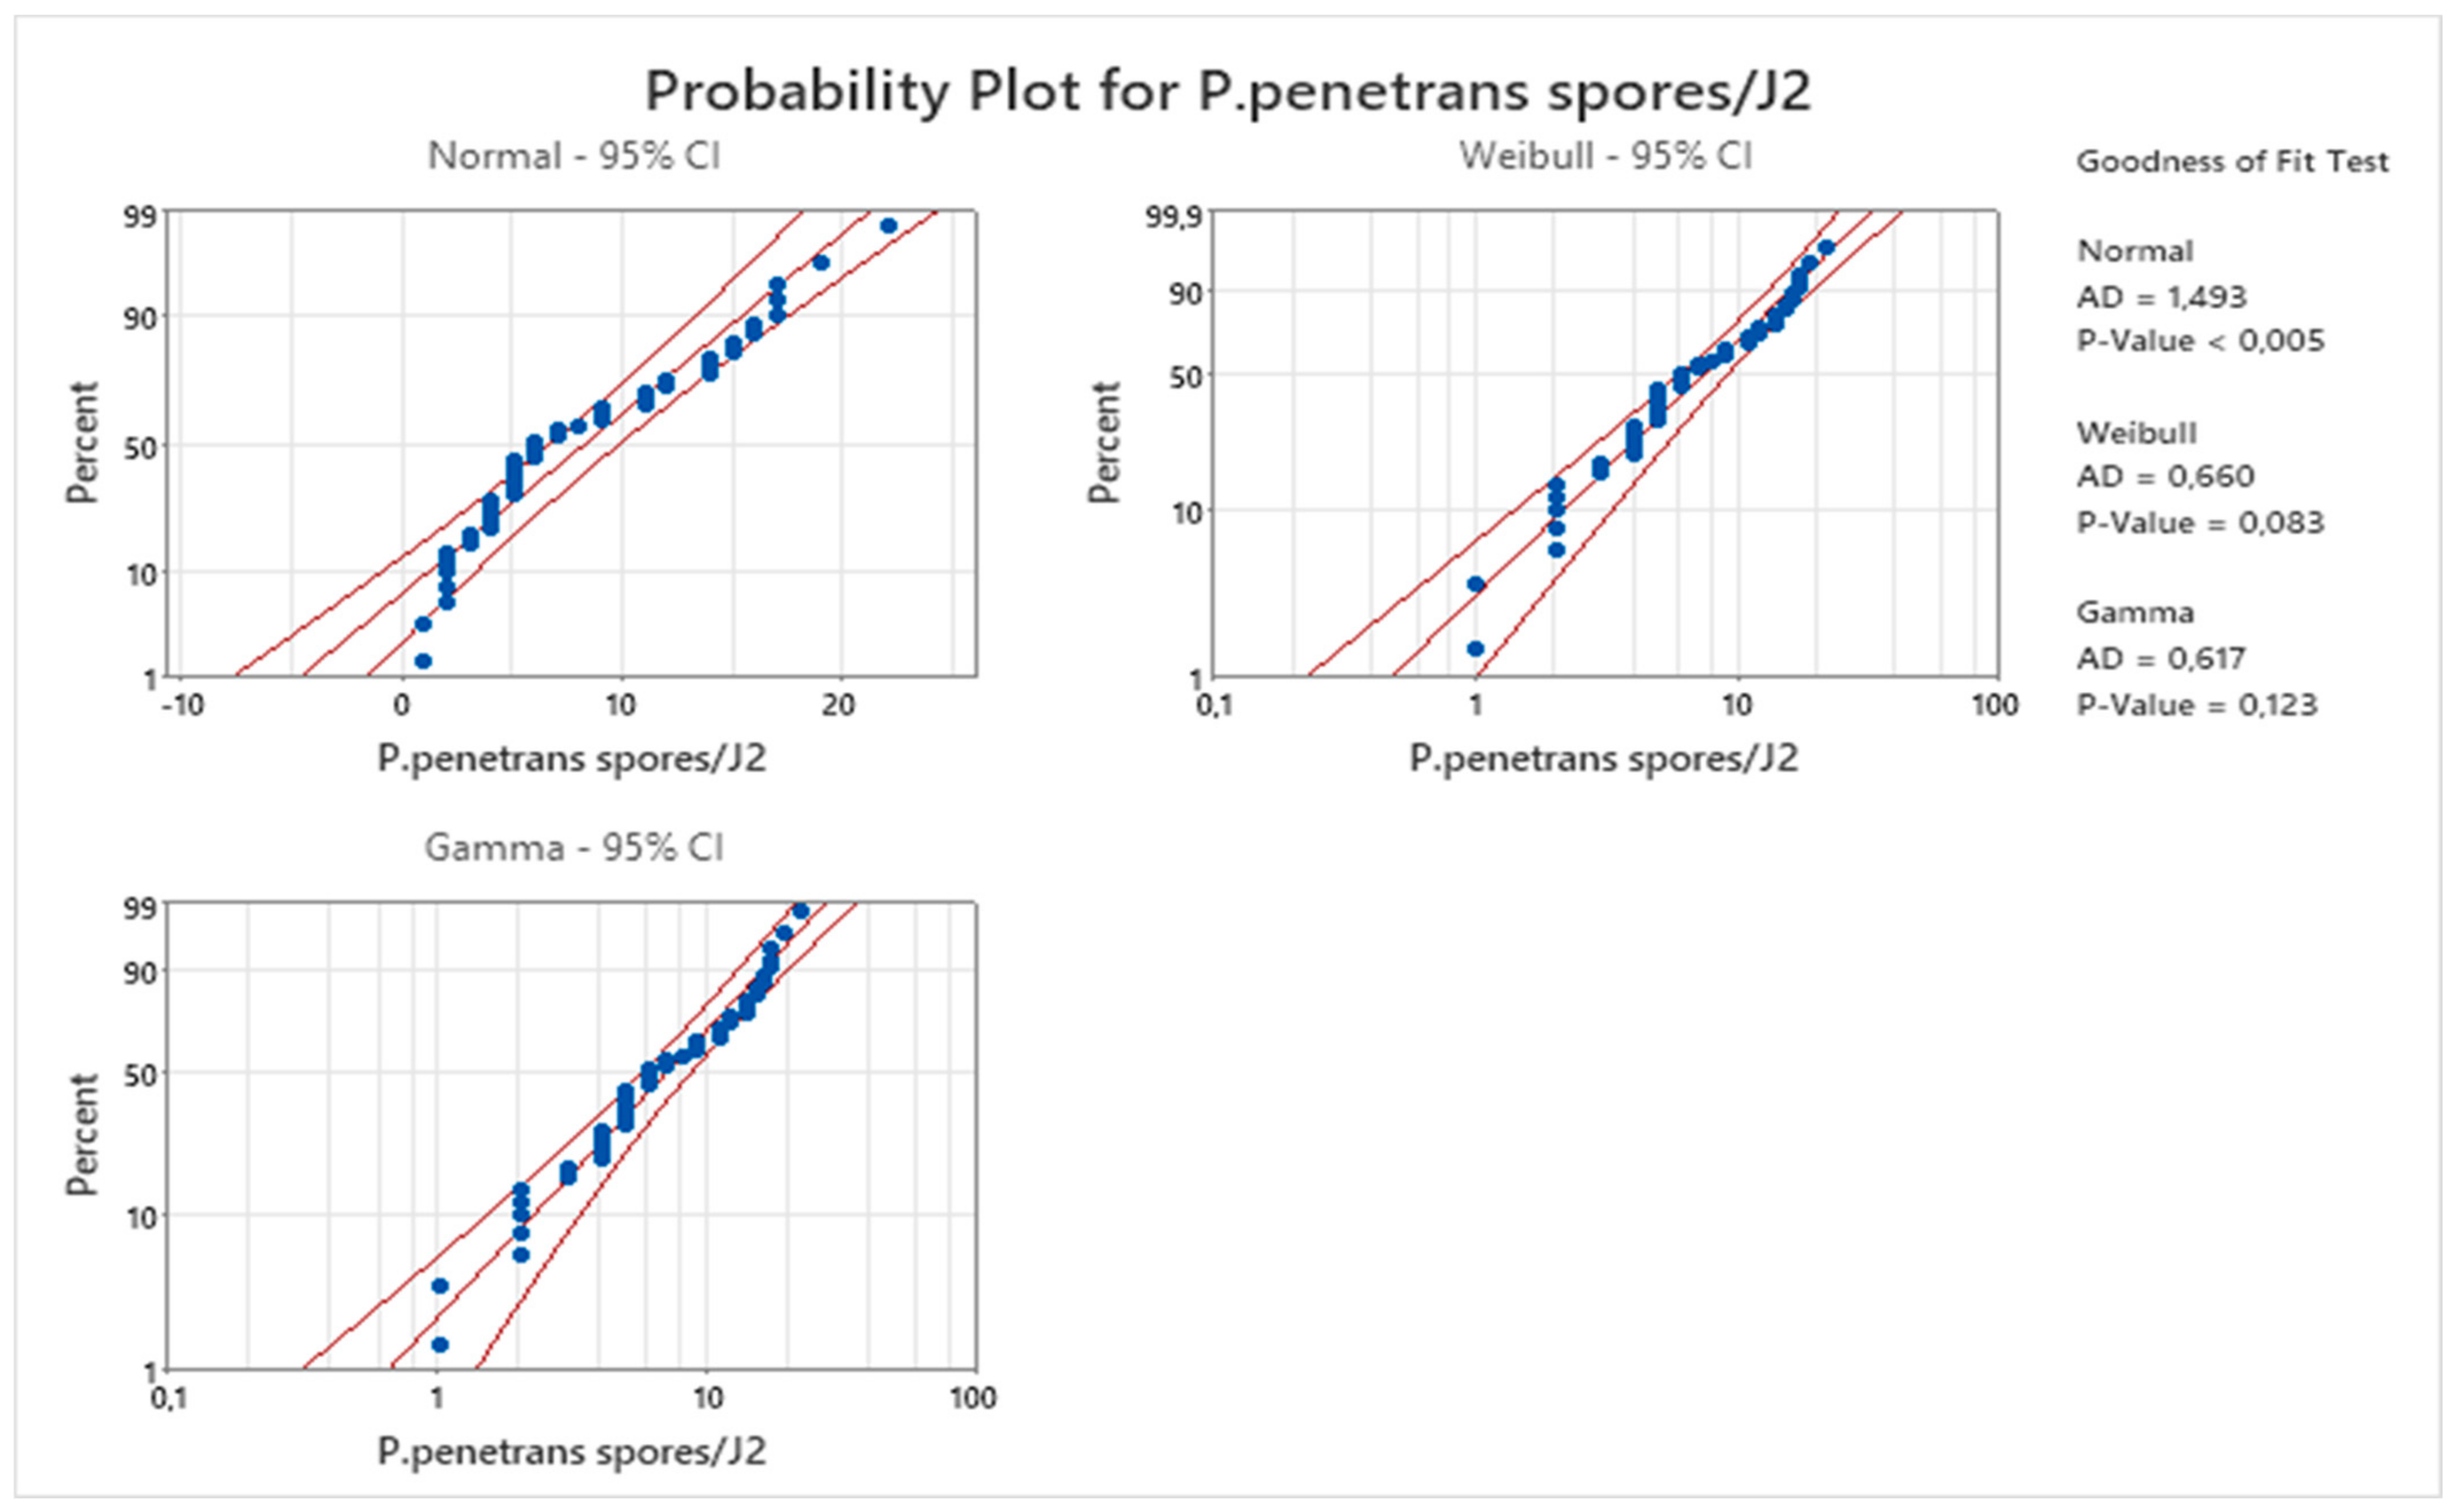
Table 8), suggesting that the Poisson model is not perfect. Again, the gamma (γ) distribution (p = 0.123) followed by the Weibull distribution (p = 0.083) of 
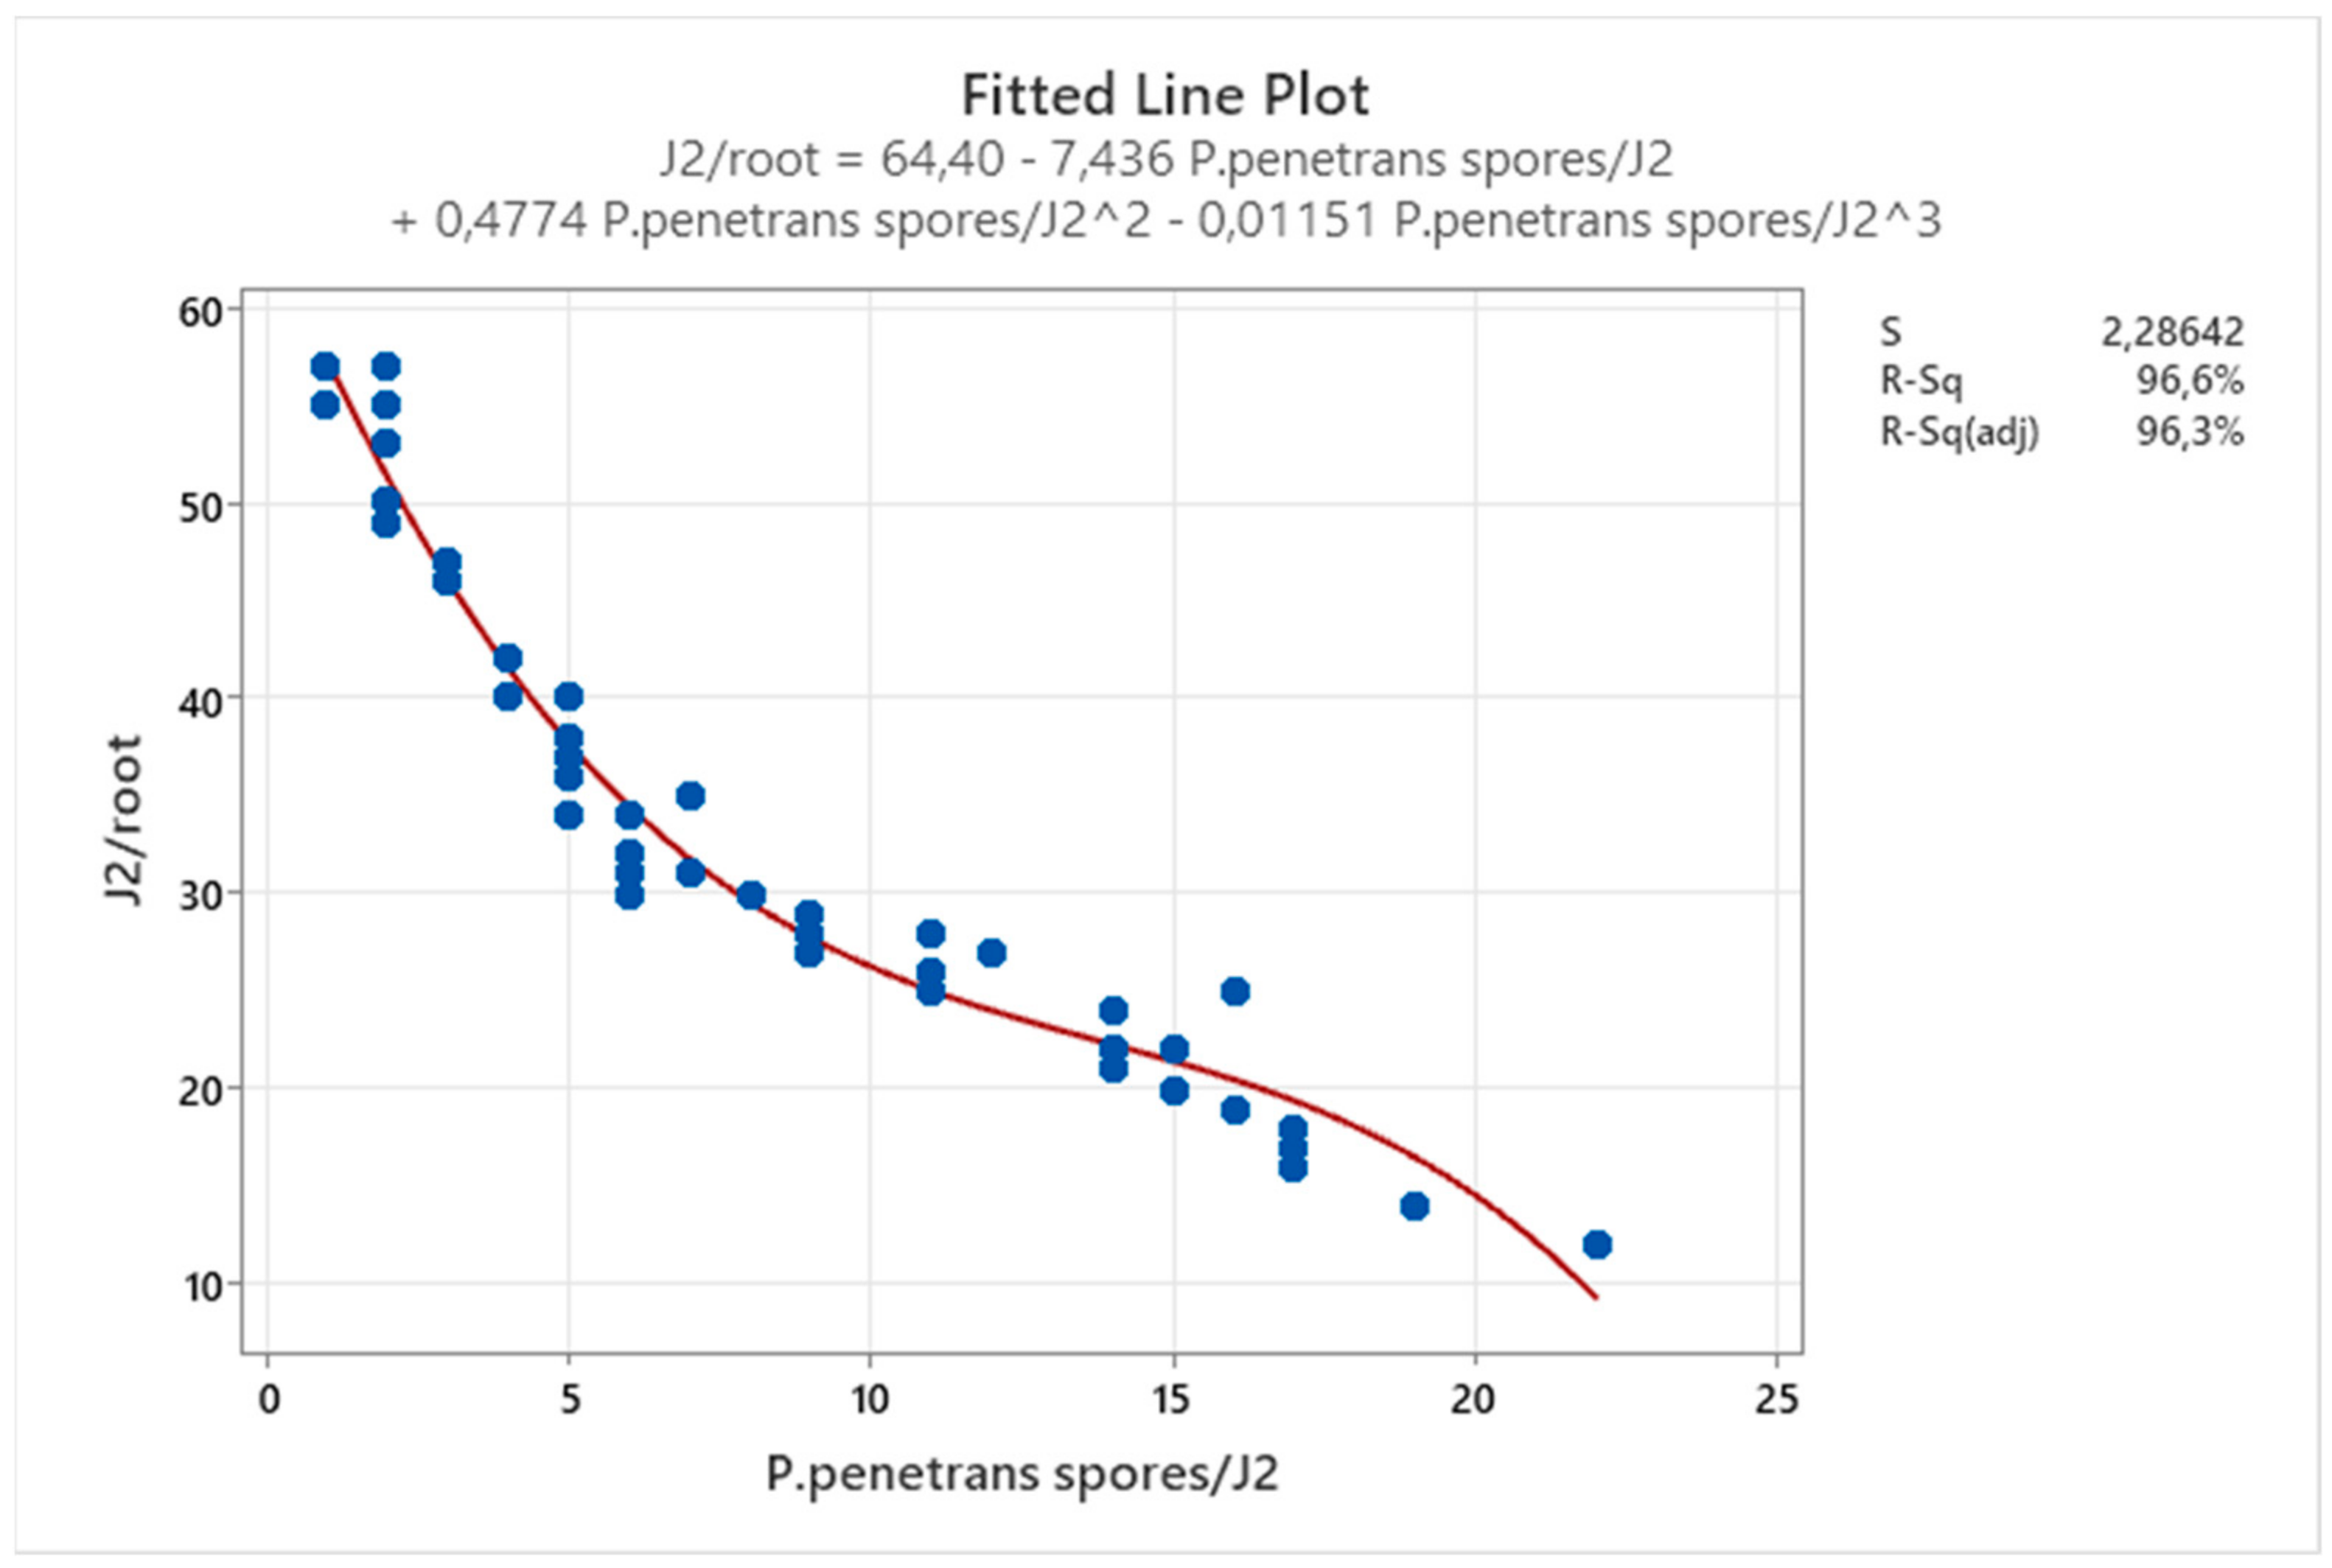
Figure 20 confirms that, apart from the negative binomial distribution, the gamma (γ) distribution jointly models the effects of liability (variance) and proneness (a better distribution for the others), especially the coefficient of the sandy loam soil. Thus, the following hypothesis is considered that the reduction in the invasion level (approximately by 70%) is observed when J2s were encumbered with 4.5–8 P. penetrans spores as estimated with the Wilcoxon signed rank test (Table 10) and further confirmed with the cubic line of Figure 21.

4. Materials and Methods

4.1. Root-Knot Nematode Culture

A culture of root-knot nematodes (Meloidogyne spp.) was propagated and maintained on tomato plants (cv. Tiny Tim) cultivated in the glasshouse located at the University of Thessaly facilities. Second-stage juveniles (J2s) were collected from infected tomato roots using the method described by Hussey and Barker [32].

4.2. Production of Fresh Second-Stage Juveniles (J2s)

A root-knot nematode culture was maintained on tomato roots cv. Tiny Tim for more than a month. For J2s inoculum, nematode culture plants were uprooted, and infested roots were washed free of soil with tap water. These roots were then cut into small pieces and placed in a jar with 200 mL of a 0.5% sodium hypochlorite (NaOCl) solution and vigorously shaken for 3 min. The use of NaOCl resulted in the dissolution of the gelatinous matrix releasing the eggs from the egg masses [8]. The suspension was passed through 150 and 38 µm mesh sieves in order to collect the root debris in the larger mesh and nematode eggs on the 38 µm sieve. The nematode’s eggs were poured onto a tissue paper covering a plastic sieve that was placed in a dish filled with tap water. The dish then was covered with a lid to prevent drying and was further incubated at 28 °C for 2–6 days [16]. In 2–6 days, second-stage juveniles (J2s) were hatched from the eggs and moved through the paper into the water. The hatched J2s were collected every day from 2 to 6 days and these nematodes were used as ‘fresh’ nematodes for the experiments.

4.3. Estimating J2 in the Suspension

The suspension of J2s was poured from the extraction dish into a measuring cylinder and was mixed by blowing with a pipette. After that, five aliquots of 1 mL each were placed in a counting dish and the numbers of J2s were counted under a microscope at a magnification of 35 x. The mean number of J2s of the five aliquots was multiplied with the total volume of suspension to estimate the total juvenile suspension density [25,26].

4.4. P. penetrans Culture and Attachment Process

P. penetrans strain PpNemJ derived from a commercial product of P. penetrans (Pp) Nematech Co., Ltd., Japan, was used in this study.
Attachment studies were carried out to confirm the attachment rate of P. penetrans isolation to the fresh J2 root-knot nematodes. Suspensions containing 200 freshly hatched J2s per mL of water were prepared and placed (pipetted) into Petri dishes. A suspension of P. penetrans spores, containing approximately 5000 P. penetrans spores/mL, was also added into Petri dishes. The Petri dishes were then kept in an incubator with a constant temperature at 28 °C. Nematodes were observed under an inverted microscope at ×200 magnification and the numbers of P. penetrans spores attached per nematode from a total of 40 random J2s/treatment were recorded [23,24,25,26].

4.5. Modeling P. penetrans Spore Attachment Data—Water Bioassay

Spore suspensions of PpNemJ strain were used in this study with sufficient attachment to the Meloidogyne spp. as shown by Vagelas et al. [23,25,26]. P. penetrans (Pp) spore concentration of 5000 P. penetrans spores/mL was used in this study. Endospore’s concentrations were prepared from counts made using a hemocytometer and diluted into sterile distilled water as required. P. penetrans attachment onto newly hatched J2s of root-knot nematodes was obtained by a centrifugation method [12]. All dishes were placed in a 28 °C incubator. Forty random J2s were observed and the numbers of Pp attached per J2 were recorded under a light microscope. Observations were made at 1, 3, 6, and 9 h after placing nematodes in the spore suspension of 5000 P. penetrans spores/mL [15].
Using JASP 0.14.1.0, an open-source statistical program (https://jasp-stats.org/, accessed on 1 December 2021) for Windows, we produced descriptive statistics that summarized the sample distribution in boxplots with violins and jittered data. Furthermore, with JASP statistical software, the best fit discrete distribution was estimated with a probability mass function (PMF), (Equation (1)) or the negative binomial distribution mass function (Equation (2)) before the PMF and the cumulative distribution function (CDF) of the Poisson and negative binomial distribution were displayed with plots. Finally, we used the chi-square test to determine whether a variable is likely to come from a specified distribution (e.g., the Poisson distribution) or not. Where r is the number of successes, k is the number of failures and p is the probability of success.
P   ( k   e v e n t s   i n   t i m e   p e r i o d ) = e - e v e n t s t i m e     ×   time period   ×   ( e v e n t s t i m e × t i m e   p e r i o d ) k / k !      
f ( k ; r , p )     Pr ( X = k ) = k + r 1 r 1   ( 1     p ) k   p r

4.6. Estimating Root-Knot Nematodes Development via Water Bioassay

Sets of treatments of fresh J2s of root-knot nematodes that were exposed or not to 5000 spores per Petri dish in water were used to estimate the nematode development on tomato roots. Fresh J2s were exposed to P. penetrans spores as described above (2.5.1.) and observations of the attachment were made under an inverted microscope at ×200 at 9 and 36 h after placing the nematodes in spore suspension. Furthermore, root-knot nematode gall and egg masses were produced on test tomato plants, plastic pots in a glasshouse experiment. Pots with tomato plants were treated with J2s that were exposed or not to 5000 P. penetrans spores for 9 h and kept in the glasshouse (temperature: 25 ± 4 °C) for 32 days. After 32 days, infested roots were excised from stems, drained of excess water, and pressed to uniform dryness. Roots were then observed under a stereoscope at ×25–30 magnification for gall and egg masses. These assessments (plant gall and nematode egg mass) were subjected to descriptive statistics using the JASP statistical software version 0.14.1.0 and summarized the sample distribution in boxplots with violins and jittered data. The mean, variance, and discrete distribution were performed using JASP statistical software. Each treatment had 40 replicates (Petri dishes bioassay) and 12 replicates (pots bioassay). Moreover, a flexplot utility was used in order to visualize multivariate relationships between gall and egg masses. The difference between treatments was compared with a “Ghost Line”. “Ghost Line” repeats the relationship from one panel, e.g., Figure 8, J2s treated with 6–11 P. penetrans spores, to the other panel, e.g., Figure 8, J2s treated without or with 24–32 P. penetrans spores, to facilitate the comparison of the relationship or differences.

4.7. Modeling P. penetrans Spore Attachment Data-Soil Bioassay

Sets of treatments in water suspension as described above (2.5.1.) were made in sandy loam and loam soil by adding a small amount (1 g) of sterile sandy loam or loam soil. In detail, 1 g of soil was mixed with 3 mL of tap water to make the soil bioassay. For attachment in the soil bioassay, ‘fresh’ J2s of root-knot nematodes were exposed to 0, 5000, and 15,000 spores per ml and a total of 60 random nematodes were examined for P. penetrans spore attachment from each treatment after the incubation of the Petri dishes at 28 °C for 36 h.

4.8. Estimating J2s Root Invasion Rate Encumbered with Different Doses of P. penetrans Spores in Sandy Loam and Loam Soil

Sets of treatments for the attachment bioassay of fresh J2s of root-knot nematodes that were exposed to 5000 and 15,000 spores per Petri dish in sandy loam and in loam soil were used in order to estimate the J2s invasion rate. Treatments were: (1) tomato plants in sandy loam soil treated only with J2s; (2) tomato plants in loam soil treated only with J2s; (3) tomato plants in sandy loam treated with 5000 P. penetrans spores/mL in sandy loam bioassay for 36 h as described above; (4) tomato plants in sandy loam treated with 5000 P. penetrans spores/mL in sandy loam bioassay for 36 h; (5) tomato plants in sandy loam treated with 15,000 P. penetrans spores/mL in sandy loam bioassay for 36 h; (6) tomato plants in loam soil treated with 5000 Pp spores/mL in loam bioassay for 36 h; and (7) tomato plants in loam soil treated with 15,000 P. penetrans spores/mL in a loam bioassay for 36 h. Each treatment was replicated twelve times. The number of J2s per root system was determined 12 days after inoculation following the Hooper [33] method. For all pot treatments, plants were inoculated with 600 fresh J2s.
Using the JASP statistical software version 0.14.1.0, the sample distribution was summarized in boxplots with violins and jittered data, as described above (2.5.1). Furthermore, the interactions between soil type (sandy loam and loam soil) and P. penetrans spores’ density (5000 and 15,000/mL) were modeled with ANOVA and Linear Models.
Finally, from the sandy loam and loam soil bioassay, after 36 h of incubation, ten random nematodes encumbered with 5000 or 15,000 P. penetrans spores/mL were examined for P. penetrans attachment under ×200 magnification with an inverted microscope. These data were used to determine the relationship between encumbered nematode and invasion rate at the two tested soil types (sandy loam and loam soil).

5. Conclusions

This paper is concerned with fitting discrete distribution models to P. penetrans attachment in water and soil bioassay tests. Those attachments were further tested for nematode invasion in planta. This research study concludes that the number of spores attached in J2s, the time of exposure of J2s to P. penetrans spores, and the soil texture are important factors affecting the invasion of root-knot nematodes in tomato plants.

Author Contributions

This research is a product of the intellectual environment of all authors which contributed in various degrees to the analytical methods used, the research concept, and the experiment design. I.V. designed the study, developed the methodology, and performed the analysis, while S.L. and I.V. collected the data. I.V. and S.L. also contributed to writing the manuscript. All authors have read and agreed to the published version of the manuscript.

Funding

This research received no external funding.

Institutional Review Board Statement

Not applicable.

Conflicts of Interest

The authors declare that they have no conflict of interest.

References

  1. Taylor, A.L.; Sasser, J.N. Biology, Identification and Control of Root-Knot Nematodes (Meloidogyne Species); North Carolina State University: Raleigh, NC, USA, 1978; p. 111. [Google Scholar]
  2. Sasser, J.N. Economic importance of Meloidogyne in tropical countries. In Root-Knot New Nematode (Meloidogyne sp.) Systematics, Biology and Control; Lamberti, F., Taylor, E., Eds.; Academic Press: New York, NY, USA, 1990; p. 477. [Google Scholar]
  3. Sikora, R.A.; Fernandez, E. Nematode parasites of vegetables. In Plant Parasitic Nematodes in Subtropical and Tropical Agriculture; Luc, R.A., Sikora, R.A., Bridge, J.M., Eds.; CAB International: New York, NY, USA, 2018; pp. 319–392. [Google Scholar]
  4. Lambert, K.; Bekal, S. Introduction to plant-parasitic nematodes. Plant Health Instr. 2002, 10, 1094–1218. [Google Scholar] [CrossRef]
  5. Mankau, R. Bacillus penetrans n. comb. causing a virulent disease of plant-parasitic nematodes. J. Invertebr. Pathol. 1975, 26, 333–339. [Google Scholar] [CrossRef]
  6. Imbriani, J.L.; Mankau, R. Ultrastructure of the nematode pathogen Bacillus penetrans. J. Invertebr. Pathol. 1977, 30, 337–347. [Google Scholar] [CrossRef]
  7. Thorne, G. Dubosqia penetrans n. sp. (Sporozoa, Microsporidia, Nosematidae) a parasite of the nematode Pratylenchus pratensis (De Man) Filipjev. Proc. Helminthol. Soc. Wash. 1940, 7, 51–53. [Google Scholar]
  8. Orr, J.N.; Mauchline, T.H.; Cock, P.J.; Blok, V.C.; Davies, K.G. De novo assembly of the Pasteuria penetrans genome reveals high plasticity, host dependency, and BclA-like collagens. bioRxiv 2018, arXiv:485748. [Google Scholar]
  9. Stirling, G.R. Biological control of Meloidogyne javanica with Bacillus penetrans. Phytopathology 1984, 74, 55–60. [Google Scholar] [CrossRef]
  10. Stirling, G.R. Biological Control of Plant-Parasitic Nematodes. Progress, Problems and Prospects; CAB International: Wallingford, UK, 1991. [Google Scholar]
  11. Sayre, R.M.; Starr, M.P. Bacterial diseases and antagonism of nematode. In Diseases of Nematodes; Poinar, G.O., Jansson, H.B., Eds.; CRC Press: Boca Raton, FL, USA, 1988; pp. 69–101. [Google Scholar]
  12. Hewlett, T.E.; Dickson, D.W. Endospore attachment specificity of Pasteuria penetrans from a peanut field in Florida. J. Nematol. 1994, 26, 103–104. [Google Scholar]
  13. Stirling, G.R. Host specificity of Pasteuria penetrans within the genus Meloidogyne. Nematologica 1985, 31, 203–209. [Google Scholar] [CrossRef]
  14. Davies, K.G.; Danks, C. Interspecific differences in the nematode surface coat between Meloidogyne incognita and M. arenaria related to the adhesion of the bacterium Pasteuria penetrans. Parasitology 1992, 105, 475–480. [Google Scholar] [CrossRef]
  15. Channer, A.G.D.R.; Gowen, S.R. Selection for increased host resistance and increased pathogen specificity in the Meloidogyne—Pasteuria penetrans interaction. Fundam. Appl. Nematol. 1992, 15, 331–339. [Google Scholar]
  16. Gowen, S.R.; Davies, K.G.; Pembroke, B. Potential use of Pasteuria spp. in the management of plant parasitic nematodes. In Integrated Management and Biocontrol of Vegetable and Grain Crops Nematodes; Ciancio, A., Mukerji, K.G., Eds.; Springer: Dortrecht, The Netherlands, 2008; pp. 197–210. [Google Scholar]
  17. Hatz, B.; Dickson, D.W. Effected of temperature on attachment, development and interactions of Pasteuria penetrans and Meloidogyne arenaria. J. Nematol. 1992, 24, 512–521. [Google Scholar] [PubMed]
  18. Davies, K.G.; Laired, V.; Kerry, B.R. The motility development and infection of Meloidogyne incognita encumbered with spores of the obligate hyperparasite Pasteuria Penetrans. Rev. Nematol. 1991, 14, 611–618. [Google Scholar]
  19. Verdejo-Lucas, S. Seasonal population fluctuation of Meloidogyne spp. and the Pasteuria penetrans group in Kiwi orchards. Plant Dis. 1992, 76, 1275–1279. [Google Scholar] [CrossRef]
  20. Ouri, Y. Effect of spore sonication on attachment and host attachment range of Pasteuria penetrans to the root knot nematode. Appl. Entomol. Zool. 1997, 32, 101–107. [Google Scholar] [CrossRef] [Green Version]
  21. Rao, M.S.; Gowen, S.R.; Pembroke, B.; Reddy, P.P. Relationship of Pasteuria penetrans spore encumberance on juveniles of Meloidogyne incognita and their infection in adults. Nematol. Mediterr. 1997, 25, 129–131. [Google Scholar]
  22. Vagelas, I.K.; Dennett, M.D.; Ipsilandis, P.; Pembroke, B.; Gowen, S.R. Understanding the movement of root-knot nematodes encumbered with or without Pasteuria penetrans. Biocontrol Sci. Technol. 2013, 23, 92–100. [Google Scholar] [CrossRef]
  23. Vagelas, I.; Dennett, M.D.; Pembroke, B.; Gowen, S.R. Fitting the negative binomial distribution to Pasteuria penetrans spore attachment on root-knot nematodes and predicting probability of spore attachments using a Markov chain model. Biocontrol Sci. Technol. 2013, 23, 1296–1306. [Google Scholar] [CrossRef]
  24. Davies, K.G.; Kerry, B.R.; Flynn, C.A. Observations on the pathogenicity of Pasteuria penetrans, a parasite of root-knot nematodes. Ann. Appl. Biol. 1988, 112, 491–501. [Google Scholar] [CrossRef]
  25. Vagelas, I.K.; Pembroke, B.; Gowen, S.R. Techniques for image analysis of movement of juveniles of root-knot nematodes encumbered with Pasteuria penetrans spores. Biocontrol Sci. Technol. 2011, 21, 239–250. [Google Scholar] [CrossRef]
  26. Vagelas, I.K.; Dennett, M.D.; Pembroke, B.; Gowen, S.R. Adhering Pasteuria penetrans endospores affect movements of Root-Knot Nematode juveniles. Phytopathol. Mediterr. 2012, 51, 618–624. [Google Scholar]
  27. Leontopoulos, S.V.; Petrotos, K.; Anatolioti, V.; Skenderidis, P.; Tsilfoglou, S.; Vagelas, I. Chemotactic responses of Pseudomonas oryzihabitans and second stage juveniles of Meloidogyne javanica on tomato root tip exudates. Int. J. Food Biosyst. Eng. 2017, 5, 75–100. [Google Scholar]
  28. Leontopoulos, S.; Petrotos, K.; Anatolioti, V.; Skenderidis, P.; Tsilfoglou, S.; Papaioannou, C.; Kokkora, M.; Vagelas, I. Preliminary studies on mobility and root colonization ability of Pseudomonas oryzihabitans. Int. J. Food Biosyst. Eng. 2017, 3, 73–89. [Google Scholar]
  29. Mankau, R.; Imbriani, J.L. The life-cycle of an endoparasite in some tylenchid nematodes. Nematologica 1975, 21, 89–94. [Google Scholar] [CrossRef]
  30. Sayre, R.M.; Wergin, W.P. Bacterial parasite of a plat nematode: Morphology and ultrastructure. J. Bacteriol. 1977, 129, 1091–1101. [Google Scholar] [CrossRef] [PubMed] [Green Version]
  31. Darban, D.A.; Pembroke, B.; Gowen, S.R. The relationships of time and temperature to body weight and numbers of endospores in Pasteuria penetrans-infected Meloidogyne javanica females. Nematology 2004, 6, 33–36. [Google Scholar] [CrossRef]
  32. Hussey, R.S.; Barker, K.R. A Comparison of methods of collecting inocula of Meloidogyne spp. including a new technique. Plant Dis. Rep. 1973, 57, 1025–1028. [Google Scholar]
  33. Hooper, D.J. Extraction of nematodes from plant materials. In Laboratory Methods for Working with Plant and Soil Nematodes, 6th ed.; Southey, J.F., Ed.; Her Majesty’s Stationary Office: London, UK, 1986; pp. 51–58. [Google Scholar]
  34. Ross, G.J.S.; Preece, D.A. The negative binomial distribution. Statistician 1985, 34, 323–336. [Google Scholar] [CrossRef]
  35. Vagelas, I. Data analysis and modeling of Pasteuria penetrans spore attachment. Int. J. Agric. Environ. Sci. 2020, 7, 108–113. [Google Scholar]
  36. Bliss, C.I. Fitting the negative binomial distribution to biological data. Biometrics 1953, 9, 176–200. [Google Scholar] [CrossRef]
  37. Binet, F.E. Fitting the negative binomial distribution. Biometrics 1986, 42, 989–992. [Google Scholar] [CrossRef]
  38. Cox, D.R. Some remarks on overdispersion. Biometrika 1983, 70, 269–274. [Google Scholar] [CrossRef]
  39. Morel, G.J.; Nagaraj, K.J. A finite mixture distribution for modelling multinomial extra variation. Biometrika 1993, 80, 363–371. [Google Scholar] [CrossRef]
  40. Barbour, A.D.; Kafetzaki, M. Modeling the overdispersion of parasite loads. Math. Biosci. 1991, 107, 249–253. [Google Scholar] [CrossRef]
  41. Rodríguez-Avi, J.; Conde-Sánchez, A.; Sáez-Castillo, A.J.; Olmo-Jiménez, M.J.; Martínez-Rodríguez, A.M. A generalized Waring regression model for count data. Comput. Stat. Data Anal. 2009, 53, 3717–3725. [Google Scholar] [CrossRef]
  42. Cueva-López, V.; Olmo-Jiménez, M.J.; Rodríguez-Avi, J. EM algorithm for an extension of the Waring distribution. Comput. Math. Methods 2019, 1, e1046. [Google Scholar] [CrossRef] [Green Version]
  43. Rivas, L.; Galea, M. Influence analysis for the generalized Waring regression model. J. Appl. Stat. 2020, 47, 1–27. [Google Scholar] [CrossRef]
  44. Cueva-López, V.; Olmo-Jiménez, M.J.; Rodríguez-Avi, J. An Over and Underdispersed Biparametric Extension of the Waring Distribution. Mathematics 2021, 9, 170. [Google Scholar] [CrossRef]
  45. Proschan, F.; Pyke, R. Tests for monotone failure rate. Fifth Berkley Symp. 1967, 3, 293–313. [Google Scholar]
  46. Bickel, P.J.; Doksum, K.A. Tests for monotone failure rate based on normalized spacings. Ann. Math. Stat. 1969, 40, 1216–1235. [Google Scholar] [CrossRef]
  47. Osei, F.B.; Stein, A.; Ofosu, A. Poisson-Gamma mixture spatially varying coefficient modeling of small-area intestinal parasites infection. Int. J. Environ. Res. Public Health 2019, 16, 339. [Google Scholar] [CrossRef] [Green Version]
Figure 1. JASP output for P. penetrans spores’ attachment. Boxplots with violins and jittered data are shown separately for the four exposure times of the estimates for the attachment of P. penetrans to J2s.
Parasitologia 02 00018 g001
Figure 2. Negative binomial distribution plots for P. penetrans spores’ attachment: (a) probability mass function (PMF); and (b) cumulative distribution function (CDF). (a) displays a histogram of the selected variable overlayed with the probability density function of the fitted distribution (dots). (b) displays an empirical cumulative distribution plot overlayed with the cumulative distribution function of the fitted distribution (solid line).
Parasitologia 02 00018 g002
Figure 3. Poisson distribution plots for P. penetrans spores’ attachment: (a) probability mass function (PMF); and (b) cumulative distribution function (CDF). (a) displays a histogram of the selected variable overlayed with the probability density function of the fitted distribution (dots). (b) displays an empirical cumulative distribution plot overlayed with the cumulative distribution function of the fitted distribution (solid line).
Parasitologia 02 00018 g003
Figure 4. JASP output for P. penetrans spores’ attachment. Boxplots with violins and jittered data are separately shown for the four exposure times of the estimates for the attachment of P. penetrans to J2s.
Parasitologia 02 00018 g004
Figure 5. Cumulative distribution function (CDF) for Poisson and negative binomial distribution for P. penetrans spores’ attachment, where (a) the CDF for Poisson distribution and (b) the CDF for negative binomial distribution.
Parasitologia 02 00018 g005
Figure 6. Effect of P. penetrans (P.p.) spores’ attachment on gall formation when J2s were encumbered with 24–32 or 6–11 P.p. spores at exposure times of 36 and 9 h, respectively.
Parasitologia 02 00018 g006
Figure 7. Effect of P. penetrans (P.p.) spores’ attachment on egg mass formation when J2s were encumbered with 24–32 or 6–11 P.p. spores at exposure times of 36 and 9 h, respectively.
Parasitologia 02 00018 g007
Figure 8. Plots (panels) reflecting the effect of P. penetrans (P.p.) spores’ attachment on egg mass formation when J2s were encumbered with 24–32 or 6–11 P.p. spores at exposure times of 36 and 9 h, respectively. “Ghost Lines” (red lines) repeat the pattern from one to the others, making it easier to compare the differences between the panels.
Parasitologia 02 00018 g008
Figure 9. JASP (open source statistical software) output for P. penetrans spores’ attachment. Boxplots with violins and jittered data are shown separately for the P. penetrans spores’ densities such as 0, 5000 and 15,000 P. penetrans spores/mL in sandy loam soil bioassays.
Parasitologia 02 00018 g009
Figure 10. Negative binomial distribution plots for P. penetrans spores’ attachment: (a) probability mass function (PMF) and (b) cumulative distribution function (CDF). (a) displays a histogram of the selected variable overlayed with the probability density function of the fitted distribution (dots). (b) displays an empirical cumulative distribution plot overlayed with the cumulative distribution function of the fitted distribution (solid line).
Parasitologia 02 00018 g010
Figure 11. Poisson distribution plots for P. penetrans spores’ attachment: (a) probability mass function (PMF) and (b) cumulative distribution function (CDF). (a) displays a histogram of the selected variable overlayed with the probability density function of the fitted distribution (dots). (b) displays an empirical cumulative distribution plot overlayed with the cumulative distribution function of the fitted distribution (solid line).
Parasitologia 02 00018 g011
Figure 12. JASP output for P. penetrans spores’ attachment. Boxplots with violins and jittered data are shown separately for the four P. penetrans spores’ densities, namely 0, 500, 5000, and 15,000 P. penetrans spores/mL in loam soil bioassays.
Parasitologia 02 00018 g012
Figure 13. Negative binomial distribution plots for P. penetrans spores’ attachment: (a) probability mass function (PMF) and (b) cumulative distribution function (CDF). (a) displays a histogram of the selected variable overlayed with the probability density function of the fitted distribution (dots). (b) displays an empirical cumulative distribution plot overlayed with the cumulative distribution function of the fitted distribution (solid line).
Parasitologia 02 00018 g013
Figure 14. Poisson distribution plots for P. penetrans spores’ attachment: (a) probability mass function (PMF) and (b) cumulative distribution function (CDF). (a) displays a histogram of the selected variable overlayed with the probability density function of the fitted distribution (dots). (b) displays an empirical cumulative distribution plot overlayed with the cumulative distribution function of the fitted distribution (solid line).
Parasitologia 02 00018 g014
Figure 15. Descriptive plot for the J2s’ invasion in treatments with different dose densities of P. penetrans spores and two soil types, namely sandy loam and loam soil. Error bars represent 95% confidence interval.
Parasitologia 02 00018 g015
Figure 16. Descriptive plot for J2s’ attachment in treatments with different dose densities of P. penetrans spores and two soil types, namely sandy loam and loam soil. Error bars represent 95% confidence interval.
Parasitologia 02 00018 g016
Figure 17. Plots (panels) reflecting the relationship between the nematodes invasion (J2s/root) and J2s encumbered with P. penetrans spores (P. penetrans spores/J2) when treated with 5000 or 15,000 Pp spores/mL. “Ghost Line” (red line) repeats the pattern from one to the others, making it easier to compare the differences among panels.
Parasitologia 02 00018 g017
Figure 18. Plots (panels) reflecting the relationship between the nematodes invasion (J2s/root) and J2s encumbered with P. penetrans spores (P. penetrans spores/J2) in two soil types (sandy loam and loam soil). “Ghost Line” (red line) repeats the pattern from one to the others, making it easier to compare the difference between panels.
Parasitologia 02 00018 g018
Figure 19. Generalized linear modeling plot reflecting the relationship between nematodes invasion (J2s/root) and J2s encumbered with P. penetrans spores (P. penetrans spores/J2) in two soil types (sandy loam and loam soil). “Ghost Lines” (red narrow line) repeat the pattern from one to the others, making it easier to compare the differences between panels.
Parasitologia 02 00018 g019
Figure 20. Individual distribution identification, e.g., gamma (γ), to choose the distribution that best fits the current data.
Parasitologia 02 00018 g020
Figure 21. Nonlinear regression model which visually indicates that the model fits the data (response(Y): J2/root; predictor(X): P. penetrans spores/J2).
Parasitologia 02 00018 g021
Table 1. Descriptive statistics of P. penetrans spores’ attachment at different times of exposure.
P. penetrans Spores/J2
1 h3 h6 h9 h
Sample size (n)40404040
Mean0.5132.0253.2758.600
Std. deviation0.7211.6412.5224.131
Variance (s2)0.5202.6926.35817.067
Table 2. Estimate of the best fit probability for NB and Poisson distribution.
Negative Binomial (NB) DistributionPoisson Distribution
TestStatisticpTestStatisticp
Chi-square5.3820.996Chi-square38,827.259<0.001
Table 3. Descriptive statistics of P. penetrans spores’ attachment at different times of exposure.
P. penetrans Spores/J2
36 h9 h
Sample size (n)4040
Mean28.28.6
Std. deviation6.54.1
Variance42.617.1
25th percentile24.06.0
50th percentile27.58.5
75th percentile32.011.2
Table 4. Loam bioassay: estimate of the best fit probability for NB and Poisson distribution.
Negative Binomial (NB) DistributionPoisson Distribution
TestStatisticpTestStatisticp
Chi-square10.7080.098Chi-square94.087<0.001
Table 5. The estimate of the best fit probability for NB and Poisson distribution.
Negative Binomial (NB) DistributionPoisson Distribution
TestStatisticpTestStatisticp
Chi-square2.7410.602Chi-square10.4390.034
Table 6. ANOVA table for J2s’ invasion encumbered in treatments with different dose densities of P. penetrans spores and two soil types (sandy loam and loam soil).
CasesSum of SquaresdfMean SquareFp
Soil type2106.75012106.75055.780<0.001
P. penetrans spores density2945.33312945.33377.983<0.001
Soil type P. penetrans spores density14.083114.0830.3730.545
Residuals1661.8334437.769
Table 7. ANOVA table for J2s’ attachment in treatments with different dose densities of P. penetrans spores and two soil types (sandy loam and loam soil).
CasesSum of SquaresdfMean SquareFp
Soil type487.6871487.68772.843<0.001
P. penetrans spores density595.0211595.02188.874<0.001
Soil type P. penetrans spores density63.021163.0219.4130.004
Residuals294.583446.695
Table 8. Coefficients table (regression analysis) of P. penetrans spores’/J2 vs. P. penetrans spores’ density; soil type.
Coefficients Ordinary Linear RegressionPoisson Regression
TermCoefSE CoefT-Valuep-ValueVIFCoefSE CoefZ-Valuep-ValueVIF
Constant−1.9170.997−1.920.061 0.6310.1613.910.000
P. penetrans spores density0.0007040.0000818.650.0001.000.0000900.0000118.180.0001.00
Soil type
Sandy loam6.3750.8147.830.0001.000.8080.1087.460.0001.00
Table 9. Descriptive statistics of (J2s/root) and J2s encumbered with P. penetrans spores (P.p spores density) in two soil types (sandy loam and loam soil).
J2/RootJ2s Encumbered with P. penetrans Spores
P.p Spores’ DensitySoil TypeP.p Spores’ DensitySoil Type
500015,000LoamSandy Loam500015,000LoamSandy Loam
Sample size (n)2424242424242424
Mean41.33325.66740.12526.8754.79211.8335.12511.500
Std. deviation10.0078.02010.5889.4243.1485.1813.2755.540
Variance100.14564.319112.11488.8109.91126.84110.72330.696
Table 10. A measure of the central tendencies of P. penetrans attachment in sandy loam and loam soil based on a Mann–Whitney test: two-sample rank sum test and Wilcoxon: one-sample signed rank test.
Mann–Whitney TestWilcoxon Signed Rank Test
nMedianCI for DifferenceAchieved ConfidenceMedianCI for DifferenceAchieved Confidence
247(3; 10)95.11%6.25(4.5; 8)94.97%
Table 11. Nonlinear model, parameter estimates.
ParameterEstimateSE Estimate
b164.40271.47605
b2−7.43600.56964
b30.47740.05932
b4−0.01150.00180
Table 12. Odds for continuous predictors (J2/root and P. penetrans spores/J2).
Odds Ratio95% CI
J2/root0.9728(0.6995; 1.3526)
P. penetrans spores/J22.8310(0.8308; 9.6463)
Publisher’s Note: MDPI stays neutral with regard to jurisdictional claims in published maps and institutional affiliations.

