1. Introduction
Thousands of injuries and deaths occur every year due to falls from height, which are the subject of accidents, suicides and homicides, including cases where individuals are pushed or forced to fall [
1]. According to the World Health Organization, approximately 684,000 people die each year worldwide by falling from height [
2]. The physical quantities examined in a fall event are fall height, initial velocity, impact velocity, impulse, impact energy, reaction time at impact, flight trajectory, flight time, and horizontal distance [
3].
The onset of fatal falls from height can be categorized into three categories: jumping (suicide), being pushed or forced to fall (homicide), and falling (accident). Although there have been studies on deaths and injuries as a result of free falls, very few objective studies have been conducted on the mechanics and fuzzy simulations of fall causes [
4]. One study investigated the dependence of injuries and deaths in falls from height on the person’s height, weight, velocity, type of fall, the characteristics of the surface onto which the person fell, and the elasticity and density of the body tissue in contact [
5]. In another study, a biomechanical framework for skeletal injury analysis in upright falls was developed, integrating stress propagation, fracture risk modeling, and injury clustering [
6].
The examination of the anatomical body region that first hits the ground provides important information for the reconstruction of the event. Numerical simulation and biomechanical modeling have significantly advanced the differentiation of accidental, suicidal, and homicidal falls from balconies or heights [
7,
8]. Although less common in bridge jumps or high falls, foot strikes and fractures are encountered when falling from an upright position, where stress distribution plays a primary role upon landing [
6,
7].
Some experimental studies are carried out to investigate cases of falls from height. Live human experiments are dangerous after a certain height. Even if they are conducted at appropriate heights, these experiments cannot represent real body reactions because they are carried out in an informed and controlled manner. Another experimental method is testing with single-body or multi-body dummies. Single-body experimental models are based on the use of anthropometric testing devices and have significant shortcomings [
9]. Current validated single-body dummies cannot reproduce the actual anatomy of the victim, requiring many generalizations and assumptions [
10]. To overcome physical dummy limitations, computational finite element analysis (FEA) and multi-body dynamics have increasingly been adopted to model tissue-level stress propagation and impact kinematics [
11]. Furthermore, classical forensic physics provides fundamental insights into the calculation of flight dynamics and impact forces [
12].
Fall from height incidents can generally be evaluated in two situations: the beginning of the movement and the moment of impact. It may be possible to decide whether the incident was suicide or homicide by considering the position of impact. If the person runs and then makes a jump, the distance traveled horizontally will be greater than in the case of a jump from a standing position. Therefore, in such cases, the fall is more likely to be voluntary, although this alone is not sufficient to exclude other possibilities. If there is no pre-running or jumping at the onset of the fall, it becomes much more difficult or impossible to determine whether it was suicide, homicide or accident. These distinctions can only be made by examining more data, taking negligence into account, making detailed calculations, and applying numerical fall reconstructions [
7,
8]. Recent machine learning frameworks integrated with trajectory optimization further strengthen the objective differentiation of initial jump parameters in complex forensic cases [
13].
2. Materials and Methods
In this study, the video footage of the pushing from behind incident [
14], which can be defined as a non-homicide accident, was analyzed. This incident is considered as a simulation of a homicide incident and methods are developed to obtain data that can be used in solving similar incidents.
Height information was obtained as 1.61 m from the file. Weight information was calculated as weight = 60 kg using the formula BMI = weight (kg)/(length)2, assuming a normal BMI of 23 from the ‘Body Mass Index’ BMI estimation (underweight–normal–obese). The absence of body weight information is one of the limitations of the study.
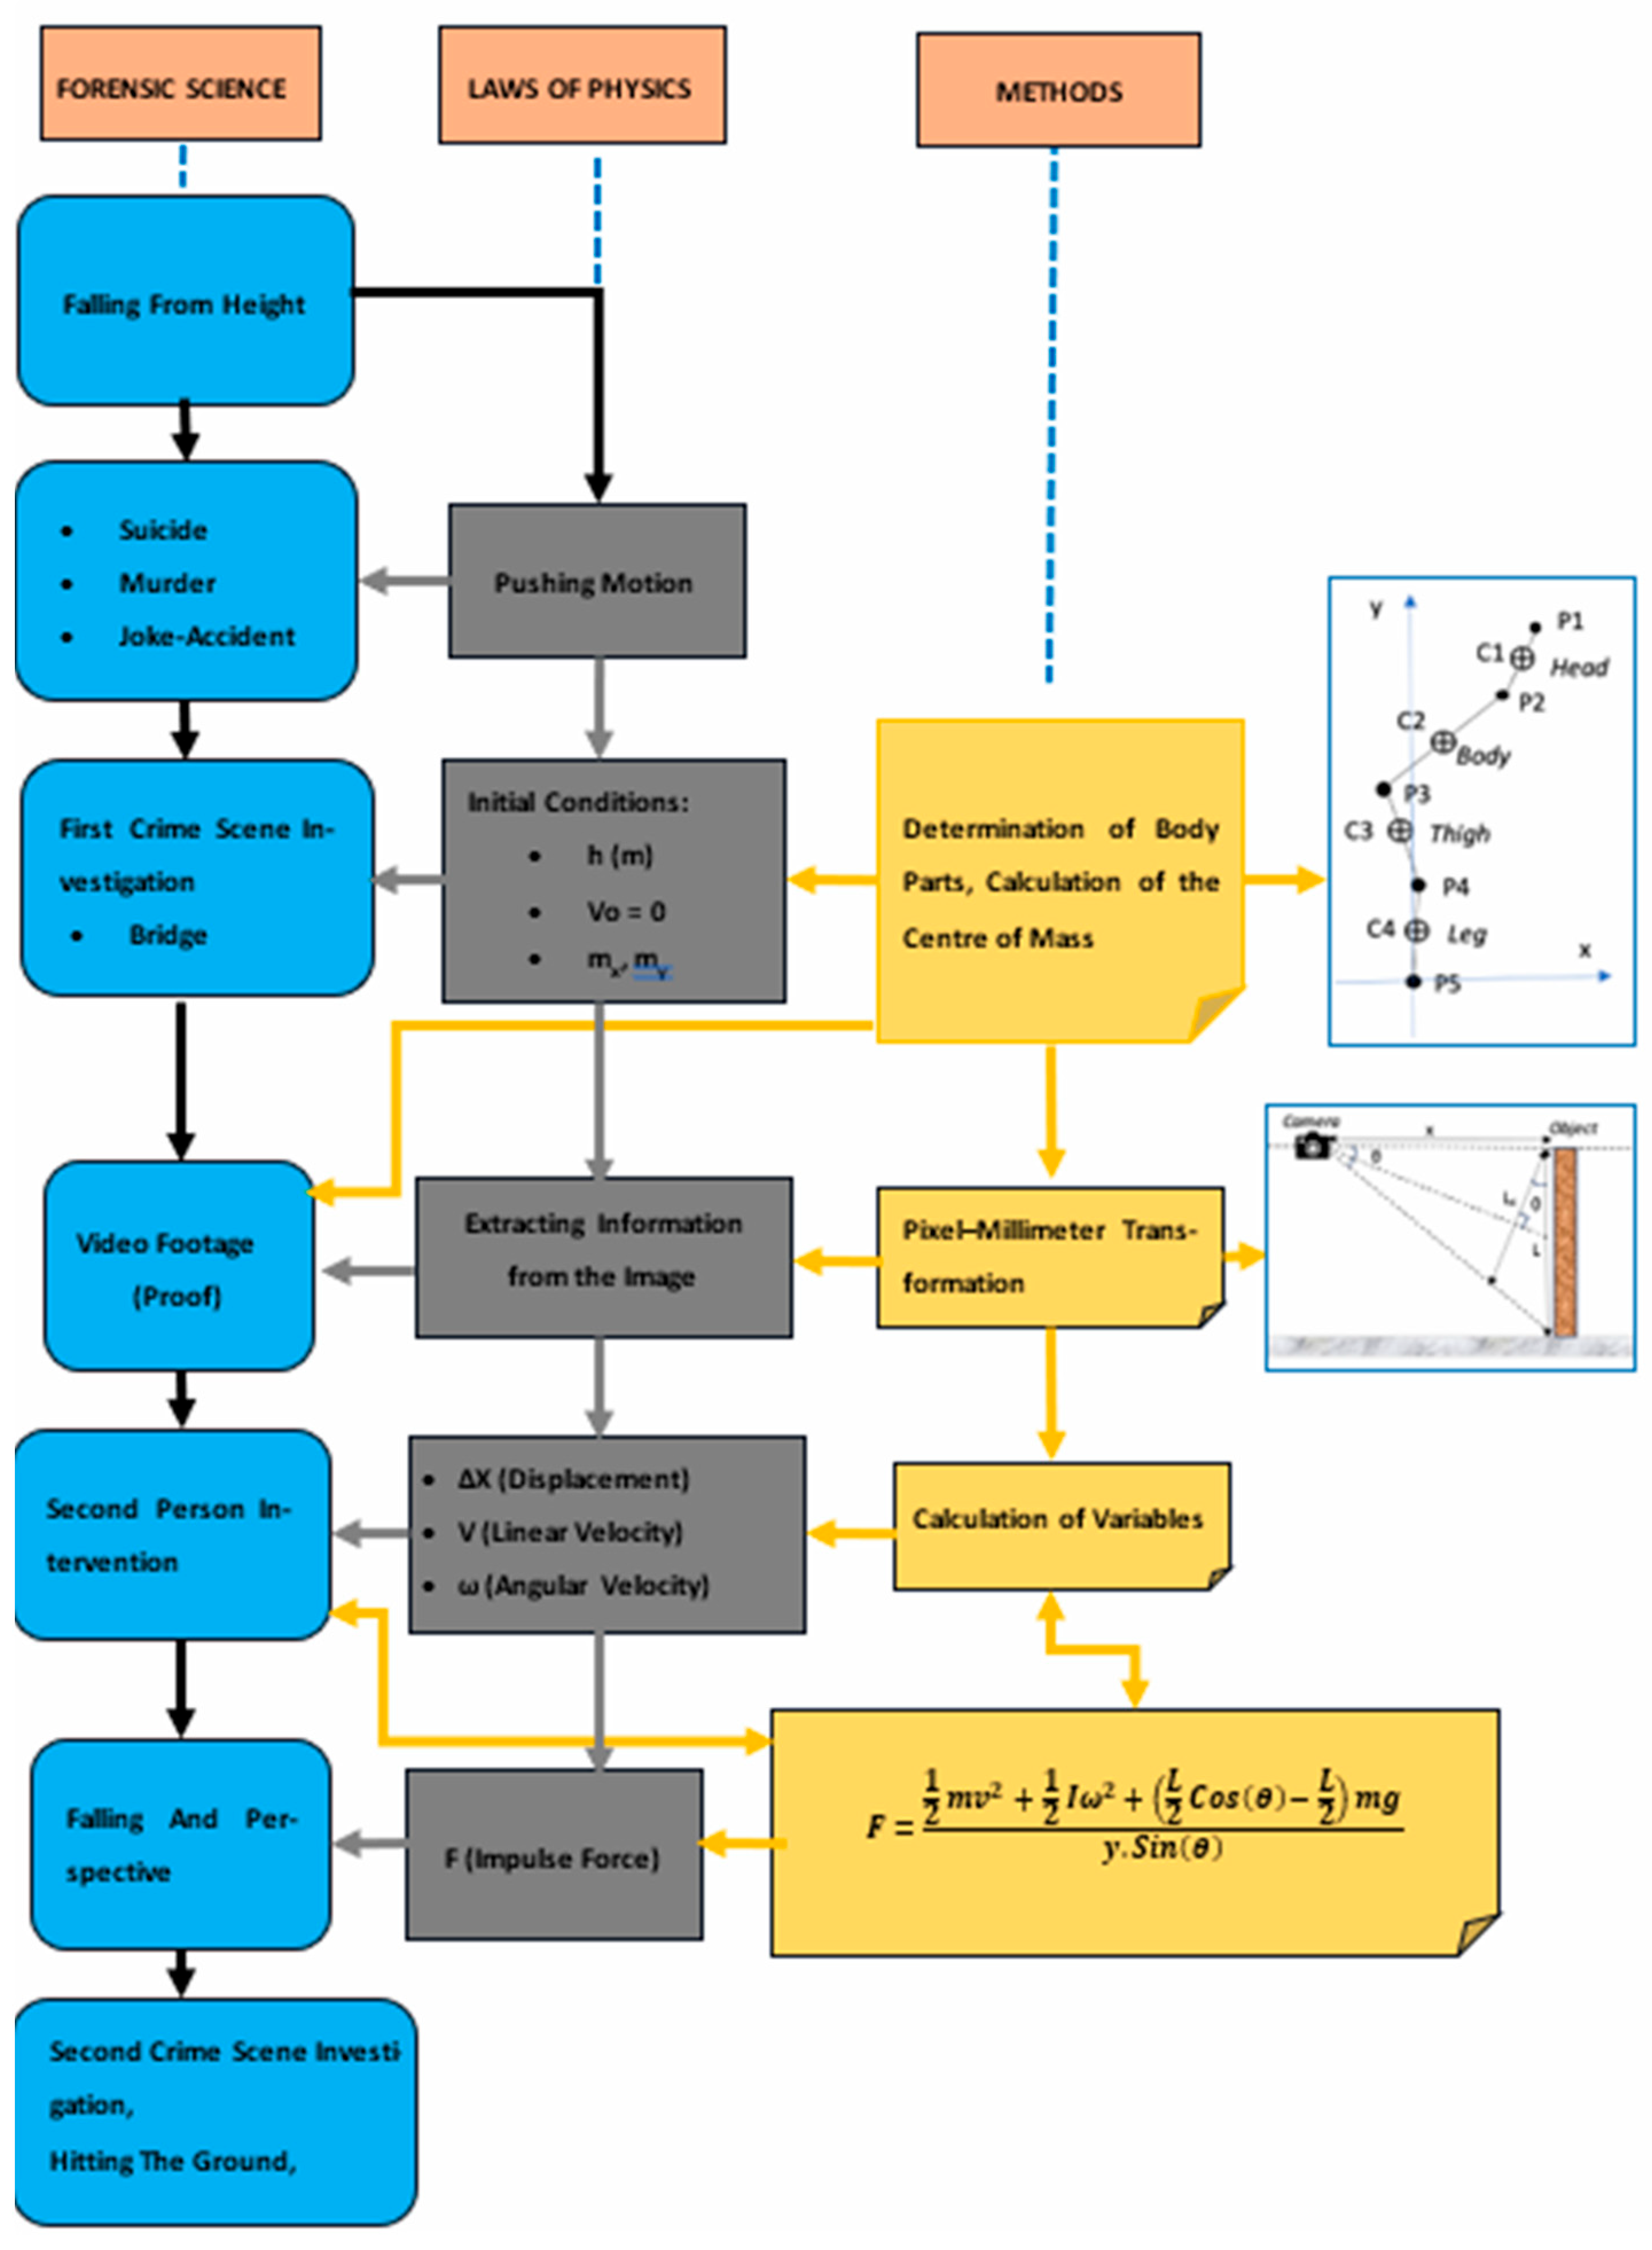
An analysis was conducted utilizing video footage from a publicly documented court case, focusing on an incident where the victim was forcibly propelled off a bridge by her close associate. The investigation involved determining various kinematic parameters such as linear velocity of the center of mass, angular velocity concerning the ankle as the axis of rotation, angular acceleration, and the magnitude of the external force responsible for initiating the motion. The analysis encompassed the duration from the commencement of the pushing action by the second individual to the point where the victim’s feet disengage from the platform, as depicted in the video footage.
In order to determine the linear and angular velocity of the human body in the video relative to a fixed reference system, it is necessary to accurately determine the position of the center of mass of the body in each frame of the video. Since the time between each frame is a known value in the video recording, the linear velocity in pixels/s was calculated from this time and position information, and then the angular velocity relative to the fixed point (ankle), was calculated. The moment of inertia was also approximated using the mass and height information of the body. The application point of the force on the frame defining the beginning of the motion was determined and the distance of the force application point to the axis of rotation was obtained from the pixel–meter conversion. Using this derived information and the dynamic laws of physics, the thrust force was calculated.
Figure 1 shows the general flow diagram of information extraction from video footage and its relationship with forensic sciences.
2.1. Identifying Limbs on a Picture
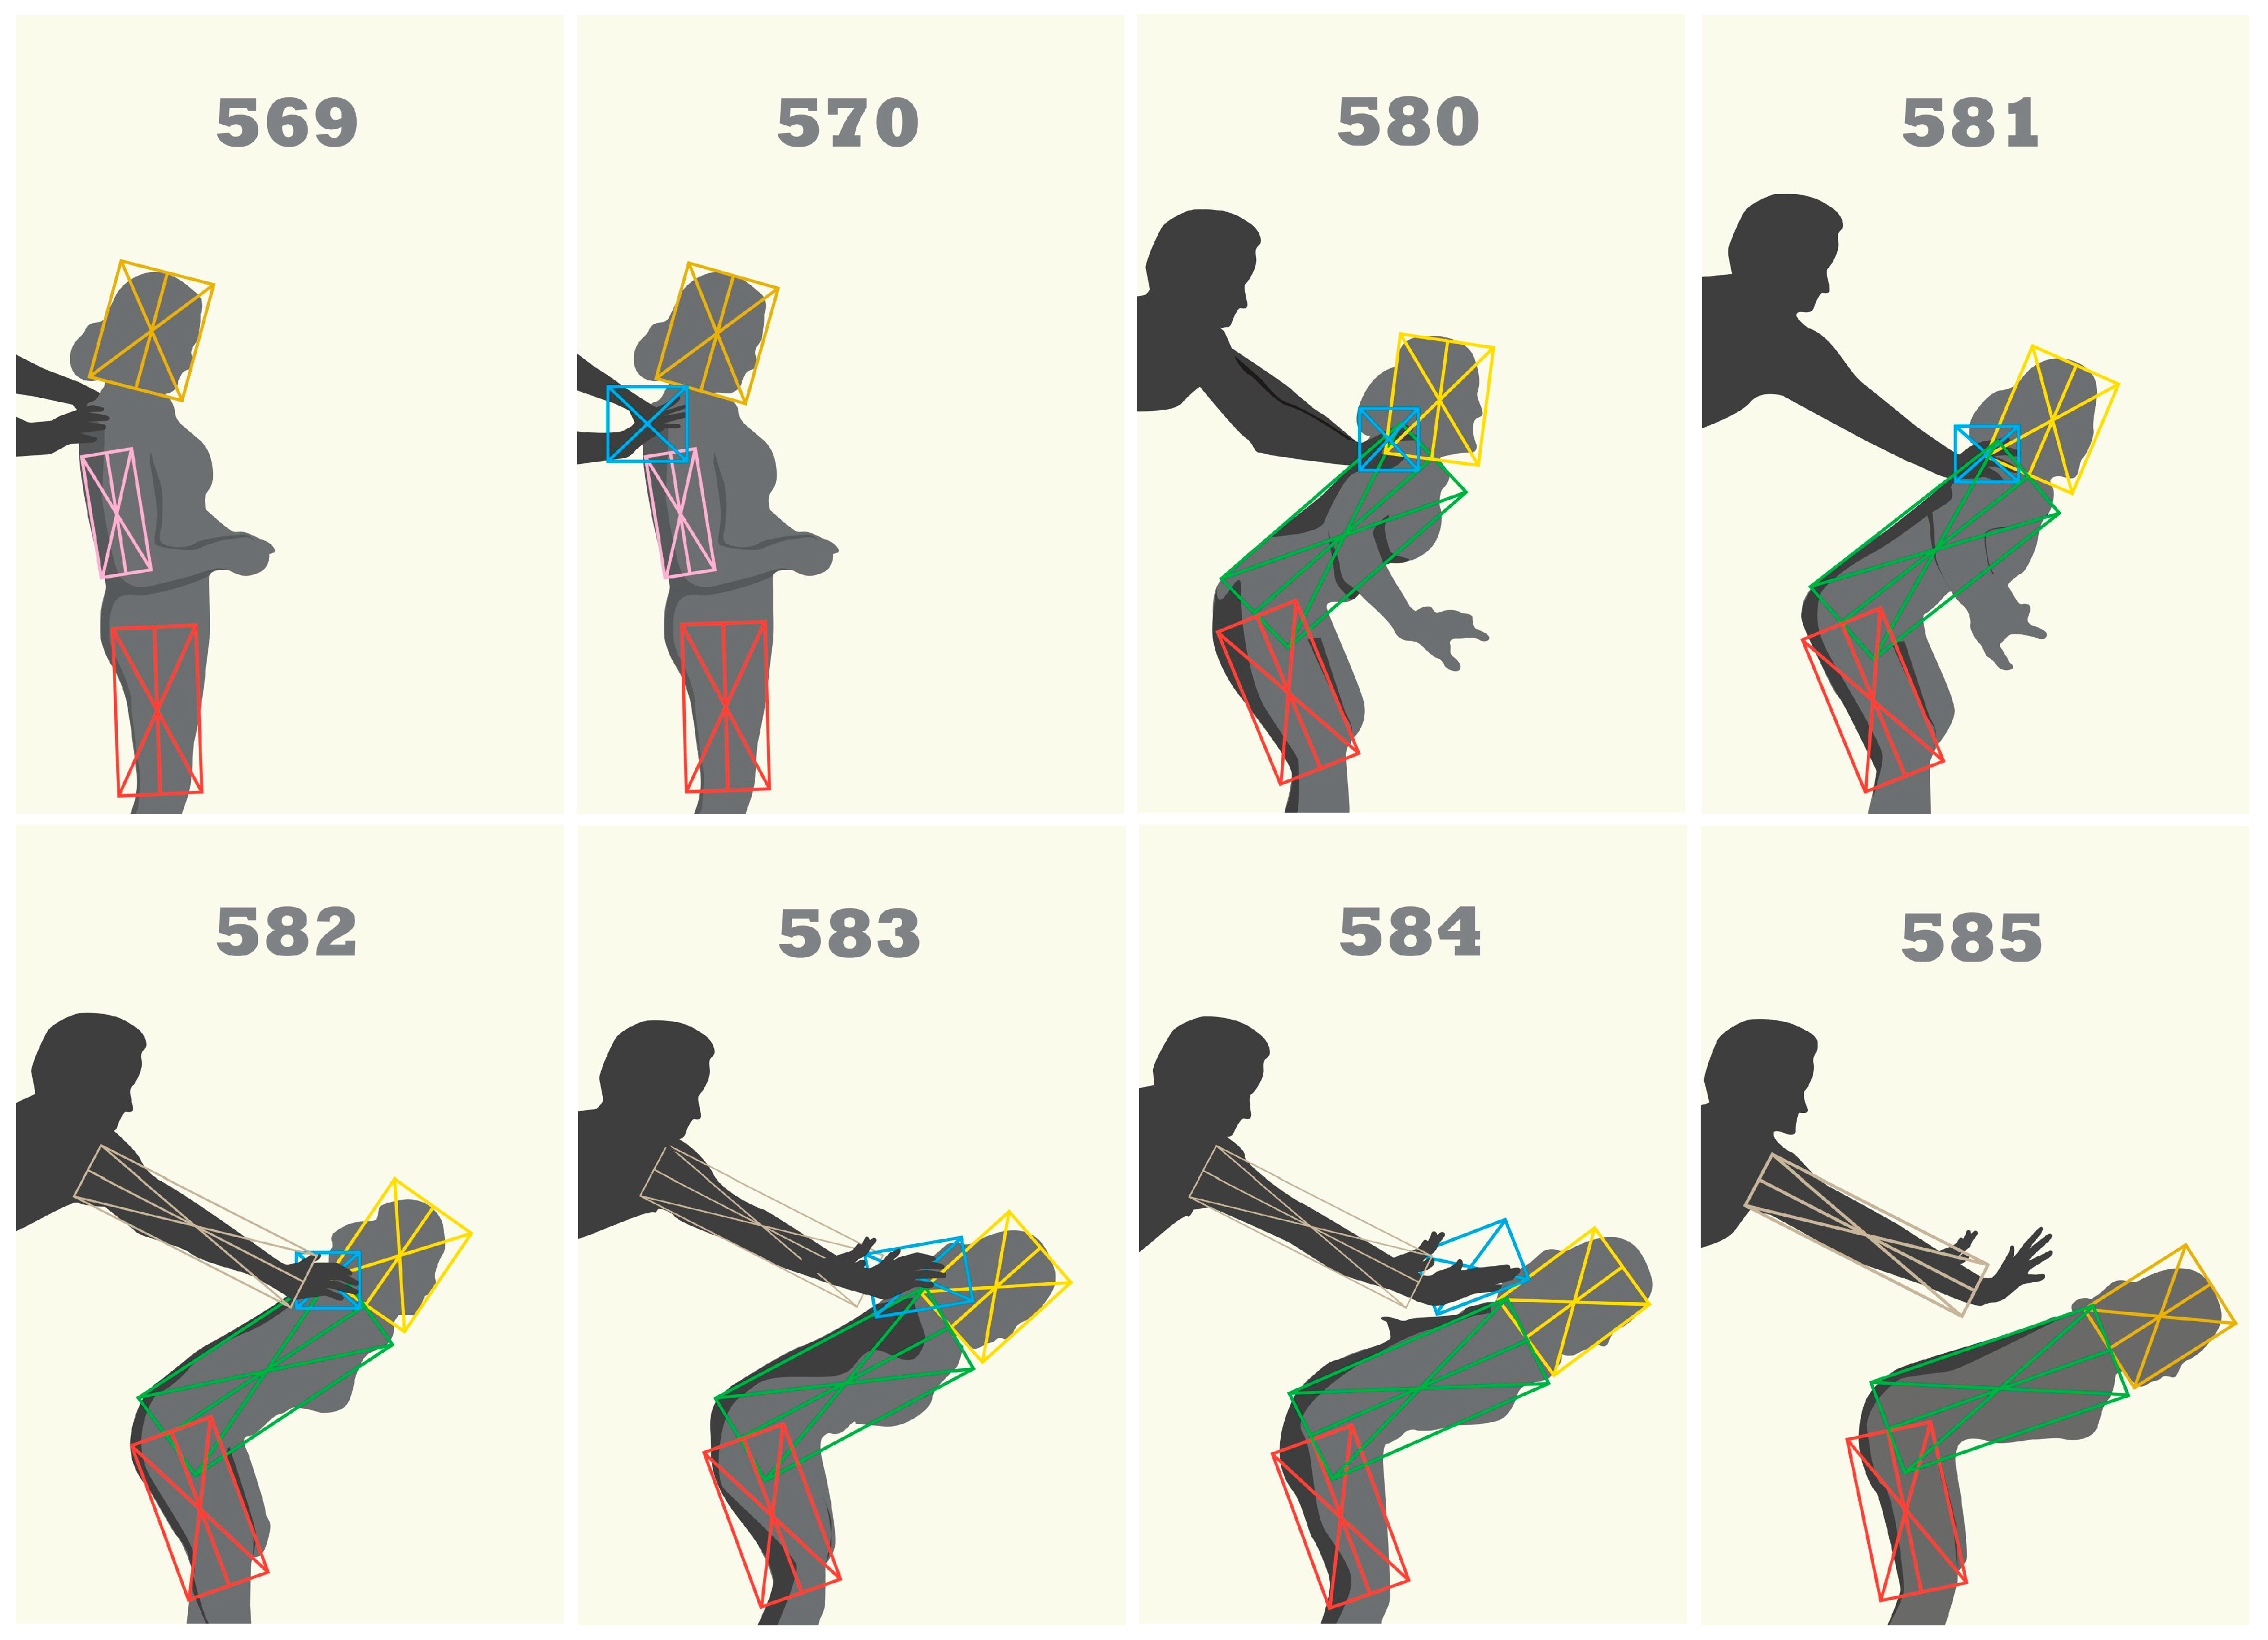
A video recording consists of consecutive pictures or frames. The time between two frames is equal to the inverse of the number of frames per second (fps) of the video. In the first phase of the study, the frames were converted into jpg format images. This was done with a special software in Python 3.12.10 programming language. All images are in jpg format, with the same resolution and size. In the case of the video, the images from the moment the pushing started until the moment of falling from the platform were selected for study. The 17 frames included in the analysis were recorded over 567 ms. The camera viewpoint of the video recording under study was taken approximately perpendicular to the plane of motion of the body. During this short period of time, the distance of the mover from the camera is assumed constant.
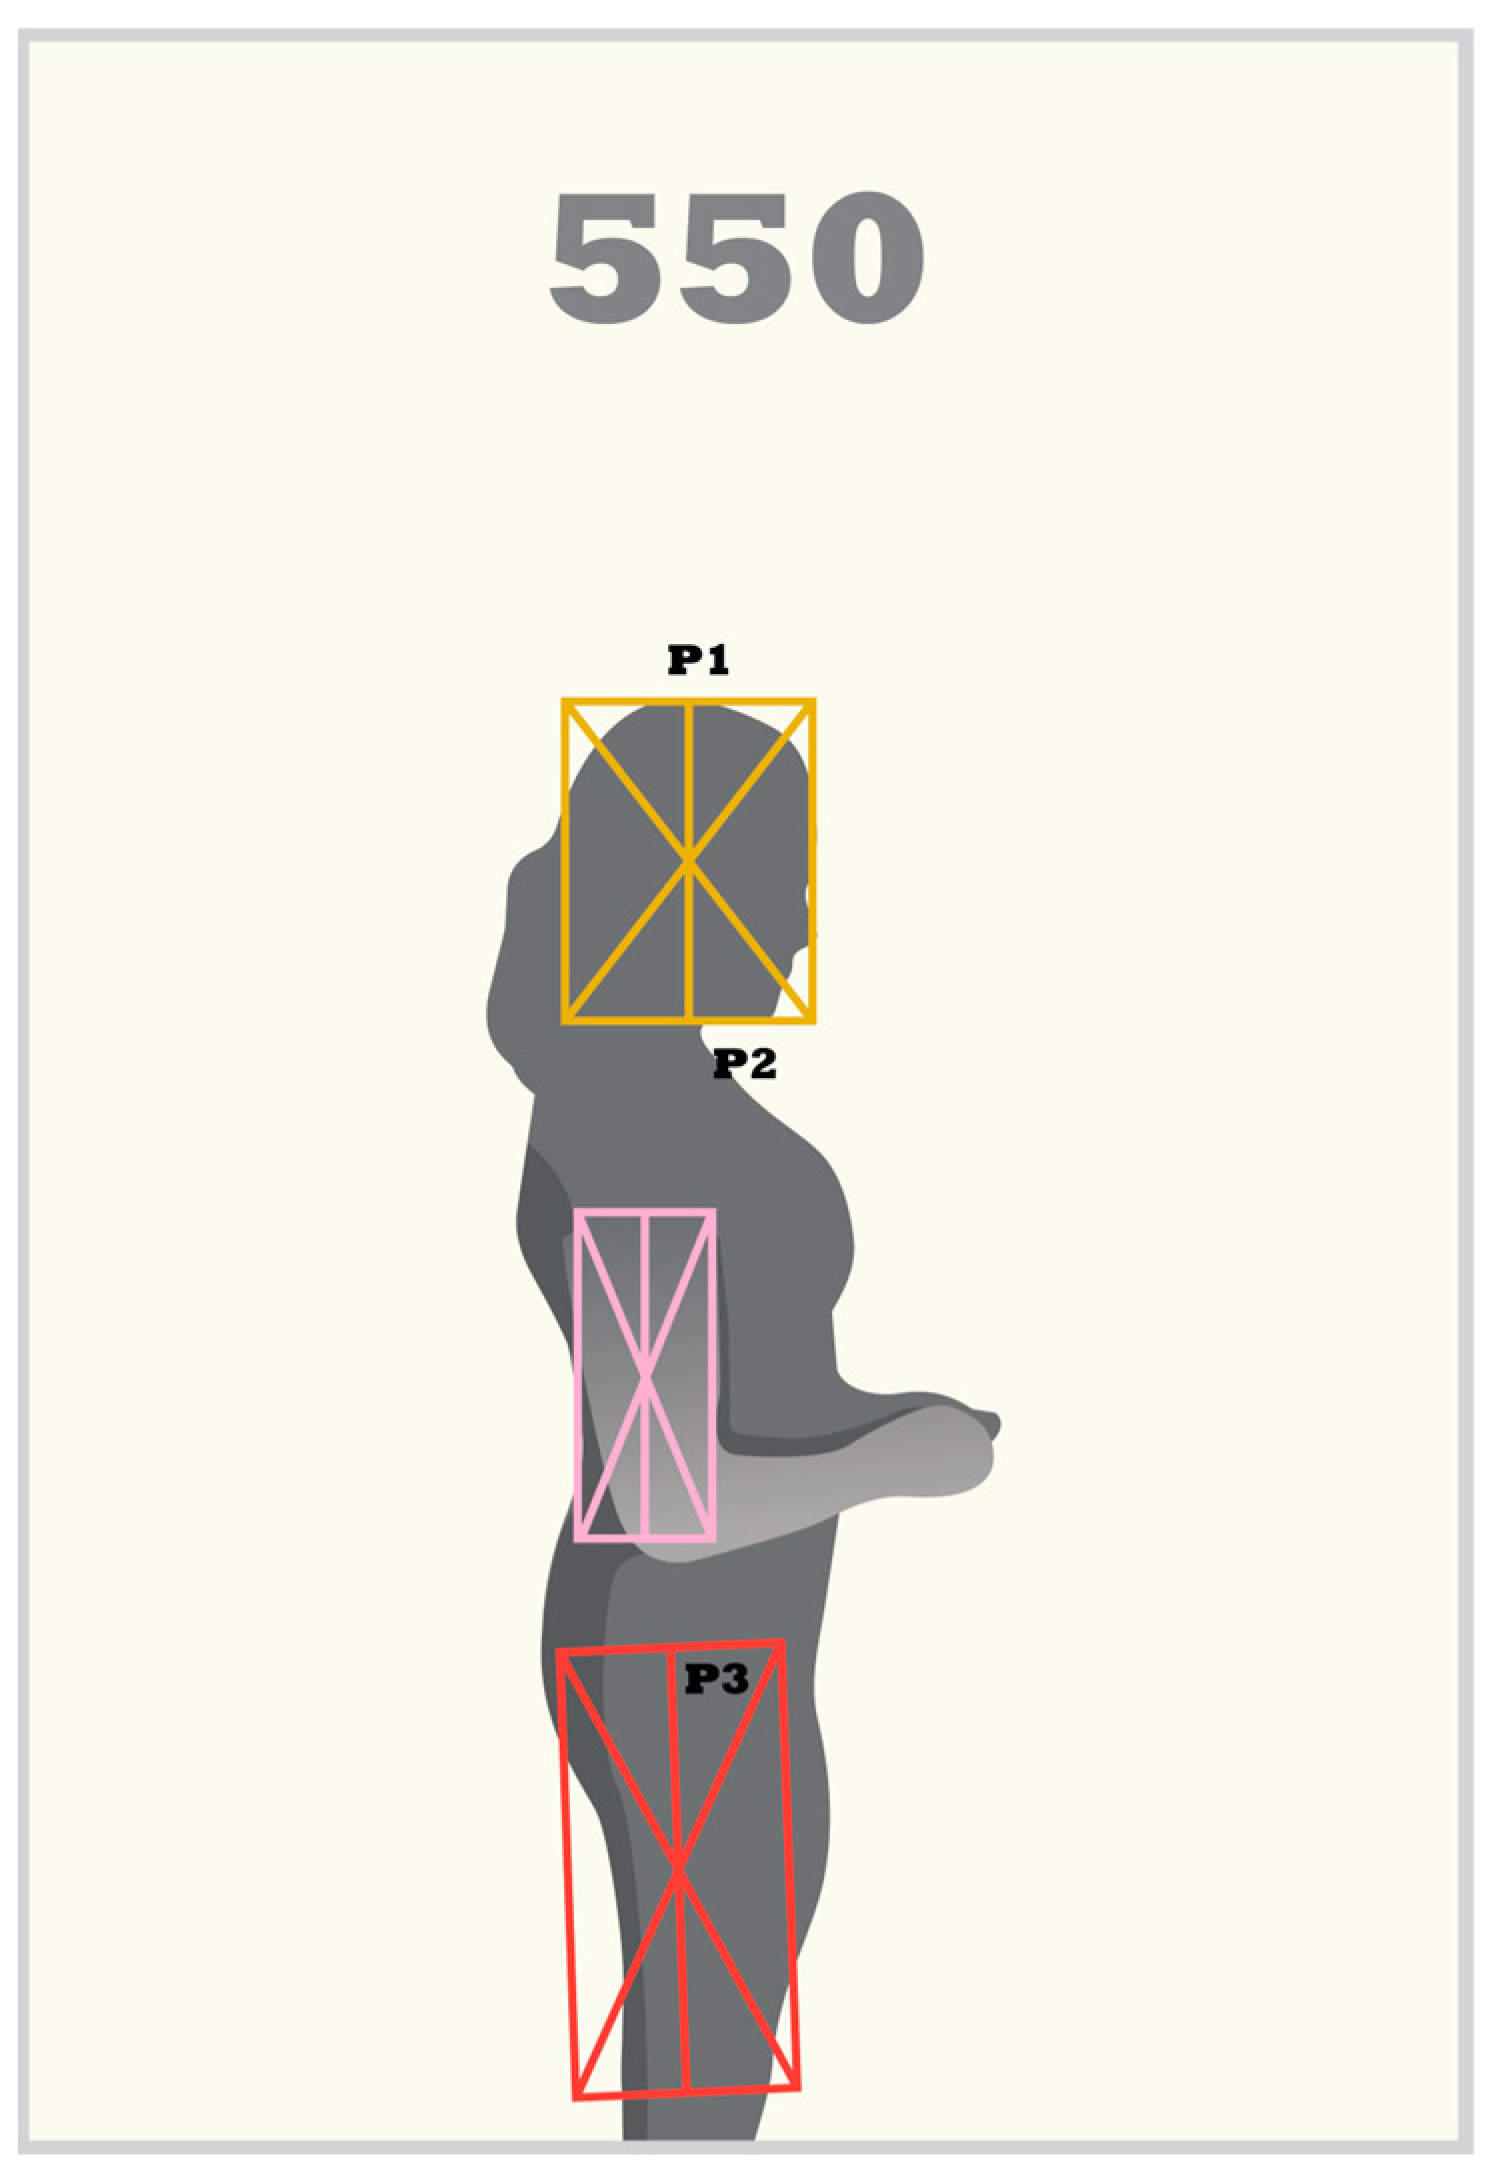
In order to find the center of mass of the human body in the pictures, separate rectangles for the head, torso, thigh and leg regions were drawn with their diagonals as in
Figure 2. These rectangles outline the boundaries of the limbs. The same rectangles were then moved to other frames without changing their dimensions, used to delimit the same limb and rotated when necessary. This process was used to accurately determine the position of the center of mass of the limb in each frame.
2.2. Determination of Joints of Limbs
In order to determine the positions of the centers of mass of the limbs in the two-dimensional plane, it is necessary to determine the axes of rotation of the limbs relative to each other. The axes of rotation were taken at the joint of the limbs, positioned at the anthropometric intersection plane in the relevant literature. The axes of rotation are perpendicular to the sagittal plane of the body. In total, 4 limbs are considered: the head; torso and arms; thighs; and legs. The feet are excluded from the body because they are immobile and have no effect on the moment of inertia calculation.
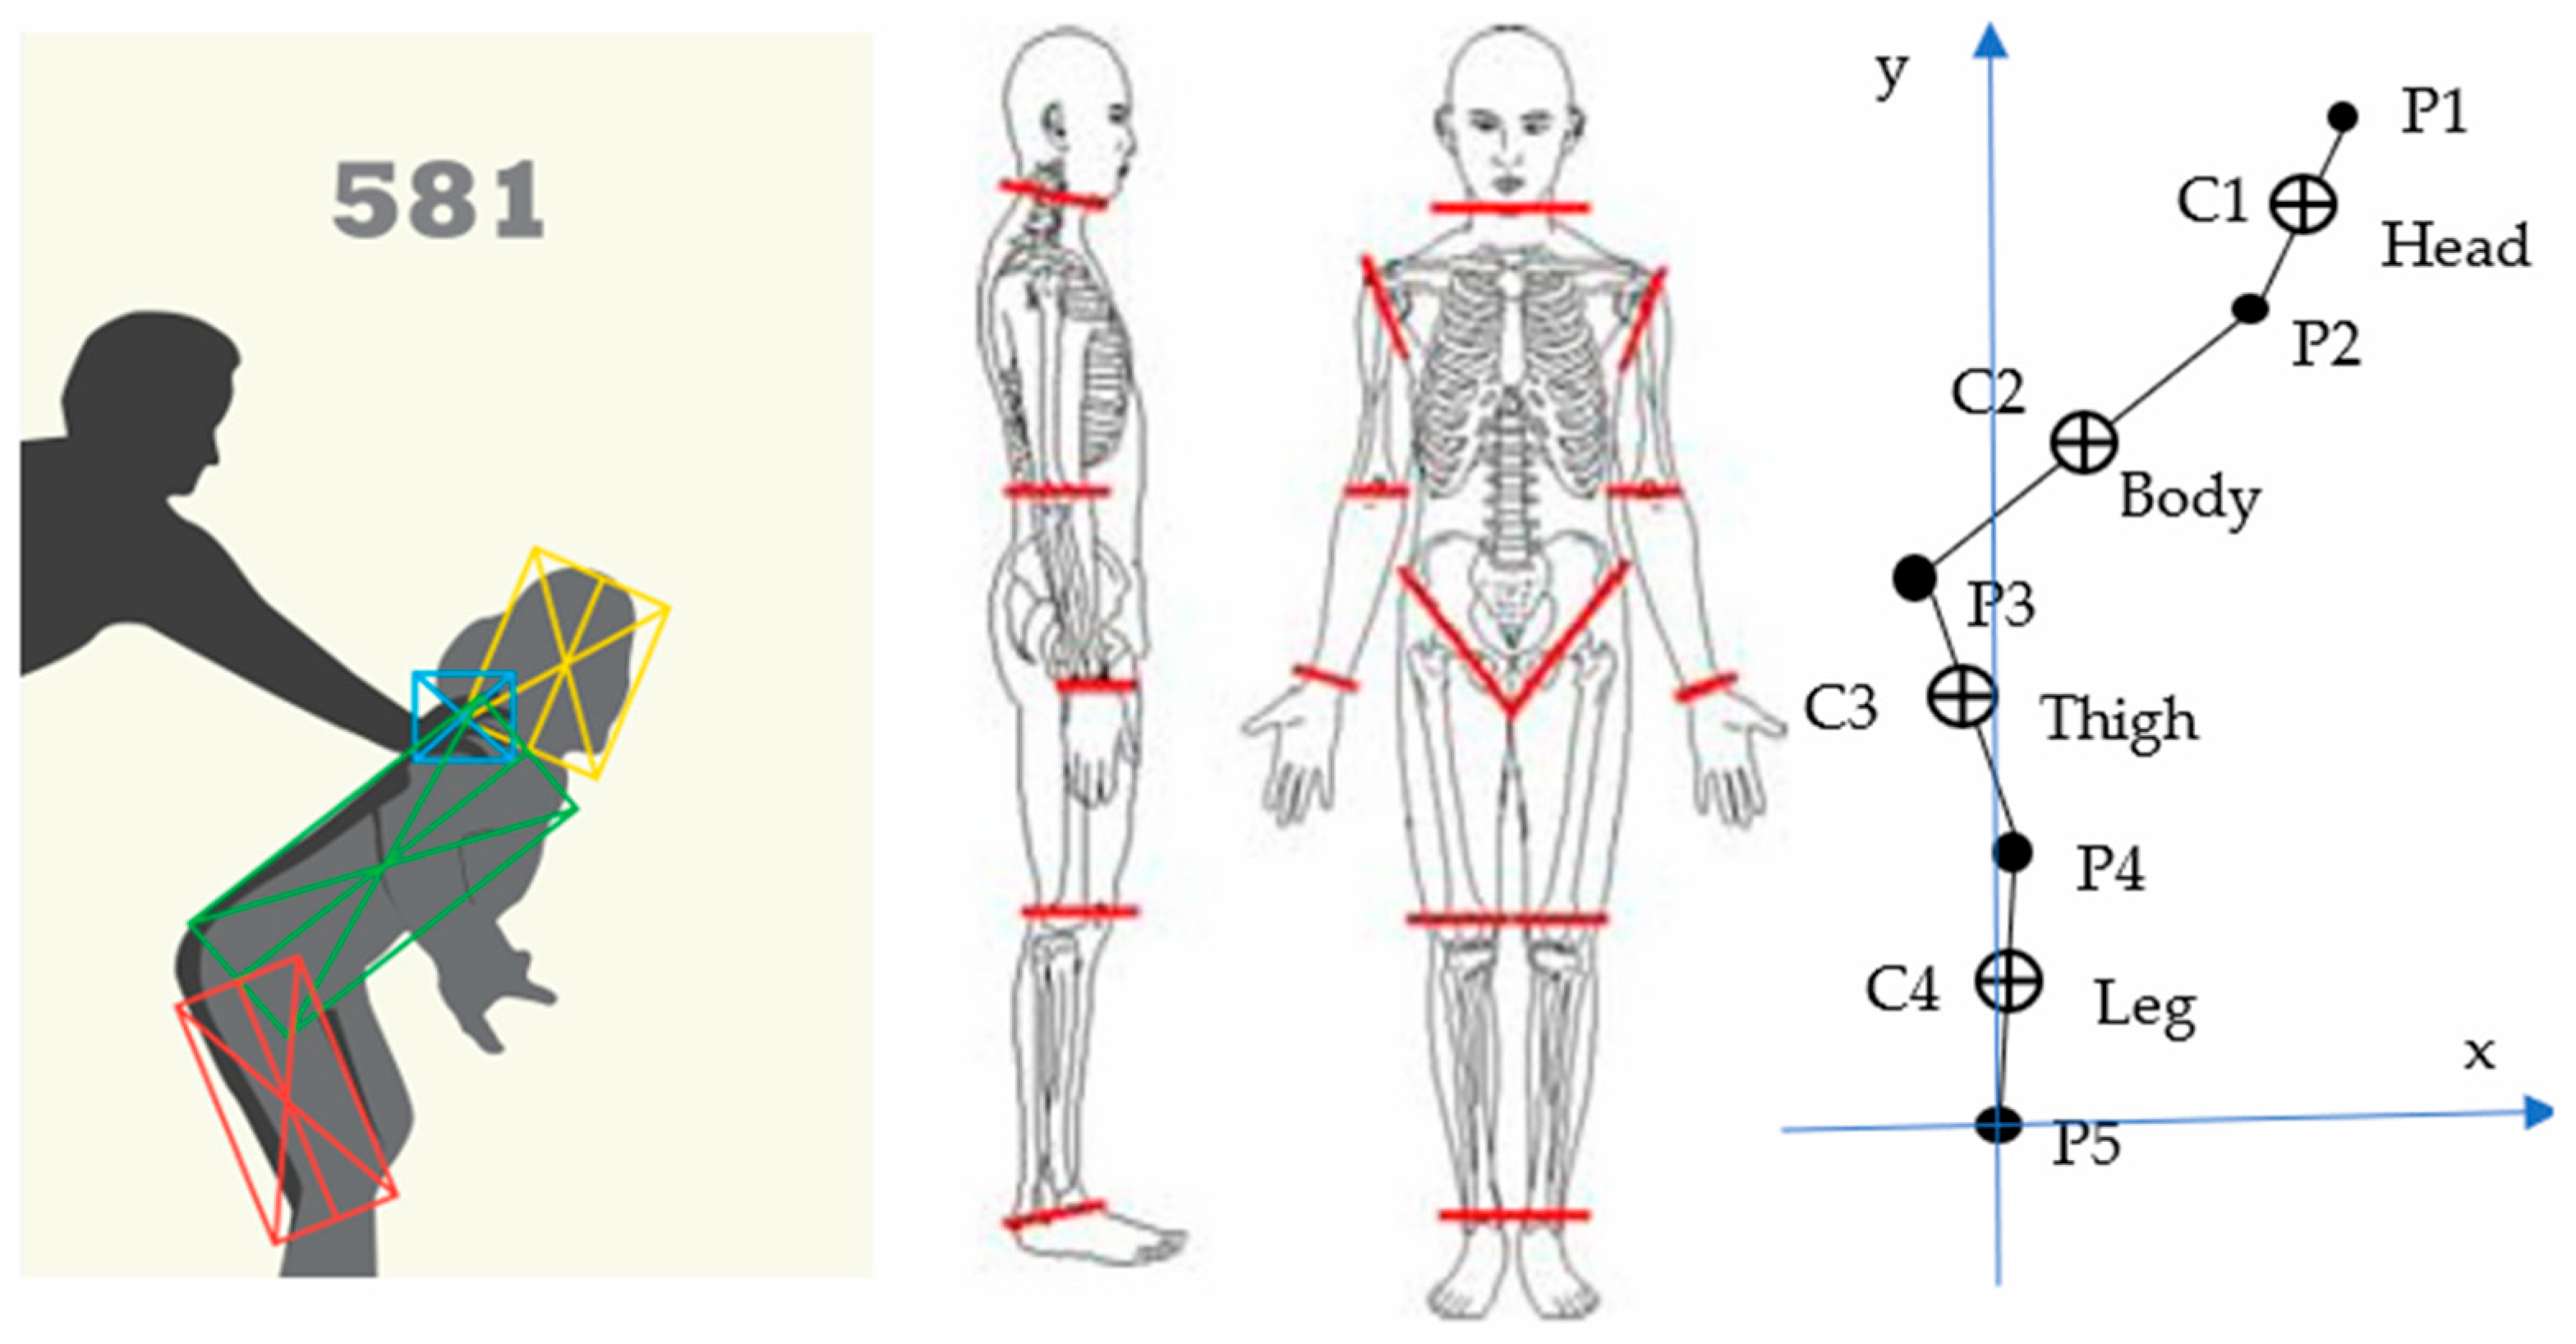
Figure 2 shows how the rectangles surrounding the limbs are placed. The points where the line passing through the intersection point of the diagonals and parallel to the long side intersect the short sides meet at the joint point. From P1 to P5, 5 joint points were determined. These points are on the head (P1), at the junction of the head and torso (P2), at the junction of the torso and thigh (P3), at the junction of the thigh and leg (P4) and at the junction of the leg and foot (P5), as shown in
Figure 2. The distance between the joints was considered to be the limb length. The relative lengths of the limbs with respect to the body were also checked for consistency with the data in
Table 1.
Although body proportions were adopted from the literature, it is known that these proportions vary among individuals. However, since the primary objective of this study is to develop a general methodology rather than a subject-specific analysis, these variations were deemed negligible and accepted as a limitation of the study.
2.3. Calculating the Whole Body’s Center of Mass
After determining the relative positions of the joints of the limbs with respect to the leg–foot (P5) joint, the coordinates of the centers of mass of each limb were calculated using the ratios given in
Table 2 [
15]. In
Figure 2, the centers of mass of the limbs are numbered from C1 to C4, and their positions are calculated by Equation (1) using the ratios of the positions of the joints and the distance of the center of mass to the joints.
The ratio of the distance of the center of mass of the limb from the first point to the whole length is a, and the ratio of the distance to the second point is b. a + b = 1. For the head, the first point P1 and the second point P2 are taken. The first point of each limb is taken as the last point of the previous one. After determining the center of mass of the limbs, the center of mass of the whole body was calculated using Equation (2).
When determining the mass of each limb, the data in
Table 2 were used for the relative masses of the limbs.
2.4. Finding the Linear and Angular Velocity of the Center of Mass
After determining the center of mass coordinates in each frame, the two frames were compared and the average velocity of the center of mass was calculated from the elapsed time between these two frames using Equation (3).
is the displacement of the center of mass in the two frames being compared. ∆t is the time elapsed between the two frames in seconds, and is calculated from the fps of the video. Fps stands for “frames per second” and describes the number of frames (pictures) recorded in a video in one second. If two consecutive frames are compared, ∆t = 1/fps. The calculated velocity of the center of mass will be in pixels per second. Hence, the velocity of the center of mass relative to the ground is converted to mm/s.
Equation (4) is used to determine the angular velocity of the center of mass relative to the point of pivoting, the angular change ∆θ of the line passing through the pivot point and the center of mass with respect to the pivot point. For the two compared frames, the horizontal angle of the line through the center of mass and the pivot point was calculated from Equation (5) and ∆θ was obtained from the difference in the two angles. From the time between the two frames ∆t was determined.
The x and y values are the coordinates of the whole-body center of mass. The unit of angular velocity can be written as rad/s or Deg/s.
2.5. Calculating the Applied Force
In the case study, after the angular velocity of the center of mass of the person being pushed was found, the magnitude of the pushing force that gave this angular velocity was calculated. The point of application of the force, the duration of its application and the angle at which it was applied were determined from the image. In light of this information, the law of conservation of energy was used to calculate the applied force. The sum of the work done by the applied force and the work done by the weight force during the action time of the force is equal to the sum of the translational and rotational kinetic energies gained by the object. The force value was calculated using the formulas in Equation (6).
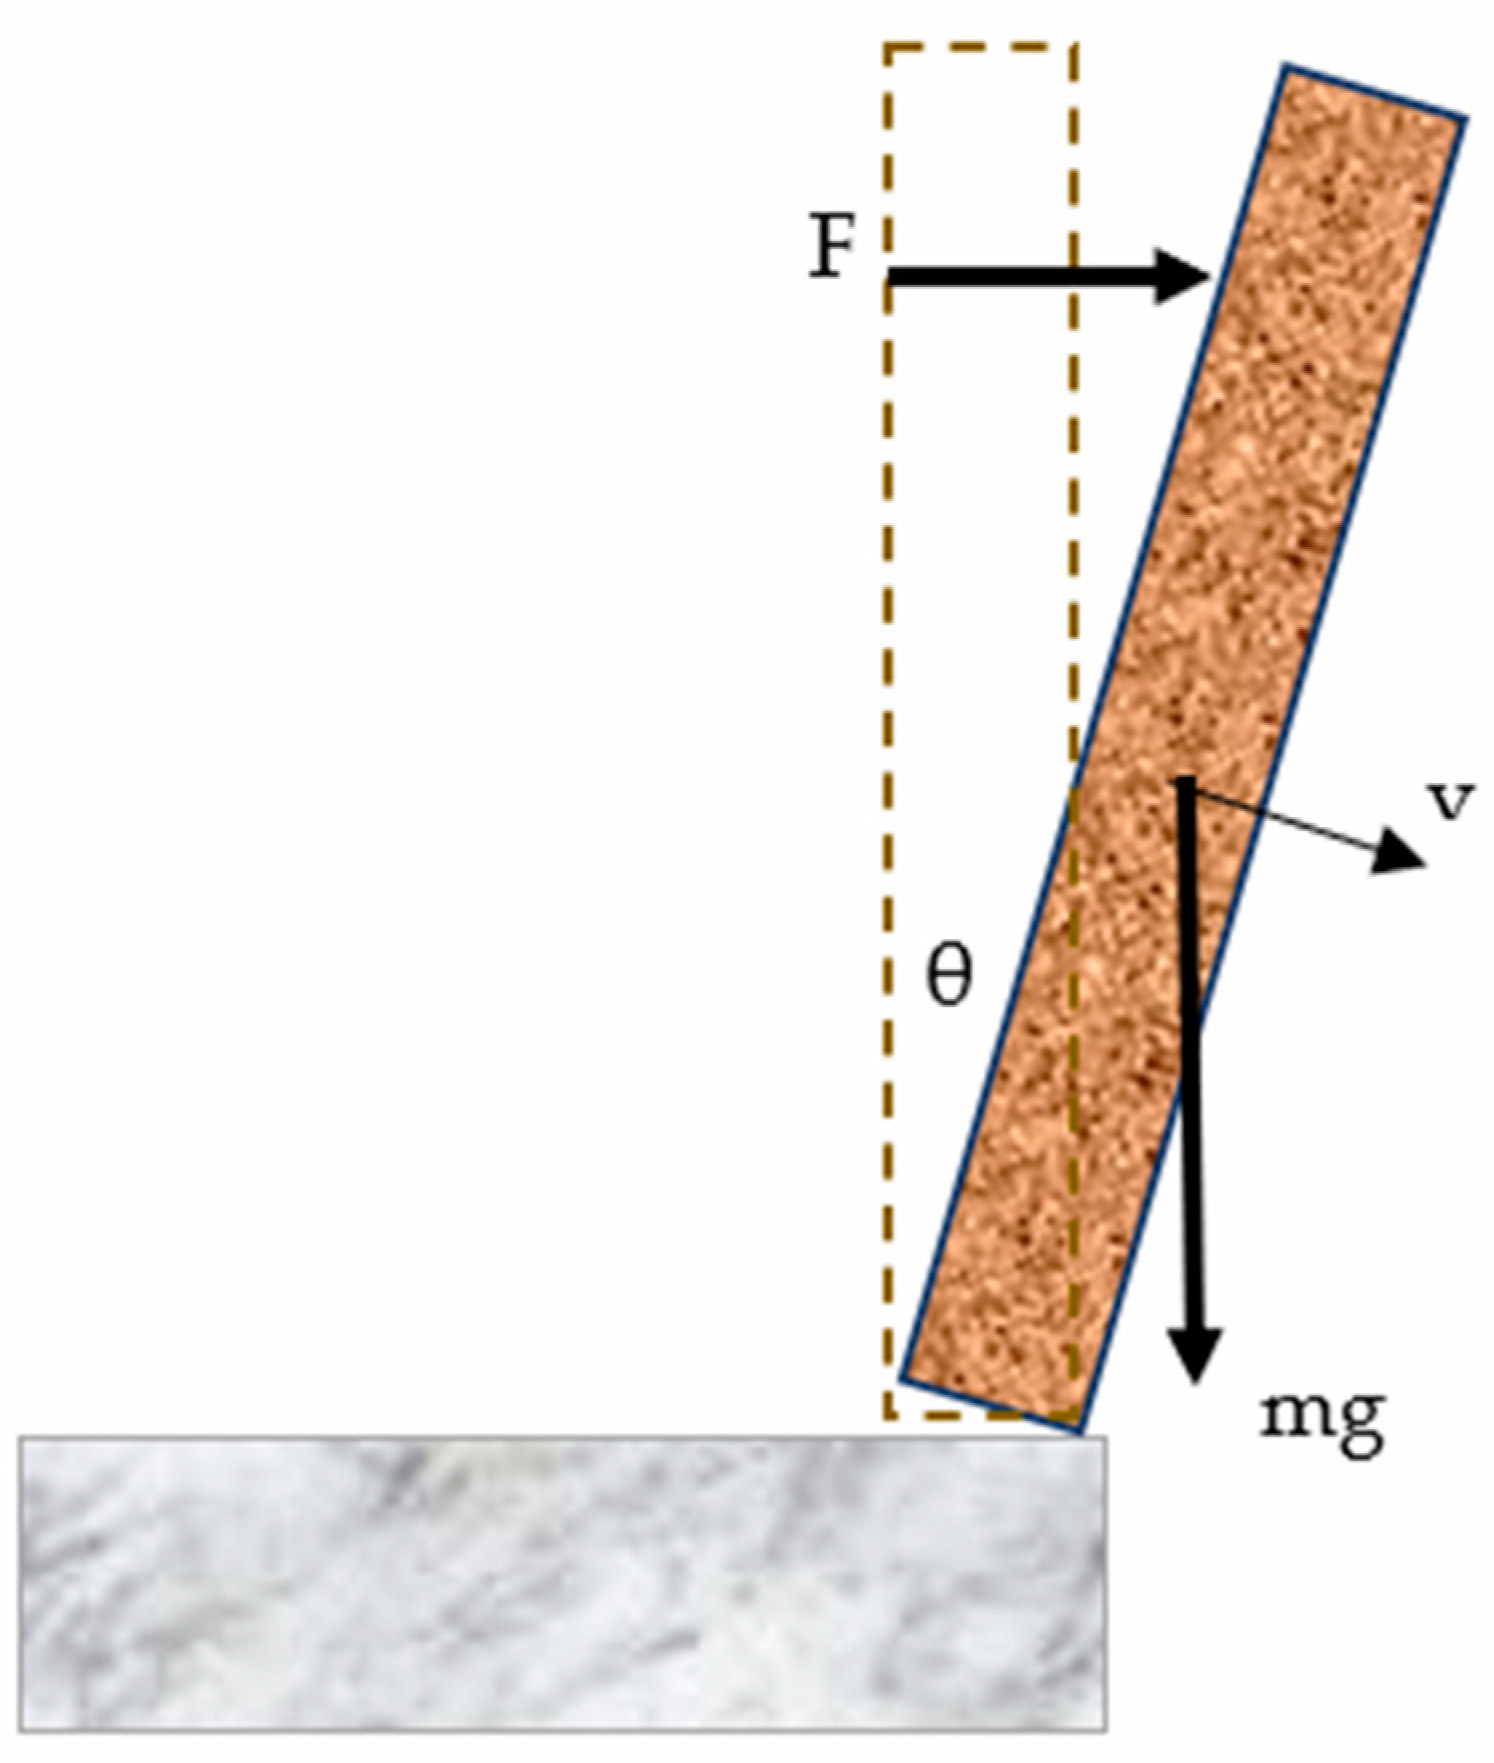
The parameters that can be deduced from the picture are: y, the distance from the point of application of the force to the axis of rotation; θ, the angle made with the vertical by the line passing through the center of mass and the axis of rotation at the end of the action time; v, the linear velocity of the center of mass at the end of the action time; w, the angular velocity of the center of mass at the end of the action time. Previously known parameters include m, mass; L, length; I, moment of inertia of the whole body with respect to the axis of rotation. The calculated parameter F is the thrust force. The symbolic model of the pushing phenomenon is shown in
Figure 3. When calculating the moment of inertia of the whole body, it is assumed to be cylindrical; furthermore, muscle tone as well as voluntary/involuntary muscle movements were neglected to simplify the calculations.
2.6. Pixel-to-Millimeter Conversion
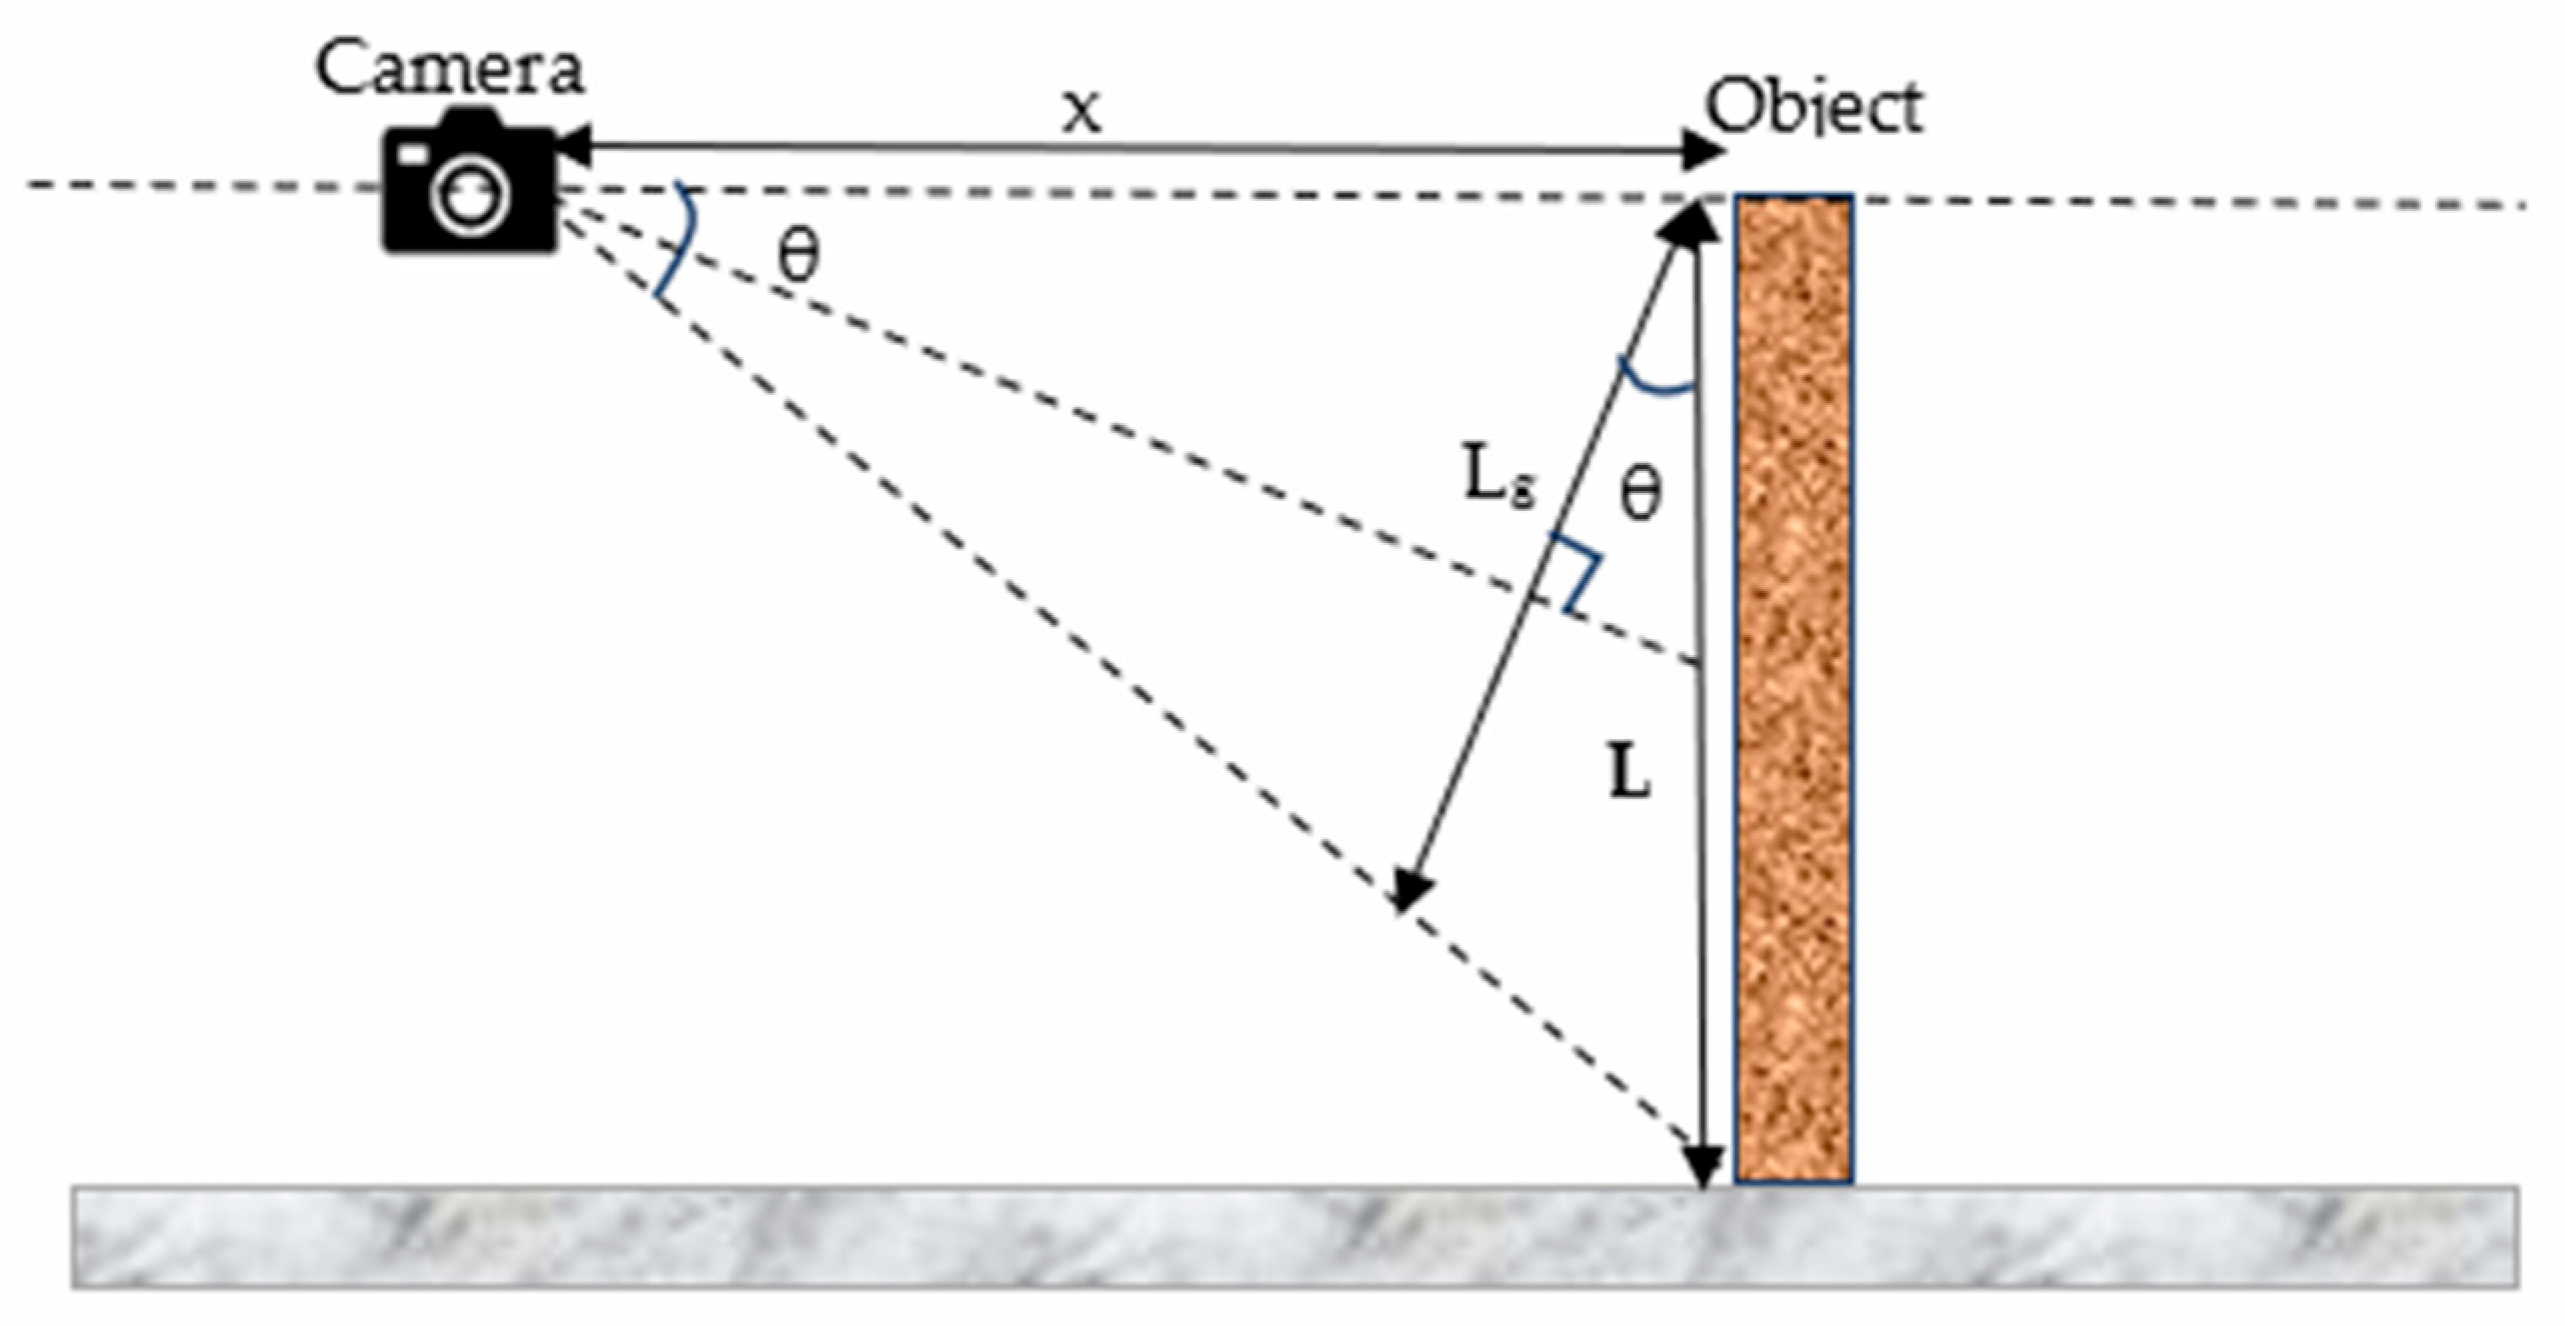
The distance between two points on the image can only be determined by the number of pixels. In order to find speed values in meters in the world reference system, it is necessary to calculate how many meters 1 pixel corresponds to. To do this, it is necessary to find a reference object in the image whose length in meters is known. After calculating the length of this object in pixels, the relationship between pixels and meters can be found. In the case study, the height of the person in the picture is known. The obscured parts were estimated using body proportion values from the literature; this is considered a limitation of the study. However, since the apparent length on the image, Lg, will change according to the position of the camera as shown in
Figure 4, it is necessary to make a correction with an appropriate transformation. Equation (7) is used for this correction. Additionally, movement in the third dimension was neglected, as displacement away from the camera was very small.
2.7. Technical Data of the Video Recording
The video footage used in the development of the method was obtained from publicly available information sources. The video footage is about a young girl who wanted to jump off a bridge into the river, but when she hesitated, her friend pushed her unannounced to encourage her. The incident was the subject of a court case, which was concluded. Due to the incident’s similarity to murder cases and the availability of video footage, it was considered worthy of further examination. In this context, the moment of the push captured in the video was analyzed from the perspective of physical science.
Python programming language, an MS Excel spreadsheet and image processing editor were also used in the study. The technical data of the video recording used in the study are given in
Table 3.
4. Conclusions
The incident was analyzed using a method developed from video footage of a young girl being pushed off a bridge into the river for recreational purposes. Since all stages of the incident are similar to the scenario of a possible murder incident, it was deemed worthy of investigation and analyzed. As a result of the analysis, the linear velocity, angular velocity and impulse force of the moving person were calculated. Using these initial parameters, evaluations were made about the whole event. The developed analysis method included image processing techniques as well as techniques to minimize error.
A separate method was developed to measure the position of the limbs in each picture frame, from which the linear velocities of the limbs and the linear velocity of the center of mass of the whole body were calculated. The angular velocity of the center of mass was calculated to determine the angular velocity of the whole body, taking into account that the victim’s body shape also changes during the push. After measuring the application point of the force in the frame obtained from the video, the force applied was calculated according to the principle of conservation of energy.
When the results are evaluated in terms of the impulse force and the reaction force against it, the magnitude of the calculated external impulse force is consistent with the involvement of a second individual in initiating the fall. The application of this external force, which was calculated to be approximately 315 N for 0.36 s, was enough to disrupt the victim’s balance and start the fall incident. Estimating the magnitude of the pushing force provides plausible indicators that could assist in narrowing down the physical requirements (such as approximate physical capacity) needed to exert such force. However, the calculated pushing force value of approximately 315 N should be interpreted explicitly as a model-dependent estimate rather than a directly measured force. Its accuracy is subject to limitations arising from the estimated body mass, anthropometric assumptions, camera geometry calibration, the neglect of the z-axis force component, and the lack of controlled experimental validation.
The magnitude of the impulse force calculated in the study, depending on the reaction force that the victim showed against the direction of fall, caused her feet to turn in a fixed forward rotational movement on the ground, leading to a fall parallel to the ground and determining the trajectory in the air. This trajectory formulation models how initial rotation can lead to a horizontal body posture prior to surface entry. In investigative reconstructions, observing a horizontal landing orientation suggests that initial angular momentum, such as that imparted by an external push, should be considered among candidate mechanisms.
The fact that the victim does not make a leap forward as a result of the push but starts to fall by making a rotational movement around her feet, and that the initial velocities for these two situations can be calculated separately, is strong evidence for the question of whether the cause of the incident amounts to suicide or murder.
When the results are evaluated in terms of “velocity” values depending on the external force, the existence of both linear and angular velocities together in this case points to an external force. As a result of the pushing force, a linear velocity of 0.4 m/s occurred horizontally. The reaction force of the victim to the pushing force caused the feet to turn in a constant rotational movement on the ground, and the angular velocity until the feet left the ground was calculated as 93.7 degrees/s clockwise. This speed caused the victim to rotate approximately 90° from a vertical position on her feet to a horizontal position on the ground in 1 s. While a person who voluntarily falls takes a controlled jump by stepping or jumping, the body’s reflexive reaction in the case of involuntary pushing explains a rotational action. While this biomechanical pattern is substantially less consistent with a voluntary jump, thereby helping to constrain suicidal scenarios, it serves as an additional investigative indicator when evaluating potential homicide cases.
In forensic fall analysis, evaluating competing hypotheses requires assessing both consistent and inconsistent physical indicators. Incorporating step-by-step physical calculations provides additional quantitative context, supporting a more structured scenario analysis.
Limitations of the Study
Several methodological limitations inherent to retrospective forensic reconstructions should be noted when interpreting the findings of this study. First, the biomechanical calculations rely on estimated body mass, generalized anthropometric proportions, and simplified moment-of-inertia models rather than subject-specific segment parameters. Second, body parts obscured in video footage required spatial extrapolation, and the dynamics of muscle tone, as well as voluntary or involuntary neuromuscular reflexes during the fall, could not be directly measured. Third, the reconstruction is constrained to a two-dimensional (2D) plane based on estimated camera geometry, thereby neglecting out-of-plane (z-axis) displacements and rotational components. Finally, the present model lacks quantitative uncertainty propagation analysis and controlled experimental validation under laboratory conditions, representing a single retrospective case estimate.