Article

Growth and Development of the Cranial Complex and Its Implications for Sex Estimation

1
Department of Anthropology, University of Nevada, Reno, NV 89557, USA
2
Department of Anatomy, Faculty of Health Sciences, University of Pretoria, Pretoria 0031, South Africa
3
Department of Anthropology, East Carolina University, Greenville, NC 27858, USA
4
Department of Anthropology, Texas State University, San Marcos, TX 78666, USA
*
Author to whom correspondence should be addressed.
Forensic Sci. 2025, 5(3), 43; https://doi.org/10.3390/forensicsci5030043
Submission received: 30 June 2025 / Revised: 13 August 2025 / Accepted: 29 August 2025 / Published: 10 September 2025
(This article belongs to the Special Issue Forensic Anthropology and Human Biological Variation)

Abstract

Background/Objectives: The incorporation of the human growth and development literature, an ontogenetic framework, a large virtual sample of individuals across the entire growth period, and a contemporary sample of adult individuals provides a unique opportunity to explore the cranial complex across the entire life cycle. This study (1) assesses cranial variation in postnatal ontogeny to determine the life history stage during which subadult crania can reach comparable levels of phenotypic expression to adult crania and (2) exposes when biological sex can be estimated using craniometric data from immature individuals with accuracy levels comparable to adults. Methods: Contemporary individuals between birth and 102 years of age from one virtual (Subadult Virtual Anthropology Database; SVAD) and one skeletal (Forensic Data Bank; FDB) collection were used in the analyses (n = 2152). Results: Discriminant analysis reveals a clear ontogenetic trajectory across the life history stages, with adolescents, SVAD adults, and FDB adults exhibiting similar cranial dimensions. The analysis also revealed a shift from the growth energetic period into the reproductive energetic period during adolescence. This transition is reflected in the divergence of male and female craniometrics in adolescence, which is also when sex estimation accuracy is comparable to SVAD and FDB adults. Conclusions: The current study argues that skeletal and/or dental maturity is not necessary to estimate sex using the cranium and urges the field to reconsider methodological divisions between subadults and adults.

1. Introduction

Methods for estimating the biological profile (age, sex, population affinity, and stature) are often targeted either towards adult—skeletally mature—or subadult—skeletally immature—individuals, with little to no overlap in application. Methodological bias associated with the application of exclusively adult or subadult methods results from sample and research bias, where skeletal collections often lack coverage of the entire range of postnatal growth and development. Moreover, the samples used to answer a given research question differ depending on the research context. For example, studies interested in the intricacies of fetal life and infancy, e.g., [1,2,3] or prepubertal individuals, e.g., [4,5] will typically restrict samples to those periods of growth and development to avoid masking nuanced growth trends with the inclusion of older individuals. Similarly, forensic anthropology method development may restrict ages to answer questions particular to the medicolegal context in which we work, such as the age of legal majority or minority, e.g., [6]. As a result, the age ranges of the subadult and adult samples used to develop methods often capture limited snippets of ontogeny, even though it is a continuous process.
Such obfuscation of the continuous processes of growth and development is especially problematic in the human cranium, considering its importance to forensic anthropological methods. The combination of arbitrarily delineating phenotypic boundaries between adults and subadults and the overall lack of subadult individuals in skeletal collections in general obscure our understanding of cranial variation and the expression of skeletal sexual dimorphism and population variation across ontogeny. Innumerable studies describe human cranial growth patterns, but in comparison, there are far fewer studies that use an ontogenetic perspective covering the entire growth and development period [7,8,9,10,11,12,13,14,15,16,17,18,19,20,21,22]. Of these studies, a number have demonstrated that sexual dimorphism is present for cranial and/or facial structures in individuals that forensic anthropologists would define as subadults [19,20,21,23]. However, there are several limitations when it comes to their applicability to forensic anthropology practitioners. Only a few studies use standard craniometric variables; most studies use geometric morphometrics, have small sample sizes, do not include mature (or adult) comparative samples, and some categorize their sample into biologically meaningless chronological divisions. In contrast, the current research uses a large sample that covers the entire lifespan, subdivided into biologically meaningful developmental categories rather than chronologically defined categories, and relies on data that is commonly used and applied in biological and forensic anthropology to explore multivariate patterns of cranial variation and detect at what life history stage(s) the stabilization of adult cranial phenotypic variation occurs.

1.1. What Does ‘Mature’ Mean in Forensic and Biological Anthropology?

When selecting appropriate methods for estimating parameters of the biological profile for an unidentified individual, one must first determine if the individual is subadult or adult [24,25]. These categories are often defined inconsistently and are methodologically limited. Indeed, the definition of ‘adult’ or ‘adulthood’ varies and is rarely explicitly defined by biological anthropological researchers developing or validating methods. For example, in growth and development literature, ‘adulthood’ is defined as ‘a functionally mature individual’ [26] (p. 516) while at least one forensic anthropology introductory text explains that an adult is an individual in the mature or degenerative stages of the lifespan [27]. The common feature of both definitions of adulthood is the term ‘mature’. Maturity is a state that is achieved at the culmination of maturation [28], which is considered the ‘progression of changes, either quantitative or qualitative, that lead from an undifferentiated or immature state to a highly organized, specialized, and mature state’ [26] (p. 516). While all biological systems mature within an organism, the most commonly used indicators of biological maturation in human biology are skeletal, sexual, and somatic. Dental maturation may be occasionally used, but it is considered independent of the other processes [28]. Forensic and biological anthropologists tend to focus on indicators associated with skeletal and dental systems, as these are what we generally have access to in both research and practice, in contrast to indicators associated with somatic and sexual systems. All maturational processes are comprised of events that occur once and provide a clear indicator that an individual has reached a particular developmental milestone (i.e., menarche, complete long bone epiphyseal fusion, etc.).
There are inherent complexities to the concept of maturation that should be understood by the forensic practitioner prior to determining a maturity state, and subsequently, what biological profile methods should or should not be applied. Forensic anthropologists tend to think of maturation under the framework of chronological age because that is how missing persons are reported and how legal processes are defined. However, maturation is independent of chronological age and, if anything, only moderately correlated with it [29,30]. Importantly, there is no consistent or single chronological age that can be associated with full maturity [26,28,31], because all biological systems have different maturation rates and achieve maturity at different times. Substantial variation exists in the timing at which maturity processes are reached, which translates to wide chronological age ranges for a given maturational event (approximately +/−2 years) [31]. Even maturity events within the same maturational process can be weakly correlated because of the different neuroendocrine pathways involved [32]. There is not only variation between individuals, but also within one person. For example, dental and skeletal maturational processes lead to different estimates of maturity at different ages. Dental maturity can be reached in mid-adolescence (~16 years) [33] while skeletal maturity might not be reached until the mid-twenties with the completion of clavicular fusion [34]. Such an individual may be considered mature for one maturity process but immature by another, leading to difficult implementation of biological profile methods.

1.2. Why Does the Division Between Subadult and Adult Persist in Anthropological Methods?

In most forensic and biological anthropology research, we are dependent upon and restricted by skeletal collections. Generally, large samples of individuals that comprise all portions of the human lifespan do not exist in classic skeletal collections. In publications involving adult methods, the lower age boundary of a sample is often a product of convenience, without consideration for a specified maturational event. There are also many publications that do not provide explicit age ranges associated with the method in favor of a broad stroke recitation like “method designed on adults”. Eighteen years of age is a common lower boundary for adulthood, but it is not clear if this is linked to decisions by the author(s) or a consequence of the reference collection. As a result, the age boundary for delineating between “subadult methods” and “adult methods” is often arbitrary and primarily linked to the sample, not to an individual’s actual biological state of maturity versus immaturity. Convenience sampling may be driving what the field considers ‘adult’, with little to no consideration for the actual biological indicators. Therefore, the dichotomy between subadult and adult methodologies is, in part, a downstream consequence of the age distributions available in donated and cadaveric collections.
Moreover, cultural practices and biases in body donation have contributed to the development of dichotomous subadult versus adult methodological approaches. A similar argument can be made regarding the diversity and applicability of methods derived from skeletal collections to broader populations or forensic casework. For instance, white males over the age of 65 years are among the demographic that are most likely to donate their body to science [35,36]. As such, most other demographics (i.e., of other age, sex, and population affinity groups) are underrepresented in skeletal collections. Subsequently, methods developed using the typical demographic profile of donors in skeletal collection do not accurately reflect the demography of the forensic caseload [37,38,39]. While population diversity is often the focus of discussions on increasing sample diversity, the same is true for the representation of subadult samples. Subadults are a notoriously underrepresented group in skeletal collections [40,41] and, as a result, knowledge is limited regarding which appropriate maturational processes should be used as a boundary between subadult and adult categories. This gap in knowledge hinders the applicability of most biological profile methods to subadults, except for age estimation techniques.

1.3. An Ontogenetic Framework

An ontogenetic framework uses life history theory to understand patterns in, and the drivers of, human variation. Life history theory focuses on how resources are differentially allocated through an organism’s life cycle to grow, reproduce, and survive [42,43,44,45,46]. Life cycles can be viewed in both broad energetic periods (i.e., growth, reproduction, maintenance) [47] and more nuanced stages within those broad energetic periods (i.e., post-menopausal). One of the most unique periods in the human life cycle is growth, which specifically refers to how fast an organism grows, the age at which we mature, and the energetic trade-offs that make growth feasible. Life history stages within the growth period are infancy, childhood, juvenile, and adolescence.
While there are gradual changes as we move from a small, immature state to a fully grown, mature state, there are also skeletal, dental, cognitive, and behavioral developmental milestones achieved during this process. The life history (LH) stages of infancy, childhood, juvenile, and adolescence are based on a unique suite of biological and behavioral traits. Infancy (including the neonatal period), categorized as birth to the end of lactation, is also when deciduous tooth eruption is complete and postnatal growth is the fastest. There is less variation in the timing of the developmental milestones achieved in infancy across individuals and populations than the ones in subsequent LH stages [48]. Childhood is noted to have a moderate growth rate ending at the eruption of the first permanent mandibular molar and incisors and completion of brain growth [48]. The juvenile stage is defined by a slower rate of growth than all other LH stages. Puberty, noted as a neuroendocrine transformation (re-initiation of the hypothalamic–pituitary–gonadal axis), marks the transition into adolescence. While puberty is the transition between two LH stages, it is also a transition between the two broad energetic periods of growth and reproduction [32,49]. In the adolescent LH stage, growth is completed, and the energy allocations change to reproductive and biological maintenance capacities. Skeletal, sexual, and somatic maturity are achieved in adolescence because of the underlying hormonal mechanisms [49,50]. There are also sex-specific trajectories through adolescence as part of the LH theory. For example, there is a difference of about 2 years between the female and male average age at peak height velocity, and about a 3-year difference between the female and male average age of achievement of adult height [51,52].
Considering the expected developmental trajectories put forth by life history theory, we hypothesize that one can use the cranial complex to estimate components of the biological profile at younger ages than previously assumed and independent of socially and/or biologically defined maturity. The aims of this study are two-fold: (1) assessing multivariate patterns of cranial size and shape variation across postnatal ontogeny to determine the LH stage at which subadult crania reach comparable levels of phenotypic expression and variation to adult crania, and (2) testing whether biological sex can be estimated in immature individuals with accuracy levels comparable to adult models using craniometric data. We use a large sample from the United States, combining virtual crania from the Subadult Virtual Anthropology Database (SVAD) with a large sample of adults from the Forensic Data Bank (FDB), to explore multivariate growth and development of the cranial complex. By complementing the subadult sample with an adult sample, we can implement a true ontogenetic framework and directly investigate when growth in size and shape has stabilized, matching the variation exhibited in mature adults and embrace the ontogeny of the cranium.

2. Materials and Methods

The sample used in this study consists of 2152 individuals in total (n = 799 reported biological females and n = 1353 reported biological males) aged between birth and 102 years. Data for this research were sourced from two cross-sectional samples: the Subadult Virtual Anthropology Database (SVAD) and the Forensic Data Bank (FDB). The SVAD is an online repository of freely available contemporary reference skeletal and dental data obtained from around 5000 subadult individuals from eight different countries worldwide [41]. Individuals from the United States sample of SVAD with complete craniometric data available were used for the current study. They consist of 550 individuals (230 reported biological females and 320 reported biological males) between the ages of birth and 21 years. The age and sex distributions follow a typical forensic mortality profile [53]. The individuals in the current study all underwent a postmortem CT scan between 2011 and 2019 at the Office of the Medical Investigator in Albuquerque, New Mexico. The CT scans are curated in the New Mexico Decedent Image Database repository (NMDID) [54]. Virtual reconstructions of the crania followed a standardized protocol [55] developed for visualizing three-dimensional immature and mature skeletal structures with the AmiraTM Medical Imaging Visualization software (v.6.5.0, Thermo Fisher Scientific, Waltham, MA, USA). Threshold ranges used to obtain the three-dimensional cranial reconstructions were usually between 200 and 500 Hounsfield Units/HU depending on the age of the individual [56].
The FDB sample comprises 1602 individuals between the ages of 18 and 102 years (provided by Richard Jantz). All FDB individuals have known sex and age and complete craniometric data. The FDB sample was incorporated to supplement the adult individuals because the SVAD sample extends to 21 years. As the primary goal of this research is to explore the multivariate changes in the cranial complex across age, we wanted to increase the size of the adult sample and expand its variation to ensure findings in the SVAD sample could be extrapolated beyond the boundaries of that specific sample.

2.1. Defining Life History Stages for the Sample

In line with an ontogenetic approach, we used developmental data (skeletal and dental developmental indicators) available per individual in the SVAD to categorize the sample into LH stages (Figure 1, Table 1). Each LH stage is based on biological and behavioral traits, and clear links have been defined among these variables, maturity indicators, approximate chronological ages, and biological sex [48]. The LH stages used in this research are infancy, childhood, juvenile, adolescence, and adulthood [48]. Chronological age ranges are associated with each LH stage to help aid the description and to provide extra context to the stages. While the chronological ages are provided (Table 1), only the LH stages derived from developmental data are used in the analytical methods that follow. Developmental data from the left side were used to derive the LH stages; the right side was used if the left side was unavailable to maximize sample size.
Infancy is chronologically defined as birth to 3 years, characterized by rapid growth in size, and terminates with the eruption of the second deciduous molar (dm2) [48,57]. Unfortunately, SVAD does not currently have deciduous eruption data. However, AlQahtani et al. [58] have both deciduous and permanent developmental and eruption data. Therefore, the eruption and development of the dm2 were used to determine the median development stage of the first permanent mandibular molar (M1), which is available in SVAD. When dm2 is at stage R ¾ and fully erupted (median stage per age), the median developmental stage of M1 is crown complete (Crc). Therefore, the infancy stage for SVAD data was determined by a M1 developmental stage of less than or equal to crown complete.
The childhood stage is chronologically delineated from 3 years to 6.99 years and is characterized by reduced growth rates compared to infancy, a nearly complete brain volume, and eruption of M1. M1 eruption occurs, on average, around the ages of 5.50 and 6.50 years in modern populations [58], which is linked to a median developmental stage of R ½. Therefore, the childhood stage was categorized by a permanent M1 being greater than or equal to Ri (root initiation) and less than or equal to R ½ (root length equals crown length).
Individuals in the juvenile period, chronologically categorized between 7.00–10.99 years (females) and 7.00–12.99 years (males), exhibit the slowest rate of growth. There are a few skeletal and dental developmental milestones directly linked to this stage, yet it is still possible to use developmental data associated with the bordering LH stages to help cap the lower and upper biological boundaries. Therefore, we selected individuals that had M1 developmental stages greater than or equal to Root ¾, which coincides with a second permanent mandibular molar (M2) with a developmental state less than or equal to R ½, which is also the median stage at alveolar eruption. Additionally, the appearance of the iliac crest epiphysis is used to define the adolescence LH stage, so we also chose a second inclusion criterion of an ‘absent’ iliac crest epiphysis for the juvenile stage.
The transition from juvenile to adolescence is marked by puberty, which is the re-initiation of the hypothalamic–pituitary–gonad axis (HPG axis) and increased growth rates. The major downstream consequence of the HPG axis is the production of steroid hormones (besides gametes), which begin circulating and are responsible for secondary sexual characteristics. Because each maturational process (skeletal, sexual, dental, and somatic) has its own tempo, and males and females have different trajectories through the maturational processes, alignment between maturation processes was difficult to capture across multiple types of skeletal and dental data. Additionally, the beginning of puberty is more difficult to correlate with skeletal maturity indicators [50,59]; menarche has a stronger association with skeletal maturity. In a study by Buehl & Pyle [60], approximately 2/3rds of females exhibited an ossification center for the iliac crest within six months following menarche. Therefore, we prioritized menarche as the marker for adolescence, which required the iliac crest ossification center to be categorized as “Present” or “Fusing.” Importantly, unlike most skeletal maturity indicators that are active at this developmental period, Buehl & Pyle claimed that the ossification of the iliac crest is a male maturity indicator that is comparable to menarche in females [60]. Because the iliac crest is linked to menarche, and menarche happens later in puberty for females [50,61], females in the current study are likely being classified in the juvenile stage for longer than they would be based solely on chronological age or a more accurate sexual maturity indicator. This disparity is likely to exist until our field has better data on the co-occurrence of sexual maturation traits and skeletal traits commonly used in biological and forensic anthropology. Until then, we believe the iliac crest may be the best skeletal maturity indicator to use for the transition into the adolescence LH stage.
Because we are limited to epiphyseal fusion data (in contrast to somatic or sexual indicators), we chose to use skeletal maturity as the process to determine maturity. A completely fused iliac crest or, if data were not available, a completely fused proximal humerus, was used as a skeletal indicator of having reached full maturity. The iliac crest is the last epiphysis to transition to fusion, and the proximal humerus transitions to fusion just before the iliac crest [62]. Publications exploring fusion of the iliac crest consistently demonstrate that age of fusion is a comparable and reliable skeletal indicator for the transition to adulthood [49,63,64,65,66]. Fusion of the medial clavicle occurs substantially later and is not regularly used to assess the transition from adolescence to adulthood, even though it reflects the true completion of skeletal maturity.
The entire FDB sample is classified into the adult life history stage despite lacking confirmatory developmental data. In the SVAD sample, 81% of individuals in the adult LH stage are between the ages of 18 and 20 years, and all individuals in the FDB sample are greater than or equal to 18 years of age. The large proportion of SVAD individuals meeting the adult criteria that are greater than or equal to 18 years of age corroborates the choice to categorize the FDB sample as adults despite the lack of maturity data. We recognize this is less than ideal and a limitation of the FDB sample we are using. Additionally, the FDB sample was much larger (n = 1602) than the adult SVAD sample, which could lead to biased classification results [67]. Therefore, the FDB sample was downsampled to match the SVAD adult sample size (n = 153), reducing sample- or sex-specific bias in the analyses (Figure 1). Mean and standard deviations of each cranial measurement were compared between the downsampled subset and the original FDB sample, and all metrics were within 1 mm of each other. This overlap ensures the variance of the original FDB sample was not lost in the random downsampling, and the subset is an accurate reflection of the FDB population.
The distribution of individuals by chronologically derived (based on age) LH stages and developmentally derived (based on skeletal and dental data) LH stages is visualized in Figure 1 and Figure 2. The distribution of chronological ages per developmentally determined LH stage is also available in Table 1. In Figure 2, the most obvious difference between the developmentally derived and chronologically derived LH stages is the number of females categorized in the adolescence LH stage. The transition into the adolescence LH stage is when we would expect to see the greatest variation in individual and sex-specific trajectories. This is also evident in the discrepancies in the chronologically and developmentally derived age ranges per LH stages for juvenile, adolescence, and adulthood (Table 1).

2.2. Interlandmark Distances (ILDs)

For both samples, 25 ILDs were calculated from 36 landmarks (Table 2). The Euclidean distance (ILD = √(x1 − x2)2 + (y1 − y2)2 + (z1 − z2)2) was calculated between these landmarks using the 3D coordinates (x1, y1, z1 for landmark 1 and x2, y2, z2 for landmark 2). The SVAD data were collected following a standardized protocol developed for landmark data collection on 3D virtual cranial reconstructions [68]. The FDB data were collected directly from skeletal remains from practitioners around the country using the data collection protocols [69,70]. Previous research has demonstrated that cranial data collected from virtual skeletal reconstructions—and the SVAD sample in particular—are reliable, reproducible, and accurate models of their dry bone counterparts [71], and that data collected from different modalities can be combined for analysis [56,72,73].

2.3. Statistical Methodology

The craniometric data from the SVAD and FDB samples were subjected to linear discriminant analysis (LDA). LDA uses a linear combination of measurements to maximize the distance between the category means and simultaneously minimize the scatter within each category to ultimately assign group membership. It is considered an ideal technique to identify multivariate patterns among groups, which is the goal of the current analysis. The ‘groups’ the current research is exploring are LH stages (five groups) and biological sex (two groups). For this research, multiple LDA models were developed to answer the two aims, which are (1) to assess multivariate patterns of cranial size and shape variation across postnatal ontogeny to determine the LH stage at which subadult crania reach comparable levels of phenotypic expression and variation to adult crania, and (2) to test whether biological sex can be estimated in immature individuals with accuracy levels comparable to adult models using craniometric data.
To answer the first aim, we built two LDA models to explore multivariate patterns of craniometric variation across ontogeny. The first model used only SVAD data, while the second model included both SVAD and FDB data. For these two LDA models, the sexes were pooled, prior probabilities were held equal, and group differences were assessed according to developmental LH stage (infancy, childhood, juvenile, adolescence, adulthood). The sexes were pooled for two reasons. First, the developmentally derived LH stages inherently account for sex-specific growth and development trends. Second, we are not interested in differences between the sexes in this aim, only how the cranial complex changes across LH stages. The multivariate cranial relationships are visualized according to LH stage, and confusion matrices and Mahalanobis distance matrices demonstrate similarities and differences between cranial variation patterns across ontogeny. Note, we do not provide accuracy for these two LDA models as the goal of this aim is exploratory and not predictive.
For the second aim, we are interested in exposing the LH stage(s) for which biological sex can be confidently estimated at comparable levels of accuracy to adult samples. To answer this aim, we explored the estimation of sex within each LH stage. A total of six different groups based on the developmentally derived LH stages were created, which included infancy, childhood, juvenile, adolescence, SVAD adulthood, and FDB adulthood. Within each LH stage group, a LDA model was developed to estimate sex so that a comparison of classification accuracies could be made across the LH stages. For each of these LDA models, we utilized forward stepwise selection to choose a subset of variables that were most useful for group separation. This choice also ensured the models were not overfit, as some of the sample sizes were smaller than the number of predictor variables when separated by LH stage and sex (Figure 1). Additionally, to reduce bias in the estimates, we incorporated leave-one-out cross-validation (LOOCV) and maintained equal priors.
Classification accuracies are presented by model according to LH stage and biological sex, and for the entire sample to further evaluate misclassification patterns. Mahalanobis distances were used to explore centroid locations among the LH groups for further understanding of the change across ontogeny. We focus on evaluating and comparing performance among LH stages and between the sexes, especially when exploring the potential for sex estimation. This contrasts with many studies that heavily focus on the predictive ability of craniometrics. For example, a classification accuracy of 78% may not be considered ideal for biological sex estimation. But for this study, if—for example—the juvenile, adolescence, and adulthood LH stages all achieve between 74% and 78% accuracy rates, we would consider that to be comparable levels of performance across these three LH stages and interpret these results accordingly. All analyses were completed in R (version 4.5.0) using the caret and klaR packages [74,75,76]. All associated code can be found on GitHub (https://github.com/ChristopherAWolfe/Stulletal2025_ForensicScience, accessed on 13 August 2025) and Zenodo (accessed on 13 August 2025) [77].

3. Results

3.1. Cranial Variation Across LH Stages

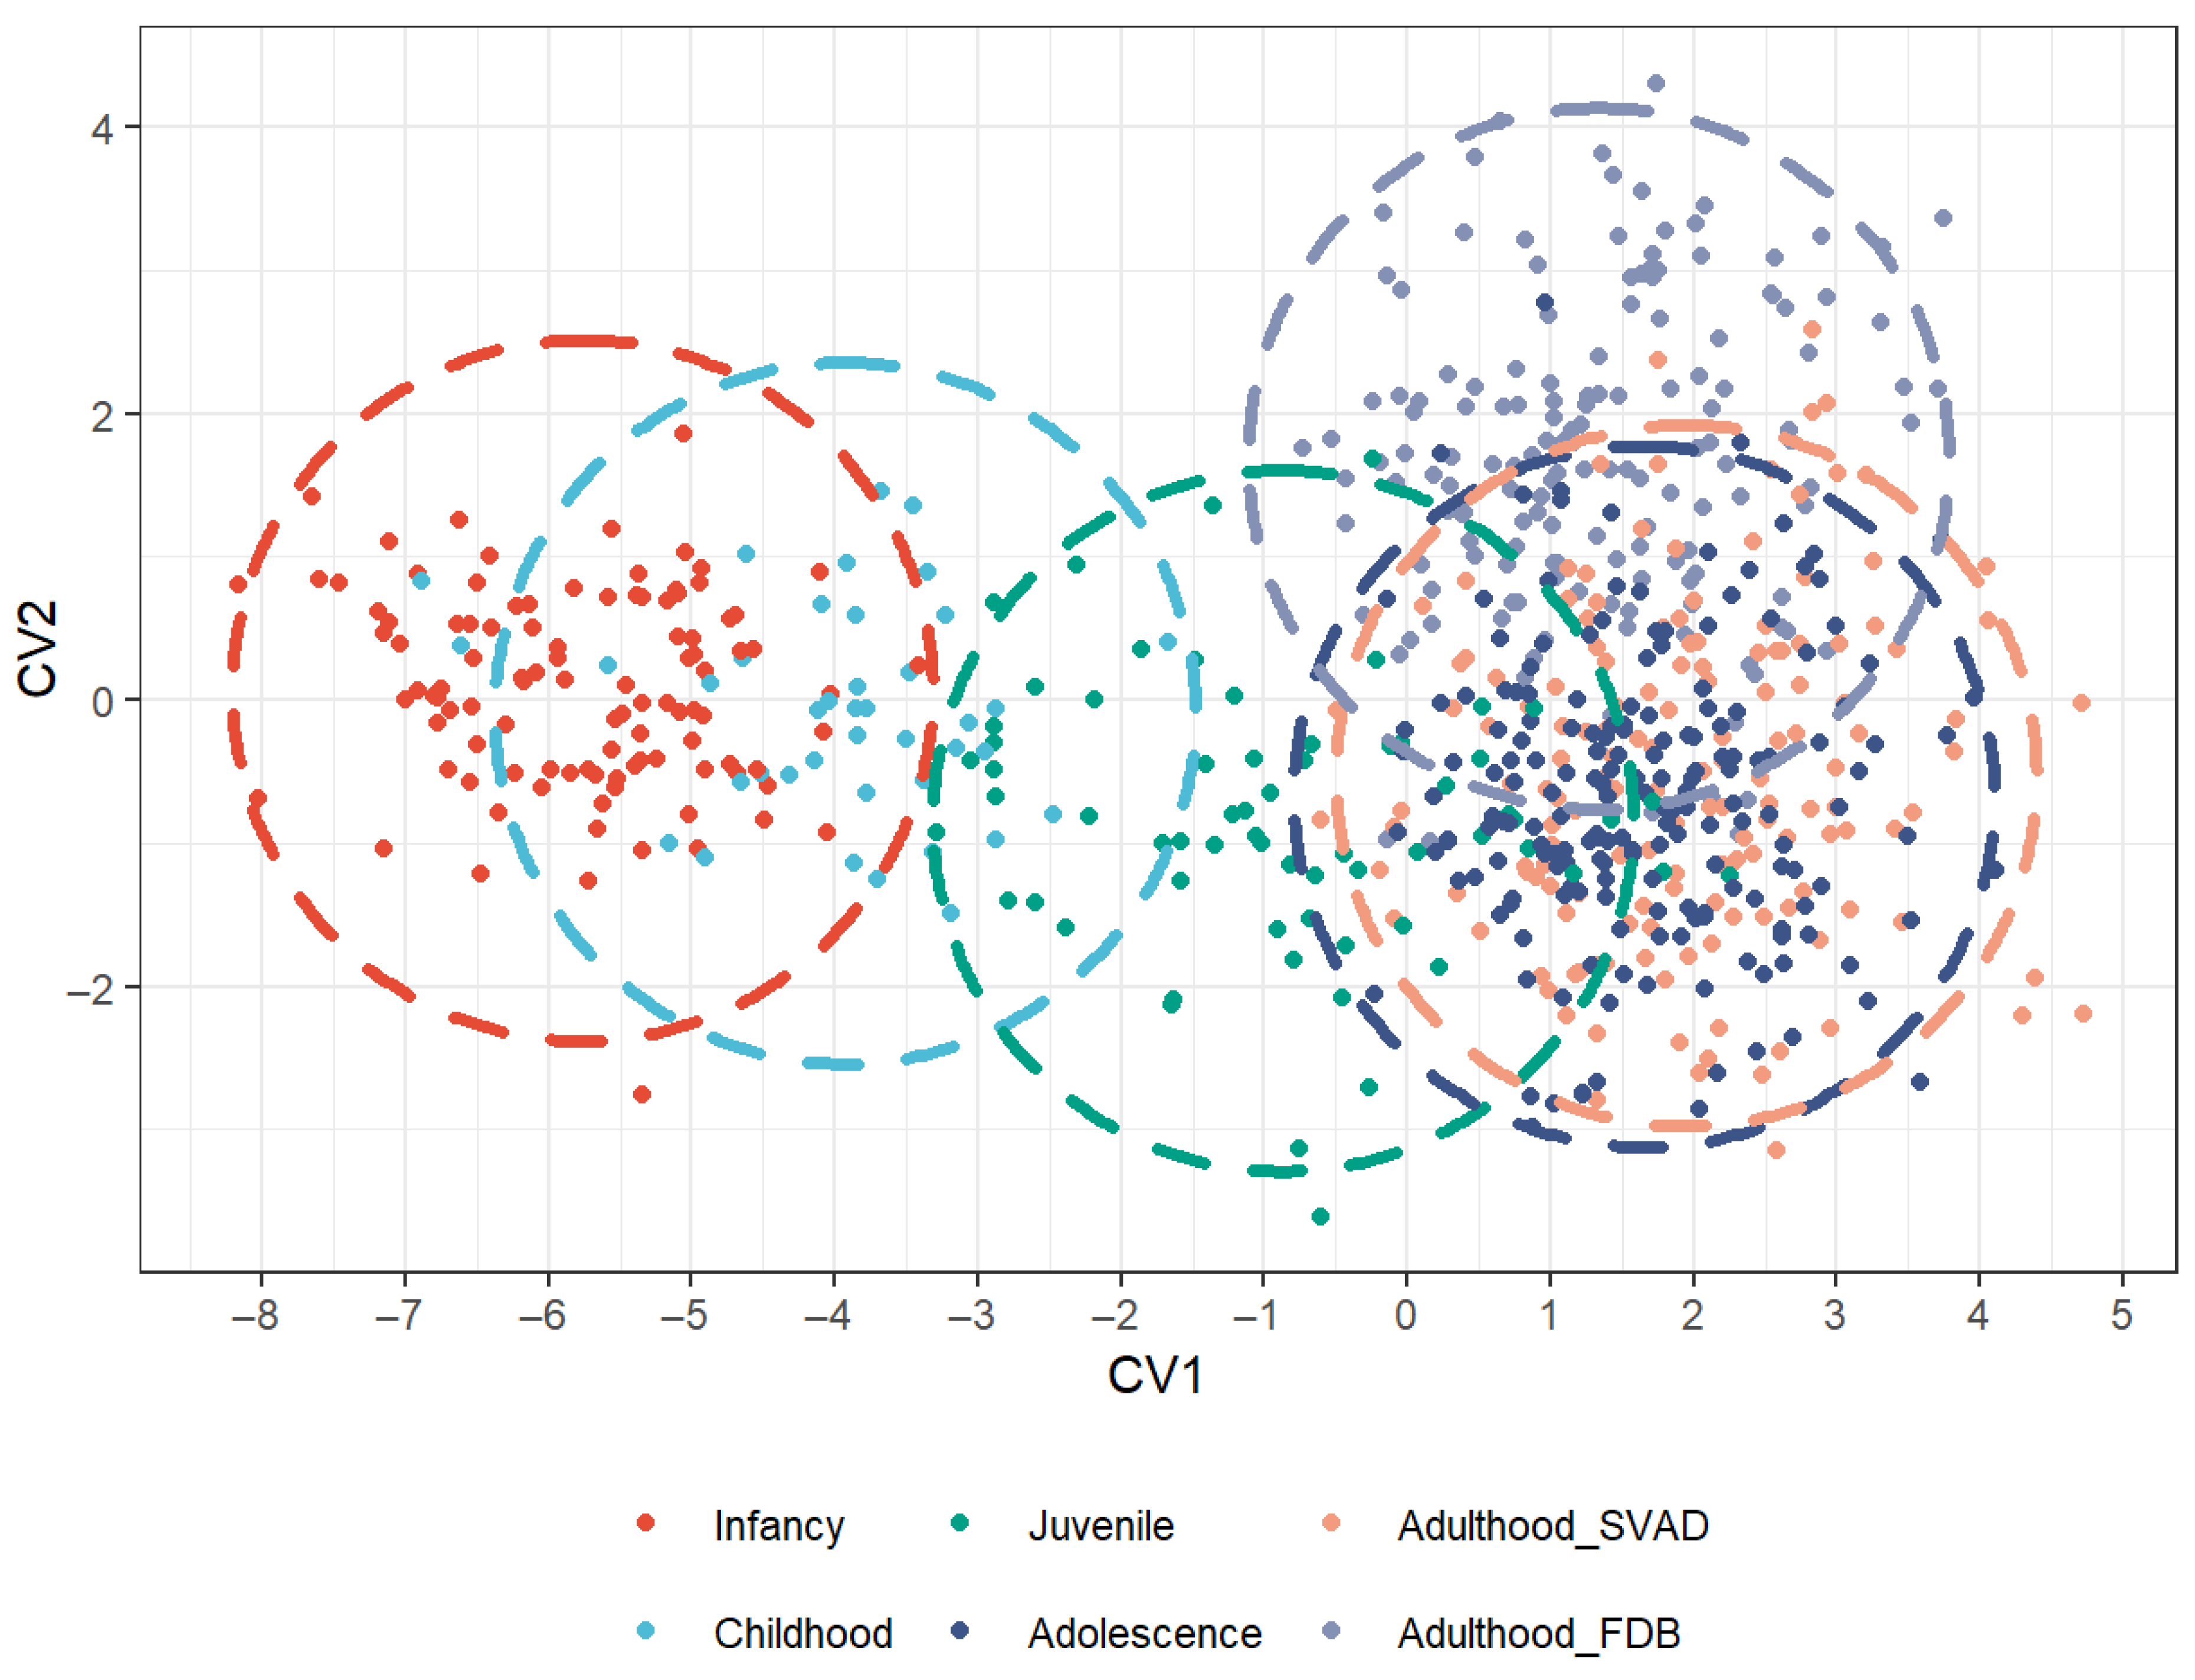
The LDA revealed a distinct ontogenetic pattern in the SVAD sample (Figure 3). The first dimension captures 94% of the variance and clearly measures changes in size and shape that occur with increasing developmental age/maturation. There is clear discrimination between the earliest LH stages (infancy, childhood, and the juvenile period) and the later LH stages (adolescence and adulthood), and a consistent, gradual change through the LH stages. There is substantial overlap on the first dimension between individuals classified as adolescents and adults in the SVAD sample. The Mahalanobis distance between the adolescent and adult group centroids is the smallest (D2 = 0.489) (Table 3), which corroborates the multivariate spatial relationships observed in Figure 3. The proximity of the centroids largely explains the high rates of misclassification between individuals in the adolescence and adulthood LH stages in the SVAD sample, especially when individuals of the other LH stages were largely classified into the correct LH stage (Table 4).
When the FDB adult sample is included in the model, the ontogenetic pattern remains unchanged, and the first dimension still captures an extraordinary amount of variance for change in size by LH stage (86%) (Figure 4). Notably, the FDB adults are comparable to the SVAD adolescents and adults along the first axis. However, the FDB sample presents with increased variation along the second dimension (10%). The Mahalanobis distances remain smallest between SVAD adolescents and adults, and FDB adults have comparable distances to SVAD adolescents and adults (Table 5). The misclassification of the current model primarily occurs between SVAD adolescents and adults and then between FDB adults with SVAD adolescents and adults (Table 6). Multivariate cranial variation patterns appear to clearly separate along LH stages, with levels of adult variation beginning during adolescence.

3.2. Sex Estimation

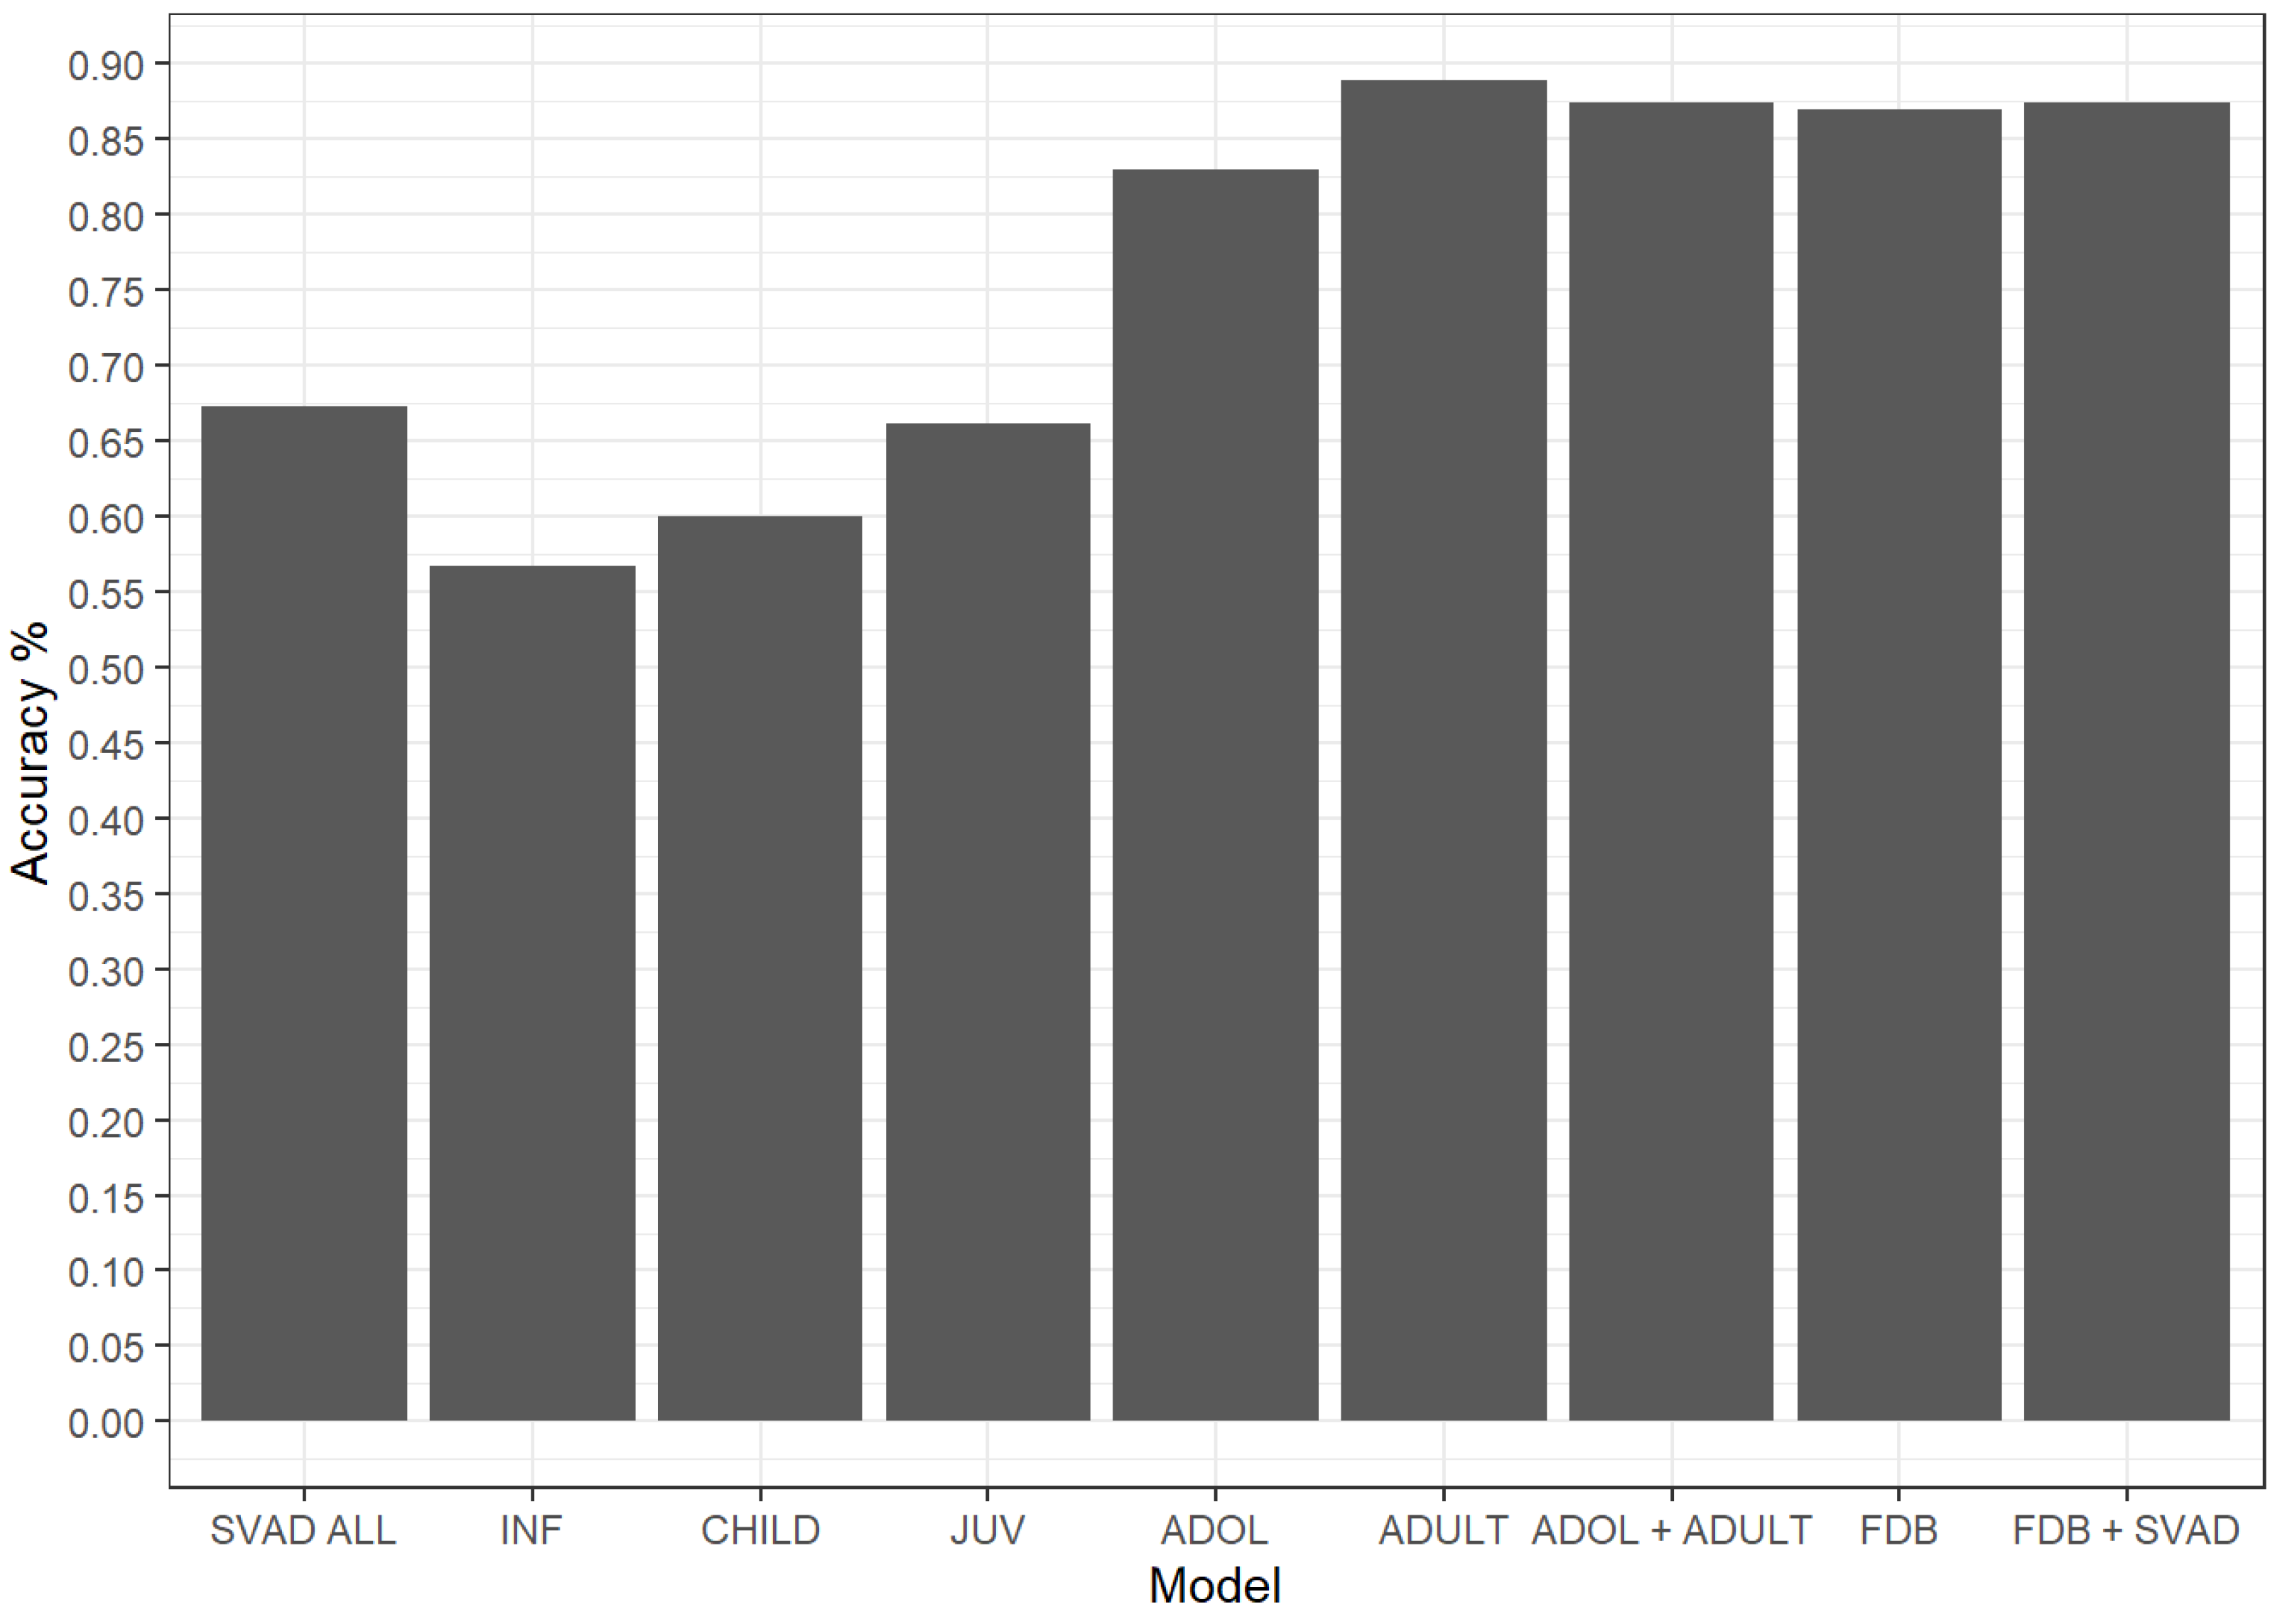
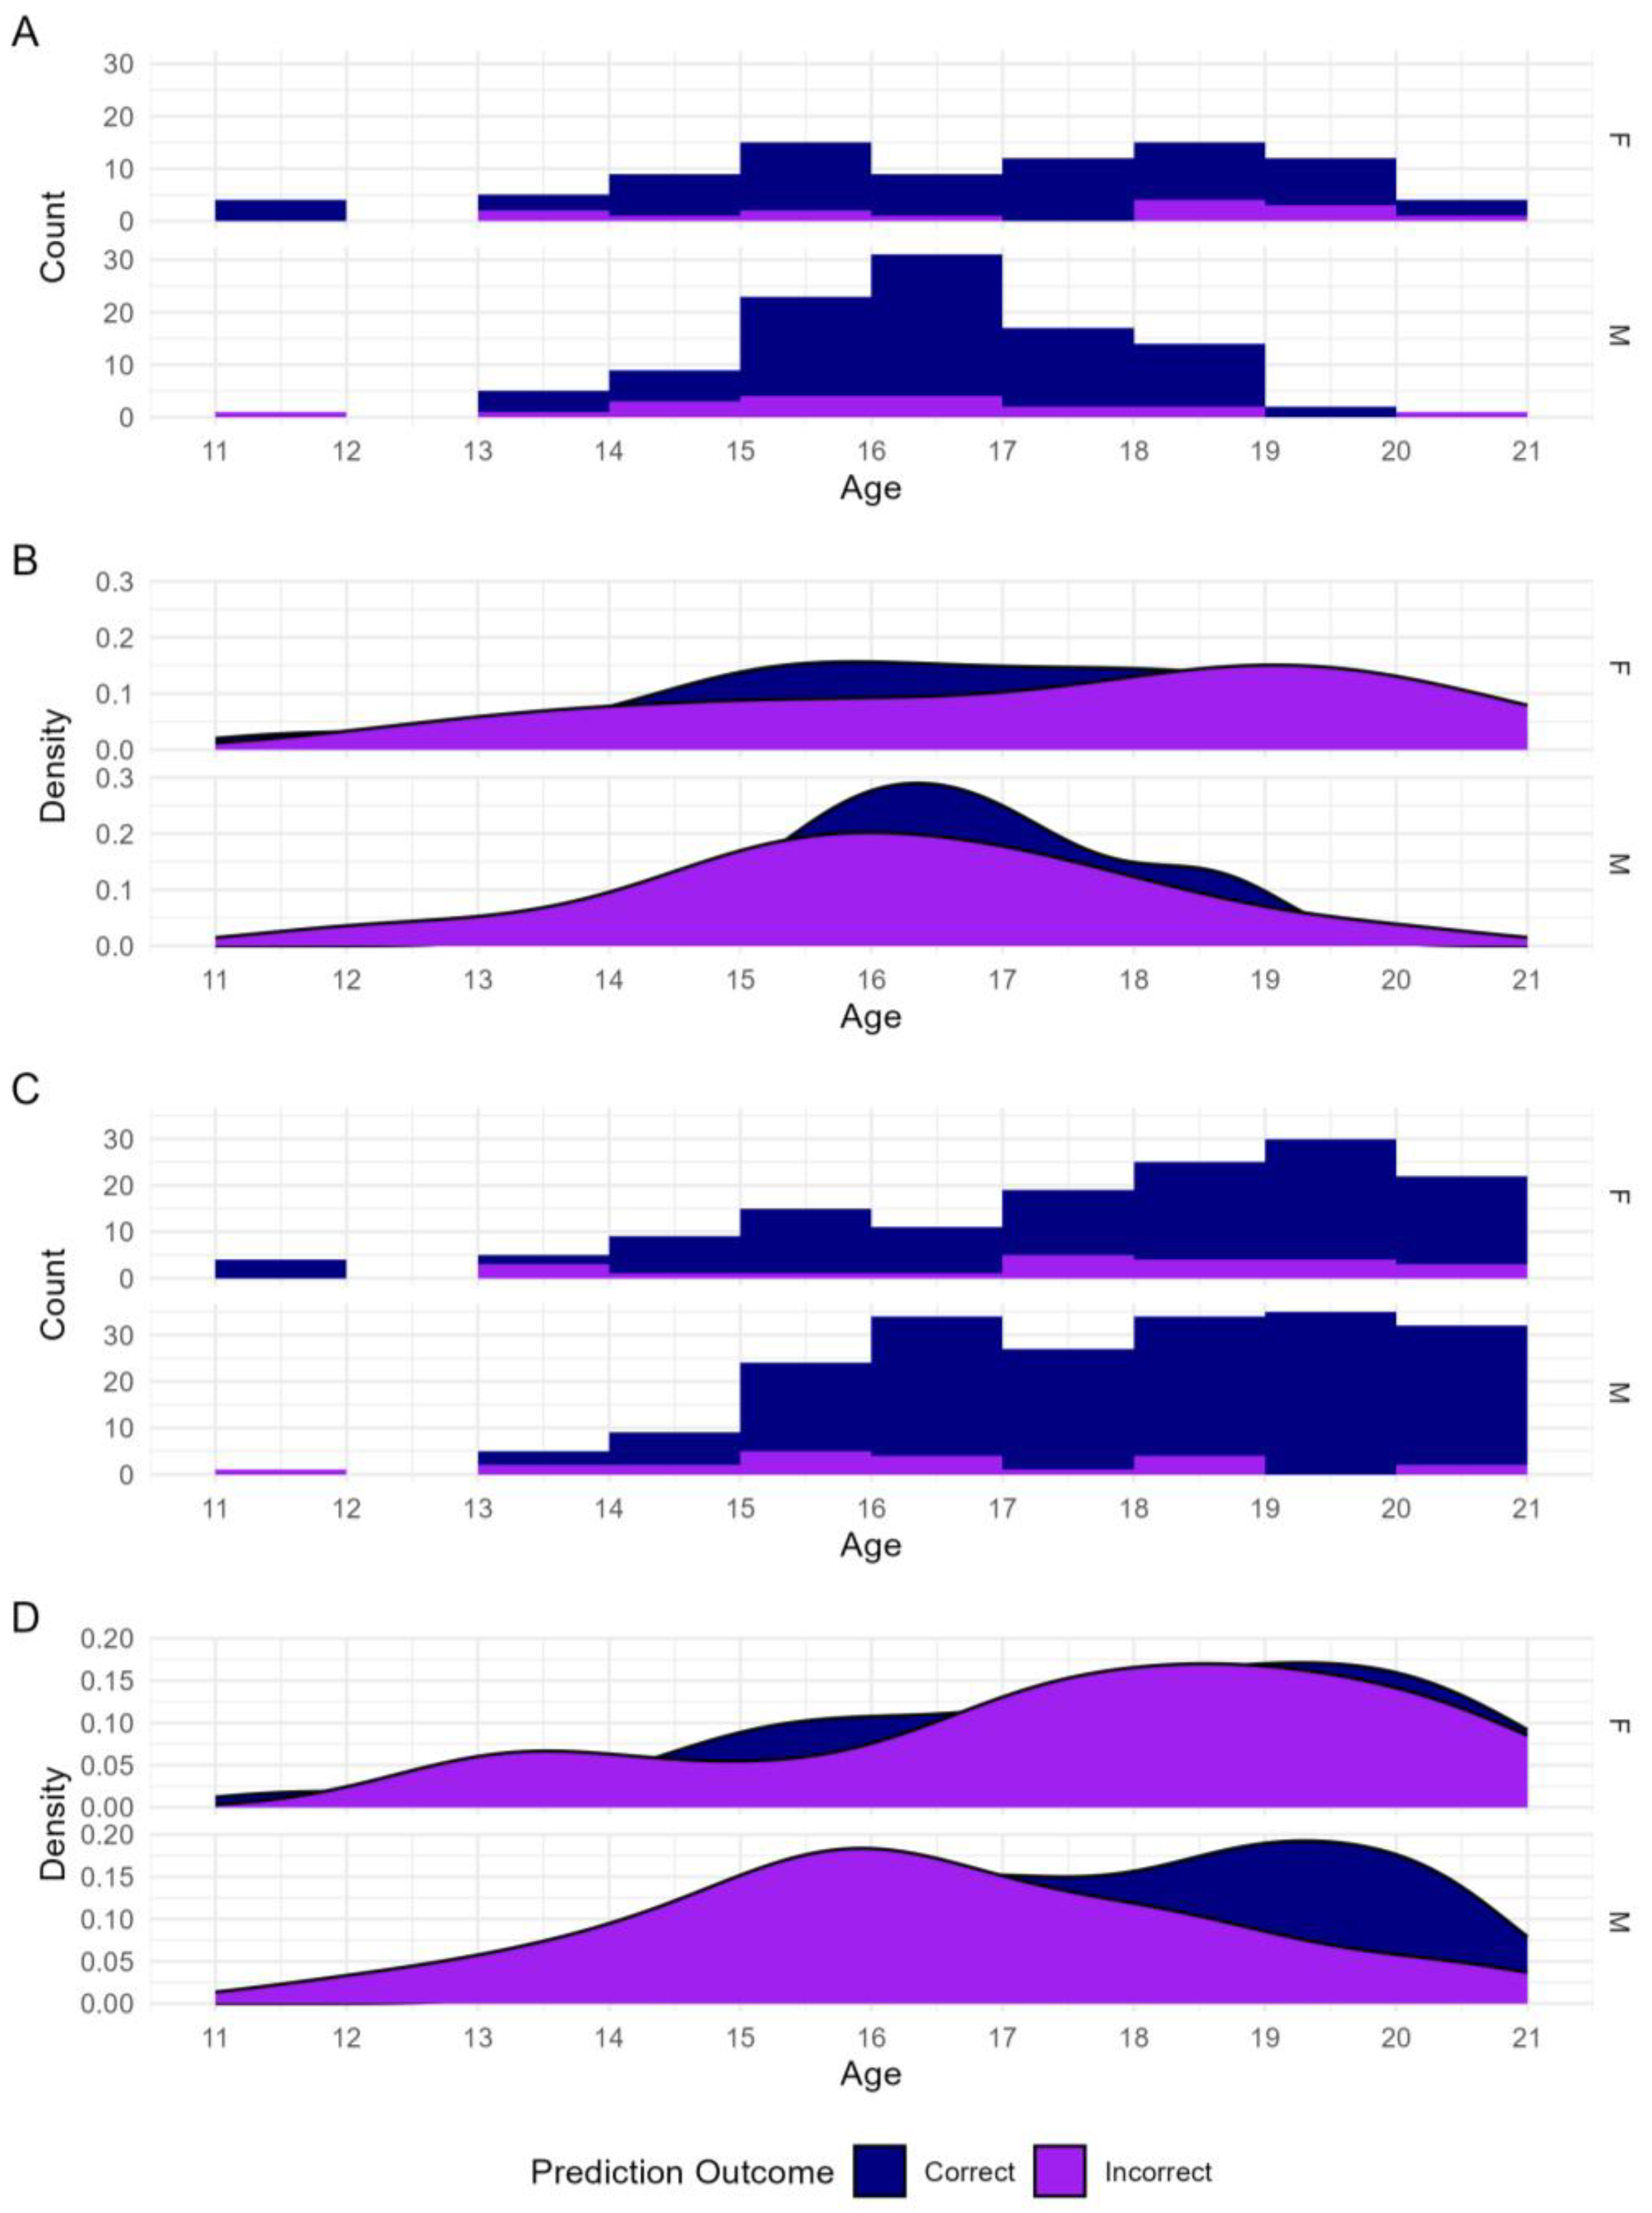
LDA was used to fit classification models for sex estimation in the six LH stages for the SVAD and FDB samples. Table 7 describes the stepwise selected model for each LH stage (or combination of LH stages), the LOOCV accuracy, and its 95% confidence interval. In general, predictive performance is poor (<66%) in infancy, childhood, and juvenile LH stages. At least a 17% increase in accuracy is associated with the adolescence LH stage (83%). The adolescent classification accuracy is lower than the SVAD adults (89%) and FDB adults (87%) models, but it is still more like those LH stages than the juvenile stage or younger (Figure 5 and Table 7). In fact, classification accuracy remains relatively high when combining the individuals in the adolescence and adulthood LH stages in the SVAD sample (90%) and when combining these individuals with the FDB adults (89%) (Table 8 and Table 9, Figure 5). Additionally, the sex bias is absent or minimal in most models except for the SVAD adulthood model (7%) and the combined SVAD adolescence and adulthood model (5%) (Table 8 and Table 9). The misclassifications for the models built with the SVAD adolescence and adulthood LH stages were also visualized by chronological age and sex. Figure 6 exposes nuanced differences at the intersection of age and sex that are not exposed in overall classification accuracies. Specifically, that male-specific classification accuracies increase with increased age.

4. Discussion

The multivariate exploration of the cranial complex revealed broad ontogenetic sex-patterned trends that are aligned with LH theory. These results refute prior arguments that sex estimation is not feasible for skeletally immature individuals, thus challenging current best practices in forensic anthropology that state we should not conduct sex estimation on immature individuals. These results expand the capacities of forensic and biological anthropologists working with subadults. A large sample covering the entire lifespan exposed that (a) the cranial complex has a clear growth trajectory transitioning through the first four LH stages (infancy, childhood, juvenile, and adolescence); (b) a noticeable shift occurs after adolescence with the cranial complex displaying considerable overlap in adolescence and adulthood LH stages; (c) biological sex can be confidently estimated on adolescent crania with classification accuracies comparable to adults; and (d) a misclassification pattern in sex estimation reveals a sex-specific pattern reflecting differential growth strategies of secondary sex characteristics for males and females. These findings substantiate previous publications [19,20,78] and are meaningful for forensic anthropology researchers and practitioners who develop and apply methods for the biological profile. The current research challenges the field to recognize the importance of growth, development, and LH theory for understanding human variation expressed both in the subadult and adult phenotypes, and, subsequently, in method development.

4.1. How the Cranium Captures Life History Theory

The results revealed that from infancy to the onset of adolescence, there is a cranial trajectory that closely aligns with the broad energetic periods of growth. There is a continuous change in multivariate dimensions that strongly aligns with the LH stages, and there is very little variance captured outside of that first dimension (Figure 3 and Figure 4). The gradual change in size and shape concomitant with increased age was also noted in previous studies exploring subadult cranial growth, e.g., [19]. In LH theory, after growth, the broad energetic period is reproduction, with puberty centered at this life history transition [49,79]. It has been suggested that approximately 50% of skeletal sexual dimorphism is associated with the attainment of approximately 90% of adult size [13,80]. Thus, because of the timing of puberty and myriad changes associated with adolescence (i.e., growth spurts, breast development, penile enlargement, menarche), by the time individuals transition to adulthood (biologically and/or chronologically), the sexually dimorphic shape and proportions seen in adults are already present [48,61,80,81,82]. The shift out of the growth phase and into the reproductive phase is reflected by the shift of the cranial complex along the first and second dimensions of multivariate space (Figure 3). Rather than continuing along the first dimension as individuals transition to adulthood, change in the multivariate cranial complex shifts to the second dimension. This is most obvious with the inclusion of the FDB sample (Figure 4). In essence, the changes between the first four LH stages (infancy, childhood, juvenile, adolescence) and the last two LH stages (adolescence and adulthood) in our analyses capture a change in the allocation of resources that drives the transition from the growth phase to the reproductive or adaptive phase during the adolescence LH stage.
Verification of this trend is also evident in the primary misclassification patterns from the LDA and the D2 values (Table 3 and Table 4). There are more misclassifications between the adolescence and adulthood SVAD groups compared to any other developmental LH stage, and the misclassification patterns remain when we incorporate the adult FDB sample (Table 5 and Table 6). Misclassifications are shared by the most phenotypically similar groups: adolescence, SVAD adulthood, and FDB adulthood categories (Figure 4, Table 5 and Table 6). We cannot argue that all shape and size changes are completed in adolescence, as we do not have the longitudinal data necessary to answer that question. In fact, we do not expect growth to cease during adolescence because previous research has demonstrated it does not [79,82,83]. However, cranial size does largely stabilize in adolescence, and growth markedly decreases following adolescence [12]. The stabilization of size is evident in the negligible differences between the cranial complexes of individuals that are classified as adolescents and adults. A similar finding was noted by other researchers exploring the cranium of individuals with comparable age ranges [84]. These results contrast the gradual and spatially oriented changes the cranium exhibited in the broad ‘growth’ period from birth through the end of the adolescence LH stage.
The patterns of correct sex estimation accuracy across the LH stages also highlight the change in broad energetic periods. Correct classification for sex estimation ranges from 57% to 66% in the infancy, childhood, and juvenile LH stages with 95% CIs between 43% and 77% (Table 7). These low values point towards minimal sexual dimorphism in cranial dimensions or, at least, a level of sexual dimorphism that is too low for a discriminant model to effectively identify. Energy allocated in these earlier LH stages is concentrated on brain growth, increase in size, and physical and cognitive development to reach independence [48,85,86]. Essentially, most of cranial growth in size occurs uniformly in both males and females in these early stages before sexual differences start manifesting [15,19]. The sex estimation models built using individuals in the adolescence LH stage achieved a classification accuracy of 83% confirming the shift in energy resources away from growth. Growth deceleration and energy reallocation towards the reproductive or adaptive phases generally have downstream effects. One effect of note is an increase in the expression of sexual dimorphism in cranial size and shape, due to later life achievement of the final size. This is also identified in univariate cranial dimensions [12] and long bones [80]. While the mean value for performance is slightly lower in the LDA models using adolescents (83%) compared to the SVAD and FDB adulthood samples (89% and 87%, respectively), the 95% CI values of the adolescence model (77–88% 95% CI) overlap with the 95% CI values achieved for the SVAD and FDB adult models (81–93%) (Table 7). Additionally, there is no overlap in performance between infancy, childhood, and juvenile models and those of the adolescence and adulthood models, further supporting the strength of the LH shift from growth to reproduction.

4.2. Impact on Forensic Anthropology: Sex Estimation

The current research refutes the idea that sex estimation is not feasible on all skeletally immature individuals, and corroborates other studies that have reached similar conclusions [19,78]. The adulthood SVAD and adulthood FDB models have higher classification accuracies (89%/87%) than the adolescence model (83%), though we would argue this is still comparable among the LH stages and comparable to other methods used in forensic anthropology, such as long bone dimensions [87] and morphological cranial traits [88,89,90]. Similar findings from numerous studies using both metric and morphological pelvic data have shown that the pelvis can accurately estimate the sex of individuals considered immature [10,18,91,92].
The overlap in phenotypes observed in a multivariate space and the comparable—and high—classification accuracies for the adolescence and adulthood LH stage models have a major impact on the capacity of forensic anthropologists to estimate a more comprehensive biological profile for skeletally immature individuals. In terms of sex estimation, the SVAD adolescents, SVAD adults, and the FDB adults all have comparable performance in terms of their classification accuracies (>~83%) (Table 7, Figure 5). The results staunchly support the estimation of sex in adolescent crania and the inappropriateness of estimating sex on individuals that have not yet reached the adolescence LH stage. There was no major trend in misclassification on chronological age when sexes were pooled. However, a slightly different trend emerged when it was sex-specific (Figure 6A,B); the male misclassification is skewed towards younger individuals (Figure 6). When individuals in the adolescence and adulthood LH stages are combined (Figure 6C,D), the trend of younger males misclassifying at a higher rate than females remains unchanged. Life history theory states females will attain developmental milestones at younger chronological ages than males and exhibit more developmentally mature phenotypes than males of the same ages [85,93]. For the cranium, females tend to have a marked deceleration in facial growth following puberty, and males tend to have continued hypermorphosis and dimensional changes through late adolescence [12,16,22,81,82]. The later phenotypic stabilization appears to be evident in the increase in correct classifications and decrease in misclassifications as age increases for males (Figure 6D). Because of the later phenotypic stabilization of males, relying solely on metric data in practice may lead to a higher likelihood of misclassifying (chronologically young) adolescent males, regardless of whether they are developmentally mature or not. The most sexually dimorphic regions on the cranium are said to be the glabella and the mastoid [94], and these regions are also used in morphological cranial sex estimation. The glabella and the mastoid stabilize in their phenotypic expression also around 15–17 years [10,11,16]. Pelvic metrics and morphology could also be incorporated into the analyses because pelvic sexual dimorphism is present following fusion of the triradiate cartilage (~12 years) [10,18,91]. Therefore, if robust cranial morphological features are present or gracile pelvic features are present, a practitioner should be more confident in their sex estimation based on craniometric data.

Practical Application

To ensure practical applicability of our findings and verify suggestions for practitioners, the cranial dimensions of 30 randomly sampled SVAD adolescents were used in Fordisc 3.1 to estimate sex [95]. Of those thirty individuals, 26 were correctly classified (87%). Of the misclassified individuals, two were males. Importantly, the chronological ages of the misclassified individuals were 13.9 years old and 16.2 years old. These individuals are not the youngest or oldest individuals in the random sample. Additionally, the accuracy achieved (87%) is the same as the sample of FDB adults achieved, and 1% less than what the SVAD adulthood sample achieved in the current study, which is only 3% less than the best cranial models using one population, as demonstrated by Spradley and Jantz [87], and is comparable to the accuracy of cranial morphological traits [89,90].
The standard suite of craniometrics used to estimate sex in this study may not be applicable in a real-life context where missing data is a persistent limitation. However, because the stepwise model selected 9 of the 24 craniometric variables for the final model, this approach could likely still be applicable to incomplete crania. Working with fragmentary or commingled remains can make it difficult to determine if an individual has reached a developmental state where sex estimation is feasible using the current methodology, though. Realistically, forensic anthropologists do not have access to all elements of the skeleton when working on a forensic case [96], especially considering the likelihood of the loss and fragmentation of smaller epiphyses like the iliac crest. In the context of using the cranial complex for sex estimation, dentition would not require additional skeletal elements, and retention of posterior teeth is far likelier than many epiphyses in postmortem situations. Therefore, to better inform practitioners working in a variety of contexts, we investigated how well models using only dental development performed for classification into the adolescence or adulthood LH stage.
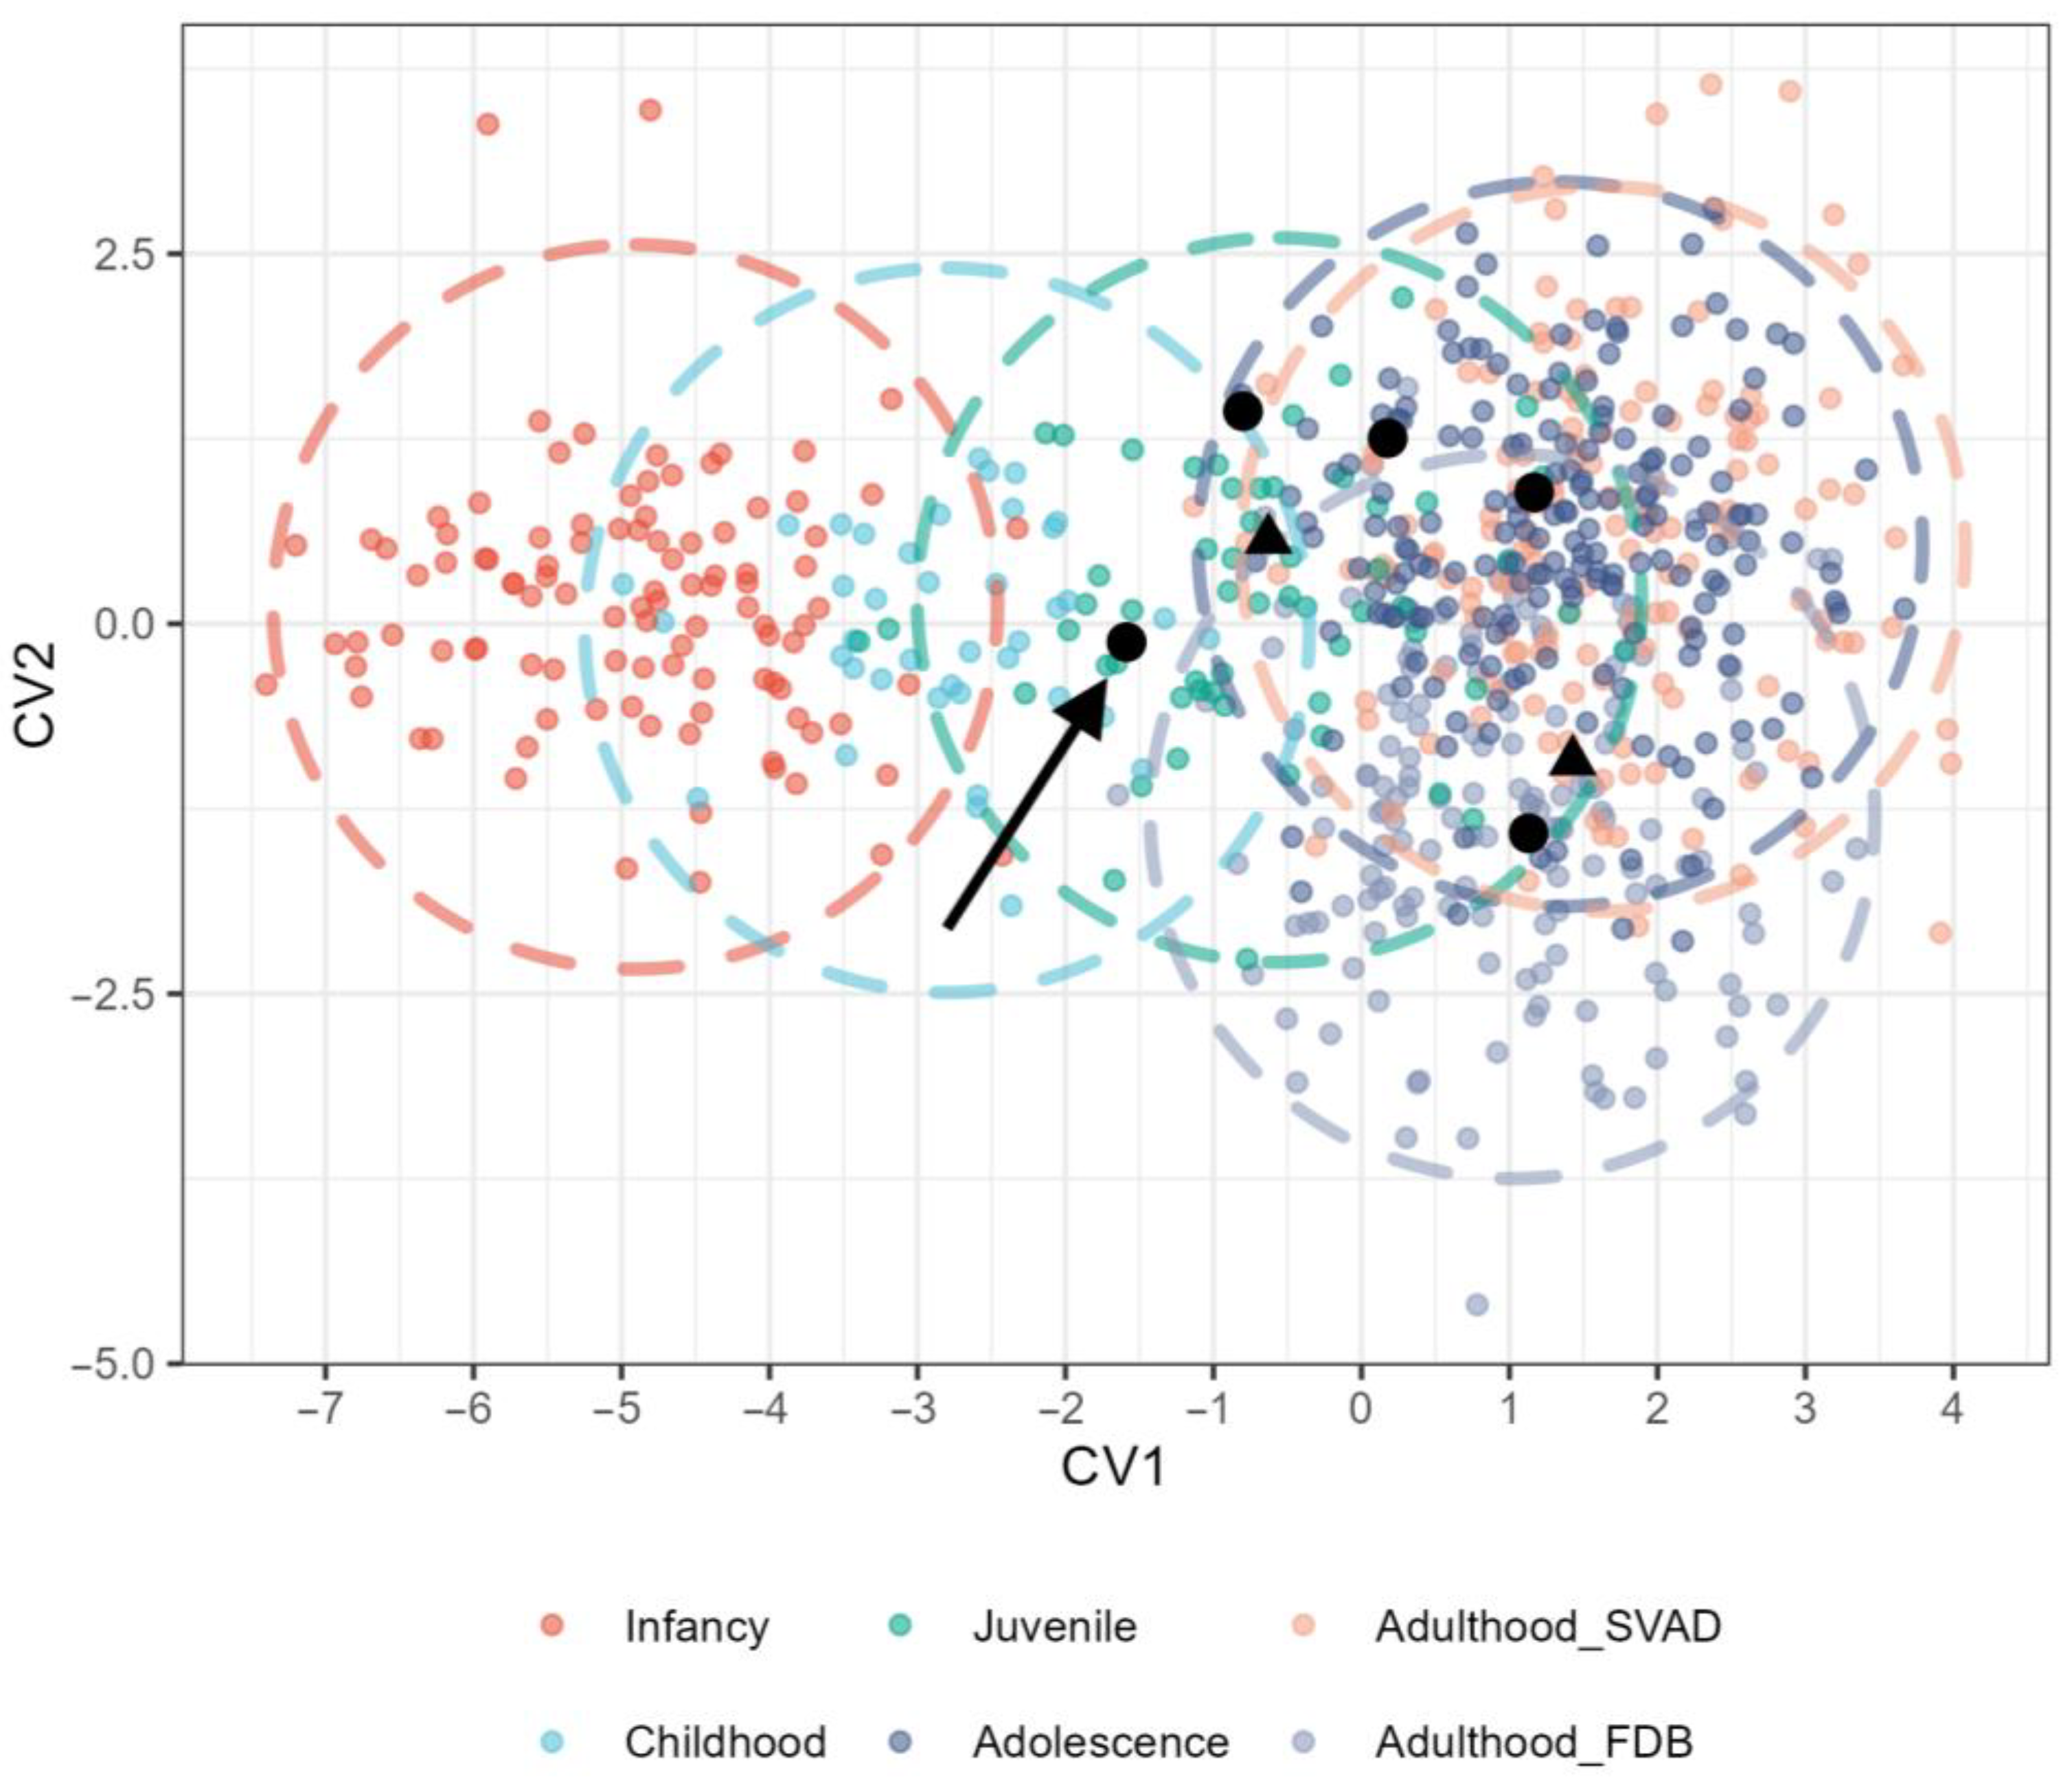
When the SVAD sample is filtered using a dental development stage of greater than or equal to ‘Root Complete’ for the second molar, 353 individuals (98%) comprise the adolescence or adulthood LH stages, and seven individuals comprise the juvenile LH stage (Figure 7). In the juvenile LH stage, five individuals are males between the ages of 12 years and 14 years, and the other two individuals are females between the ages of 11 years and 12 years. When highlighted in multivariate space, all but one (n = 6) of the juvenile individuals are within the cranial variation of SVAD adolescents; five out of the six juvenile individuals are within the cranial variation of SVAD adults, and three out of the six juveniles are also within the variation of FDB adults (Figure 8). In Figure 8, the black arrow points to the second-oldest male (14.9 years). This individual is classified as a juvenile based on dental development and phenotypically resembles juveniles, despite their chronological age. This example emphasizes two major things: (a) the importance of developmental age rather than chronological age when considering a sex estimation, and (b) when a second molar is at least in a root complete stage, the individual has reached a maturity level where sex estimation is feasible with high accuracy (i.e., they align with adult phenotypic variation). Of the 2% (6 out of 353) of individuals categorized as juveniles, most were phenotypically comparable to individuals in the adolescence and adulthood LH stages (Figure 8).

4.3. The Relationship Among Skeletal and Sexual Maturity Indicators

It is interesting to note the overlap among SVAD juveniles, adolescents, and adults (Figure 3) and even the SVAD juveniles and FDB adults (Figure 4). The juvenile period was defined in the present study based on two developmental indicators: the first molar being greater than or equal to the Root ¾ stage and the absence of the iliac crest. Using these two skeletal and dental maturity indicators results in a wide age range; specifically for females, the age range was 5 to 13 years, and for males, the age range was 5 to 15 years (Table 1). When considering the median age of menarche (12 years) for contemporary females in the United States, and the relationship between the iliac crest and menarche, there are females in the juvenile LH stage who likely have experienced puberty and menarche [60,97]. As stated before, the characterization of these individuals as “juvenile” is solely based on two indicators that do not capture the initiation of puberty and have variation in their development. Additionally, because a sample will always include “early” and “late” maturers, and maturity indicators do not always align, there are likely individuals who would be classified into a different LH stage if different indicators were used. This illustrates (a) intra-individual variation in growth and development patterns, (b) the limitations of skeletal and dental indicators to identify puberty, and (c) the potential of excluding individuals from analyses based on a limited and arguably arbitrary assessment of their maturational status. While longitudinal studies have explored the relationship between pubertal status and skeletal maturation, these studies are usually based on a limited number of anatomical sites, with the emphasis on the hand–wrist, and focus on the pubertal growth spurt and not initiation of puberty [59,98,99]. While the SVAD data has >250 variables available per individual, research projects amassing this data prioritized data commonly used in the biological profile, and therefore, it does not include metacarpal and phalange fusion data. Future studies should incorporate hand–wrist data as a maturity indicator, as fusion of the phalanges may better capture the initiation of puberty [59].
Considering the current findings and other recent research, a better approach to the study of immature individuals is to consider the individual’s biological maturity as a gauge for how to proceed with the biological profile. Cole [10] and Corron et al. [18] adopted the concept of using numerous maturity indicators or coming up with a maturity scale as a first step prior to estimating sex using morphological features of the pelvis. Another option is to only use one type of maturity indicator, such as Auchter & Stull [91], who require a pelvis with a fused triradiate cartilage to guide sex estimation. The current study demonstrated that a combination of dental-skeletal maturity indicators or, if necessary, individual indicators, can categorize individuals such that accurate sex estimations can be achieved. Our field requires more research exploring the covariance among maturity indicators to better understand the interrelationships among the human body and to better understand how those relationships will impact method development and application.

4.4. The Second Dimension and Population Variation

Even though the FDB adults overlap with SVAD adolescents and adults on the first dimension, the adult FDB group clearly differentiates itself from the SVAD sample on the second dimension. The extension of the second dimension is likely capturing a larger and more diverse range of cranial variation related to time and/or demographic differences between the samples. The FDB sample is comprised of individuals with a mean age of 58 years, while the mean age of the adult SVAD sample is 19 years. On average, individuals in the FDB sample were born 40 years prior to the SVAD adults, and in some situations, this could extend to being born 80 years prior to the youngest SVAD adults. Additionally, the FDB sample is comprised of individuals from different regions of the United States compared to the single geographic origin of the SVAD sample used in this research (i.e., New Mexico). The FDB has a major contribution from modern skeletal collections in the southeast (UTK Donated Collection) and Texas (Texas State Donated Collection), and minor contributions from other parts of the country. The FDB data is anonymized, and we do not have the full donor records or case files; therefore, we cannot confirm the geographic origin of individuals.
The current SVAD sample does not have the demographic diversity to evaluate population differences, preventing further explorations of that source of phenotypic variation. However, we hypothesize that population affinity may be effectively estimated in the adolescence LH group, mirroring the results obtained for sex estimation. This hypothesis is supported by published literature involving both metric and morphological data. Previous studies have shown that modern populations have discernible facial shapes regardless of age, and, if differential ontogenetic trajectories exist, they maximize differences in the resulting adult phenotypes [8,100]. Other authors studying hominins have also found that adult facial shape is already established by the time the first permanent molar erupts [101]. The ontogeny of morphological variables used in population affinity research has also been presented with frequency values matching adult populations in skeletally immature individuals [102,103]. A sample with greater demographic diversity should be used to further explore the phenotypic expression of population variation prior to adulthood and test the feasibility of population affinity estimation in adolescence.

5. Conclusions

An ontogenetic framework, along with the use of biologically derived LH stages, exposes the similarities in adolescent and adult phenotypes and how these findings can expand the application of anthropological methods. The categorization of adult and subadult methods in forensic anthropology, along with the arbitrary chronological age ranges associated with them, is a downstream consequence of convenience sampling and the inherent biases in skeletal collections. For the cranium in particular, our research shows that a better divide between ‘subadult’ and ‘adult’ occurs between the juvenile and adolescence LH stages rather than between adolescence and adulthood. Importantly, the majority, if not all, of previous studies exploring cranial growth focus on chronological age divisions rather than the biologically meaningful divisions put forth in this work. By exploring the entire ontogenetic period, we can clearly see the shift between the growth phase and the reproductive energetic phases and how the cranial complex reaches an adult-like state prior to the individual being considered an adult as defined by somatic, sexual, and skeletal development. The comparable cranial size of individuals in the adolescence and adulthood LH stages, in tandem with the comparable classification accuracies, indicates that practitioners can confidently estimate sex prior to an individual being skeletally mature. Consequently, the concept of subadult and adult methods should be revised in our field and determined on an individual basis, regardless of chronological age. We encourage validation of these findings and refinement of best practice documents in forensic anthropology to reflect the idea that one does not have to be fully skeletally mature to accurately estimate sex.

Author Contributions

Conceptualization, K.E.S. and L.K.C.; methodology, K.E.S., L.K.C., K.S. and C.A.W.; formal analysis, C.A.W. and K.E.S.; resources, K.E.S., L.K.C., C.A.W. and B.T.N.; data curation, K.E.S., L.K.C. and K.S.; writing—original draft preparation, K.E.S., L.K.C., B.T.N., C.A.W. and K.S.; writing—review and editing, K.E.S., B.T.N., L.K.C., C.A.W. and K.S.; visualization, K.E.S. and C.A.W.; project administration, K.E.S. and L.K.C.; funding acquisition, K.E.S., K.S. and L.K.C. All authors have read and agreed to the published version of the manuscript.

Funding

This research was funded by the National Institute of Justice, Award Number 2019-DU-BX-0039.

Institutional Review Board Statement

The study was conducted according to the guidelines of the Declaration of Helsinki and was determined not to be human subjects research according to the Code of Federal Regulations (45 CRF 46.102: Protection of Human Subjects) and the Institutional Review Board of the Research Integrity Office of the University of Nevada, Reno (Reference # 1586664-1).

Informed Consent Statement

Not applicable.

Data Availability Statement

The full analysis is available via Zenodo (https://zenodo.org/records/15741672, accessed 13 August 2025) and GitHub (https://github.com/ChristopherAWolfe/Stulletal2025_ForensicScience, accessed 13 August 2025). The data collection protocol is also available (https://doi.org/10.5281/zenodo.6625998). The raw SVAD data supporting the conclusions of this article will be made available by the authors on request. Please contact Richard Jantz for the Forensic Data Bank data.

Acknowledgments

Much gratitude to Richard Jantz for facilitating access to the FDB and to all colleagues who have contributed to the FDB so that access to large, diverse samples is possible. Similarly, thank you to the colleagues who have worked towards establishing large, freely available virtual resources and open-access scientific initiatives. The reviewer comments helped strengthen this manuscript.

Conflicts of Interest

The authors declare no conflicts of interest.

References

  1. Huda, T.F.J.; Bowman, J.E. Age Determination from Dental Microstructure in Juveniles. Am. J. Phys. Anthropol. 1995, 97, 135–150. [Google Scholar] [CrossRef]
  2. Niel, M.; Chaumoître, K.; Adalian, P. Age-at-Death Estimation of Fetuses and Infants in Forensic Anthropology: A New “Coupling” Method to Detect Biases Due to Altered Growth Trajectories. Biology 2022, 11, 200. [Google Scholar] [CrossRef] [PubMed]
  3. Nyström, M.; Peck, L.; Kleemola-Kujala, E.; Evälahti, M.; Kataja, M. Age Estimation in Small Children: Reference Values Based on Counts of Deciduous Teeth in Finns. Forensic Sci. Int. 2000, 110, 179–188. [Google Scholar] [CrossRef]
  4. Corron, L.; Marchal, F.; Condemi, S.; Telmon, S. Integrating Growth Variability of the Ilium, Fifth Lumbar Vertebra, and Clavicle with Multivariate Adaptive Regression Splines Models for Subadult Age Estimation. J. Forensic Sci. 2019, 64, 34. [Google Scholar] [CrossRef]
  5. Stull, K.E.; L’Abbé, E.N.; Ousley, S.D. Using Multivariate Adaptive Regression Splines to Estimate Subadult Age from Diaphyseal Dimensions. Am. J. Phys. Anthr. 2014, 154, 376–386. [Google Scholar] [CrossRef] [PubMed]
  6. De Tobel, J.; Fieuws, S.; Hillewig, E.; Phlypo, I.; van Wijk, M.; de Haas, M.B.; Politis, C.; Verstraete, K.L.; Thevissen, P.W. Multi-Factorial Age Estimation: A Bayesian Approach Combining Dental and Skeletal Magnetic Resonance Imaging. Forensic Sci. Int. 2020, 306, 110054. [Google Scholar] [CrossRef] [PubMed]
  7. Jeffery, N.S.; Humphreys, C.; Manson, A. A Human Craniofacial Life-Course: Cross-Sectional Morphological Covariations during Postnatal Growth, Adolescence, and Aging. Anat. Rec. 2022, 305, 81–99. [Google Scholar] [CrossRef]
  8. Viðarsdóttir, U.S.; O’Higgins, P.; Stringer, C. A Geometric Morphometric Study of Regional Differences in the Ontogeny of the Modern Human Facial Skeleton. J. Anat. 2002, 201, 211–229. [Google Scholar] [CrossRef]
  9. Bilfeld, M.F.; Dedouit, F.; Sans, N.; Rousseau, H.; Rougé, D.; Telmon, N. Ontogeny of Size and Shape Sexual Dimorphism in the Pubis: A Multislice Computed Tomography Study by Geometric Morphometry. J. Forensic Sci. 2015, 60, 1121–1128. [Google Scholar] [CrossRef]
  10. Cole, S.J. Developing Subadult Sex Estimation Standards Using Adult Morphological Sex Traits and an Ontogenetic Approach. Ph.D. Thesis, University of Nevada, Reno, NV, USA, 2022. [Google Scholar]
  11. Stock, M.K. A Preliminary Analysis of the Age of Full Expression of Sexually Dimorphic Cranial Traits. J. Forensic Sci. 2018, 63, 1802–1808. [Google Scholar] [CrossRef]
  12. New, B.T.; Stull, K.E.; Corron, L.K.; Wolfe, C.A. Exploring Cranial Growth Patterns from Birth to Adulthood for Forensic Research and Practice. Forensic Sci. 2025, 5, 32. [Google Scholar] [CrossRef]
  13. Wilson, L.A.; Ives, R.; Cardoso, H.F.; Humphrey, L.T. Shape, Size, and Maturity Trajectories of the Human Ilium. Am. J. Phys. Anthropol. 2015, 156, 19–34. [Google Scholar] [CrossRef]
  14. Matthews, H.S.; Penington, A.J.; Hardiman, R.; Fan, Y.; Clement, J.G.; Kilpatrick, N.M.; Claes, P.D. Modelling 3D Craniofacial Growth Trajectories for Population Comparison and Classification Illustrated Using Sex-Differences. Sci. Rep. 2018, 8, 4771. [Google Scholar] [CrossRef]
  15. Liang, C.; Profico, A.; Buzi, C.; Khonsari, R.H.; Johnson, D.; O’Higgins, P.; Moazen, M. Normal Human Craniofacial Growth and Development from 0 to 4 Years. Sci. Rep. 2023, 13, 9641. [Google Scholar] [CrossRef]
  16. Smith, O.A.M.; Nashed, Y.S.G.; Duncan, C.; Pears, N.; Profico, A.; O’Higgins, P. 3D Modeling of Craniofacial Ontogeny and Sexual Dimorphism in Children. Anat. Rec. 2021, 304, 1918–1926. [Google Scholar] [CrossRef] [PubMed]
  17. Bilfeld, M.F.; Dedouit, F.; Sans, N.; Rousseau, H.; Rougé, D.; Telmon, N. Ontogeny of Size and Shape Sexual Dimorphism in the Ilium: A Multislice Computed Tomography Study by Geometric Morphometry. J. Forensic Sci. 2013, 58, 303–310. [Google Scholar] [CrossRef] [PubMed]
  18. Corron, L.K.; Santos, F.; Adalian, P.; Chaumoitre, K.; Guyomarc’h, P.; Marchal, F.; Brůžek, J. How Low Can We Go? A Skeletal Maturity Threshold for Probabilistic Visual Sex Estimation from Immature Human Os Coxae. Forensic Sci. Int. 2021, 325, 110854. [Google Scholar] [CrossRef]
  19. Noble, J.; Cardini, A.; Flavel, A.; Franklin, D. Geometric Morphometrics on Juvenile Crania: Exploring Age and Sex Variation in an Australian Population. Forensic Sci. Int. 2019, 294, 57–68. [Google Scholar] [CrossRef] [PubMed]
  20. Bastir, M.; Rosas, A.; O’Higgins, P. Craniofacial Levels and the Morphological Maturation of the Human Skull. J. Anat. 2006, 209, 637–654. [Google Scholar] [CrossRef]
  21. Kesterke, M.J.; Raffensperger, Z.D.; Heike, C.L.; Cunningham, M.L.; Hecht, J.T.; Kau, C.H.; Nidey, N.L.; Moreno, L.M.; Wehby, G.L.; Marazita, M.L.; et al. Using the 3D Facial Norms Database to Investigate Craniofacial Sexual Dimorphism in Healthy Children, Adolescents, and Adults. Biol. Sex. Differ. 2016, 7, 23. [Google Scholar] [CrossRef]
  22. Ferrario, V.F.; Sforza, C.; Poggio, C.E.; Schmitz, J.H. Craniofacial Growth: A Three-Dimensional Soft-Tissue Study from 6 Years to Adulthood. J. Craniofac. Genet. Dev. Biol. 1998, 18, 138–149. [Google Scholar]
  23. Koudelová, J.; Brůžek, J.; Cagáňová, V.; Krajíček, V.; Velemínská, J. Development of Facial Sexual Dimorphism in Children Aged between 12 and 15 Years: A Three-Dimensional Longitudinal Study. Orthod. Craniofac. Res. 2015, 18, 175–184. [Google Scholar] [CrossRef] [PubMed]
  24. ANSI/ASB Standard 0090; Standard for Sex Estimation in Forensic Anthropology. AFS Standards Board, LLC: Colorado Springs, CO, USA, 2019.
  25. ANSI/ASB Standard 132; Standard for Population Affinity Estimation in Forensic Anthropology. AFS Standards Board, LLC: Colorado Springs, CO, USA, 2023.
  26. Cameron, N. Assessment of Maturation. In Human Growth and Development, 2nd ed.; Cameron, N., Bogin, B., Eds.; Academic Press: Cambridge, MA, USA, 2012; pp. 515–535. ISBN 978-0-12-383882-7. [Google Scholar]
  27. Christensen, A.M.; Passalacqua, N.V.; Bartelink, E.J. Age Estimation. In Forensic Anthropology, 2nd ed.; Christensen, A.M., Passalacqua, N.V., Bartelink, E.J., Eds.; Academic Press: Cambridge, MA, USA, 2019; pp. 307–349. ISBN 978-0-12-815734-3. [Google Scholar]
  28. Beunen, G.P.; Rogol, A.D.; Malina, R.M. Indicators of Biological Maturation and Secular Changes in Biological Maturation. Food Nutr. Bull. 2006, 27, S244–S256. [Google Scholar] [CrossRef]
  29. Marshall, W.A.; Tanner, J.M. Variations in Pattern of Pubertal Changes in Girls. Arch. Dis. Child. 1969, 44, 291–303. [Google Scholar] [CrossRef] [PubMed]
  30. Marshall, W.A.; Tanner, J.M. Variations in the Pattern of Pubertal Changes in Boys. Arch. Dis. Child. 1970, 45, 13–23. [Google Scholar] [CrossRef] [PubMed]
  31. Cameron, N. Can Maturity Indicators Be Used to Estimate Chronological Age in Children? Ann. Hum. Biol. 2015, 42, 302–307. [Google Scholar] [CrossRef]
  32. Ellis, B.J. Timing of Pubertal Maturation in Girls: An Integrated Life History Approach. Psychol. Bull. 2004, 130, 920–958. [Google Scholar] [CrossRef]
  33. Demirjian, A.; Goldstein, H.; Tanner, J.M. A New System of Dental Age Assessment. Hum. Biol. 1973, 45, 211–227. [Google Scholar]
  34. Langley-Shirley, N.; Jantz, R.L. A Bayesian Approach to Age Estimation in Modern Americans from the Clavicle. J. Forensic Sci. 2010, 55, 571–583. [Google Scholar] [CrossRef]
  35. Asad, A.L.; Anteby, M.; Garip, F. Who Donates Their Bodies to Science? The Combined Role of Gender and Migration Status among California Whole-Body Donors. Soc. Sci. Med. 2014, 106, 53–58. [Google Scholar] [CrossRef]
  36. Boulware, L.E.; Ratner, L.E.; Cooper, L.A.; LaVeist, T.A.; Powe, N.R. Whole Body Donation for Medical Science: A Population-Based Study. Clin. Anat. 2004, 17, 570–577. [Google Scholar] [CrossRef]
  37. Go, M.; Yukyi, N.; Chu, E. On WEIRD Anthropologists and Their White Skeletons. Forensic Anthropol. 2021, 4, 283–298. [Google Scholar] [CrossRef]
  38. Hughes, C.E.; Juarez, C.; Yim, A.-D. Forensic Anthropology Casework Performance: Assessing Accuracy and Trends for Biological Profile Estimates on a Comprehensive Sample of Identified Decedent Cases. J. Forensic Sci. 2021, 66, 1602–1616. [Google Scholar] [CrossRef]
  39. Winburn, A.P.; Algee-Hewitt, B. Evaluating Population Affinity Estimates in Forensic Anthropology: Insights from the Forensic Anthropology Database for Assessing Methods Accuracy (FADAMA). J. Forensic Sci. 2021, 66, 1210–1219. [Google Scholar] [CrossRef] [PubMed]
  40. Albanese, J. Identified Skeletal Reference Collections and the Study of Human Variation. Ph.D. Dissertation, McMaster University, Hamilton, ON, Canada, 2003. [Google Scholar]
  41. Stull, K.E.; Corron, L.K. The Subadult Virtual Anthropology Database (SVAD): An Accessible Repository of Contemporary Subadult Reference Data. Forensic Sci. 2022, 2, 20–36. [Google Scholar] [CrossRef]
  42. Alonzo, S.H.; Kindsvater, H.K. Life-History Patterns. In Encyclopedia of Ecology; Jørgensen, S.E., Fath, B.D., Eds.; Academic Press: Cambridge, MA, USA, 2008; pp. 2175–2180. ISBN 978-0-08-045405-4. [Google Scholar]
  43. Hill, K. Life History Theory and Evolutionary Anthropology. Evol. Anthropol. Issues News Rev. 1993, 2, 78–88. [Google Scholar] [CrossRef]
  44. Kuzawa, C.W.; Bragg, J.M. Plasticity in Human Life History Strategy: Implications for Contemporary Human Variation and the Evolution of Genus Homo. Curr. Anthropol. 2012, 53, s369–s382. [Google Scholar] [CrossRef]
  45. Mace, R. Evolutionary Ecology of Human Life History. Anim. Behav. 2000, 59, 1–10. [Google Scholar] [CrossRef]
  46. Stearns, S.C. The Evolution of Life Histories; Oxford University Press: Oxford, UK, 1992; ISBN 978-0-19-857741-6. [Google Scholar]
  47. Gadgil, M.; Bossert, W.H. Life Historical Consequences of Natural Selection. Am. Nat. 1970, 104, 1–24. [Google Scholar] [CrossRef]
  48. Bogin, B. Patterns of Human Growth, 3rd ed.; Cambridge Studies in Biological and Evolutionary Anthropology; Cambridge University Press: Cambridge, UK, 2020; ISBN 978-1-108-43448-5. [Google Scholar]
  49. Ellison, P.T.; Reiches, M.W.; Shattuck-Faegre, H.; Breakey, A.; Konecna, M.; Urlacher, S.; Wobber, V. Puberty as a Life History Transition. Ann. Hum. Biol. 2012, 39, 352–360. [Google Scholar] [CrossRef]
  50. Tanner, J.M. Growth and Maturation during Adolescence. Nutr. Rev. 1981, 39, 43–55. [Google Scholar] [CrossRef] [PubMed]
  51. Abbassi, V. Growth and Normal Puberty. Pediatrics 1998, 102, 507–511. [Google Scholar] [CrossRef]
  52. Gårdstedt-Berghog, J.; Niklasson, A.; Sjöberg, A.; Aronson, A.S.; Pivodic, A.; Nierop, A.F.M.; Albertsson-Wikland, K.; Holmgren, A. Timing of Menarche and Pubertal Growth Patterns Using the QEPS Growth Model. Front. Pediatr. 2024, 12, 1438042. [Google Scholar] [CrossRef]
  53. Stull, K.E.; Wolfe, C.A.; Corron, L.K.; Heim, K.; Hulse, C.N.; Pilloud, M.A. A Comparison of Subadult Skeletal and Dental Development Based on Living and Deceased Samples. Am. J. Phys. Anthropol. 2021, 175, 36–58. [Google Scholar] [CrossRef]
  54. Berry, S.D.; Edgar, H.J. Announcement: The New Mexico Decedent Image Database. Forensic Imaging 2021, 24, 200436. [Google Scholar] [CrossRef]
  55. Stull, K.; Corron, L. Subadult Virtual Anthropology Database (SVAD) Data Collection Protocol: Amira; Zenodo: Geneva, Switzerland, 2021. [Google Scholar] [CrossRef]
  56. Stock, M.K.; Garvin, H.M.; Corron, L.K.; Hulse, C.N.; Cirillo, L.E.; Klales, A.R.; Colman, K.L.; Stull, K.E. The Importance of Processing Procedures and Threshold Values in CT Scan Segmentation of Skeletal Elements: An Example Using the Immature Os Coxa. Forensic Sci. Int. 2020, 309, 110232. [Google Scholar] [CrossRef] [PubMed]
  57. Sellen, D.W. Evolution of Infant and Young Child Feeding: Implications for Contemporary Public Health. Annu. Rev. Nutr. 2007, 27, 123–148. [Google Scholar] [CrossRef]
  58. AlQahtani, S.J.; Hector, M.P.; Liversidge, H.M. Brief Communication: The London Atlas of Human Tooth Development and Eruption. Am. J. Phys. Anthr. 2010, 142, 481–490. [Google Scholar] [CrossRef]
  59. Hägg, U.; Taranger, J. Skeletal Stages of the Hand and Wrist as Indicators of the Pubertal Growth Spurt. Acta Odontol. Scand. 1980, 38, 187–200. [Google Scholar] [CrossRef]
  60. Buehl, C.C.; Pyle, S.I. The Use of Age at First Appearance of Three Ossification Centers in Determining the Skeletal Status of Children. J. Pediatr. 1942, 21, 335–342. [Google Scholar] [CrossRef]
  61. Wheeler, M.D. Physical Changes of Puberty. Endocrinol. Metab. Clin. N. Am. 1991, 20, 1–14. [Google Scholar] [CrossRef]
  62. Stull, K.; Chu, E.; Wolfe, C.; Corron, L. Application of Subadult Age Estimation. In A Visual Atlas of Skeletal Growth and Development; Stull, K., Garvin, H., Eds.; Taylor & Francis Group: Boca Raton, FL, USA, 2025; ISBN 978-1-032-75485-7. [Google Scholar]
  63. Cardoso, H.F.V. Epiphyseal Union at the Innominate and Lower Limb in a Modern Portuguese Skeletal Sample, and Age Estimation in Adolescent and Young Adult Male and Female Skeletons. Am. J. Phys. Anthropol. 2008, 135, 161–170. [Google Scholar] [CrossRef] [PubMed]
  64. Coqueugniot, H.; Weaver, T.; Houët, F. Brief Communication: A Probabilistic Approach to Age Estimation from Infracranial Sequences of Maturation. Am. J. Phys. Anthropol. 2010, 142, 655–664. [Google Scholar] [CrossRef]
  65. Schaefer, M.C. A Summary of Epiphyseal Union Timings in Bosnian Males. Int. J. Osteoarchaeol. 2008, 18, 536–545. [Google Scholar] [CrossRef]
  66. Webb, P.A.O.; Suchey, J.M. Epiphyseal Union of the Anterior Iliac Crest and Medial Clavicle in a Modern Multiracial Sample of American Males and Females. Am. J. Phys. Anthropol. 1985, 68, 457–466. [Google Scholar] [CrossRef]
  67. Thabtah, F.; Hammoud, S.; Kamalov, F.; Gonsalves, A. Data Imbalance in Classification: Experimental Evaluation. Inf. Sci. 2020, 513, 429–441. [Google Scholar] [CrossRef]
  68. Spradley, M.K.; Wolfe, C.A.; Stull, K.E.; Chu, E.Y.; Broehl, K.A.; Vlemincq-Mendieta, T.; Pilloud, M.A.; Scott, G.R.; Corron, L.K. Subadult Virtual Anthropology Database (SVAD) Data Collection Protocol: Cranial Landmarks and Craniometrics; Zenodo: Geneva, Switzerland, 2021. [Google Scholar]
  69. Langley, N.; Jantz, L.; Ousley, S.; Jantz, R.; Milner, G. Data Collection Procedures for Forensic Skeletal Material 2.0; Department of Anthropology, The University of Tennessee: Knoxville, TN, USA, 2016. [Google Scholar]
  70. Moore-Jansen, P.; Ousley, S.; Jantz, R. Data Collection Procedures for Forensic Skeletal Material; Department of Anthropology, The University of Tennessee: Knoxville, TN, USA, 1994. [Google Scholar]
  71. Corron, L.K.; Broehl, K.A.; Chu, E.Y.; Vlemincq-Mendieta, T.; Wolfe, C.A.; Pilloud, M.A.; Scott, G.R.; Spradley, M.K.; Stull, K.E. Agreement and Error Rates Associated with Standardized Data Collection Protocols for Skeletal and Dental Data on 3D Virtual Subadult Crania. Forensic Sci. Int. 2022, 334, 111272. [Google Scholar] [CrossRef]
  72. Barbeito-Andrés, J.; Anzelmo, M.; Ventrice, F.; Sardi, M.L. Measurement Error of 3D Cranial Landmarks of an Ontogenetic Sample Using Computed Tomography. J. Oral. Biol. Craniofacial Res. 2012, 2, 77–82. [Google Scholar] [CrossRef]
  73. Colman, K.L.; de Boer, H.H.; Dobbe, J.G.G.; Liberton, N.P.T.J.; Stull, K.E.; van Eijnatten, M.; Streekstra, G.J.; Oostra, R.-J.; van Rijn, R.R.; van der Merwe, A.E. Virtual Forensic Anthropology: The Accuracy of Osteometric Analysis of 3D Bone Models Derived from Clinical Computed Tomography (CT) Scans. Forensic Sci. Int. 2019, 304, 109963. [Google Scholar] [CrossRef] [PubMed]
  74. Kuhn, M. Building Predictive Models in R Using the caret Package. J. Stat. Softw. 2008, 28, 1–26. [Google Scholar] [CrossRef]
  75. R Core Team. R: A Language and Environment for Statistical Computing, R version 4.5.0 (2025-04-11); R Core Team: Vienna, Austria, 2024. [Google Scholar]
  76. Roever, C.; Raabe, N.; Leubke, K.; Ligges, U.; Szepannek, G.; Zentgraf, M. klaR: Classification and Visualization 2013. Version 1.7-3. Available online: http://cran.r-project.org/web/packages/klaR/klaR.pdf (accessed on 13 August 2025).
  77. Wolfe, C.A.; Stull, K.E. ChristopherAWolfe/Stulletal2025_ForensicScience: Code Compendium (Version v1.0.0). 2025. Available online: https://zenodo.org/records/15741672 (accessed on 13 August 2025). [CrossRef]
  78. Baughan, B.; Demirjian, A. Sexual Dimorphism in the Growth of the Cranium. Am. J. Phys. Anthropol. 1978, 49, 383–390. [Google Scholar] [CrossRef]
  79. Hardin, A.M.; Knigge, R.P.; Oh, H.S.; Valiathan, M.; Duren, D.L.; McNulty, K.P.; Middleton, K.M.; Sherwood, R.J. Estimating Craniofacial Growth Cessation: Comparison of Asymptote- and Rate-Based Methods. Cleft Palate. Craniofac. J. 2022, 59, 230–238. [Google Scholar] [CrossRef]
  80. Humphrey, L.T. Growth Patterns in the Modern Human Skeleton. Am. J. Phys. Anthropol. 1998, 105, 57–72. [Google Scholar] [CrossRef]
  81. Bulygina, E.; Mitteroecker, P.; Aiello, L. Ontogeny of Facial Dimorphism and Patterns of Individual Development within One Human Population. Am. J. Phys. Anthropol. 2006, 131, 432–443. [Google Scholar] [CrossRef]
  82. Enlow, D. Facial Growth, 3rd ed.; W.B. Saunders: Philadelphia, PA, USA, 1990. [Google Scholar]
  83. Forsberg, C.-M.; Eliasson, S.; Westergren, H. Face Height and Tooth Eruption in Adults—A 20-Year Follow-up Investigation. Eur. J. Orthod. 1991, 13, 249–254. [Google Scholar] [CrossRef]
  84. Ross, A.H.; Williams, S.E. Craniofacial Growth, Maturation, and Change: Teens to Midadulthood. J. Craniofac. Surg. 2010, 21, 458. [Google Scholar] [CrossRef] [PubMed]
  85. Bogin, B. Patterns of Human Growth; Cambridge University Press: Cambridge, MA, USA, 1999; Volume 2. [Google Scholar]
  86. Kuzawa, C.W.; Chugani, H.T.; Grossman, L.I.; Lipovich, L.; Muzik, O.; Hof, P.R.; Wildman, D.E.; Sherwood, C.C.; Leonard, W.R.; Lange, N. Metabolic Costs and Evolutionary Implications of Human Brain Development. Proc. Natl. Acad. Sci. USA 2014, 111, 13010–13015. [Google Scholar] [CrossRef] [PubMed]
  87. Spradley, M.; Jantz, R. Sex Estimation in Forensic Anthropology: Skull versus Postcranial Elements. J. Forensic Sci. 2011, 56, 289–296. [Google Scholar] [CrossRef]
  88. Konigsberg, L.W.; Hens, S.M. Use of Ordinal Categorical Variables in Skeletal Assessment of Sex from the Cranium. Am. J. Phys. Anthropol. 1998, 107, 97–112. [Google Scholar] [CrossRef]
  89. Pilmann Kotěrová, A.; Santos, F.; Bejdová, Š.; Rmoutilová, R.; Attia, M.H.; Habiba, A.; Velemínská, J.; Brůžek, J. Prioritizing a High Posterior Probability Threshold Leading to Low Error Rate over High Classification Accuracy: The Validity of MorphoPASSE Software for Cranial Morphological Sex Estimation in a Contemporary Population. Int. J. Legal Med. 2024, 138, 1759–1768. [Google Scholar] [CrossRef] [PubMed]
  90. Walker, P.L. Sexing Skulls Using Discriminant Function Analysis of Visually Assessed Traits. Am. J. Phys. Anthropol. 2008, 136, 39–50. [Google Scholar] [CrossRef] [PubMed]
  91. Auchter, L.E.; Stull, K. Development and Validation of a Subadult Sex Estimation Method Using Pelvic Metrics. Forensic Anthropol. 2025, 8, 19–35. [Google Scholar] [CrossRef]
  92. Sanchez, J.; Hoppa, R. Is Adulthood Required? Examining the Accuracy of Pelvic Sex Estimation Throughout Pubertal Growth. Bioarchaeology Int. 2022, 7, 173–188. [Google Scholar] [CrossRef]
  93. Eveleth, P.; Tanner, J. Worldwide Variation in Human Growth, 2nd ed.; Cambridge University Press: Cambridge, MA, USA, 1990. [Google Scholar]
  94. Del Bove, A.; Menéndez, L.; Manzi, G.; Moggi-Cecchi, J.; Lorenzo, C.; Profico, A. Mapping Sexual Dimorphism Signal in the Human Cranium. Sci. Rep. 2023, 13, 16847. [Google Scholar] [CrossRef]
  95. Jantz, R.L.; Ousley, S.D. FORDISC 3: Computerized Forensic Discriminant Functions. Version 3.1; The University of Tennessee: Knoxville, TN, USA, 2005. [Google Scholar]
  96. Scott, S.; Jantz, R.L. Survivability versus Rate of Recovery for Skeletal Elements in Forensic Anthropology. J. Forensic Sci. 2022, 67, 1758–1765. [Google Scholar] [CrossRef] [PubMed]
  97. Biro, F.M.; Pajak, A.; Wolff, M.S.; Pinney, S.M.; Windham, G.C.; Galvez, M.P.; Greenspan, L.C.; Kushi, L.H.; Teitelbaum, S.L. Age of Menarche in a Longitudinal US Cohort. J. Pediatr. Adolesc. Gynecol. 2018, 31, 339–345. [Google Scholar] [CrossRef]
  98. Marshall, W.A. Interrelationships of Skeletal Maturation, Sexual Development and Somatic Growth in Man. Ann. Hum. Biol. 1974, 1, 29–40. [Google Scholar] [CrossRef]
  99. Sanders, J.O.; Qiu, X.; Lu, X.; Duren, D.L.; Liu, R.W.; Dang, D.; Menendez, M.E.; Hans, S.D.; Weber, D.R.; Cooperman, D.R. The Uniform Pattern of Growth and Skeletal Maturation during the Human Adolescent Growth Spurt. Sci. Rep. 2017, 7, 16705. [Google Scholar] [CrossRef]
  100. Gonzalez, P.N.; Perez, S.I.; Bernal, V. Ontogeny of Robusticity of Craniofacial Traits in Modern Humans: A Study of South American Populations. Am. J. Phys. Anthr. 2010, 142, 367–379. [Google Scholar] [CrossRef]
  101. Ackermann, R.R.; Krovitz, G.E. Common Patterns of Facial Ontogeny in the Hominid Lineage. Anat. Rec. 2002, 269, 142–147. [Google Scholar] [CrossRef] [PubMed]
  102. Stull, K.; Chu, E.; Corron, L. From Subadult to Adult: The Expression of Cranial Macromorphoscopic Traits through Ontogeny. In Proceedings of the 71st Annual Meeting of the American Academy of Forensic Sciences, Seattle, WA, USA, 21–25 February 2022. [Google Scholar]
  103. Wood, C. The Influence of Growth and Development in the Expression of Human Morphological Variation. Ph.D. Thesis, University of Toronto, Toronto, ON, Canada, 2013. [Google Scholar]
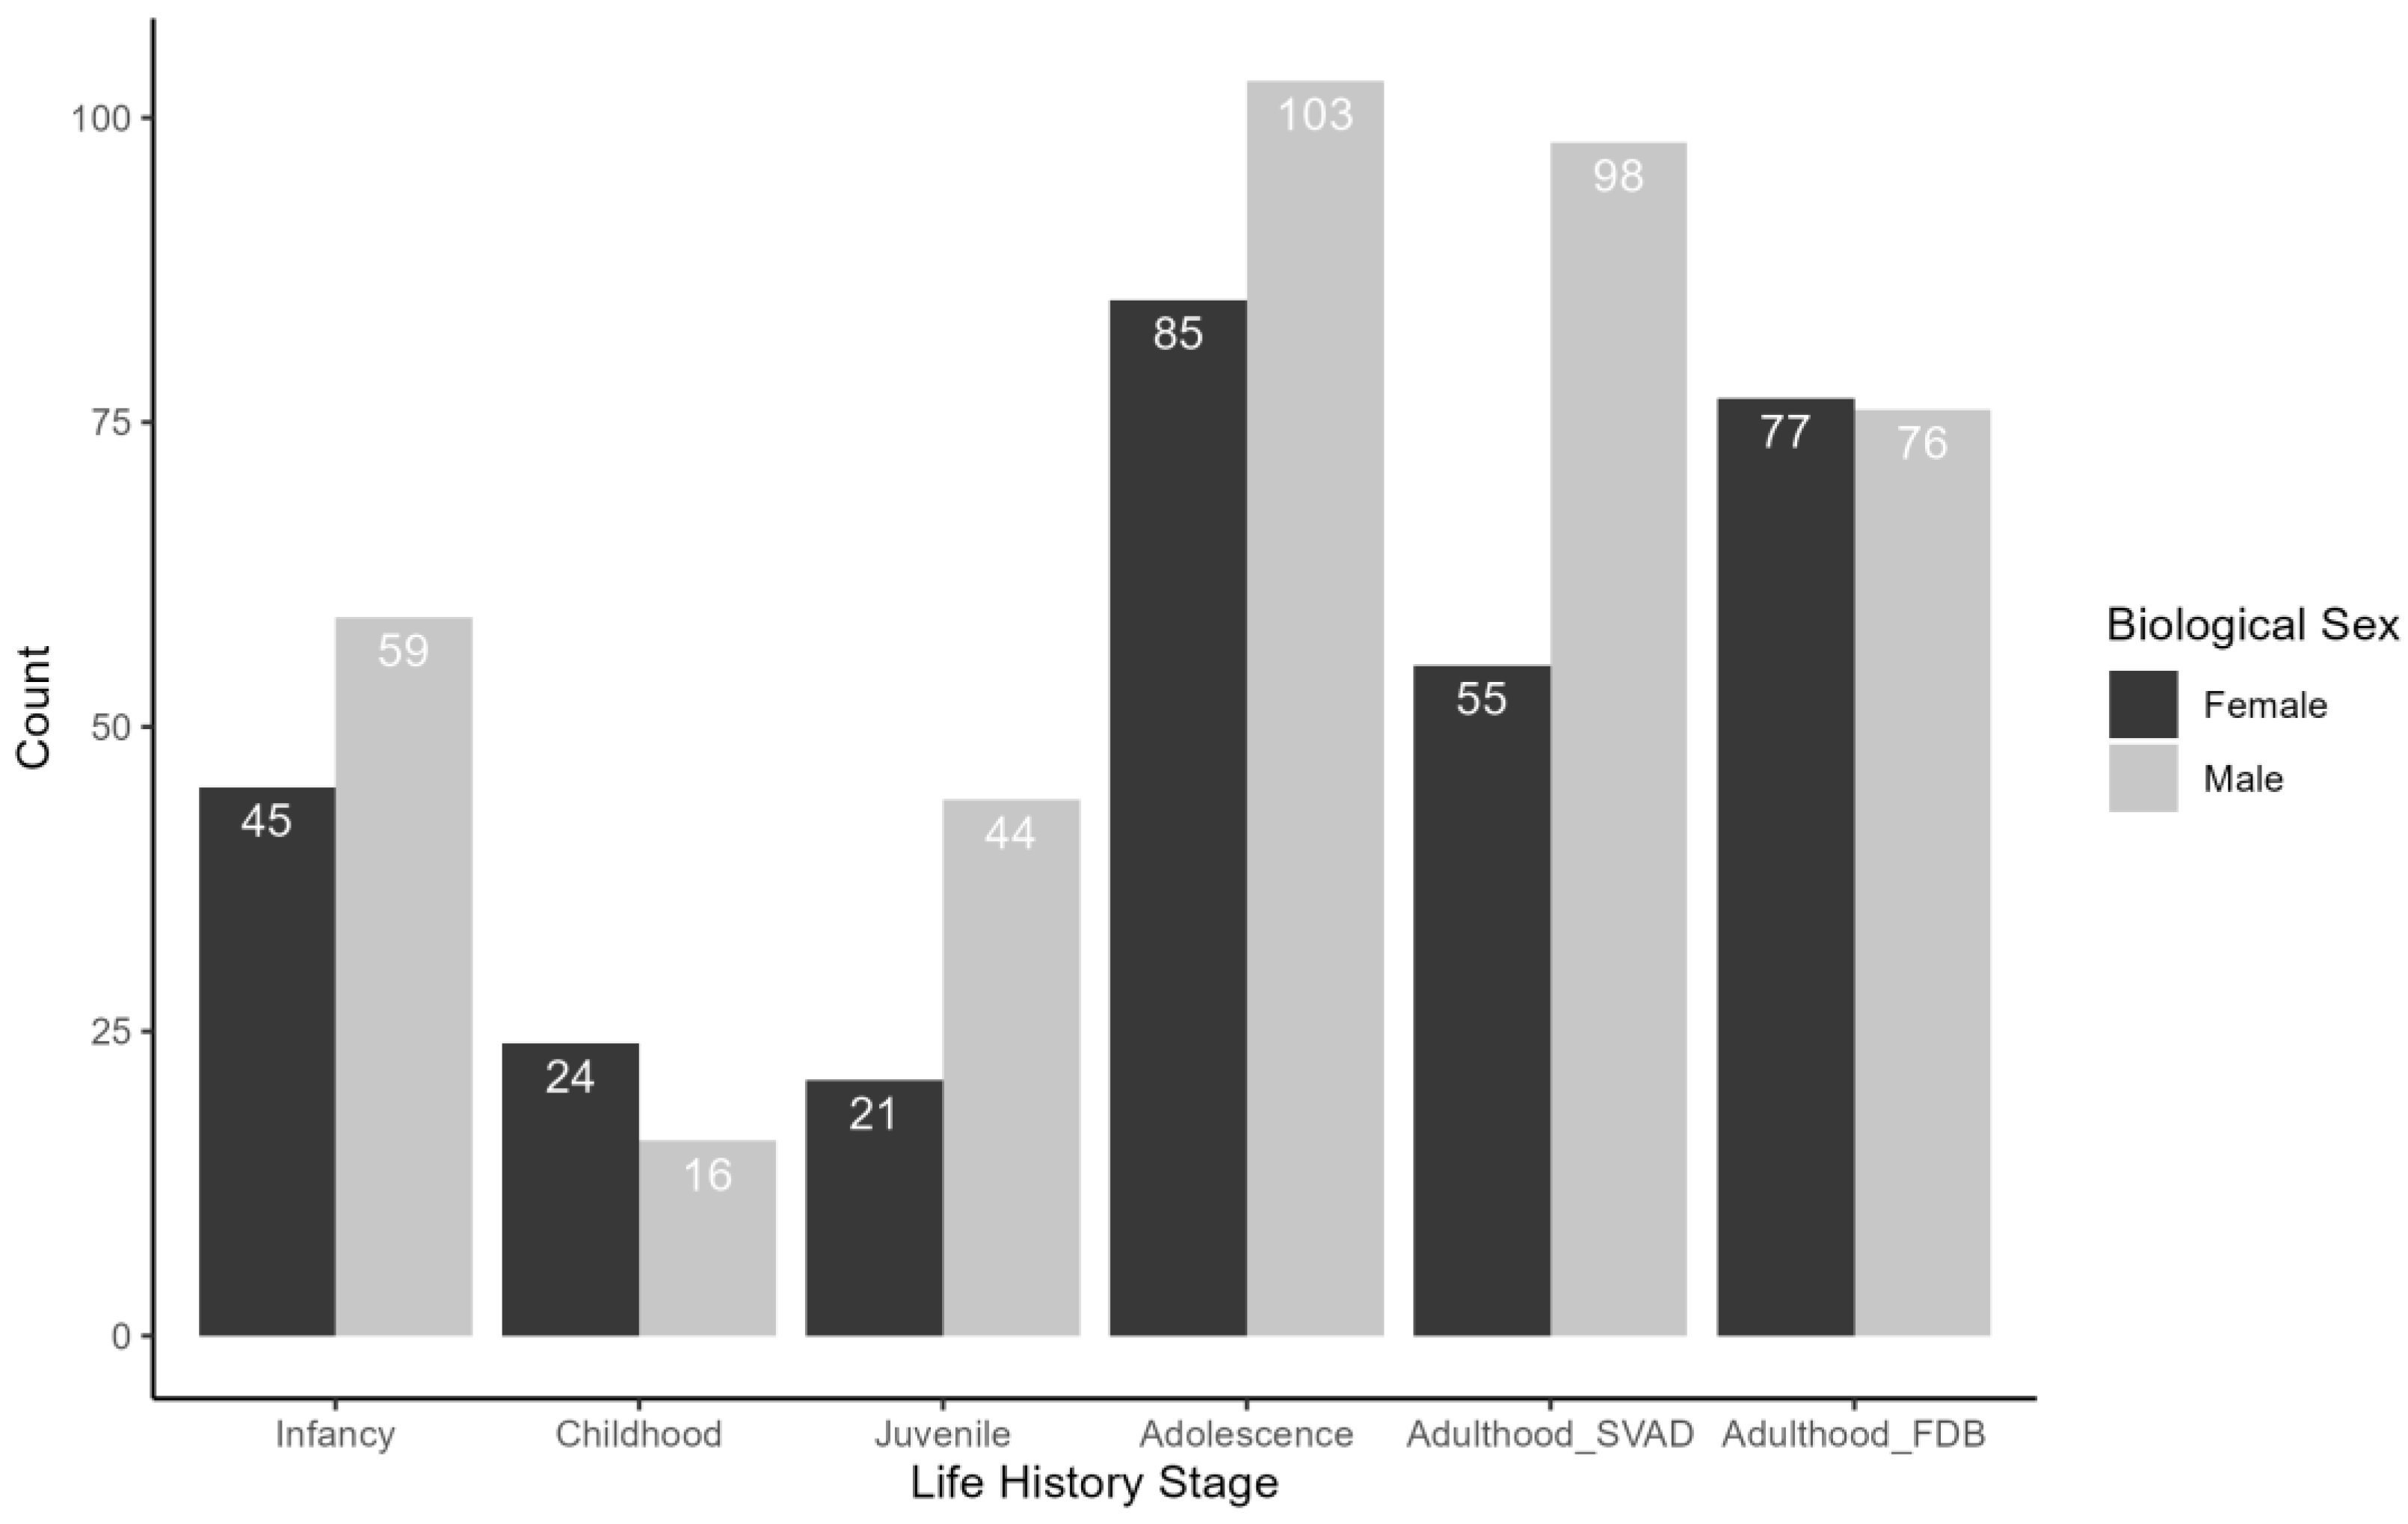
Figure 1. Number of individuals separated by developmentally derived life history stage and biological sex. The FDB sample is downsized in this visualization.
Forensicsci 05 00043 g001
Figure 2. The SVAD sample categorized by life history stage based on developmental indicators (top row) and chronological age (bottom row) and faceted by sex.
Forensicsci 05 00043 g002
Figure 3. Patterns of multivariate cranial variation across life history stages in the SVAD sample visualized across the first two dimensions of the LDA (CV1 and CV2). Dashed ellipses correspond to 95% range of variation for a given life history stage.
Forensicsci 05 00043 g003
Figure 4. Patterns of multivariate cranial variation across life history stages in the SVAD sample visualized across the first two dimensions of the LDA (CV1 and CV2). Dashed ellipses correspond to 95% range of variation for a given life history stage.
Forensicsci 05 00043 g004
Figure 5. Correct classification accuracy across all models. SVAD ALL = all individuals across all LH stages from the SVAD sample, INF = infancy LH stage, CHILD = childhood LH stage, JUV = juvenile LH stage, ADOL = adolescence LH stage, ADULT = SVAD adulthood LH stage, ADOL + ADULT = adolescence and adult LH stages from SVAD, FDB = Forensic Data Bank adulthood, and FDB + SVAD combines adolescence (SVAD), SVAD adulthood, and FDB adulthood.
Forensicsci 05 00043 g005
Figure 6. Correct and incorrect classifications visualized for the adolescence model (A,B) and SVAD adolescence and adulthood combined model (C,D). Both models are presented by histograms (A,C) and density plots (B,D) and faceted by sex.
Forensicsci 05 00043 g006
Figure 7. The SVAD sample distribution by developmentally derived LH stages and chronologically derived LH stages when using the second molar and a stage of ‘Root Complete’.
Forensicsci 05 00043 g007
Figure 8. Exploration of the multivariate phenotype of individuals with a M2 with root completion but are developmentally considered juveniles. The seven individuals are highlighted; triangles indicate females, and circles indicate males. The black arrow points to the second-oldest adolescent male (14.9 years) out of the seven, but also the only individual that is phenotypically most like juveniles.
Forensicsci 05 00043 g008
Table 1. Each life history (LH) stage has associated chronological ages and developmental milestones. The specific skeletal and dental criteria used to determine the developmentally derived LH stages are included. As a point of comparison, the chronological ages of the SVAD sample are also included. M = Male and F = Female.
Chronologically Derived Age RangesDevelopmental CriteriaDevelopmentally Derived Age Ranges
(with Means per Sex)
Infancy<3 yearsFirst molars ≤ crown complete0–3.45 years
mean F = 1.32 years
mean M = 1.56 years
Childhood3–6.99 yearsFirst molars > crown complete and
First molars ≤ root 1/2
2–6 years
mean F = 4.24 years
mean M = 4.26 years
Juvenile7–10.99 years (females);
7–12.99 years (males
First molars ≥ root 3/4 and Iliac crest epiphysis is absent5 to 15 years
mean F = 9.14 years
mean M = 10.6 years
Adolescence11–17.99 years (females);
13–17.99 years (males)
Iliac crest epiphysis is present and unfused or fusing11–20 years
mean F = 16.8 years
mean M = 16.5 years
Adulthood—SVAD18+Iliac crest is fused or the proximal humerus epiphysis is fused15–20 years
mean F = 19.3 years
mean M = 19.3 years
Adulthood—FDB18+No developmental data available20–96 years
mean F = 58.0 years
mean M = 56.2 years
Table 2. Cranial interlandmark distance (ILD) names, abbreviations, and definitions.
ILDAbbreviationDefinitions
Nasal HeightNLHNasion to most inferior nasal border (L)
Nasion-Prosthion HeightNPHNasion to prosthion
Nasal BreadthNLBAlare (L) to alare (R)
Orbital HeightOBHOrbit height inferior (R) to orbit height superior (R)
Orbital BreadthOBBDacryon (R) to ectoconchion (R)
Interorbital BreadthDKBDacryon (L) to dacryon (R)
Biorbital BreadthEKBEctoconchion (L) to ectoconchion (R)
Bifrontal BreadthFMBFrontomalare anterior (L) to frontomalare anterior (R)
Bizygomatic BreadthZYBZygion (L) to zygion (R)
Bijugal BreadthJUBJugale (L) to jugale (R)
Maximum Cranial LengthGOLGlabella to opisthocranion
Nasio-occipital LengthNOLNasion to opisthocranion
Mastoid HeightMDHPorion (R) to mastoideale (R)
Maximum Cranial BreadthXCBEuryon (L) to euryon (R)
Minimum Frontal BreadthWFBFrontotemporale (L) to frontotemporale (R)
Frontal ChordFRCNasion to bregma
Parietal ChordPACBregma to lambda
Occipital ChordOCCLambda to opisthion
Biauricular BreadthAUBRadiculare (L) to radiculare (R)
Biasterionic BreadthASBAsterion (L) to asterion (R)
Foramen Magnum LengthFOLBasion to opisthion
Foramen Magnum BreadthFOBForamen magnum breadth (L) to foramen magnum breadth (R)
Cranial Base LengthBNLBasion to nasion
Basion-Bregma HeightBBHBasion to bregma
Basion-Prosthion LengthBPLBasion to prosthion
Table 3. Mahalanobis distances between group centroids of LH stages in the SVAD sample.
InfancyChildhoodJuvenileAdolescenceAdulthood SVAD
Infancy0.0003.0785.0735.5595.958
Childhood3.0780.0003.7355.0325.156
Juvenile5.0733.7350.0002.3303.584
Adolescence5.5595.0322.3300.0000.489
Adulthood SVAD5.9585.1563.5840.4890.000
Table 4. Confusion matrix of the LDA classification into LH stages for the SVAD sample.
Actual
PredictedInfancyChildhoodJuvenileAdolescenceAdulthood SVAD
Infancy 878000
Childhood 1731800
Juvenile 014533
Adolescence 001112881
Adulthood SVAD 0015769
Table 5. Mahalanobis distances between group centroids of LH stages in the SVAD and FDB samples.
InfancyChildhoodJuvenileAdolescenceAdulthood SVADAdulthood FDB
Infancy 0.0003.2755.7156.7577.1957.472
Childhood 3.2750.0003.9455.6875.8806.431
Juvenile 5.7153.9450.0002.3883.6345.172
Adolescence 6.7575.6872.3880.0000.4693.091
Adulthood SVAD 7.1955.8803.6340.4690.0003.054
Adulthood FDB 7.4726.4315.1723.0913.0540.000
Table 6. Confusion matrix of the LDA classification into LH stages with FDB.
Actual
PredictedInfancyChildhoodJuvenileAdolescenceAdulthood SVADAdulthood FDB
Infancy9070000
Childhood14328000
Juvenile0141141
Adolescence00141197419
Adulthood SVAD001495410
Adulthood FDB0011921123
Table 7. The stepwise selected models for sex estimation in each LH subset, along with the associated classification accuracy and the 95% confidence interval (CI).
ModelsBest Performing ModelLeave-One-Out Classification Accuracy95% CI
Infancyy ~ WFB + AUB + ASB + FRC + PAC0.5670.467–0.664
Childhoody ~ GOL + NOL + BNL + BBH + XCB + ZYB + BPL + NLB + OCC + FOL0.6000.433–0.751
Juveniley ~ BNL + ZYB + AUB + BPL0.6620.534–0.774
Adolescencey ~ BNL + XCB + WFB + ZYB + ASB + OBH_L + DKB + FRC + FOL0.8300.768–0.881
Adulthood SVADy ~ GOL + BNL + BBH + ZYB + ASB + DKB0.8890.828–0.934
Adulthood FDBy ~ GOL + NOL + BNL + BBH + WFB + ZYB + DKB + FOL0.8690.805–0.918
Table 8. Confusion matrix for the SVAD sample when estimating biological sex within each LH stage.
Actual
PredictedInfancyChildhoodJuvenileAdolescenceAdulthood SVADAdulthood FDB
SexFMFMFFFMFMFM
F16161686771184686710
M294388153714859901066
Table 9. Confusion matrix for the combined SVAD and FDB samples when estimating biological sex in the adolescence and adulthood LH stages.
Actual
PredictedAdolescence and Adulthood SVADAdolescence (SVAD) and Adulthood (SVAD and FDB)
SexFMFM
F1182118631
M2218031246
Disclaimer/Publisher’s Note: The statements, opinions and data contained in all publications are solely those of the individual author(s) and contributor(s) and not of MDPI and/or the editor(s). MDPI and/or the editor(s) disclaim responsibility for any injury to people or property resulting from any ideas, methods, instructions or products referred to in the content.