Abstract
Lithium is used as a medication in the treatment of bipolar disorder. Lithium has a narrow therapeutic index, and fatal intoxications have been described. The therapeutic drug monitoring of lithium is routinely performed in serum. Serum is commonly unavailable in forensic postmortem analysis, where whole blood is the matrix of choice. In this study, an inductively coupled plasma mass spectrometry (ICP-MS) method was developed and validated for the quantification of lithium in postmortem whole blood. Sample preparation consisted of a 100-fold dilution with acid and required only 40 µL of blood. Carry-over was deemed appropriately reduced with a rinse solution containing 5% hydrochloric acid. A nebulizer gas flow rate of 1.15 L/min showed a sufficient improvement of lithium sensitivity while simultaneously minimizing the background. Germanium was determined to be the most optimal internal standard. The method was validated in terms of linearity, accuracy, precision, and lower limit of quantification. Linearity was demonstrated within the analytical measurement range of 0.10–1.5 mmol/L. The method showed acceptable precision and accuracy, with a total coefficient of a variation ≤2.3% and accuracies ranging from 105 to 108% at all concentrations in the quality control samples. The final method was applied to postmortem blood from 103 consecutive autopsy cases and demonstrated robustness by low intermediate precision and high and consistent recovery of the internal standard.
1. Introduction
Lithium is used as a medication in the treatment of bipolar disorder, and it is estimated that roughly 2% of the adult population suffer from the disorder [1]. In Denmark, lithium is the drug of choice for the treatment of bipolar disorder [2]. Additionally, patients diagnosed with bipolar disorder comprise 2.3–9.6% of all suicidal deaths and have an increased suicide rate of more than 20-fold compared to the general population [3]. In 1949, lithium carbonate was recognized as an effective treatment of mania, which resulted in a significant improvement in the lives of patients suffering from bipolar disorder [4].
As the therapeutic index is narrow, serum lithium concentrations are routinely monitored to keep values within the therapeutic range. The physiological serum concentration of lithium is 0.0001–0.0003 mmol/L [5]. The therapeutic interval of lithium in serum is 0.6–1.2 mmol/L [6], while deaths have been reported at 1.5 mmol/L in postmortem femoral blood [3].
According to Ott et al., the incidence of lithium toxicity (serum concentration ≥ 1.5 mmol/L) for patients treated with lithium was expected to be 1/100 patients per year [7]. Acute toxicity causes gastrointestinal and neurological symptoms such as nausea, diarrhea, vomiting, sedation, ataxia, stupor, seizures, and coma [4,5]. Additionally, lithium can cause long-term renal, thyroid, and parathyroid complications [8]. Lithium is known to have interactions with many drugs, leading to an increased risk of toxicity [9].
Therapeutic drug monitoring for lithium is typically performed with ion selective electrodes, atomic absorption spectrometry, or flame emission photometry [6,10]. In general, inductively coupled plasma mass spectrometry (ICP-MS) has a lower detection limit and higher specificity compared to the previously mentioned analytical techniques.
ICP-MS is a trace element analysis technique that has seen an increasing adoption in recent decades. The major reason is its ability of rapid multielement determinations at ultra-trace levels [11]. Currently, quantification of lithium by ICP-MS has been reported in plasma and serum, mostly in multielement studies [6,12,13,14,15,16,17,18,19,20,21,22,23]. Therefore, the literature regarding the quantification of lithium in whole blood is scarce. A few studies have reported lithium concentrations in whole blood measured by ICP-MS [19,20,22,23,24,25], but without focus on lithium and therefore lack methodological details on the measurement of this element.
In forensic postmortem analysis, serum and plasma are commonly not available due to hemolysis and therefore whole blood is the matrix of choice. Additionally, the amount of available whole blood extracted at autopsy can be limited. Serum is the most common matrix in published studies, and sample preparations based on acid digestion or acid dilution have been reported. Acid dilution with dilution factors of 10 or 50 were commonly reported [13,14,15,16,19]. A lower dilution factor can increase the risk of complications such as matrix effect or wear and tear on the instrument. As lithium is not bound to plasma proteins [4], sample preparation can be kept to a minimum with a simple precipitation of proteins being sufficient. Sample volumes of 0.3 mL or above have been utilized in published studies [12,13,14,15,16,17,18,19,20,22]. In summary, the development of a method with simple sample preparation and small sample volume requirements is of interest in the field of forensic toxicology.
The present study aimed to develop and validate a simple, robust, and cost-effective ICP-MS method for quantifying lithium in postmortem blood with a small sample volume requirement. The final method was applied to whole blood from 103 consecutive forensic autopsy cases to evaluate intermediate precision and robustness.
2. Materials and Methods
2.1. Chemicals and Reagents
Milli-Q water was obtained from a Millipore Synergy UV water purification system (Merck, Darmstadt, Germany) and used for the preparation of all aqueous solutions. Nitric acid 65% Suprapur®, hydrochloric acid 36% Suprapur®, and sodium chloride for analysis EMSURE® were from Merck (Darmstadt, Germany). Triton X-100 was from Thermo Fisher Scientific (Waltham, MA, USA). A total of 10 µg/mL lithium standard was used for calibration solutions, and 10 µg/mL germanium internal standard, ICP-MS Stock Tuning Solution (10 µg/mL Ce, Co, Li, Tl, Y), and Internal Standard Mix (10 µg/mL Bi, Ge, In, Sc, Tb, Y and 6Li) were from Agilent technologies (Santa Clara, CA, USA). Lithium standard for AAS (1 g/L) used for the quality control samples was from Sigma-Aldrich (Darmstadt, Germany). Potassium chloride ACS grade was from VWR (Radnor, PA, USA).
An external reference material (HK19 Biokemi) in the form of freeze-dried human serum was acquired from the Danish Institute for External Quality Assurance for Laboratories in the health sector (DEKS) (Glostrup, Denmark). Blank human whole blood was acquired from the blood bank at Copenhagen University Hospital, preserved with 1% w/v sodium fluoride and stored at −20 °C until use. Unpreserved whole blood was obtained from three healthy volunteers and pooled in BD Vacutainer No Additive (Z) tubes. No personal data were registered from the volunteers.
2.2. Instrumentation
All experiments were performed on an Agilent 7800 ICP-MS (Agilent Technologies, Santa Clara, CA, USA) equipped with an SPS 4 autosampler. The ICP-MS was equipped with a MicroMist nebulizer, Scott double-pass spray chamber, nickel-tipped sampling cone with a copper base, nickel skimmer cone, and x-lens. The instrument was optimized during startup using a tuning solution for sensitivity and interference levels (CeO+/Ce+ < 1.5% and Ce2+/Ce+ < 1.5%). The instrument was operated in NoGas mode and the instrumental parameters listed in Table 1 were fixed, whereas the remaining parameters were optimized during autotune. The measured elements were 7Li and 72Ge.

Table 1.
ICP-MS instrumental parameters.
2.3. Rinse Program Between Injections
The rinse between every injection was as follows: 10 s 2% nitric acid (autosampler probe rinse), 10 s 5% hydrochloric acid (rinse 1), 15 s 2% nitric acid (autosampler probe rinse), and lastly Intelligent Rinse in 0.05% triton X-100 in 2% nitric acid (rinse 2). The Intelligent Rinse function in the software was enabled with a 7Li-threshold of 2500 CPS and a maximum rinse time of 180 s.
2.4. Solutions
Diluent solution consisted of 10 µg/L germanium internal standard and 0.1% w/v triton X-100 in 2% nitric acid.
The blank solution consisted of 1:1 dilution of 2% nitric acid and diluent solution. The blank solution was measured between every injection of standard and sample solution. The blank solution was also used for blank offset.
Calibration solutions at final concentrations of 0.001, 0.0075, and 0.015 mmol/L were prepared in 2% nitric acid and diluted 1:1 with the diluent solution.
A drift check was included in the analytical series by measuring the highest calibrator (0.015 mmol/L) after every third biological sample to verify signal stability.
2.5. Quality Control Samples
Blank whole blood (QC0) was fortified with lithium to obtain quality control (QC) samples with concentrations of 0.10 (QC1), 0.50 (QC2), and 2.0 mmol/L (QC3), respectively. All QC samples were stored at −70 °C until use.
The external serum reference material (HK19) had a reference lithium concentration of 0.87 mmol/L, which represents a concentration level in the therapeutic range. The freeze-dried material was solubilized according to the manufacturers guidelines and stored at −70 °C until use.
Four of the QC samples (HK19, QC0, QC2, QC3) were included in every routine series with 100-fold dilution except for QC3, which was diluted 200-fold.
2.6. Sample Preparation
A total of 40 µL of whole blood or serum was diluted 100-fold with 1960 µL 2% nitric acid and 2 mL diluent solution. The solution was mixed with a vortex mixer and centrifuged with a g-force of 2000 for 5 min, and the supernatant was analyzed by ICP-MS.
2.7. Method Development
2.7.1. Nebulizer Gas Flow Rate
The 7Li signal was measured during an infusion of a blank solution and a 0.015 mmol/L lithium standard solution. The nebulizer gas flow rate was adjusted from 1.00 to 1.40 L/min by increments of 0.01 L/min and the 7Li signal was recorded at each increment.
2.7.2. Carry-Over (Rinse Solution)
Rinse solutions consisted of Milli-Q water only, 1, 5, and 10% hydrochloric acid. Solutions were prepared by dilution of 36% hydrochloric acid with Milli-Q water. A 0.015 mmol/L lithium standard solution was measured, followed by 10 injections of a blank solution. The rinse between every injection consisted of hydrochloric acid preceded and followed by a probe rinse in 2% nitric acid for 10 s.
2.7.3. Selection of Internal Standard
Internal Standard Mix, containing Bi, Ge, In, Sc, Tb, Y, and 6Li at 10 µg/L, was added to the diluent solution. The analyzed samples were the five QC samples (HK19, QC0, QC1, QC2, QC3) and three authentic postmortem blood case samples with endogenous concentrations of lithium. The QC samples and case samples were analyzed in a random order.
2.7.4. Effect of Sodium and Potassium on Accuracy
Sodium chloride (NaCl) and potassium chloride (KCl) were dissolved separately in 2% nitric acid to obtain intermediate solutions of 0.5 and 0.25% w/v, respectively. These solutions were added separately to the unpreserved pooled whole blood and fortified with either 0.50 or 1.5 mmol/L lithium to obtain final concentrations of 0.075 or 0.15% w/v NaCl and 0.01 or 0.02% w/v KCl. Whole blood without the addition of NaCl or KCl was also included as a control.
2.8. Method Validation
The method was validated according to internal validation guidelines based on SOFT/AAFS Forensic Laboratory Guidelines [26] and Peters et al. [27].
2.8.1. Linearity
Linearity was evaluated by analysis of standard solutions with lithium concentrations of 0, 0.0010, 0.0038, 0.0075, 0.011, and 0.015 mmol/L. These levels correspond to a range of 0.1–1.5 mmol/L in whole blood before a 100-fold dilution. Three solutions at each concentration level were independently prepared and analyzed.
2.8.2. Accuracy, Precision, LLOQ, and Dilution Integrity
The accuracy and precision of the method were investigated with the external serum reference material at 0.87 mmol/L and with QC1, QC2, and QC3 with concentrations of 0.10, 0.50, and 2.0 mmol/L, respectively. Two replicates at each concentration level were analyzed on five different days. Calculations for precision followed Linnet’s method [28] and was expressed as within-run, between-run, and total coefficient of variation (CV). The accuracy was expressed as the percentage of the nominal value. The acceptance criteria for accuracy and precision were ±15%.
A lower limit of quantification (LLOQ) of 0.10 mmol/L was chosen based on the desired measurement range of the method and was confirmed to fulfill criteria for precision and accuracy.
Dilution integrity was determined by the dilution of QC3. Dilution factors of 100, 200, 300, 400, and 500 were employed and each sample was prepared in duplicate.
2.8.3. Accuracy in Postmortem Whole Blood
Accuracy was evaluated in femoral blood from 15 forensic autopsy cases fortified with lithium at 0.50 or 1.5 mmol/L. The case samples were confirmed to contain only endogenous lithium concentrations (<LLOQ) before fortification. One measurement was performed at each lithium concentration. The accuracy was evaluated as the percentage recovery of the fortified concentration.
2.9. Analysis of Whole Blood from 103 Consecutive Autopsy Cases
Lithium was measured in whole blood from 103 consecutive medico-legal autopsy cases from Eastern Denmark received in the period from March to June 2024. Whole blood from the autopsies was preserved in Venosafe sample tubes (VF-109SFX07) containing 100 mg sodium fluoride and 22.5 mg potassium oxalate and stored at −20 °C until analysis.
The case samples were measured across 14 analytical series in duplicates. The acceptance range for the recovery of internal standard was 80–120% relative to the calibration blank.
2.10. Data Analysis
Data were acquired with Agilent MassHunter 5.2 software. Figures were generated in RStudio version 2023.12.1 using R version 4.3.2 and the package ggplot2 version 3.4.2.
3. Results and Discussion
Firstly, the method was optimized concerning nebulizer gas flow rate and carry-over. An appropriate internal standard was determined, and the effect of different concentrations of sodium and potassium on the accuracy was evaluated. Subsequently, the method was validated and applied to a series of authentic autopsy cases.
3.1. Method Development
3.1.1. Nebulizer Gas Flow Rate
The nebulizer gas flow rate can affect the analyte signal in a mass dependent manner, as proposed by Vanhaecke et al. in the “Zone Model” [29]. In the zone model, every nuclide has a zone in the central channel of the plasma where a maximum density of singly charged ions occurs. The position of the zone depends on the mass of the nuclide as well as several instrumental parameters, especially the nebulizer gas flow rate. Alteration of the nebulizer gas flow rate causes a spatial displacement of the zone, which leads to a change in the distance between the center of the zone and the sampling cone. An increase in the nebulizer gas flow rate shifts the zone in the direction of the sampling cone. A maximum signal is obtained when the sampling cone orifice is in the center of the zone, as a further increase in the flow rate leads to a decrease in the signal intensity as the zone will no longer be sampled efficiently.
In addition to a potential increase in sensitivity, optimization of the nebulizer gas flow rate can decrease the formation of doubly charged species [30]. Due to its low mass, lithium has no isobaric and polyatomic interferences [6], making it suitable for ICP-MS analysis without the necessity of using a collision reaction cell. However, a potential 7Li interference is 14N2+ [30], which may be reduced by optimization of the nebulizer gas flow rate.
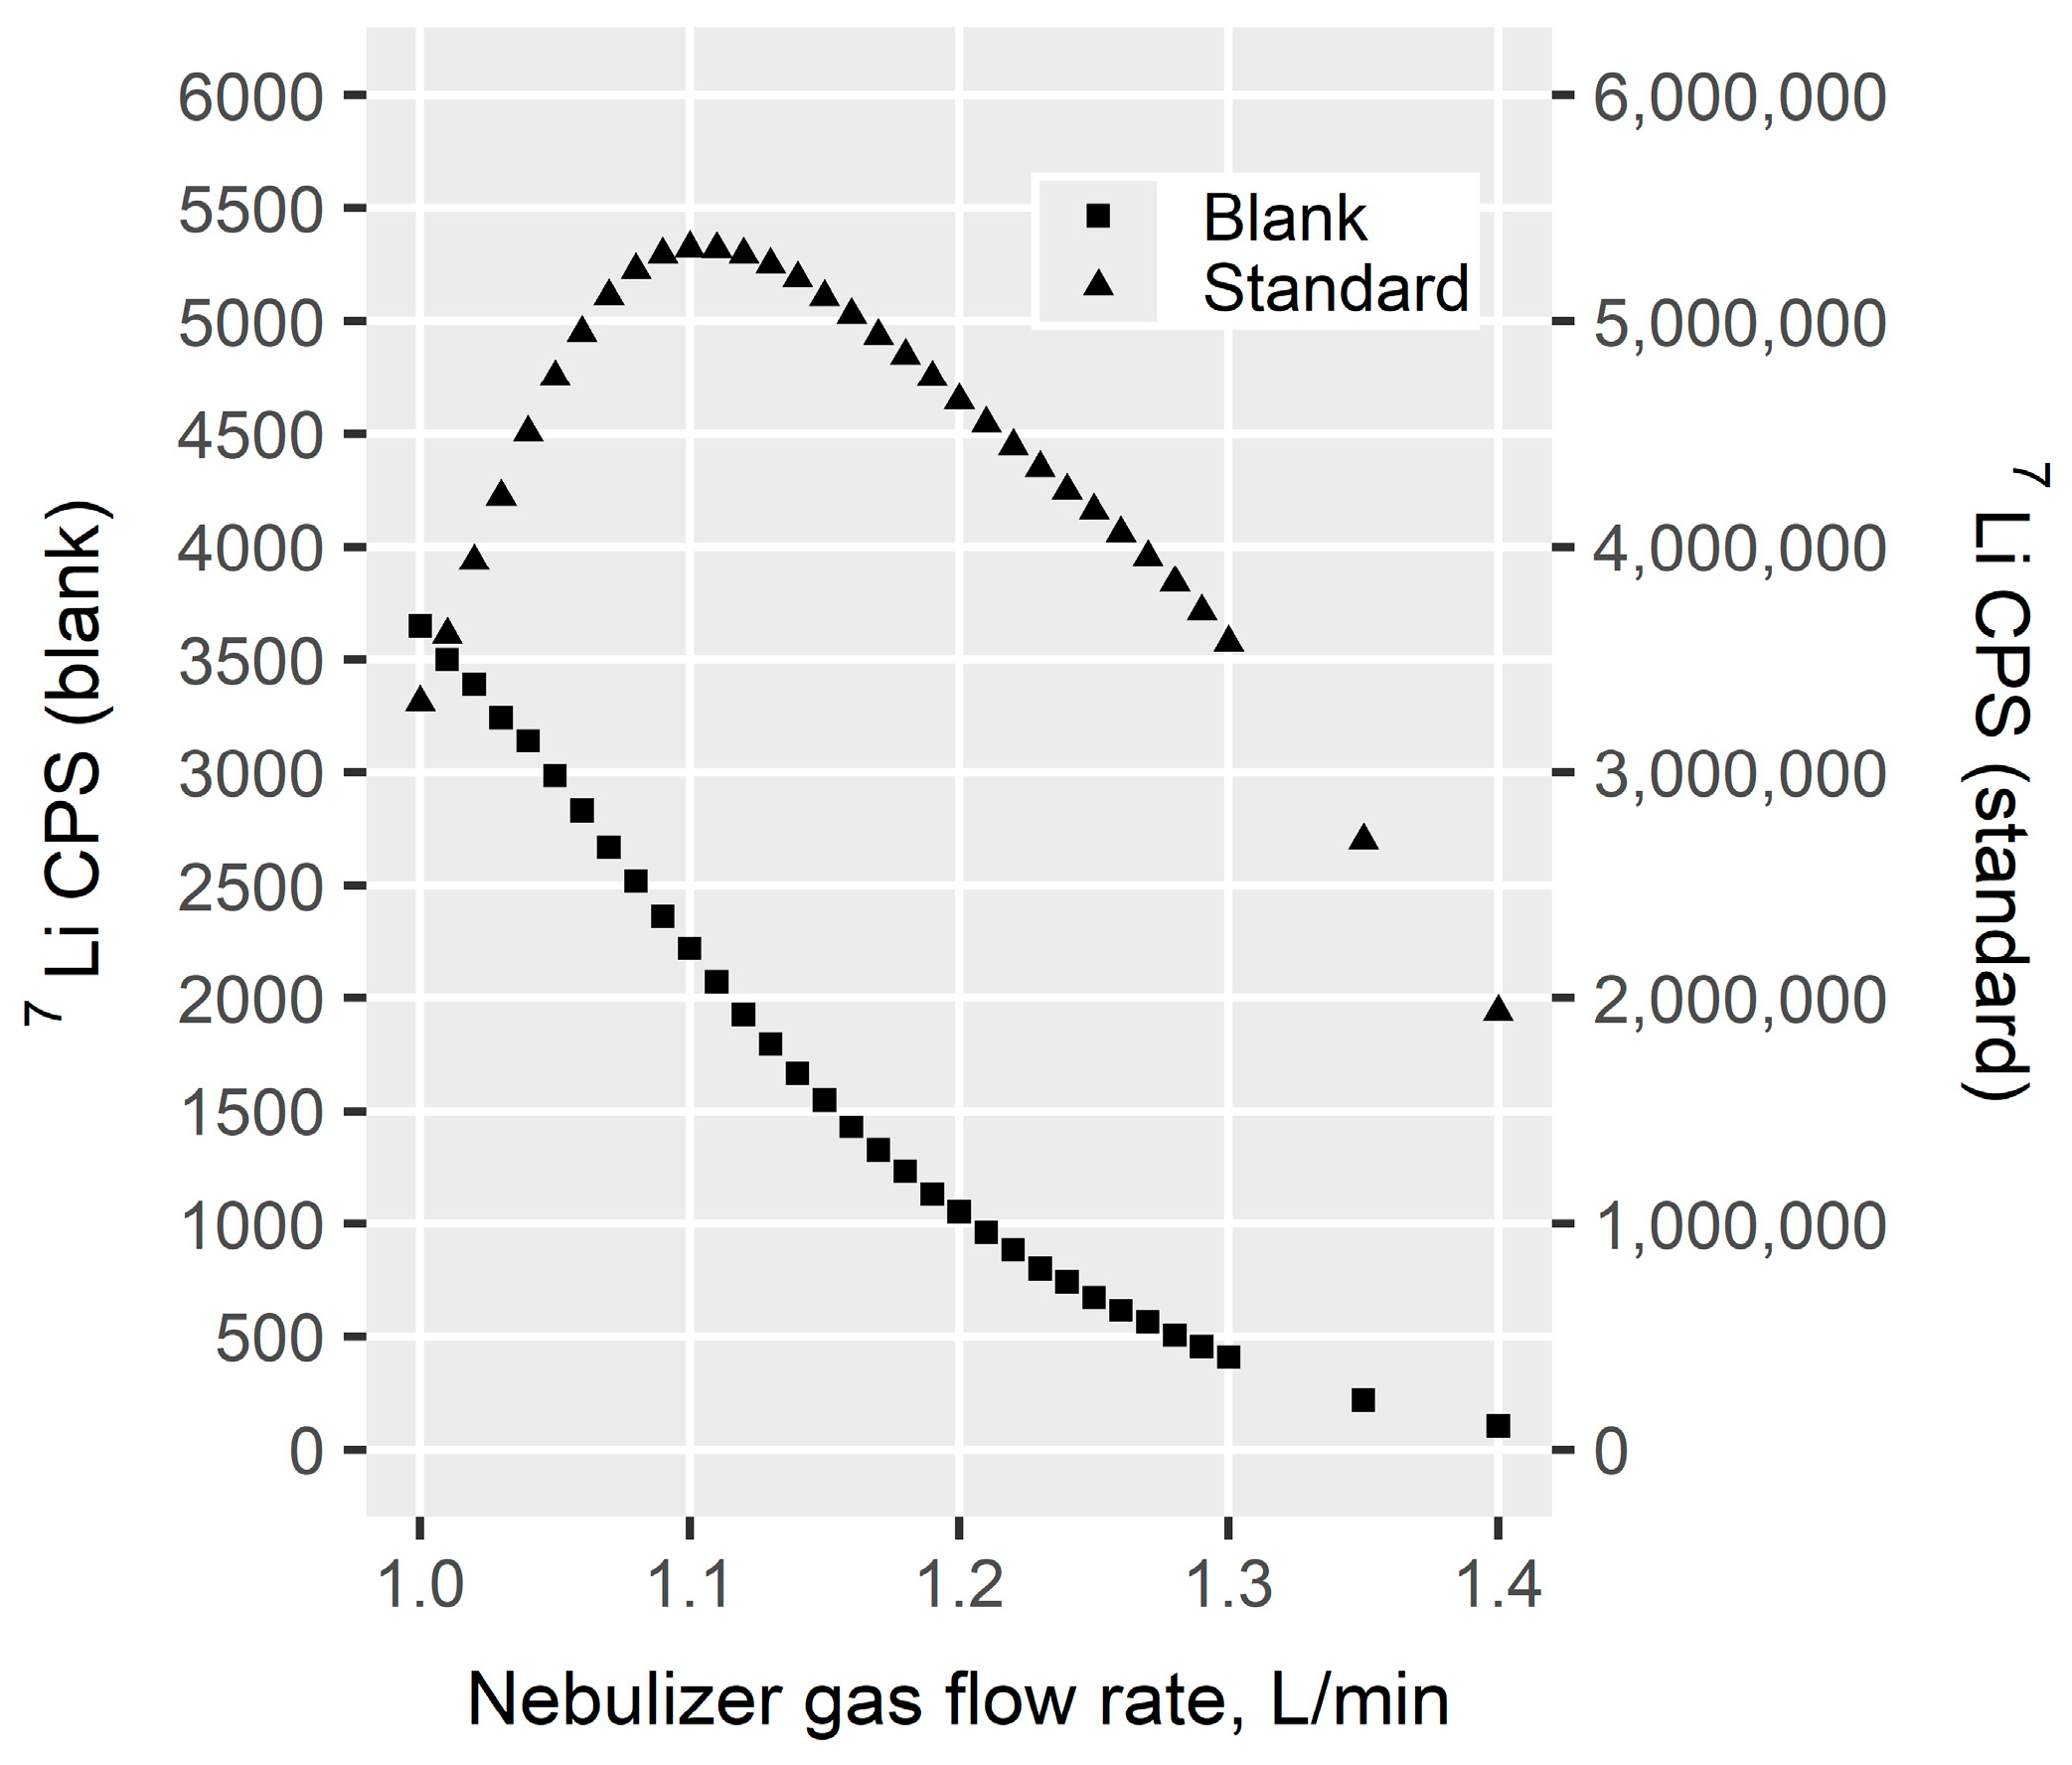
The nebulizer gas flow rate established by the automated instrument startup optimization was around 1.0 L/min. As illustrated in Figure 1, the 0.015 mmol/L lithium standard solution had a lithium signal optimum approximately at a flow rate of 1.1 L/min with an attenuation of the signal at higher flow rates. This may be explained by the M+ zone for lithium being positioned too far away from the sampling cone at a flow rate of 1.0 L/min and increasing the flow rate results in a more optimal position.
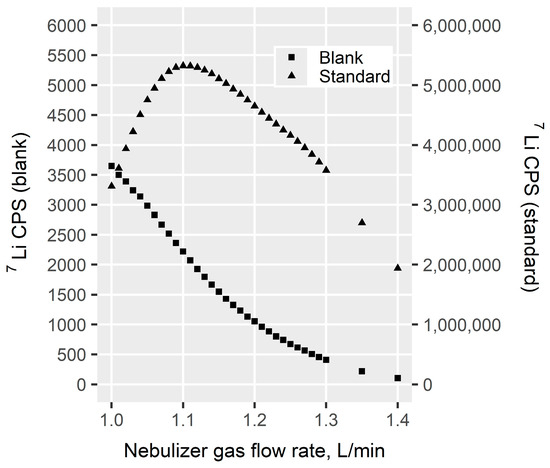
Figure 1.
The effect of the nebulizer gas flow rate on lithium signal in a blank solution and a 0.015 mmol/L lithium standard solution. The signal of the blank is shown on the left Y-axis, while the signal of the lithium standard solution is shown on the right Y-axis. CPS: counts per second.
For the blank solution, the lithium signal decreased almost linearly with increasing flow rate. Thus, an increase in the nebulizer gas flow rate reduced the lithium background and increased the lithium signal of the standard solution. Similar results were obtained by Choi et al. [31]. A possible explanation for the reduction in lithium background at higher nebulizer gas flow rates may be the reduction in doubly charged nitrogen [30,32].
In this study, a nebulizer gas flow rate of 1.15 L/min was chosen for the final method. At this rate, an optimum sensitivity was achieved, while sufficiently minimizing the background.
3.1.2. Effect of Hydrochloric Acid on Carry-Over
Carry-over is a common phenomenon for lithium measurements [13,20,33]. Carry-over and memory effect are often used interchangeably in the field of ICP-MS analysis. Carry-over is when the signal from a previous sample is measurable in subsequent samples [34]. This phenomenon was also present in the current study. A potential mechanism for the carry-over of lithium is the deposition of lithium on the skimmer cone with a subsequent secondary release during analysis [33,35]. Previous studies suggested that the deposition of lithium on the cone was alleviated by pre-coating with a NaCl solution resulting in a lower lithium background [33,35,36]. This may be due to the similar chemical properties of lithium and sodium as they both are alkali metals, resulting in binding sites on the cone being occupied by Na. In the current study, pre-coating the cone with a NaCl solution was not successful in lowering the lithium background.
Recommendations for carry-over in forensic toxicology specify a maximum carry-over of 20% relative to a sample at LLOQ after measurement of a high-concentration sample [37]. Minimization of carry-over is also important to reduce the risk of instrumental drift within an analytical series.
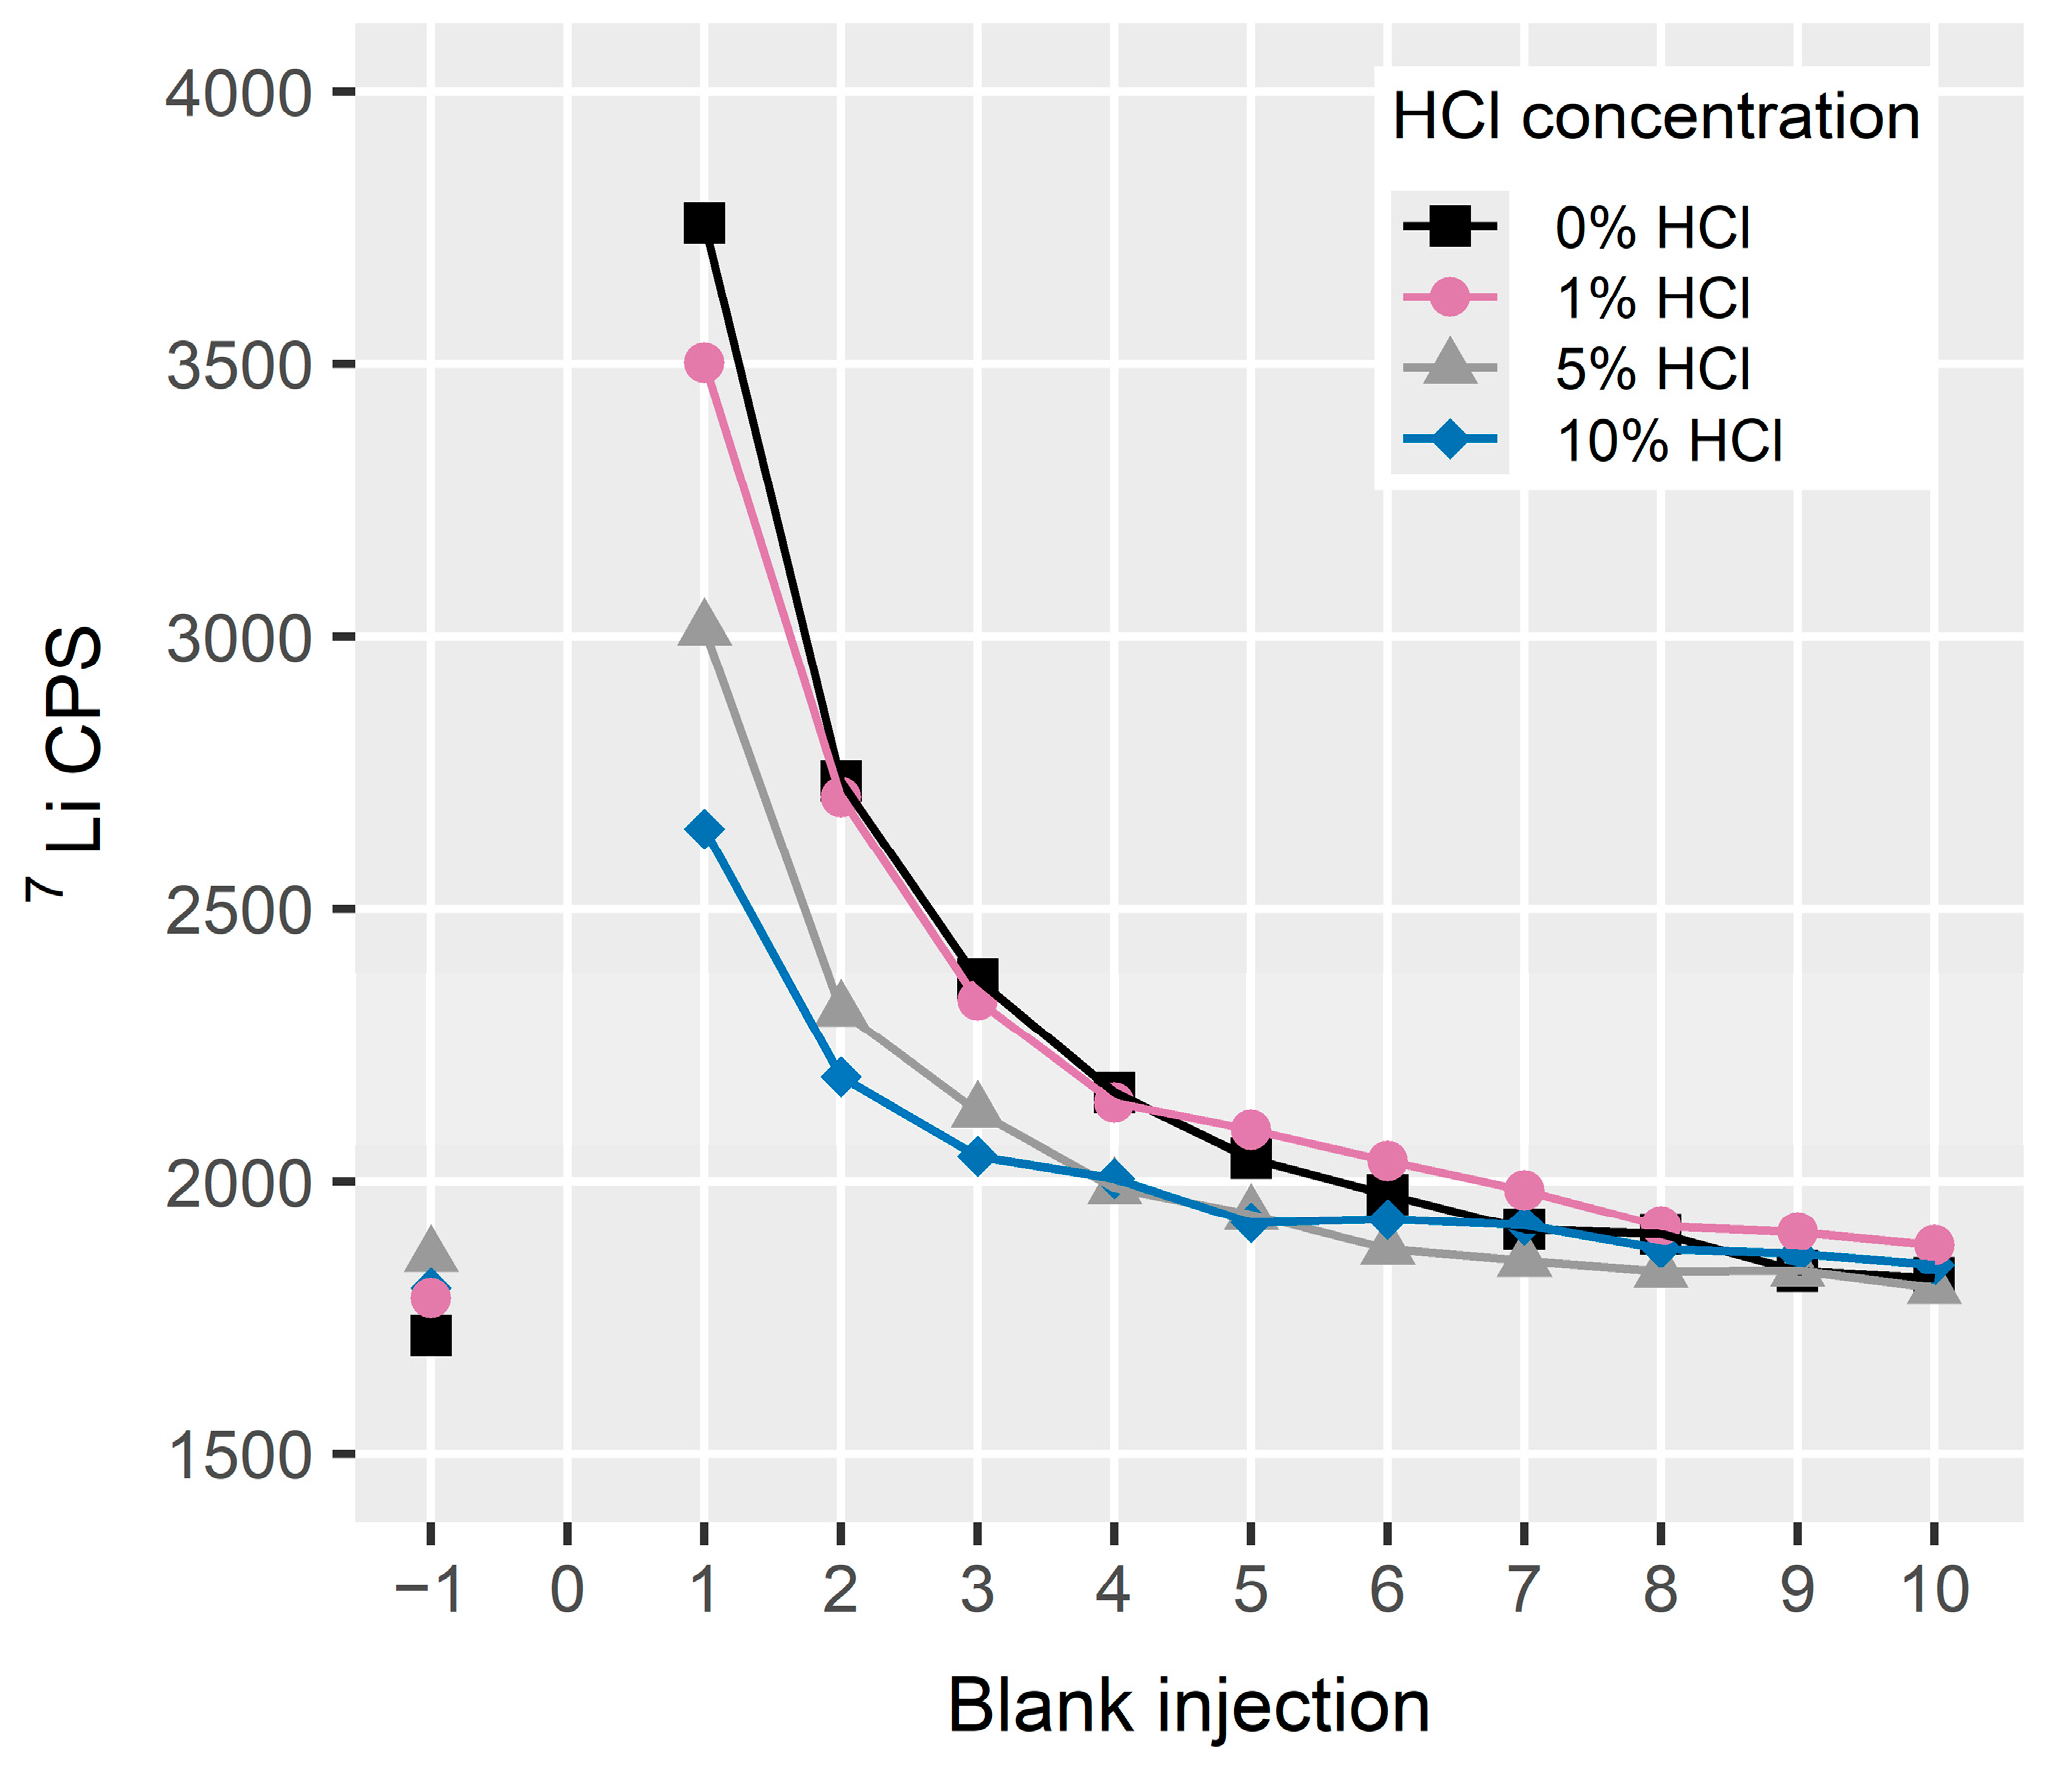
In the optimization of carry-over, rinse solutions with variable concentrations of hydrochloric acid were evaluated. As illustrated in Figure 2, the lithium signal decreased in the blank injections and became stable after approximately injection six. Carry-over decreased with increasing hydrochloric acid concentration in the rinse solution.
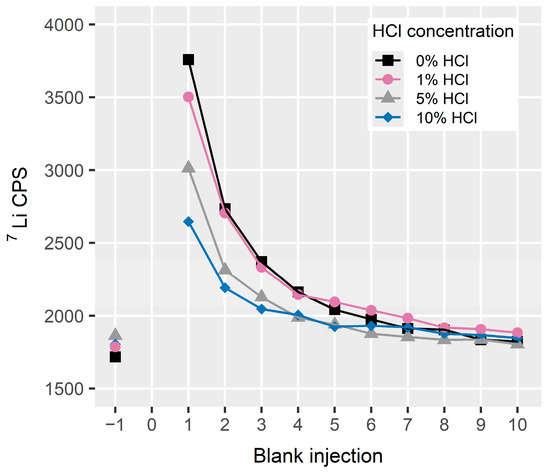
Figure 2.
Carry-over for lithium in 10 blank injections following the injection of a 0.015 mmol/L standard solution and using rinse solutions with different hydrochloric acid concentrations. The signal in a blank solution prior to the standard solution is illustrated on the X-axis as −1, while 0 indicates the standard solution. A rinse time of 10 s was employed. The data represent the mean signal of duplicate measurements. CPS: counts per second, HCl: hydrochloric acid.
The signal of the first blank injection after the 0.015 mmol/L standard solution corresponds to 0.7 to 1% of a sample at the LLOQ. All the tested rinse solutions thus provide a sufficiently low carry-over for measurement in the therapeutic and toxic concentration range. The optimal reduction in carry-over was achieved with 10% hydrochloric acid. However, as high acid concentrations can cause more wear and damage to equipment parts such as tubing and autosampler interior, a rinse solution of 5% hydrochloric acid was chosen for the final method. Additionally, one blank injection between every sample was implemented to monitor the background level.
3.1.3. Selection of Internal Standard
Internal standard (IS) is used to correct for potential variations in instrument sensitivity, sample preparation, and matrix effect. The analyzed samples were HK19, QC0 (blank blood), QC1, QC2, QC3, and whole blood from three authentic postmortem cases.
The evaluated internal standards were Bi, Ge, In, Sc, Tb, and Y. The internal standard mixture also contained 6Li, but it was excluded as 6Li reference material contained 7Li as an impurity and therefore resulted in an elevated 7Li background.
As illustrated in Figure 3A, the IS recovery during an analytical series for Ge, Y, In, and Tb was within 90–110% for all the measured samples. The signal for Sc and Bi was clearly suppressed in the serum and whole blood samples and most severely for Bi in postmortem blood samples, resulting in IS recoveries below 65%.
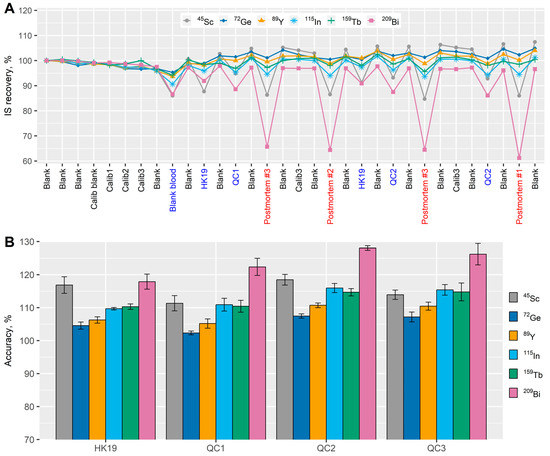
Figure 3.
(A) Internal standard (IS) recovery during an analytical series. The X-axis shows the injected samples in the first part of the analytical series while the Y-axis shows the internal standard recovery expressed as a percentage of the signal in the sample solution relative to the calibration blank. (B) The accuracy of lithium in the quality control samples (QC) quantified with different internal standards. The columns represent mean values while the error bars represent +/− standard deviations of three replicates.
Figure 3B shows the achieved lithium accuracies in the QC samples when quantification was performed with the six evaluated internal standards. All internal standards provided accuracies within the acceptable range of 80–120% except Bi where inaccuracies as high as 130% were observed. Ge provided the best accuracy for lithium with a narrow range of 102 to 107%.
When selecting an internal standard in ICP-MS analysis, an element with a similar mass and first ionization potential is usually preferable [13,38]. Of the evaluated internal standards that performed adequately, Ge was most similar to lithium and resulted in the best accuracy. Ge was therefore determined to be the most optimal internal standard in this analysis.
3.1.4. Effect of Sodium and Potassium on Accuracy
At the Department of Forensic Medicine, blood from autopsy cases is stored in 9 mL tubes containing 100 mg sodium fluoride and 22.5 mg potassium oxalate. The additives may potentially affect the lithium signal, as it has previously been shown that elements with low ionization potential can cause signal suppression of elements with higher ionization potentials [13,39,40]. As the ionization potential of Na and K are 5.1 and 4.3 eV, respectively, they may potentially affect the lithium signal, which has a slightly higher ionization potential of 5.4 eV [41]. An experiment was therefore conducted to evaluate the influence of Na and K additives on lithium signal and assess the necessity of matrix-matching for calibration solutions.
As the blank blood from the blood bank was preserved with 1% sodium fluoride, it was necessary to obtain blank whole blood without additives. The experiment was executed by the addition of NaCl or KCl to the additive-free whole blood. As a variable amount of blood is extracted at autopsy, the final concentration of the additives may vary. A putative lowest possible blood volume in the sample tube of 1 mL was used for the calculations. The added amount of NaCl and KCl was then based on the sum of endogenous blood levels and the calculated highest possible concentration of Na and K from the sample tube additives. Reported maximal endogenous levels of Na and K in postmortem blood of 140 and 66 mmol/L, respectively, were employed [42]. This resulted in NaCl and KCl concentrations of 0.15 and 0.02% w/v, respectively. To assess a potential concentration–response relationship, samples at half the concentration were also included (0.075% NaCl and 0.01% KCl).
As the first ionization potential of chlorine is high (13 eV) [41], chlorine would be unlikely to affect the lithium signal [40], which is similar for fluorine with a first ionization potential at 17.4 eV [41]. The influence of these elements was therefore not investigated.
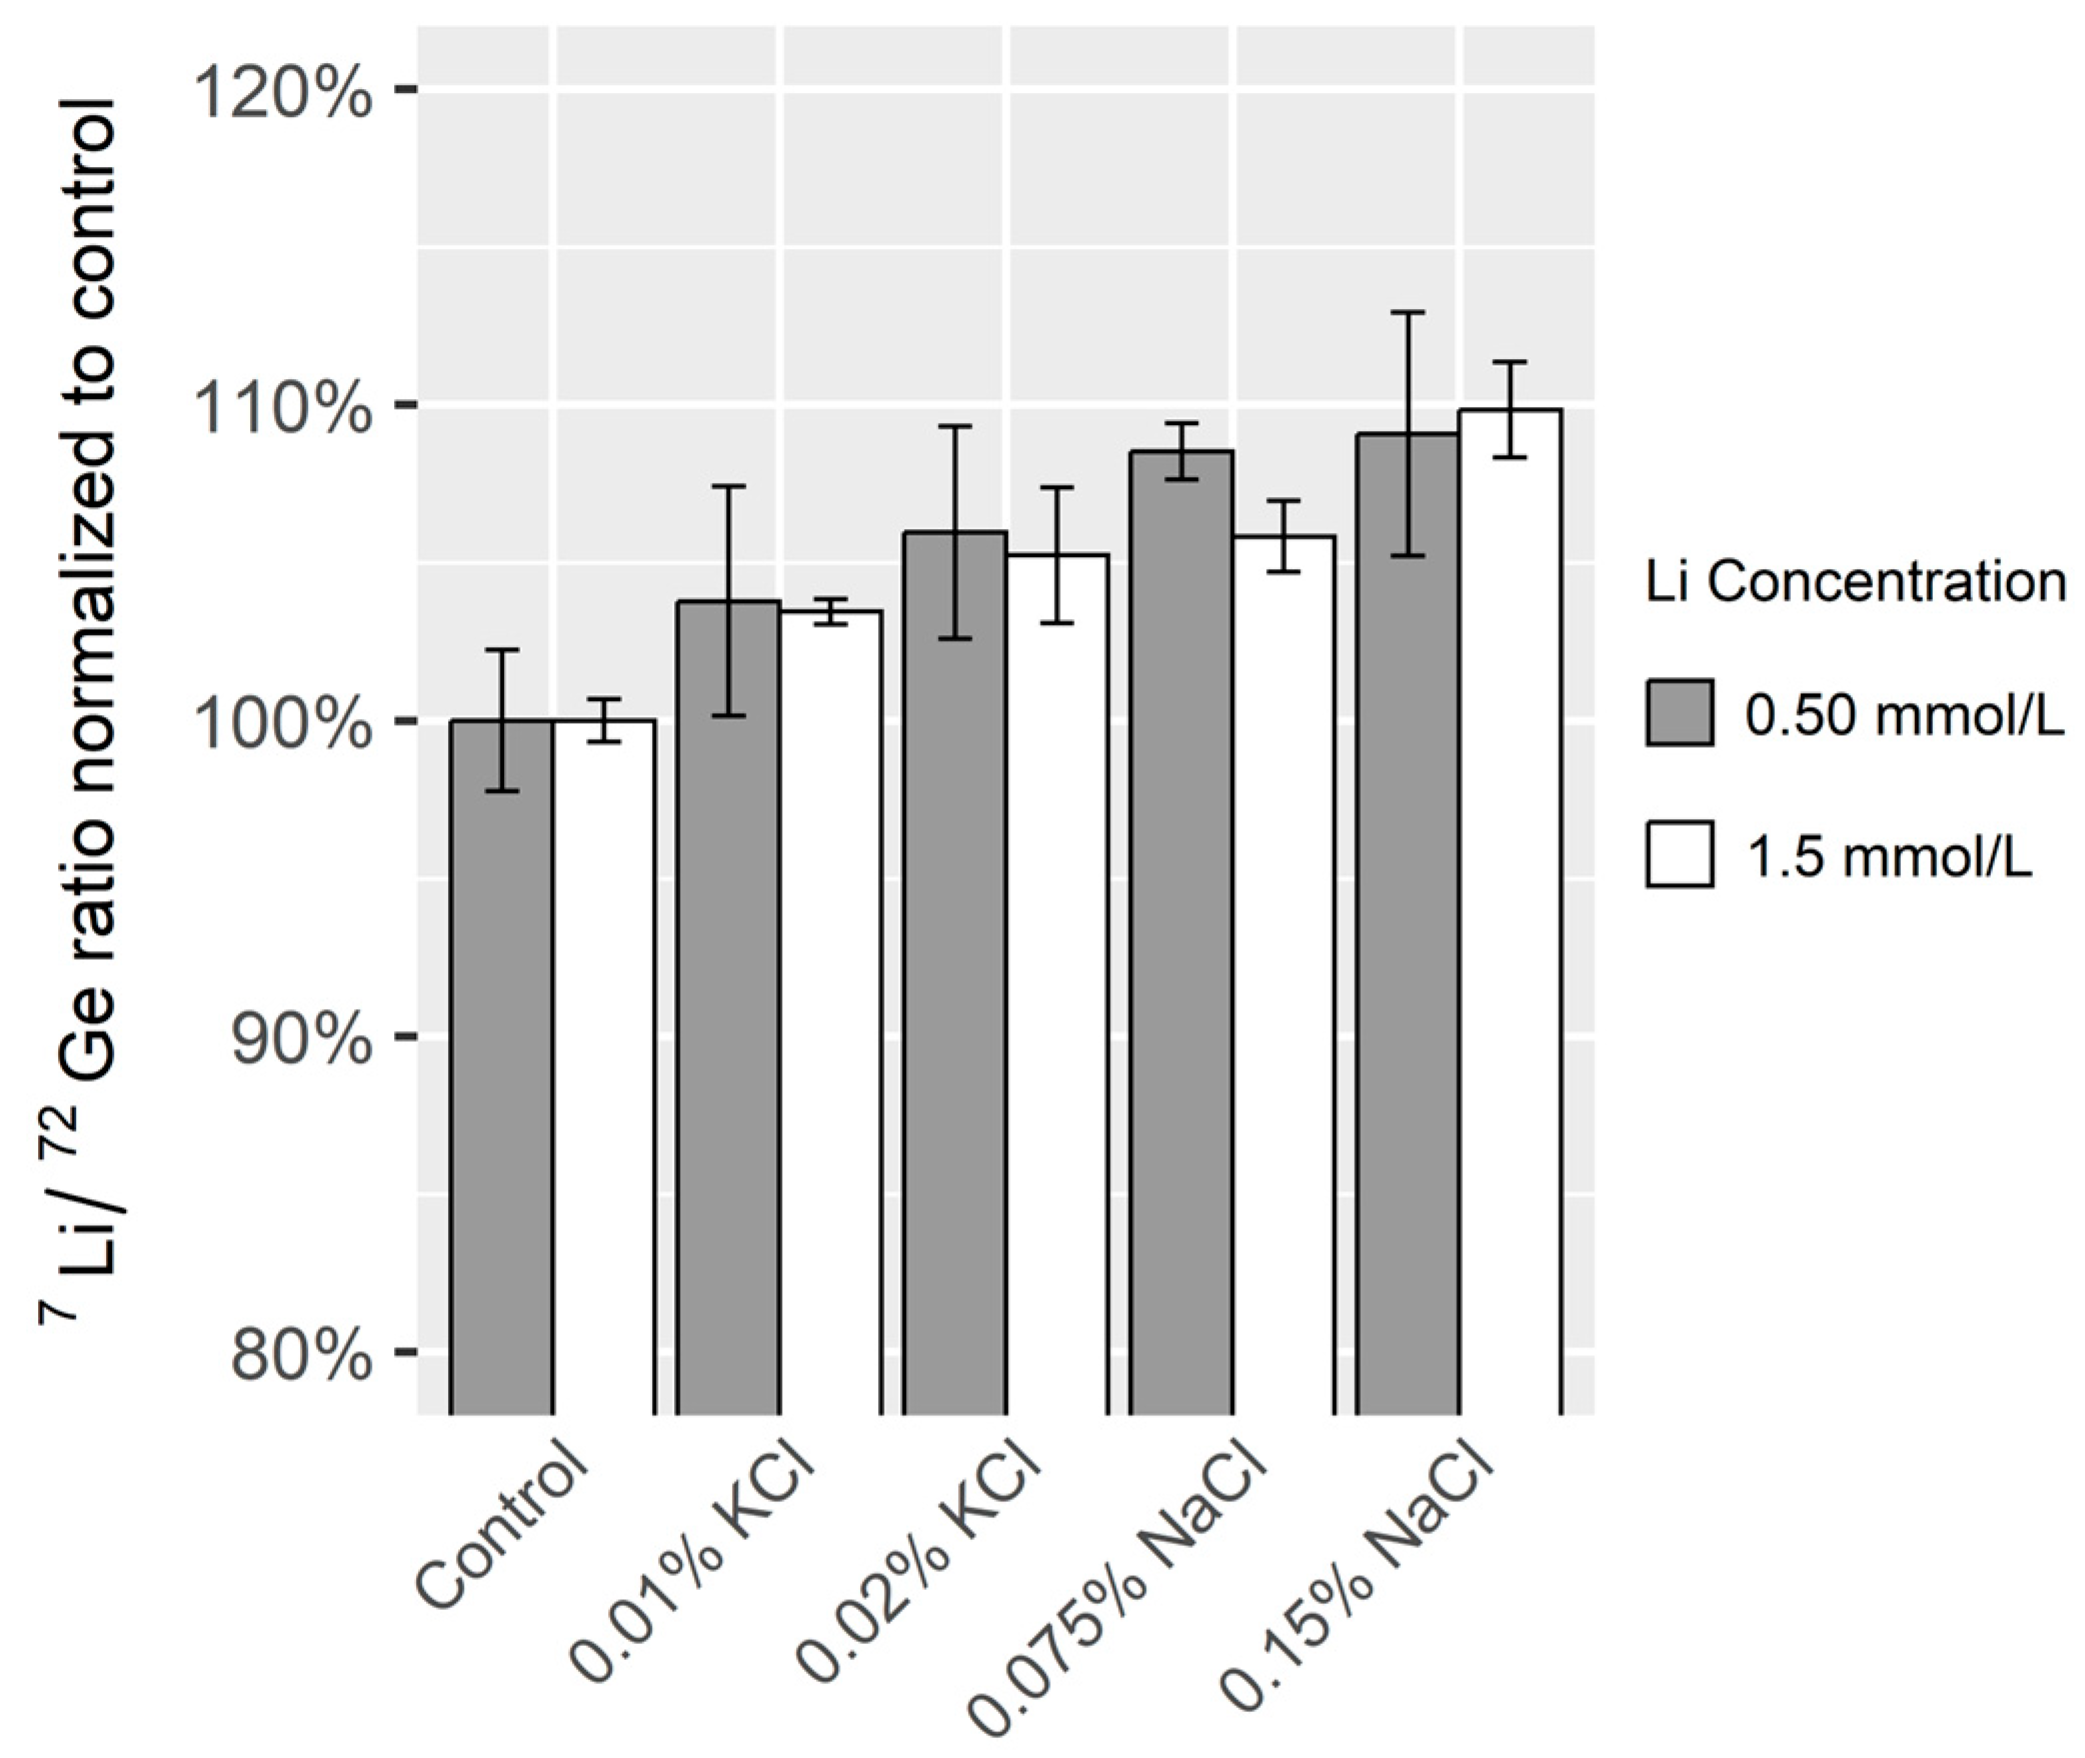
As illustrated in Figure 4, the addition of NaCl or KCl resulted in a concentration-dependent increase in the Li/Ge ratio compared to the whole blood with no additives. However, since the enhancement was less than 10%, the influence of these additives on the lithium measurement was determined to be acceptable and matrix-matching of calibration solutions was deemed unnecessary.

Figure 4.
The effect of NaCl or KCl on the Li/Ge ratio in unpreserved whole blood. The blood was fortified with lithium at two concentration levels. The ratio was normalized to samples with no added NaCl and KCl (Control). The columns represent mean values while the error bars represent +/− standard deviations of three replicates.
3.2. Validation
3.2.1. Linearity
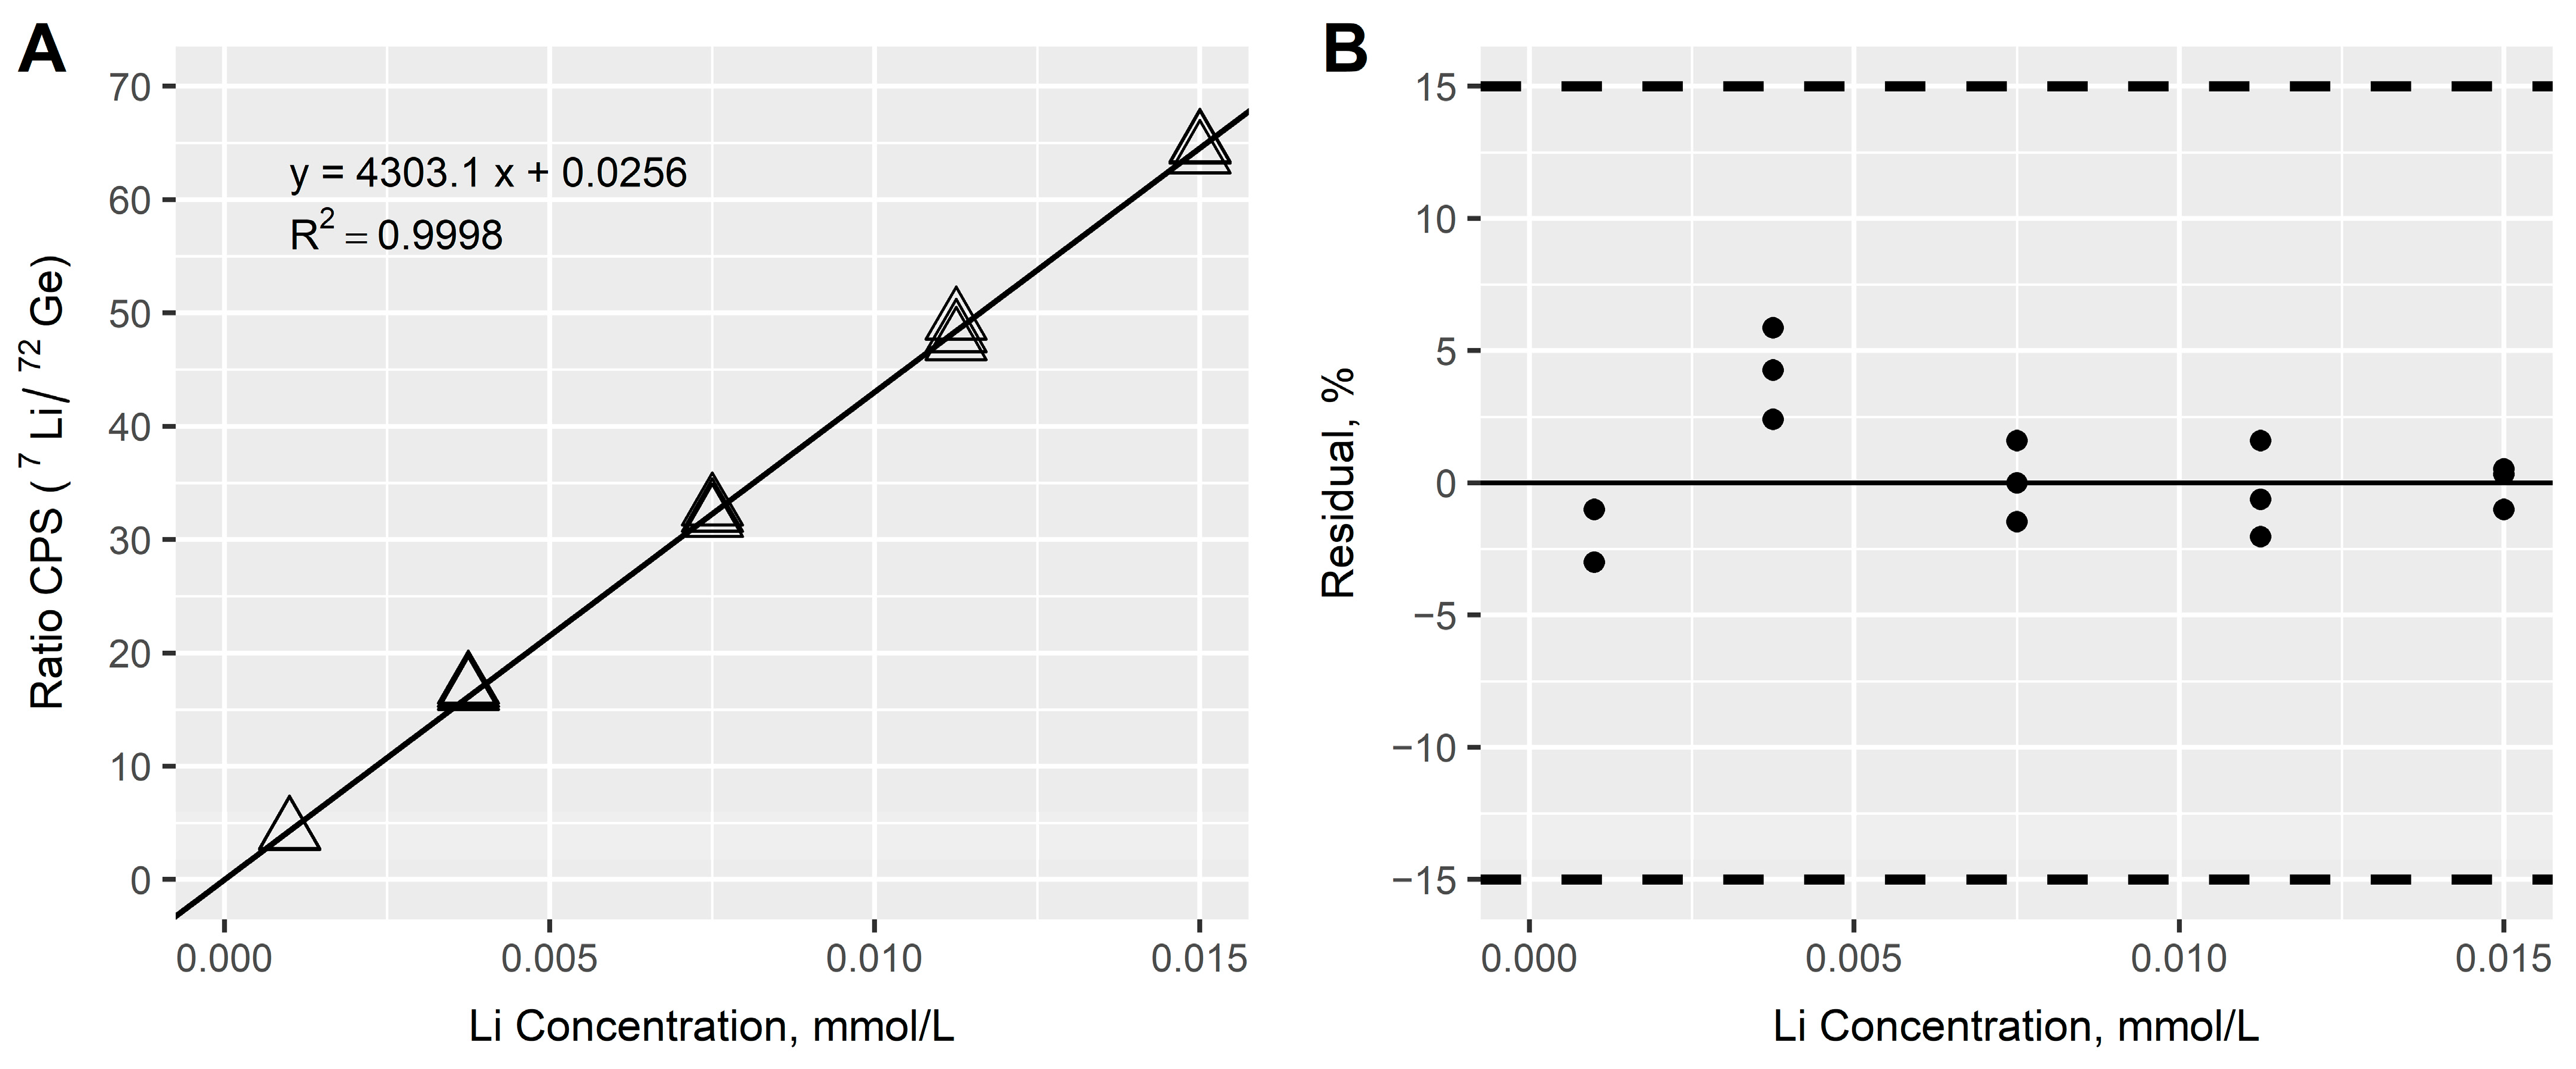
Linearity was evaluated in standard solutions with lithium concentrations from 0.001 to 0.015 mmol/L. As illustrated in Figure 5, good linearity was achieved with blank offset and no weighting, resulting in a coefficient of determination (R2) ≥ 0.999 and residuals between −3.0% and 5.9% of the nominal concentration. A linear relationship was found in lithium concentrations between the investigated range of 0.001–0.015 mmol/L. The investigated range corresponds to unknown samples with a concentration range of 0.10–1.5 mmol/L after a 100-fold dilution.
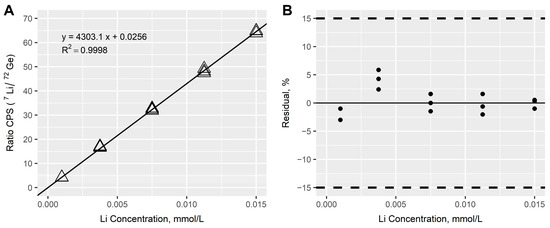
Figure 5.
(A) Calibration curve of lithium based on triplicate measurements of calibration solutions at five concentration levels. The calibration equation was based on ordinary least squares linear regression with a blank offset (0.001–0.015 mmol/L). CPS: counts per second. (B) Residual plot of the calibration curve. The dashed lines represent the acceptance range for the residuals at +/−15%.
3.2.2. Precision and Accuracy
Table 2 provides an overview of the results from the executed precision and accuracy experiments. Despite the small sample volume of 40 µL, the precision and accuracy studies resulted in total CV values between 1.1 and 2.3% and the corresponding accuracy range was 105–108% for all QC samples. Precision and accuracy were therefore considered acceptable, even though a slight bias was observed. Possible explanations for the minor bias may be instrument drift during an analytical series or lack of matrix-matching for the calibration solutions. As the accuracy was within the acceptable range, no further optimization was performed.
Table 2.
Accuracy and precision from analysis of quality control samples at four concentration levels. Samples were measured in duplicate on five independent analytical series.
The LLOQ was confirmed in a whole blood sample fortified with lithium at 0.10 mmol/L (QC1). A lower LLOQ was not investigated further as the method was intended for measurement in the therapeutic and toxic concentration range.
3.2.3. Dilution Integrity
Dilution integrity in samples prepared with different dilution factors showed CVs from 0.8 to 4.9% and corresponding accuracies ranging from 99.8 to 104% in all samples. Therefore, the method performed adequately when additional dilution was applied for samples with concentrations above the calibration range.
3.2.4. Accuracy in Postmortem Whole Blood
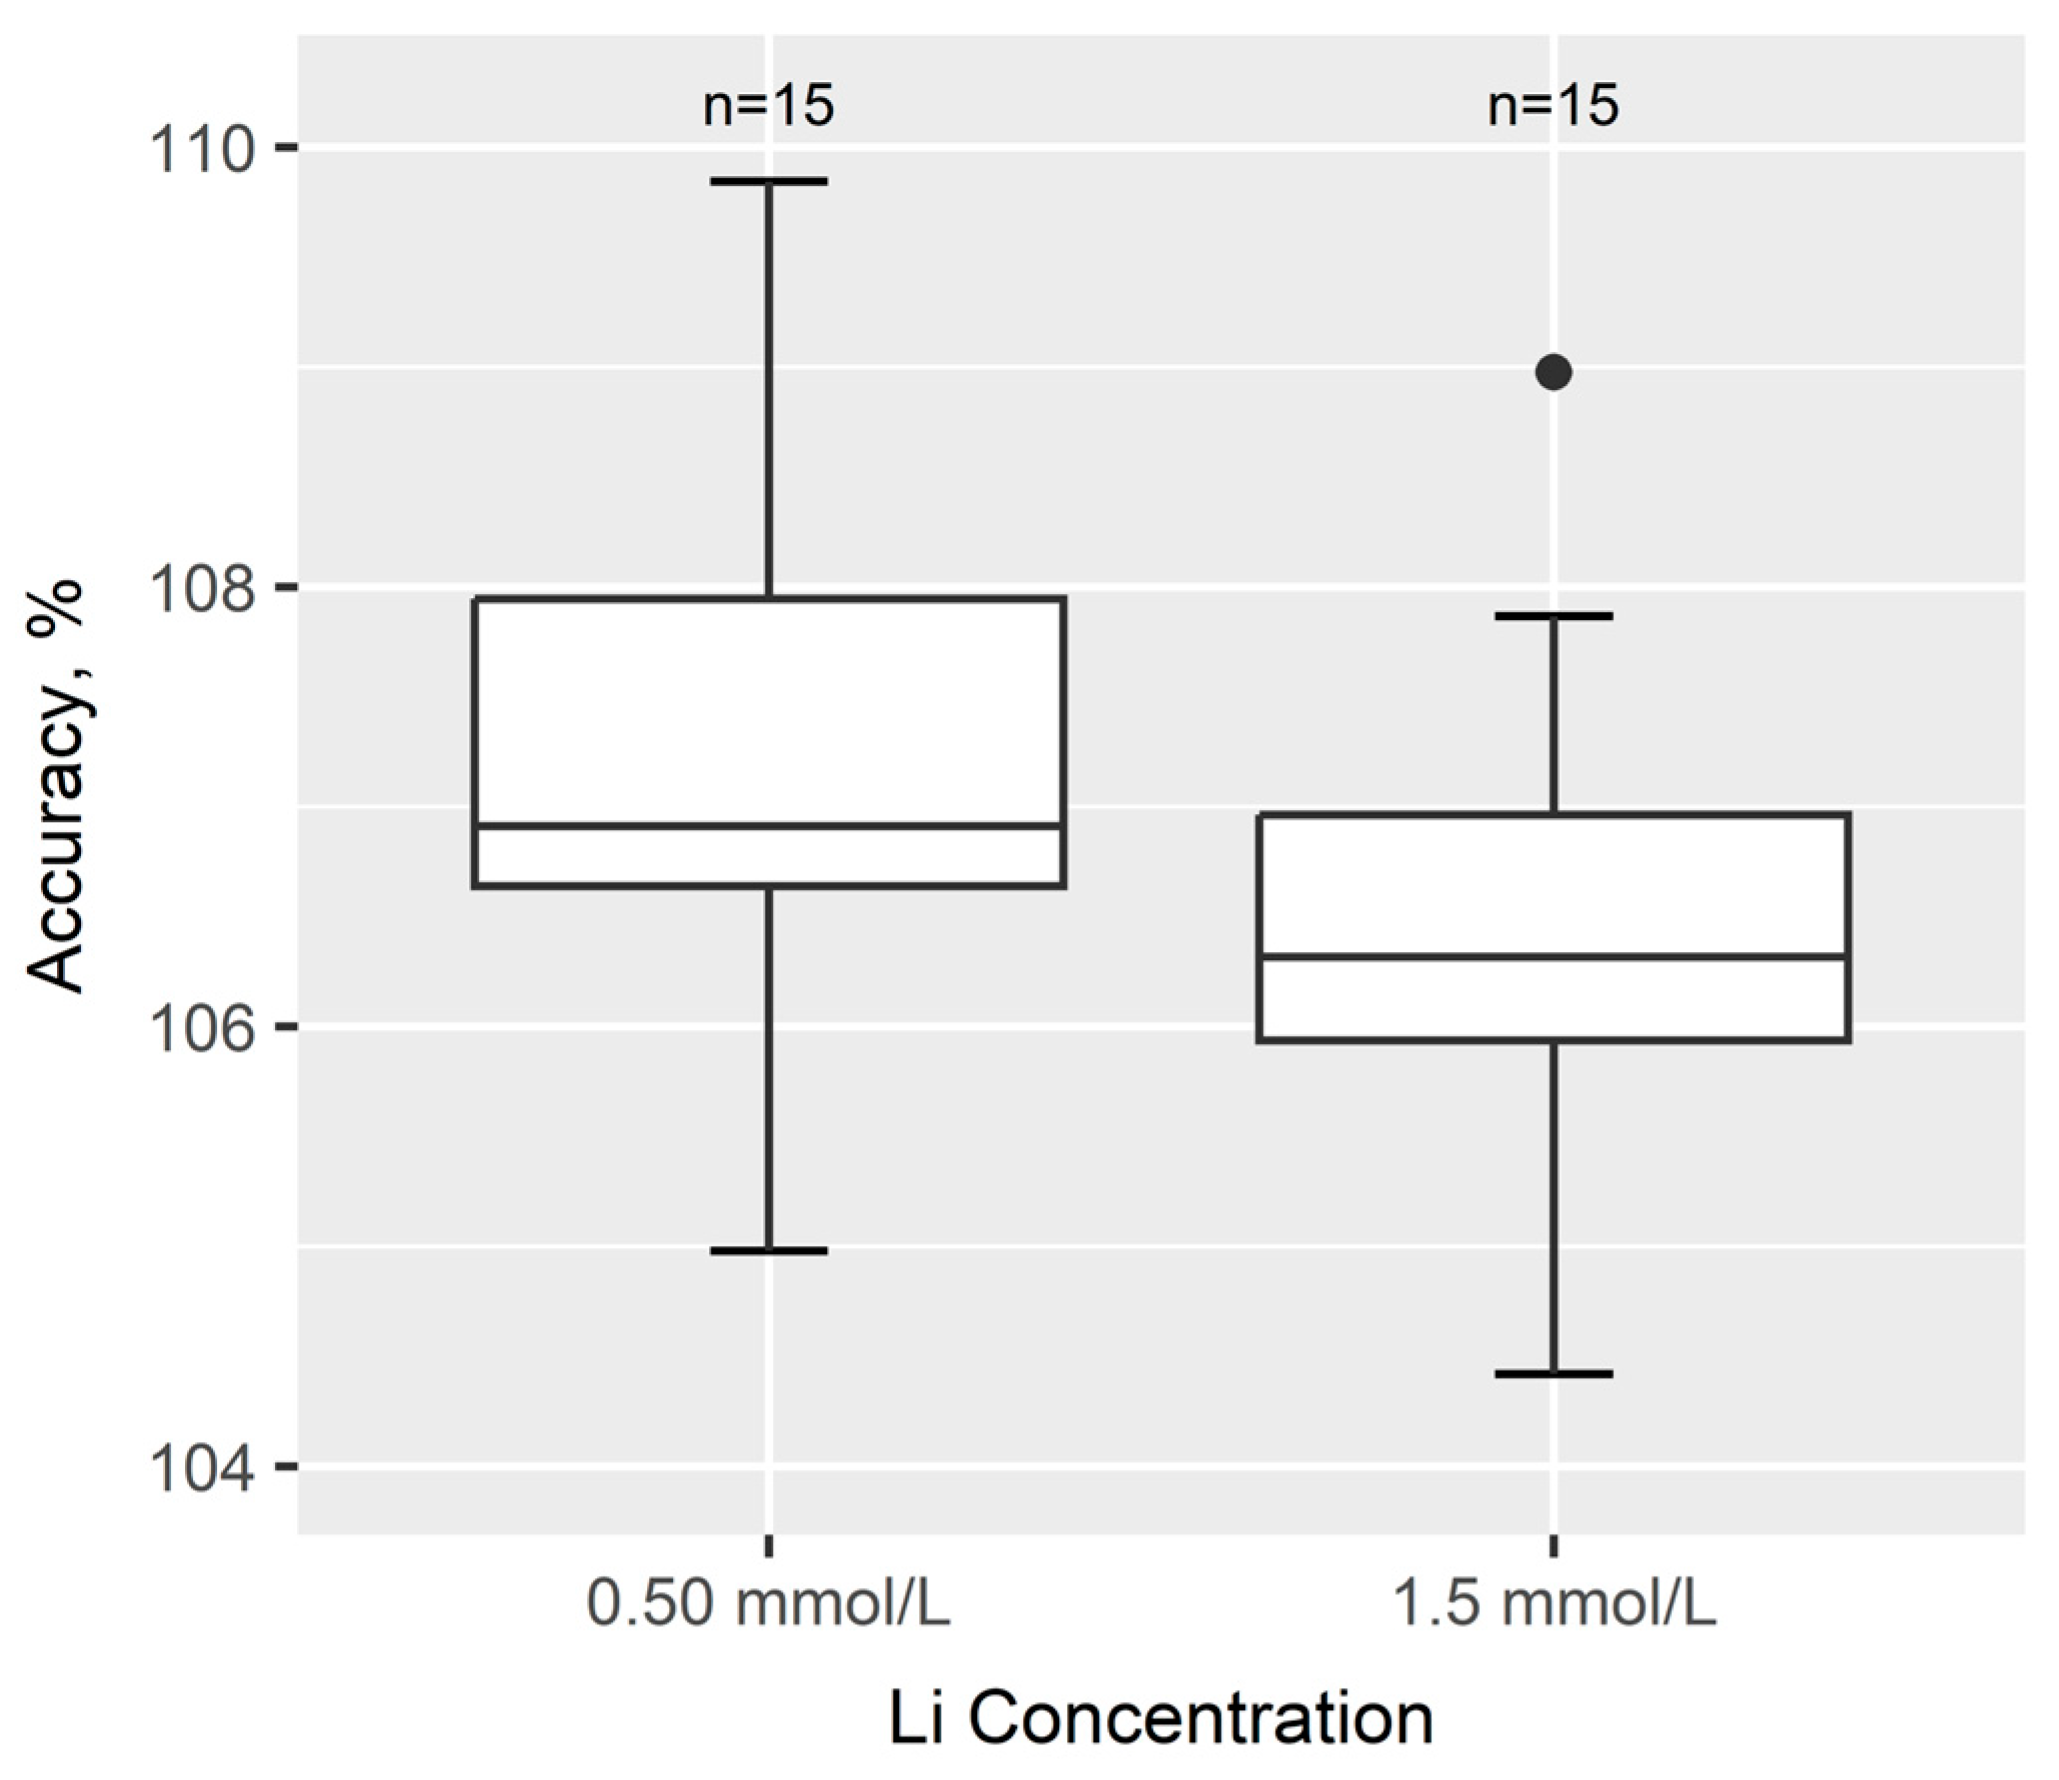
Accuracy in postmortem blood was assessed by the analysis of fortified blood from 15 authentic cases. As shown in Figure 6, the accuracy in the 15 cases was between 104 and 110% of fortified lithium at both concentration levels. This indicated no major bias in the postmortem blood samples compared with the fortified antemortem blood used in precision and accuracy experiments.
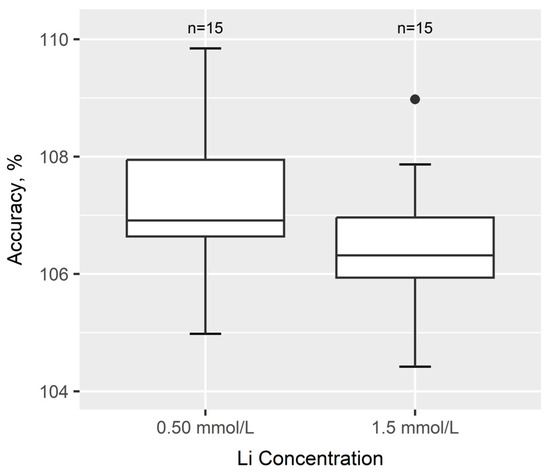
Figure 6.
Accuracy of lithium in whole blood from 15 authentic forensic postmortem cases not exposed to lithium. Samples were fortified with lithium at 0.50 or 1.5 mmol/L.
3.3. Analysis of 103 Consecutive Autopsy Samples
Whole blood from a total of 103 consecutive forensic autopsy cases was analyzed to evaluate the performance and robustness of the method. Within the 103 samples, 101 of the cases had values below LLOQ while two cases had lithium concentrations in the therapeutic and toxic range, respectively. The latter case was measured with 200-fold dilution.
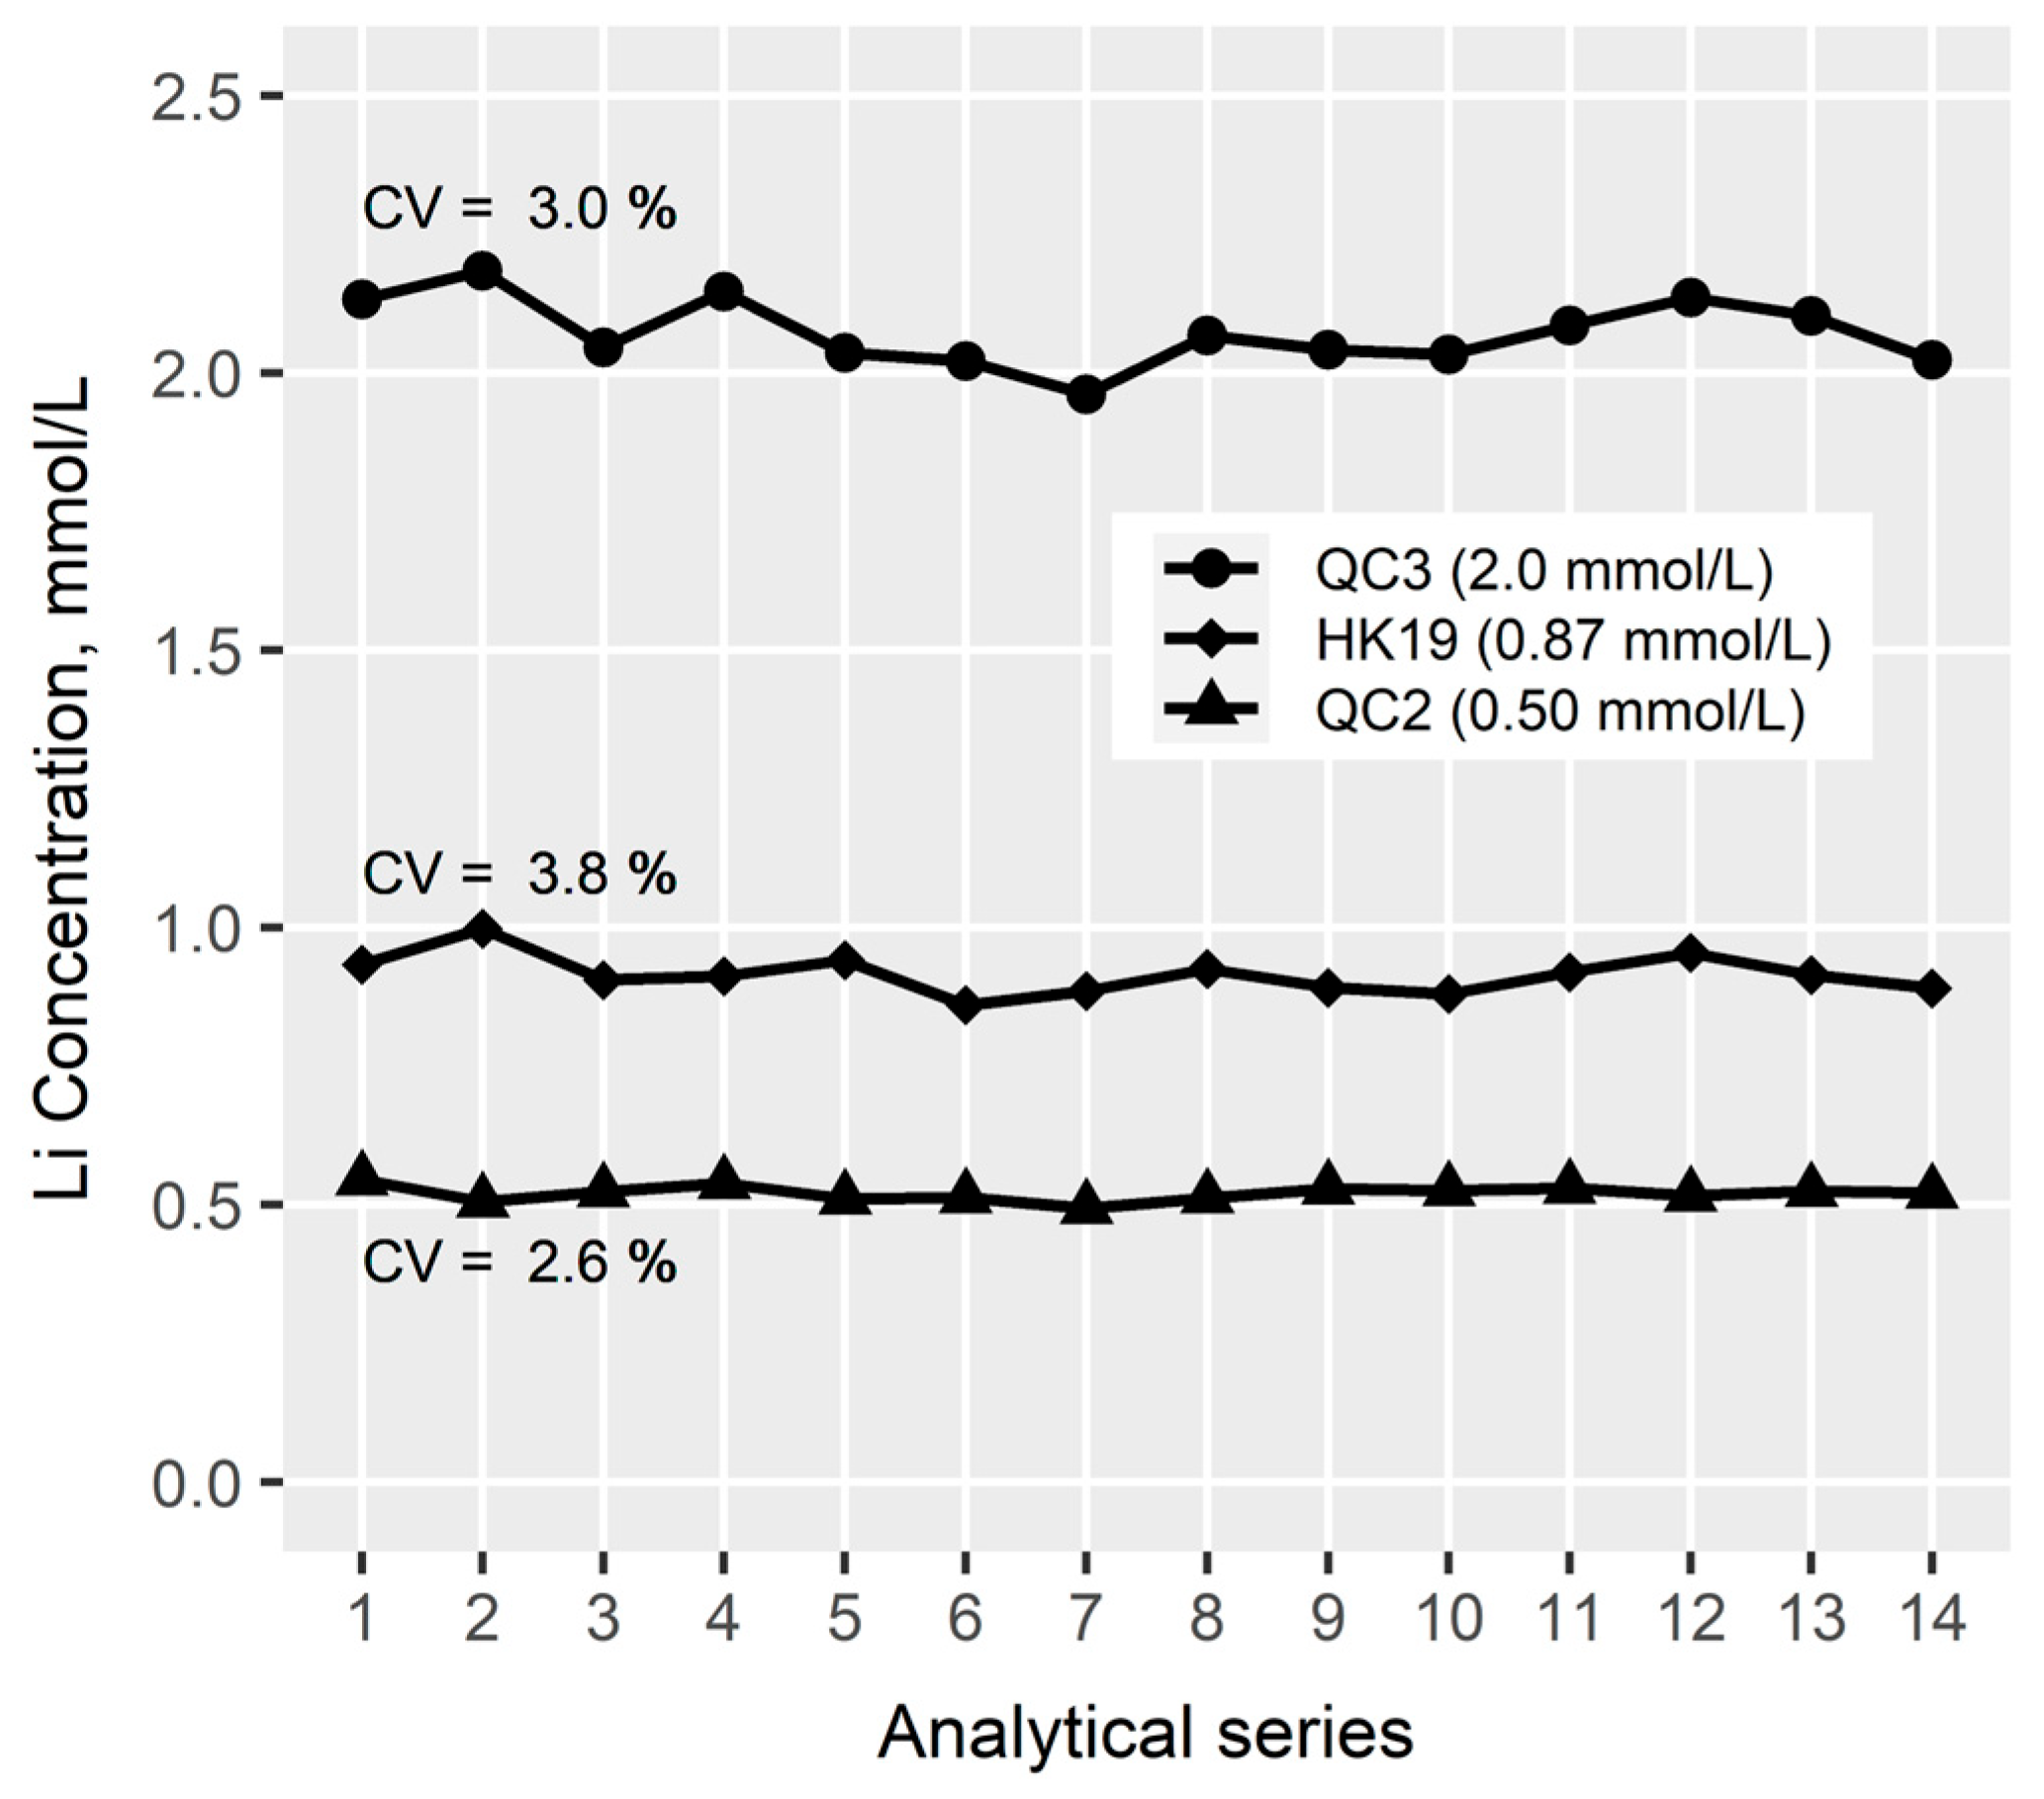
The 103 samples were distributed and analyzed on 14 analytical series on different days. Figure 7 shows the overall performance of the QC samples. A robust method was obtained with CV values below 4%.
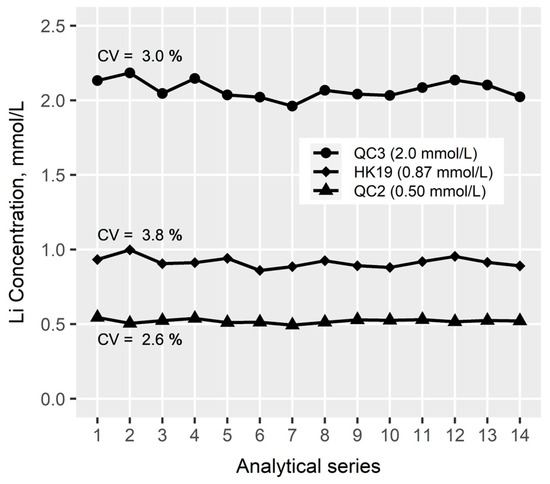
Figure 7.
Quality control (QC) chart showing performance of three QC samples analyzed across 14 analytical series. X-axis shows number of analytical series. CV: coefficient of variation.
The median for the recovery of the internal standard in the 103 autopsy samples was 103%, the range was 85.8 to 116%, and the 10- and 90-percentiles were 98.7 and 110%, respectively. Therefore, the acceptance criteria for the recovery of the internal standard were fulfilled for all samples.
Instrumental drift across the 14 analytical series was assessed by re-injection of the highest calibrator. The drift ranged from 99.4 to 114% of the nominal concentration and was deemed acceptable.
In summary, the method was robust with regard to internal standard recovery and instrumental drift during the analytical series, while the accuracy and precision criteria for the quality control samples were fulfilled.
4. Conclusions
An ICP-MS method for the quantitative determination of lithium in whole blood was developed, validated, and applied to a series of autopsy cases. The method was based on a simple sample preparation procedure consisting of acid dilution and required only 40 µL of sample material. The method was successfully developed by the optimization of the nebulizer gas flow rate, carry-over, and selection of an internal standard. Validation of the method included linearity, precision, accuracy, and dilution integrity with satisfactory results.
The final method was applied to a total of 103 consecutive medico-legal autopsy cases. Two of the cases had a lithium concentration above LLOQ, while the rest were below LLOQ. The application of the method showed a robust method in terms of intermediate precision for the quality control samples and recovery of internal standard in the postmortem blood samples.
Author Contributions
Conceptualization, C.C.Y.C., S.S.J., B.S.R., K.L. and R.T.; methodology, C.C.Y.C., S.S.J., B.S.R., K.L. and R.T.; investigation, C.C.Y.C. and R.T.; writing—original draft preparation, C.C.Y.C. and R.T.; writing—review and editing, C.C.Y.C., S.S.J., B.S.R., K.L. and R.T. All authors have read and agreed to the published version of the manuscript.
Funding
This research received no external funding.
Institutional Review Board Statement
Ethical review and approval were waived due to the study being a quality control study. Data management complied with the European General Data Protection Regulation (Regulation number 2016/697, Journal number 514-1105/25-3000).
Informed Consent Statement
Patient consent was waived due to no personal data being presented.
Data Availability Statement
The data cannot be shared publicly due to privacy. Parts of the data may be shared on reasonable request to the corresponding author.
Conflicts of Interest
The authors declare no conflicts of interest.
Abbreviations
The following abbreviations are used in this manuscript:
| ICP-MS | Inductively coupled plasma mass spectrometry |
| CPS | Counts per second |
| QC | Quality control |
| CV | Coefficient of variation |
| LLOQ | Lower limit of quantification |
| IS | Internal standard |
References
- Rakofsky, J.J.; Lucido, M.J.; Dunlop, B.W. Lithium in the treatment of acute bipolar depression: A systematic review and meta-analysis. J. Affect. Disord. 2022, 308, 268–280. [Google Scholar] [CrossRef] [PubMed]
- Mose, T.; Damkier, P.; Petersen, M.; Antonsen, S. Therapeutic Drug Monitoring of Lithium: A Study of the Accuracy and Analytical Variation Between Laboratories in Denmark. Ther. Drug Monit. 2015, 37, 466–471. [Google Scholar] [CrossRef]
- Söderberg, C.; Wernvik, E.; Jönsson, A.K.; Druid, H. Reference values of lithium in postmortem femoral blood. Forensic Sci. Int. 2017, 277, 207–214. [Google Scholar] [CrossRef]
- Saady, J.J. Metals. In Principles of Forensic Toxicology, 5th ed.; Levine, B.S., Kerrigan, S., Eds.; Springer: New York, NY, USA, 2020; pp. 569–581. [Google Scholar]
- Baselt, R.C. Lithium. In Disposition of Toxic Drugs and Chemicals in Man, 12th ed.; Biomedical Publications: Foster City, CA, USA, 2020; pp. 1170–1171. [Google Scholar]
- Fan, X.; Li, Q.; Lin, P.; Jin, Z.; Chen, M.; Ju, Y. A standard addition method to quantify serum lithium by inductively coupled plasma mass spectrometry. Ann. Clin. Biochem. 2022, 59, 166–170. [Google Scholar] [CrossRef]
- Ott, M.; Stegmayr, B.; Salander Renberg, E.; Werneke, U. Lithium intoxication: Incidence, clinical course and renal function—A population-based retrospective cohort study. J. Psychopharmacol. 2016, 30, 1008–1019. [Google Scholar] [CrossRef] [PubMed]
- Gitlin, M. Lithium side effects and toxicity: Prevalence and management strategies. Int. J. Bipolar Disord. 2016, 4, 27. [Google Scholar] [CrossRef]
- Oruch, R.; Elderbi, M.A.; Khattab, H.A.; Pryme, I.F.; Lund, A. Lithium: A review of pharmacology, clinical uses, and toxicity. Eur. J. Pharmacol. 2014, 740, 464–473. [Google Scholar] [CrossRef] [PubMed]
- Rumbelow, B.; Peake, M. Performance of a novel spectrophotometric lithium assay on a routine biochemistry analyser. Ann. Clin. Biochem. 2001, 38, 684–686. [Google Scholar] [CrossRef]
- Thomas, R. Practical Guide to ICP-MS and Other Atomic Spectroscopy Techniques: A Tutorial for Beginners; CRC Press: Boca Raton, FL, USA, 2023. [Google Scholar]
- Abou-Shakra, F.R.; Havercroft, J.M.; Ward, N.I. Lithium and boron in biological tissues and fluids. Trace Elem. Med. 1989, 6, 142–146. [Google Scholar]
- Vanhoe, H.; Dams, R.; Versieck, J. Use of inductively coupled plasma mass spectrometry for the determination of ultra-trace elements in human serum. J. Anal. At. Spectrom. 1994, 9, 23–31. [Google Scholar] [CrossRef]
- Vanhoe, H.; Vandecasteele, C.; Versieck, J.; Dams, R. Determination of lithium in biological samples by inductively coupled plasma mass spectrometry. Anal. Chim. Acta 1991, 244, 259–267. [Google Scholar] [CrossRef]
- Forrer, R.; Gautschi, K.; Lutz, H. Simultaneous measurement of the trace elements Al, As, B, Be, Cd, Co, Cu, Fe, Li, Mn, Mo, Ni, Rb, Se, Sr, and Zn in human serum and their reference ranges by ICP-MS. Biol. Trace Elem. Res. 2001, 80, 77–93. [Google Scholar] [CrossRef]
- Goullé, J.P.; Mahieu, L.; Castermant, J.; Neveu, N.; Bonneau, L.; Lainé, G.; Bouige, D.; Lacroix, C. Metal and metalloid multi-elementary ICP-MS validation in whole blood, plasma, urine and hair. Reference values. Forensic Sci. Int. 2005, 153, 39–44. [Google Scholar] [CrossRef] [PubMed]
- Maynar, M.; Llerena, F.; Grijota, F.J.; Alves, J.; Robles, M.C.; Bartolomé, I.; Muñoz, D. Serum concentration of several trace metals and physical training. J. Int. Soc. Sports Nutr. 2017, 14, 19. [Google Scholar] [CrossRef] [PubMed]
- Laur, N.; Kinscherf, R.; Pomytkin, K.; Kaiser, L.; Knes, O.; Deigner, H.P. ICP-MS trace element analysis in serum and whole blood. PLoS ONE 2020, 15, e0233357. [Google Scholar] [CrossRef] [PubMed]
- Cesbron, A.; Saussereau, E.; Mahieu, L.; Couland, I.; Guerbet, M.; Goullé, J.P. Metallic profile of whole blood and plasma in a series of 106 healthy volunteers. J. Anal. Toxicol. 2013, 37, 401–405. [Google Scholar] [CrossRef]
- Lu, Y.; Kippler, M.; Harari, F.; Grandér, M.; Palm, B.; Nordqvist, H.; Vahter, M. Alkali dilution of blood samples for high throughput ICP-MS analysis-comparison with acid digestion. Clin. Biochem. 2015, 48, 140–147. [Google Scholar] [CrossRef]
- Nawi, M.A.; Chin, S.F.; Jamal, R. Simultaneous analysis of 25 trace elements in micro volume of human serum by inductively coupled plasma mass spectrometry (ICP-MS). Pract. Lab. Med. 2020, 18, e00142. [Google Scholar] [CrossRef]
- Wang, P.; Ma, W.; Zhou, Y.; Zhao, Y.; Shi, H.; Yang, Q.; Zhang, Y. Circulating metal concentrations, inflammatory cytokines and gestational weight gain: Shanghai MCPC cohort. Ecotoxicol. Environ. Saf. 2020, 199, 110697. [Google Scholar] [CrossRef]
- Jayawardene, I.; Paradis, J.F.; Bélisle, S.; Poddalgoda, D.; Macey, K. Multi-elemental determination of metals, metalloids and rare earth element concentrations in whole blood from the Canadian Health Measures Survey, 2009–2011. J. Trace Elem. Med. Biol. 2021, 68, 126830. [Google Scholar] [CrossRef]
- Goullé, J.P.; Le Roux, P.; Castanet, M.; Mahieu, L.; Guyet-Job, S.; Guerbet, M. Metallic Profile of Whole Blood and Plasma in a Series of 99 Healthy Children. J. Anal. Toxicol. 2015, 39, 707–713. [Google Scholar] [CrossRef] [PubMed]
- Söderberg, C.; Rodushkin, L.; Johansson, A.; Kugelberg, F.C. Postmortem reference concentrations of 68 elements in blood and urine. Int. J. Legal Med. 2023, 137, 655–669. [Google Scholar] [CrossRef] [PubMed]
- Society of Forensic Toxicologists/American Academy of Forensic Sciences. SOFT/AAFS Forensic Toxicology Laboratory Guidelines; Society of Forensic Toxicologists/American Academy of Forensic Sciences: Colorado Springs, CO, USA, 2006. [Google Scholar]
- Peters, F.T.; Drummer, O.H.; Musshoff, F. Validation of new methods. Forensic Sci. Int. 2007, 165, 216–224. [Google Scholar] [CrossRef]
- Linnet, K. The between-run component of variation in internal quality control. Clin. Chem. 1989, 35, 1416–1422. [Google Scholar] [CrossRef] [PubMed]
- Vanhaecke, F.; Dams, R.; Vandecasteele, C. ‘Zone model’ as an explanation for signal behaviour and non-spectral interferences in inductively coupled plasma mass spectrometry. J. Anal. At. Spectrom. 1993, 8, 433–438. [Google Scholar] [CrossRef]
- D’Ilio, S.; Violante, N.; Di Gregorio, M.; Senofonte, O.; Petrucci, F. Simultaneous quantification of 17 trace elements in blood by dynamic reaction cell inductively coupled plasma mass spectrometry (DRC-ICP-MS) equipped with a high-efficiency sample introduction system. Anal. Chim. Acta 2006, 579, 202–208. [Google Scholar] [CrossRef]
- Choi, M.S.; Shin, H.S.; Kil, Y.W. Precise determination of lithium isotopes in seawater using MC-ICP-MS. Microchem. J. 2010, 95, 274–278. [Google Scholar] [CrossRef]
- Bryant, C.J.; McCulloch, M.T.; Bennett, V.C. Impact of matrix effects on the accurate measurement of Li isotope ratios by inductively coupled plasma mass spectrometry (MC-ICP-MS) under “cold” plasma conditions. J. Anal. At. Spectrom. 2003, 18, 734–737. [Google Scholar] [CrossRef]
- Bohlin, M.S.; Misra, S.; Lloyd, N.; Elderfield, H.; Bickle, M.J. High-precision determination of lithium and magnesium isotopes utilising single column separation and multi-collector inductively coupled plasma mass spectrometry. Rapid Commun. Mass. Spectrom. 2018, 32, 93–104. [Google Scholar] [CrossRef]
- Al-Hakkani, M.F. Guideline of inductively coupled plasma mass spectrometry “ICP–MS”: Fundamentals, practices, determination of the limits, quality control, and method validation parameters. SN Appl. Sci. 2019, 1, 791. [Google Scholar] [CrossRef]
- Juzer, S.; Tanwar, N.; Misra, S. Precise determination of lithium isotope ratios at the sub-nanogram level by QQQ-ICP-MS: Application to natural waters and carbonates. J. Anal. At. Spectrom. 2022, 37, 1541–1553. [Google Scholar] [CrossRef]
- Lin, J.; Liu, Y.; Hu, Z.; Yang, L.; Chen, K.; Chen, H.; Zong, K.; Gao, S. Accurate determination of lithium isotope ratios by MC-ICP-MS without strict matrix-matching by using a novel washing method. J. Anal. At. Spectrom. 2016, 31, 390–397. [Google Scholar] [CrossRef]
- Wille, M.R.S.; Coucke, W.; De Baere, T.; Peters, T.F. Update of Standard Practices for New Method Validation in Forensic Toxicology. Curr. Pharm. Des. 2017, 23, 5442–5454. [Google Scholar] [CrossRef] [PubMed]
- Wilschefski, S.C.; Baxter, M.R. Inductively Coupled Plasma Mass Spectrometry: Introduction to Analytical Aspects. Clin. Biochem. Rev. 2019, 40, 115–133. [Google Scholar] [CrossRef]
- Gajek, R.; Barley, F.; She, J. Determination of essential and toxic metals in blood by ICP-MS with calibration in synthetic matrix. Anal. Methods 2013, 5, 2193–2202. [Google Scholar] [CrossRef]
- Gajek, R.; Choe, K.-Y. Determination of ultra-trace elements in human plasma or serum by ICP-MS using sodium in the presence of carbon as a single calibration matrix-match component. J. Anal. At. Spectrom. 2015, 30, 1142–1153. [Google Scholar] [CrossRef]
- National Center for Biotechnology Information. Ionization Energy in the Periodic Table of Elements. Available online: https://pubchem.ncbi.nlm.nih.gov/ptable/ionization-energy/ (accessed on 22 March 2024).
- Rammer, L.; Gerdin, B. Dilution of blood in fresh water drowning. Post-mortem determination of osmolarity and electrolytes in blood, cerebrospinal fluid and vitreous humor. Forensic Sci. 1976, 8, 229–234. [Google Scholar] [CrossRef]

Disclaimer/Publisher’s Note: The statements, opinions and data contained in all publications are solely those of the individual author(s) and contributor(s) and not of MDPI and/or the editor(s). MDPI and/or the editor(s) disclaim responsibility for any injury to people or property resulting from any ideas, methods, instructions or products referred to in the content. |
© 2025 by the authors. Licensee MDPI, Basel, Switzerland. This article is an open access article distributed under the terms and conditions of the Creative Commons Attribution (CC BY) license (https://creativecommons.org/licenses/by/4.0/).