Article

Preliminary Modeling of Single Pulp Fiber Using an Improved Mass–Spring Method

by
Yin Liu
1,2,
Wenhao Shen
2,*,
Douglas W. Coffin
3,
Tao Song
2,
Jean-Francis Bloch
4 and
Jean-Pierre Corriou
5
1
School of Art and Media, Guangzhou Vocational University of Science and Technology, Guangzhou 510555, China
2
State Key Laboratory of Advanced Papermaking & Paper-based Materials, South China University of Technology, Guangzhou 510641, China
3
Department of Chemical, Paper, and Biomedical Engineering, Miami University, Oxford, OH 45056, USA
4
3SR, Grenoble INP, CNRS, University Grenoble Alpes, 38000 Grenoble, France
5
Laboratoire Réactions et Génie des Procédés, UMR 7274-CNRS, ENSIC, Lorraine University, 54001 Nancy, Cedex, France
*
Author to whom correspondence should be addressed.
Solids 2025, 6(3), 50; https://doi.org/10.3390/solids6030050
Submission received: 28 July 2025 / Revised: 19 August 2025 / Accepted: 1 September 2025 / Published: 3 September 2025
(This article belongs to the Topic Multi-scale Modeling and Optimisation of Materials)

Abstract

An improved Mass–Spring Model (iMSM) is developed by adding central springs to the conventional Mass–Spring Models (MSMs) of tubular structures. This improvement is necessary to model fibers that have enough stiffness so that they do not collapse under transverse loading. Such is the case with many pulp fibers used in papermaking. Four different types of pulp fibers (Aspen CTMP, Aspen BCTMP, Birch BCTMP, and Spruce BKP) were simulated in the study. A geometric model and iMSM of a single fiber were developed, in which the topological structure of iMSM is explained in detail. The mass of mass points and the elastic coefficient of different springs in iMSM were calculated using axial tensile and torsional responses. A dynamic simulation of transverse bending of the fiber over a rigid cylinder and subjected to a transverse pressure was used to determine the effective elastic modulus for four different single fibers and compared to experimental values with an average relative error of 8.49%. The dynamic simulations were completed in 1.04–2.64 min for the four different paper fibers representing sufficient speeds to meet the needs of most real application scenarios. The acceptable accuracy and the fast simulation speed with the developed iMSM fiber model demonstrate the feasibility of the methodology in analyzing paper structures as well as similar fiber-based materials.

Graphical Abstract

1. Introduction

The mechanical properties of paper are generally considered on three various size-scales: sheet-scale, fiber network scale, and fiber scale [1,2]. An underlying assumption of the models is deciding a priori on which size-scale level a continuum is assumed to exist. For example, many sheet-level models assume a planar continuum, ignoring all structural features on scale levels less than the thickness of the sheet. A fiber network scale model assumes that the fiber is a continuum but ignores the cell wall features. The fiber level scale would assume the cell wall is a continuum. Modeling the paper as a continuum and ignoring or incorporating fiber structure into effective properties has advantages for studying the overall effective elastic–plastic behavior [3], viscous effects [4,5], and temperature effects on paper [6,7]. Regarding paper as a fiber network allows one to include geometric factors such as fiber alignment and conformation but requires input of the effective properties of the fiber [8,9,10,11]. As the structural detail of a model increases, the simulation accuracy and computational speed become barriers to practical use. The variability from fiber to fiber is great [12] and a large amount of data is needed to accurately represent the network. Therefore, one looks to modeling the cell wall of the fiber and then creating a network that accounts for the fiber distribution, shape, and conformation even within a fiber.
In early studies of fibers, due to the low computer performances, two-dimensional (2D) models were mainly used to represent a single paper fiber. Describing the single paper fiber as a line or curve, Corte and Balberg studied the statistical geometric properties of paper sheets with a one-layer fiber network [13,14]. To extend the application of the paper structure model, Corte further generated a pseudo-three-dimensional (3D) model by piling up multiple 2D layers, whose essence was the 2D type [13]. Later, based on the 2D paper fiber model, the motion of a pulp fiber in fluid was preliminarily explored [15], and the relationship between the fiber parameters and the statistical geometric properties of paper structure was further studied [16]. In the aforementioned studies, all the developed paper fiber models were assumed as rigid bodies. To further reflect the flexibility and bending properties of the fiber in the paper sheet, Bernoulli beams and Timoshenko model were employed to describe the 2D paper fiber models [17], and then the strain–stress curve of the paper sheet was simulated accordingly [8,18]. Although these 2D paper fiber models could adequately predict some geometric properties (such as pore size, porosity, and several crossings per unit area) of the paper [16,19], it was still difficult to predict the mechanical properties accurately, such as in-plane and ZD tensile strength and tear strength, due to the lack of z-direction description in paper structure.
To overcome the deficiency of 2D paper models, some 3D models have been proposed. Single paper fiber model composed of rigid cylinders linked by ball and socket joints was put forward [20], a kind of pure rigid fiber model was employed to simulate the deposition process of fiber [21], and a kind of virtual network was adopted to build the fiber model [22]. In the recent decade, a coding fiber model was reported, wherein the 3D space of the paper sheet was divided into some continuous cubes and further coded according to the inclusion of fiber or not [23]. However, it should be mentioned that for the simulations with these developed 3D paper models, the shapes of the paper fiber deviated drastically from those of the actual ones, which are flexible and smooth rather than represented by rigid or cube pixels.
With the recent rapid development of computer technology, another effective method for 3D simulation, Finite Element Analysis (FEA), has been widely applied in different fields [24,25], and the simulation accuracy of 3D model has been greatly improved. In the papermaking field, Lavrykov used the Finite Element Model (FEM) to build a fiber model as a hollow tubular structure and further simulated the forming process of a paper sheet by FEA [9]. Although the FEA method used by Lavrykov could simulate the forming process of paper, a long computing time (4 h) and large computer memory (24 GB) were required for a small paper size (1 mm × 5 mm), which is not conducive to efficiency-oriented applications. To decrease the simulation time with FEA, a successful example is the use of three-node quadratic beam elements to model pulp fiber, and the impact of microfibril angle on elastic modulus of the fiber is considered [26]; another improved method is to use Timoshenko model to simplify the modeling of paper fibers [27,28]. Accordingly, the mechanical properties based on the developed 3D paper model, such as elastic modulus, stiffness, and the coefficient of hygroexpansion, were simulated in a few minutes, which was acceptable. However, it is worth noting that, based on the hypotheses made in the Timoshenko model, the cross-section is a rigid body and the established paper fiber model was mainly used for trend analysis rather than quantitative prediction.
In addition to FEA method, another common method for 3D simulation is the Mass–Spring Model (MSM). Compared with FEA, MSM is more suitable for modeling the behavior of soft tissue [29], such as textile [30] and biological soft tissue [31]. Simplifying the internal force and shape of the original model by the spring model and mass model, the simulation speed with MSM has been greatly improved [30,31]. However, the main defect of MSM is its difficulty to accurately convert the simulated material properties (such as elastic modulus, shear modulus, and Poisson’s ratio) into elastic coefficients of the spring model, which affects the simulation accuracy directly. Considering that both the paper fibers and blood vessels are hollow tubular structures, and pulp fibers are also a soft tissue material, it is reasonable to simulate the paper fiber using MSM. Nevertheless, there exist some challenges for modeling materials such as pulp fibers, textile fibers, and blood vessels. Since the combination of multiple fibers were not considered in the textile model [30] and the aspect ratio of a blood vessel model (about 10–20) [31] is much smaller than that of paper fiber model (about 90–600 in our experimental data), the direct application of MSM to develop the paper fiber model requires investigation.
In the present study, an improved MSM (iMSM) method was developed, in which the proposed center springs and the new spring topology can effectively overcome the collapse of pulp fiber experienced in the original MSM [32]. In most of the reports regarding the original MSM [32], a large number of stress–strain experiments and machine learning algorithms were often used to fit the elastic coefficients of spring models; however, this presents difficulty for pulp fibers due to their large flexibility and small size. The focus of the work presented here is to assess the feasibility of a simplified calculation of iMSM parameters (the mass and spring stiffnesses) based on the assumption that the pulp fiber and its mechanical properties were homogeneous. Referring to the experimental fiber properties (the diameter, wall thickness, and elastic modulus of the fiber), the elasticity coefficients of the spring model were calculated by a new calculation model which was developed by the classical mechanical analysis of pulp fibers under the actions of tensile and torsional forces.
The comparison between the numerical results and the experimental data revealed that the developed iMSM pulp fiber model demonstrated a fast simulation speed while allowing simulation accuracy, which will be crucial for the subsequent studies of paper property prediction and the formation mechanism of a paper sheet. The improved Mass–Spring Model and parameter calculation method proposed in this study can be applied to other simulations of thin membranes composed by materials such as glass fibers, carbon fibers and artificial fibers with large flexibility or small size.

2. Methodology

2.1. Modeling of Single Fiber

For this initial study, the following assumptions were made for the single pulp fiber:
(a) The initial form of single fiber is a hollow circular tube.
(b) The material and mechanical properties of the fiber are homogeneous and isotropic.
(c) The width and wall thickness of any cross-sections in one fiber are uniform.
Based on these assumptions, the modeling methods of a single pulp fiber are described as follows.

2.1.1. Geometric Model of Single Pulp Fiber

In the study, as illustrated in Figure 1a, the geometric model of single pulp fiber is built using the following methodology. The fiber is segmented in the length direction and dispersed into multiple points on the cross-section. In addition, although the cross-section of the fiber as a hollow tube is convenient for visual display, it is difficult to store and calculate because of the double-layer structure (shadow area in Figure 1a). For simplification, a skeleton model is utilized as a single layer structure, which is shown as the dark solid points and lines in Figure 1a. Based on the skeleton model, key information of the geometric fiber model can be calculated and stored easily, such as the coordinate positions and deflection angles of the fiber in the spatial coordinate system. Furthermore, the skeleton model can also be developed into the display model by Open Graphics Library (OpenGL) (Figure 1b) for interaction with users.
In the skeleton model of Figure 1a, the fiber is segmented into Nseq segments, and the cross-sections of the fiber model have been discretized as Ndis points. For convenience, the subscripts i = 0, 1, …, Nseq and j = 1, 2, …, Ndis represent the segment indexes and discretized points in the cross-sections, respectively. Based on these notations, the skeleton model of the single fiber can be defined as follows: P(i) and the center point and the normal vector of the ith cross-section; Ro, Ri, and Rm are the outer radius, inner radius, and mean radius of the cross-section of the fiber; l is the length of each segment; p(i)(j) represents the jth discrete point on the ith cross-section.

2.1.2. Mass–Spring Model of Single Pulp Fiber

(1) Topological Structure of Mass–Spring Model
Referring to the report simulating the vascular deformation with MSM [29], two types of springs, the Structure Spring (ST) and the Shear Spring (SS), had been initially used in this study. Based on the geometric model of single fiber in Figure 1a, the topological structure of MSM is built and illustrated in Figure 1c. The red points in Figure 1c represent the mass points, marked as mp(i)(j), and the coordinates of these mass points correspond to the discrete points on the cross-section of the geometric fiber model in Figure 1a. After having fixed the mass points, the STs are used to link the corresponding mass points on two adjacent cross-sections (such as linking mp(i)(j) with mp(i+1)(j)) and link the adjacent mass points on the same cross-section (such as linking mp(i)(j) with mp(i)(j+1)). Similarly, the SSs are used to cross-link the adjacent corresponding mass points on two adjacent cross-sections (such as linking mp(i)(j) with mp(i+1)(j+1) and mp(i+1)(j−1)).
(2) Topological Structure of Improved Mass–Spring Model
Due to the small size of the pulp fiber cross-section, the conventional MSM used in the vascular field is not suitable for pulp fiber modeling, in which the obvious defect of the pulp fiber model with MSM is the insufficient stiffness of the cross-section. To enhance the strength of the cross-section of the pulp fiber model, an improved MSM (iMSM) is proposed by adding one Center Spring (CS) on each cross-section of the fiber, and the topological structure of iMSM is illustrated in Figure 1d. The central points on all the cross-sections in the geometric fiber model have been added in iMSM as mass points, as shown in Figure 1d, and are noted as mp(i)(0). The added CSs are used to link the center mass point with each discrete point on the same cross-section (such as linking mp(i)(0) with mp(i)(j), i = 0, 1, …, Nseq, j = 1, 2, …, Ndis), where Nseq and Ndis represent the numbers of segments and discrete points of fiber model, respectively.
The choice of using the center springs versus, for example, distributing the mass through the cell wall thickness was to keep computational efficiency. The goal is to use the iMSM fiber model as a single fiber in a sheet of paper, where the in-plane cell-wall properties and the geometry of the fiber are most important. The iMSM method provides a computationally efficient method to allow fiber modeling along the length without specifically modeling the cell wall thickness. The properties of fiber cell wall thickness can be replaced by the center springs in certain application scenarios.
The alternative method would be to further distribute the mass through the thickness of the fiber cell wall and add additional springs connecting adjacent mass points. The iMSM method was chosen over this approach for computational efficiency.

2.1.3. Parameters Calculation Model of iMSM

(1) Mass of Mass Points in iMSM
In the study, the fiber mass is considered to be uniformly distributed. Hence, the mass of each mass point can be fixed to a constant value.
Assuming that the coarseness of the paper fiber is c (set as an empirical value of 0.15 mg/m in the present study) and the length of the segment of the fiber geometric model is l, the average mass of the mass points in the segment can be calculated as
m = c   l 2   N d i s  
Because the mass points in the middle cross-sections of the fiber model belong to two segments, the mass of these mass points are twice that of the mass at points on the cross-sections at both ends of the fiber. Moreover, since the central points of the cross-sections in the geometric fiber model are virtual, the masses of the central points are set to zero.
(2) Spring Coefficient of Spring Model in iMSM
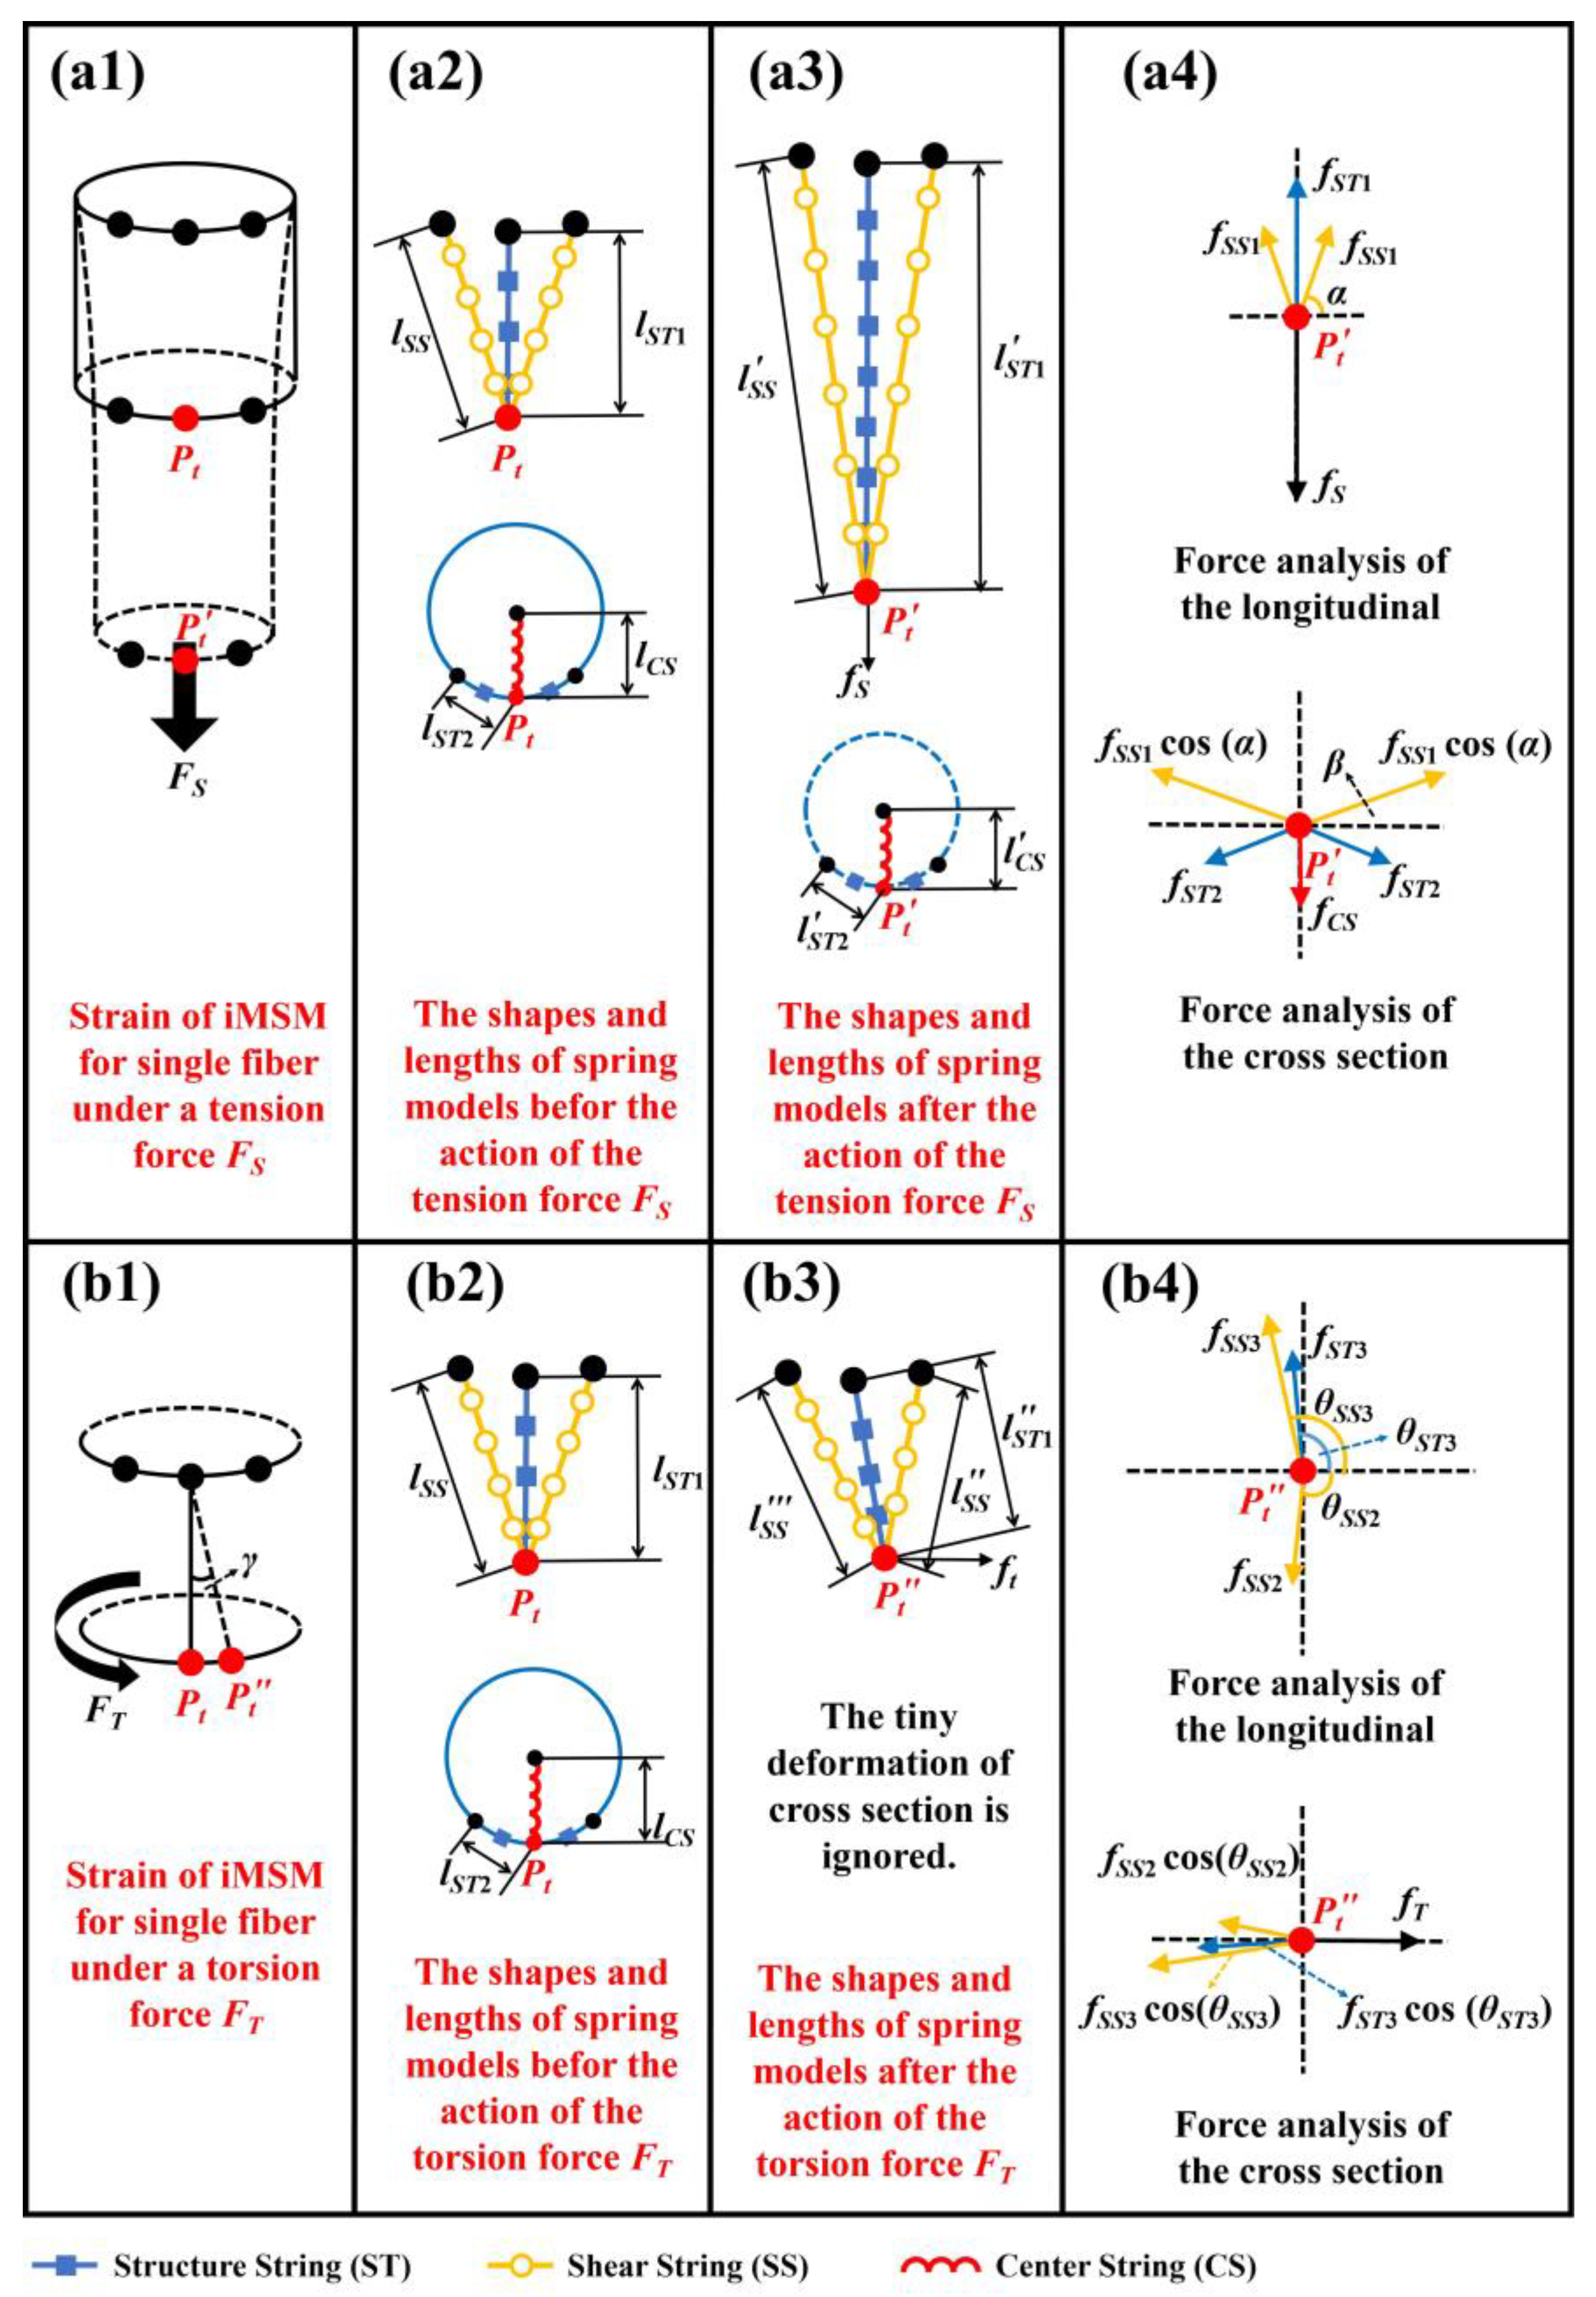
The spring coefficients of the spring model in iMSM are calculated based on the classical theoretical analyses of stress–strain, tension, and torsion in the field of solid mechanics [33]. The detailed strains under external forces are illustrated in Figure 2.
In Figure 2(a1), assuming that one fiber segment receives a tension force FS and the average tension force of each mass point on the cross-section is fs, the length of the fiber segment increases and the diameter of the cross-section of the fiber segment decreases. Based on the definitions of elastic modulus E and Poisson’s ratio μ, the length l of the fiber segment and the diameter d of the cross-section can be calculated as
E = F S   l l   l + l = F S   l E μ = l l   d d   d + d = d + l   μ   d l
where S is the original area of the cross-section of the fiber segment, Δl and Δd are the variations in the length and diameter of the fiber segment under the action of the tension force FS, respectively.
In Figure 2(a1–a4), achieving the force balance for the fiber segment means achieving the force balance among all the spring forces (fSS1, fST1, fST2) and the tension force (fS) for each mass point. As the fiber segment model is highly symmetrical, it is sufficient to analyze the force balance on any mass point. Taking the mass point Pt as an example, Pt and Pt are the same mass points before and after the action of tension force fS. Based on the iMSM of the fiber model defined in Figure 1d, the spring shapes and lengths before and after the action of fS are illustrated in Figure 2(a2,a3). Accordingly, the force balance analysis of mass point Pt on the length direction and cross-section are shown in Figure 2(a4), which can be expressed as
  f S = f S T 1 + 2 f S S 1 sin α f C S + 2 f S T 2 sin β = 2 f S S 1 cos ( α ) sin ( β )   where     f S T 1 = k S T Δ l S T 1 = k S T   l S T 1 l S T 1 f C S = k C S Δ l C S = k C S   l C S l C S             f S T 2 = k S T Δ l S T 2 = k S T   l S T 2 l S T 2 f S S = k S S Δ l S S 1 = k S S   l S S l S S            
In Figure 2(b1), the fiber segment under a torsion force FT can be analyzed. For a rod object, the applied FT will produce a pure shear force (fT) on the cross-section, and then according to the definition of shear modulus G in material mechanics [34], the deformation of the fiber segment under the applied FT can be calculated as
f T s = G   γ         f T = G   γ   s  
where fT is the shear force imposed on each mass point of the lower cross-section in Figure 2(a1,b1), γ is the deflection angle, and s is the area represented by each mass point, which is calculated by averaging the total area on the paper fiber cross-section.
Similarly, taking the mass point Pt as an example, Pt and Pt are the same mass points before and after the action of FT (Figure 2(b2,b3)). As illustrated in Figure 2(b4), the force balance on the mass point Pt can also be analyzed by the spring forces (fSS2, fSS3, fST3) and the shear force (fT) which are given in Equation (5):
  f T = f S S 2 cos θ S S 2 + f S S 3 cos θ S S 3 + f S T 3 c o s ( θ S T 3 )   where     f S S 2 = k S S Δ l S S 2 = k S S   l S S l S S           f S S 3 = k S S Δ l S S 3 = k S S   l S S l S S             f S T 3 = k S T Δ l S T 3 = k S T   l S T 1 l S T 1  
In Equations (3) and (5), the three unknown spring coefficients (kST, kCS, kSS) can be solved with the three simultaneous equations (two equations in Equation (3) and one equation in Equation (5)).

2.2. Simulating Single Pulp Fiber Properties Based on iMSM

2.2.1. Calculation Model of iMSM

To simulate the properties of single pulp fiber with iMSM, employing the calculation model of the second-order ordinary differential equation (ODE), the evolution process of the mass point under different forces was calculated. Obeying Newton’s law, the second-order ODE is given in Equation (6):
X ( t ) ¨ = F ( t ) m  
where X, m, and F are the position and mass of one mass point, and the resultant force acting on one mass point, respectively. In this case, the resultant force F results from external forces Fext and spring forces Fspring, which can be written as
F = F e x t + F s p r i n g = F e x t + i = 1 S k i v i 1 t v i 2 t l i 0 v i 1 t v i 2 t v i 1 t v i 2 t
In Equation (7), Fext is the resultant force of external forces (such as gravity, pressure, and tensile force) exerting on the mass point, and Fspring is the resultant force of the spring forces acting on the mass point which is time-dependent, since the lengths of the springs vary with the movements of the mass points. In addition, referring to Figure 2, in Equation (7), S represents the number of springs linked to the mass point, thus all the springs linked to the mass point are indexed by i = 1, 2, …, S. vi1 and vi2 are the moving speeds of the two mass points connected by the ith spring, t is the moving time, and li0 and ki are the initial length and spring coefficient of the ith spring (ST, SS, and CS). The notation li0 is defined according to the initial structure of iMSM in Figure 1d, and ki is calculated by the force analysis methods introduced in Section 2.1.3.

2.2.2. Solving Method of Calculation Model of iMSM

To solve the second-order ODE of the calculation model of iMSM in Equation (6), it is decomposed as a system of two first-order ODEs as
X v ˙ = v F   m 1  
Then, the system of Equation (8) can be integrated by any efficient numerical method solving ODEs, such as explicit or implicit one-step methods, or multi-step predictor–corrector methods. In the study, the explicit Runge–Kutta fourth-order method was applied.
After calculating all the mass points of one fiber model at each time t, the dynamic response of the single paper fiber under external force can be obtained.

3. Modeling and Simulation of Single Paper Fiber

3.1. Modeling Parameters of Single Paper Fiber

In the study, all the modeling parameters for single pulp fibers were collected from the literature [35,36], which include the fiber properties of aspen chemi-thermomechanical pulp (CTMP), aspen bleached chemi-thermomechanical pulp (BCTMP), birch BCTMP, and spruce bleached spruce kraft pulp (BKP). The morphological and mechanical properties of the above four single pulp fibers, including the fiber diameter d, wall thickness w, coarseness c, elastic modulus E, Poisson’s ratio μ, and shear modulus G, are listed in Table 1.
Among these fiber properties in Table 1, the properties of d and w of paper fibers were measured by the fiber analyzer (MorFi Neo). After having been diluted to a concentration of 0.03%, the fiber suspensions were introduced into the fiber analyzer, and then these paper fiber properties (d, w) were obtained automatically. The elastic modulus E of fiber was determined by the experiment of beam bending under transverse loads [33], whose characterization method is presented in the supplemental information (SI). The shear modulus G of fiber was estimated using that of an isotropic material given in Equation (9) [34]:
G = E 2 × 1 + μ  
where μ is the Poisson’s ratio of the pulp fiber which was considered as a constant of 0.2 in the present study [36].

3.2. Preliminary Simulation with MSM and iMSM

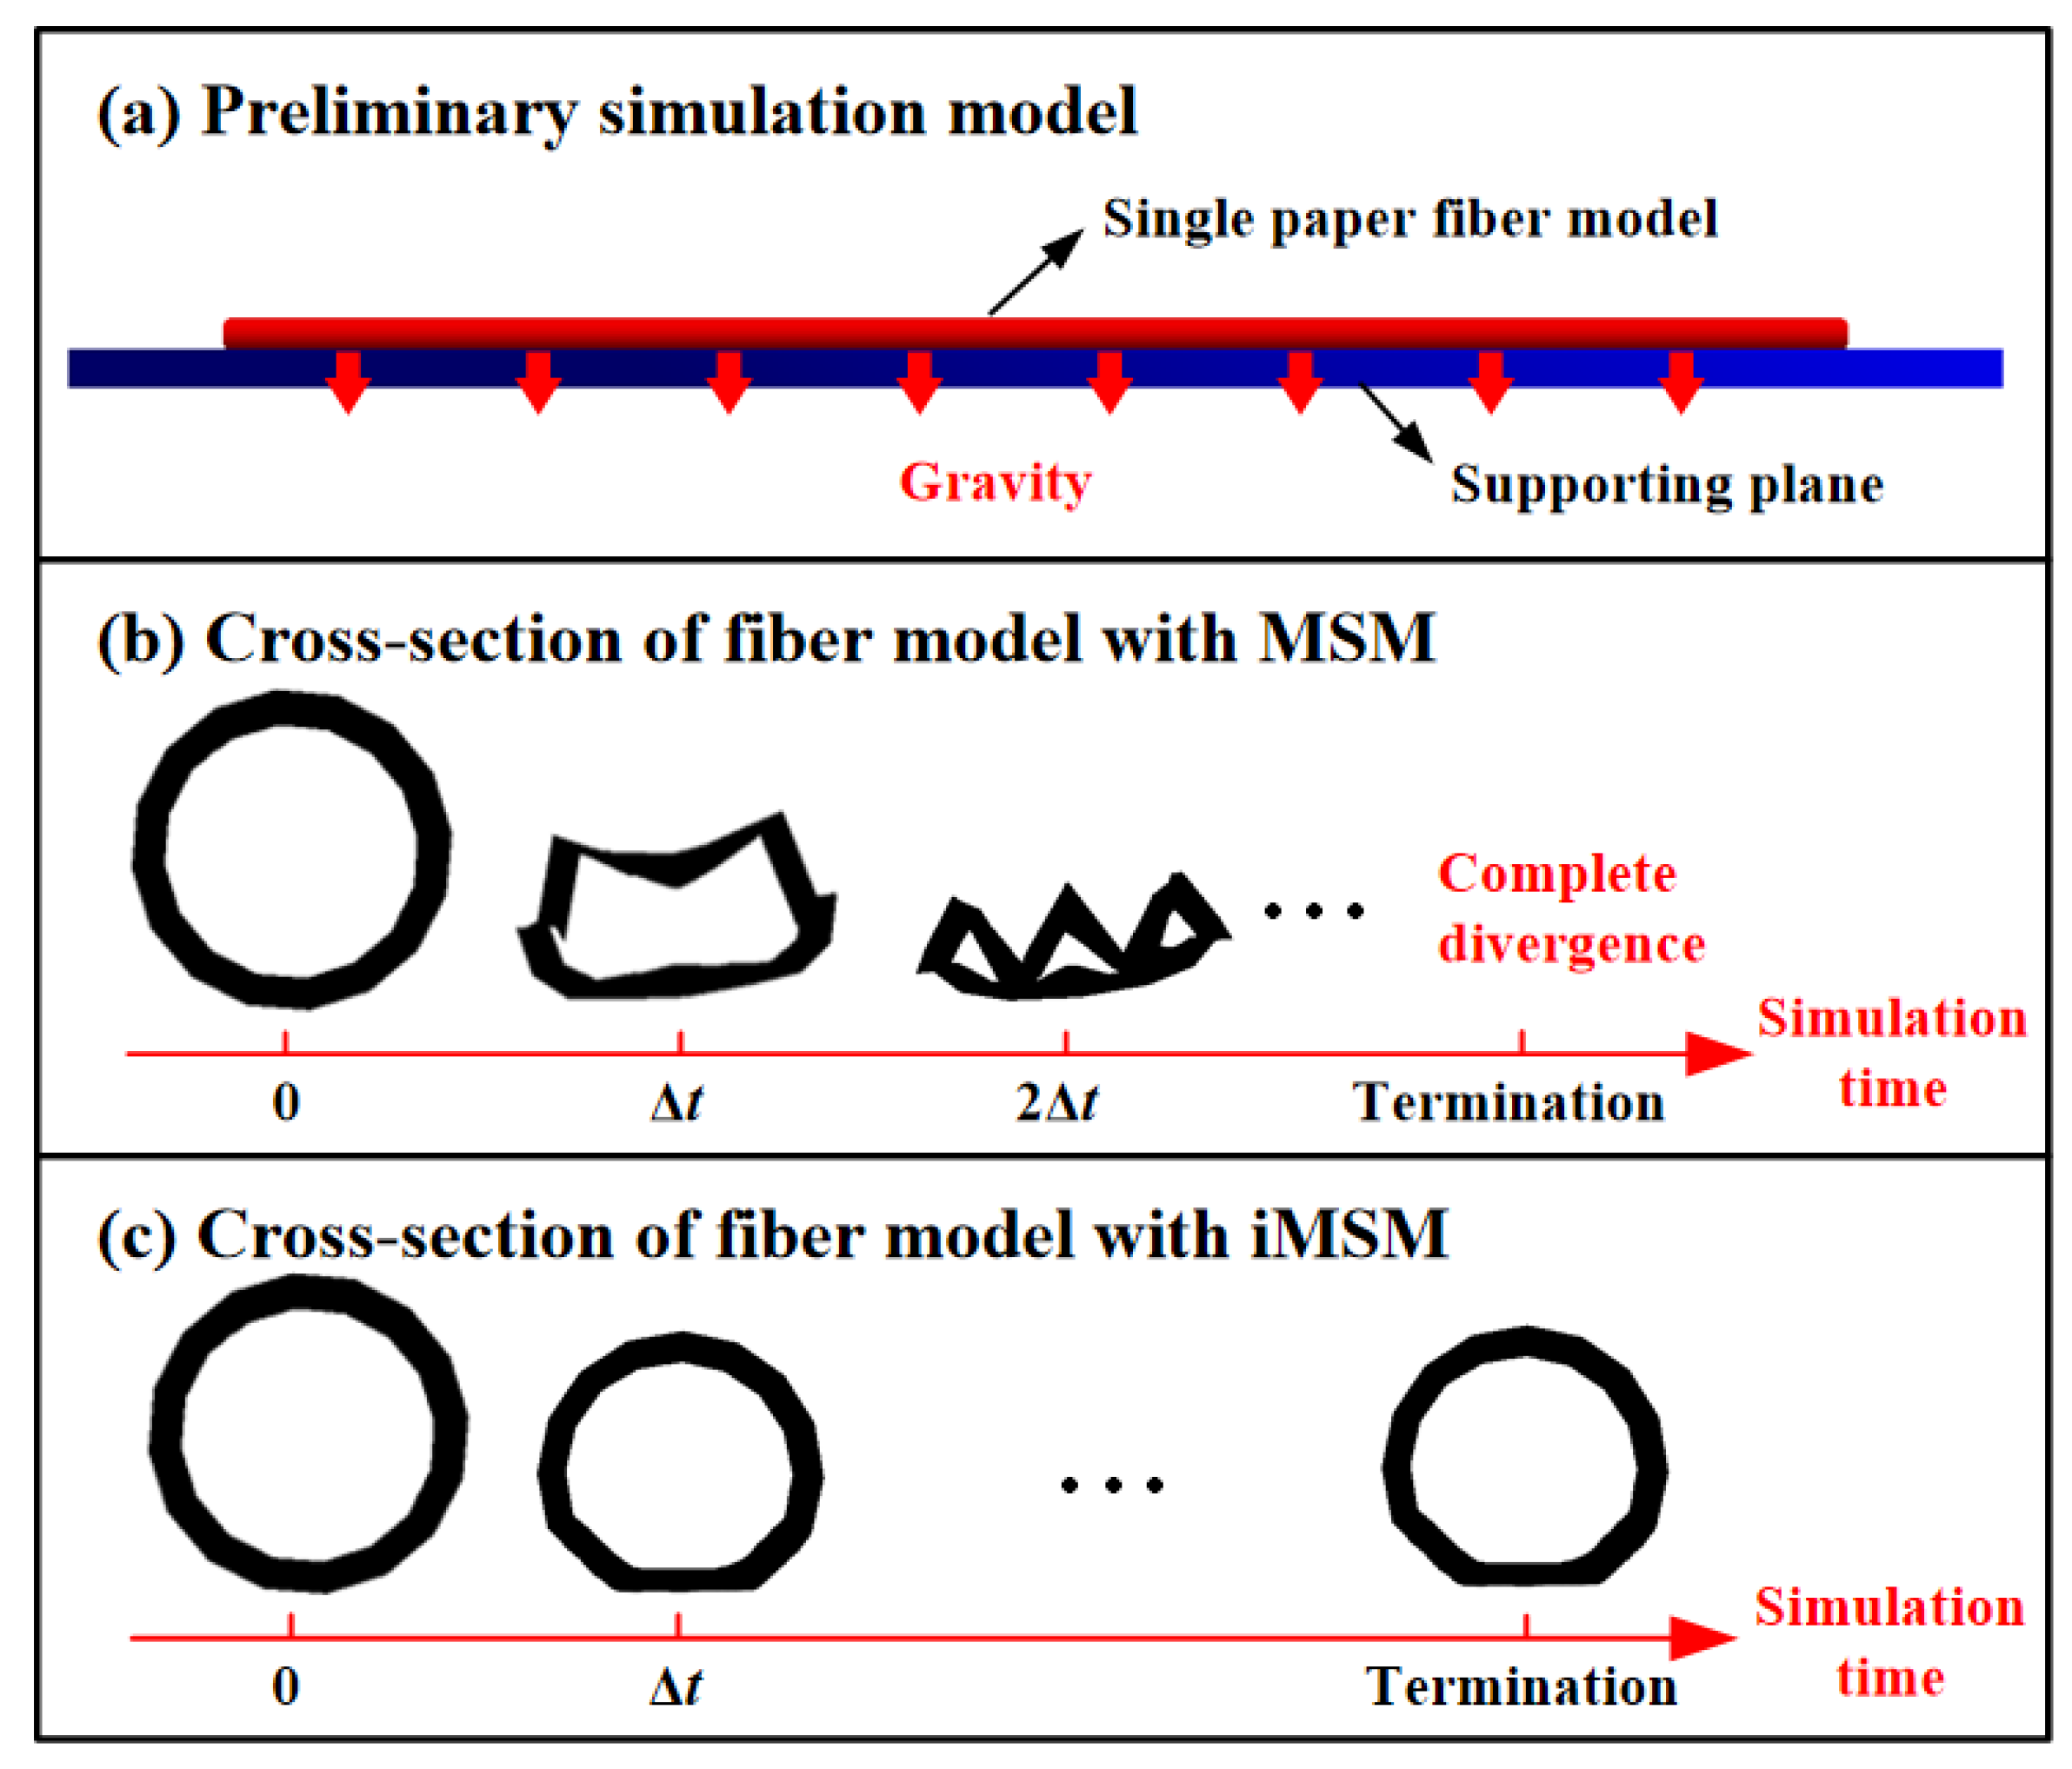
With the methods described in Section 2.1.1 and Section 2.1.2, the MSM and iMSM models for paper fiber were developed, respectively. To compare the performance of the developed MSM and iMSM models, a preliminary simulation of the cross-sectional deformation under gravity was first conducted (Figure 3a), and the comparison results are shown in Figure 3b,c.
The simulation results in Figure 3b,c show that the application of MSM is prone to cause the collapse of the cross-section of the fiber model (Figure 3b). The simulation with the MSM fiber model is completely divergent after two simulation steps 2Δt. This collapse occurs because the model MSM model does not account for any stiffness in the radial direction which is essentially a membrane structure. By adding the center springs in iMSM, the cross-section strength of the fiber model is retained, and the shape of the fiber cross-section only changes slightly (Figure 3c) until the termination of simulation. It is well known that, under the actions of gravity and plane support force (like the paper fiber shown in Figure 3a), the cross-section of a flexible tube should deform only slightly. The simulation results of iMSM shown in Figure 3c demonstrate that the developed iMSM model effectively overcomes the collapse of MSM by adding the center springs, whose performance is aligned with expectations.

3.3. Modeling Results of Single Fiber Model with iMSM

Based on the determined properties of four different paper fibers (Table 1) and the modeling methods of iMSM (Section 2.1), the main parameters of iMSM (the masses of mass points and the spring coefficients) were calculated. Due to the property differences in the studied four paper fibers, in the simulation, the numbers of the segments Nseq and the discrete points on the cross-section Ndis for the different paper fiber models were set differently. Considering the calculation speed and accuracy of simulation, the values of Nseq and Ndis were determined by a trial-and-error method, and the numbers of mass points Nmp and springs Ns based on Nseq and Ndis were calculated accordingly. The obtained simulation parameters used in iMSM for the four paper fibers are put in Table 2, and the simulation parameters used in iMSM are explained as follows.
(1) Referring to the experience and pre-tests, the discrete points Ndis on the cross-section for thick paper fiber (Aspen CTMP and Birch BCTMP) and thin paper fiber (Aspen BCTMP, Spruce BKP) were set as 32 and 16, respectively.
(2) For obtaining the spring elastic coefficients of ST, SS, and CS in iMSM for different types of paper fiber, the numbers of segments Nseq were set regarding the segmented lengths of different paper fiber models (Figure 1d), and then the elastic coefficients of different types of spring model were calculated by Equations (4) and (6) accordingly. Prior to the calculation, the determination rules of Nseq include the following: (a) all the obtained elastic coefficients cannot be negative due to its physical definition; (b) the elastic coefficient difference in the three spring models (ST, SS, and CS) should be small to facilitate the determination of simulation step Δt [37]; (c) Nseq should be small on the premise that Rules (a) and (b) are satisfied to reduce the numbers of mass point and spring (Nmp and Ndis) and improve the simulation speed.
(3) The number of mass points (Nmp) and the number of springs (Ns) were calculated by Equations (10) and (11).
N m p = N s e q + 1 × N d i s  
N s = 4 · N s e q × N d i s  

3.4. Validating Single Fiber Model with iMSM

3.4.1. Validating Model with iMSM
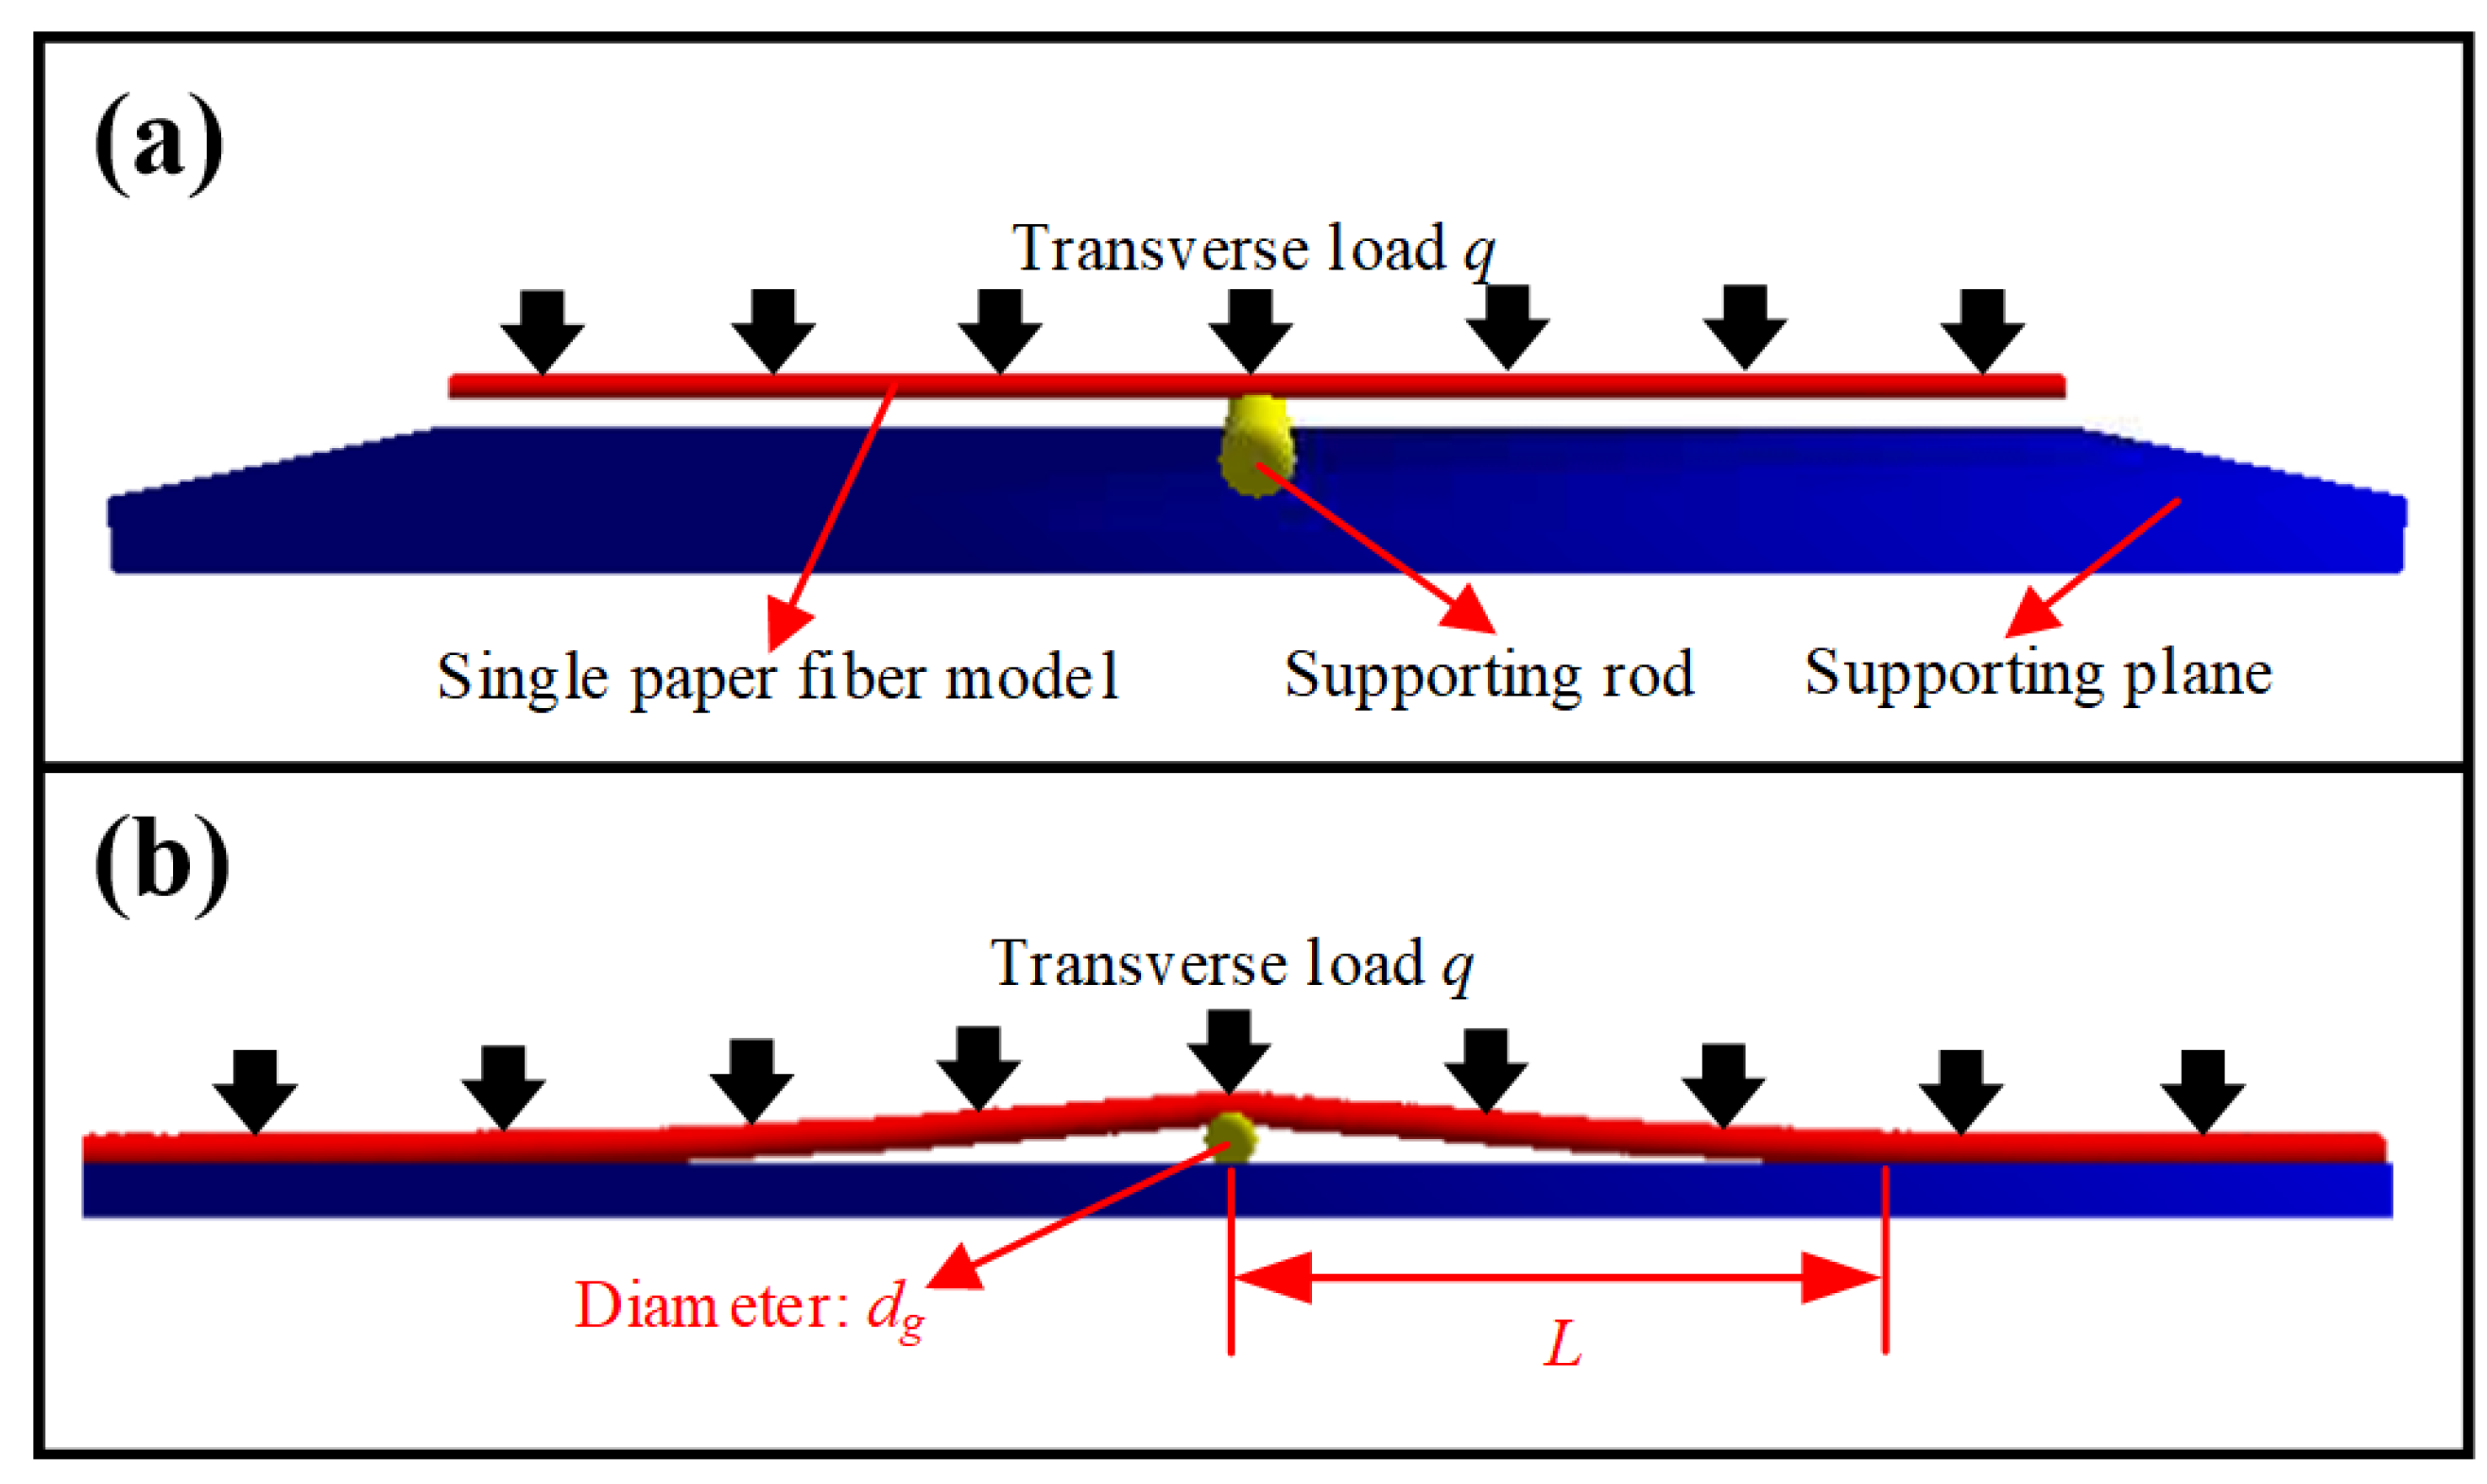
With the method explained in Section 2.2, the iMSM for a single fiber model has been developed and can be further used to simulate the properties of single fiber, which include the length l, diameter d, coarseness c, the elastic modulus E, Poisson’s ratio μ, and shear modulus G. As the values of l, d, and c of the single paper fiber can be directly set by the experimental results, these properties are not necessary for verification. However, in general, the elastic modulus E is an important mechanical property for materials [33]. In the present study, since the elastic modulus E of paper fiber is indirectly represented by the spring coefficients in the developed iMSM, the simulation results are verified with the experimental elastic modulus of paper fiber.
To verify the elastic modulus of single paper fiber, Yan’s work [33] was used as a reference, whose experimental details are presented in Supplemental Information. Referring to Yan’s method simulating the elastic modulus of single paper fiber, in the study, the validation model is designed as three parts (Figure 4):
(1) The top part is a hollow tube model, which represents single pulp fiber. Since the length of the fiber has little effect on its elastic modulus, the lengths of different fibers in the simulations were set as 500 μm uniformly.
(2) The middle yellow part is a solid cylinder, which represents a supporting rod (such as glass fiber). The diameter and the length of the supporting rod were uniformly set as 10 μm and 200 μm, respectively.
(3) The bottom part is a cuboid, which acts as a supporting plane (like a sliding glass). The size of the supporting plane was defined as 500 × 200 × 10 μm.
Figure 4. (a) Validation model and (b) final state for simulating the elastic modulus of single paper fiber with iMSM.
Solids 06 00050 g004
Imitating the laboratorial measuring method, as demonstrated in Figure 4a, applying one downward transverse load q evenly on the target single paper fiber model, solving with the Runge–Kutta fourth-order simulation method, the modeled paper fiber moved downward under the action of transverse load. Finally, the modeled paper fiber hung over the rod and formed a span L with the plane (Figure 4b), owing to the supporting actions of the supporting rod and the plane. Referring to Yan’s work [33], the elastic modulus E of the paper fiber model was calculated by the span L, diameter dg of the supporting rod, and the transverse load q, whose calculation details are presented in Supplemental Information.
It should be mentioned that, in the actual experiment, the determination of the elastic modulus of single paper fiber is effective only when the target single fiber hangs over the supporting rod perpendicularly [36]. To simplify the simulation, the angle between the single fiber and the supporting rod in the simulation model was the default value of 90°, and the shape of the fiber was straight rather than bent.
In addition, it is necessary to conduct collision detections for the single paper fiber model and the supporting rod model or the supporting plane model during simulation. Since the simulation models of fiber, supporting rod, and supporting plane are regular, it is liable to calculate any coordinates on the surfaces of these models. Accordingly, the relationship between the coordinates of mass points on the fiber model and those of other models’ surfaces can be obtained and used to evaluate their collisions. To simplify the calculation process, it is also assumed that all the collisions between different objects are complete elastic collisions, that is to say, when the mass points occur collision with the other model surface, its velocity remains unchanged but its velocity direction is reversed.

3.4.2. Evaluation Criterion for Model Validation

To evaluate the simulation results of the validation model, a relative error criterion RE was employed as Equation (12).
R E = E ^ E E × 100 %
where  E ^  and E are the simulation and experimental values for the elastic modulus of the fiber, respectively.

3.4.3. Determination of the Simulation Step

It has been widely accepted that the simulation step Δt plays an important role in simulation. Therefore, some pre-tests were conducted to determine the suitable simulation step Δt prior to the model validation.
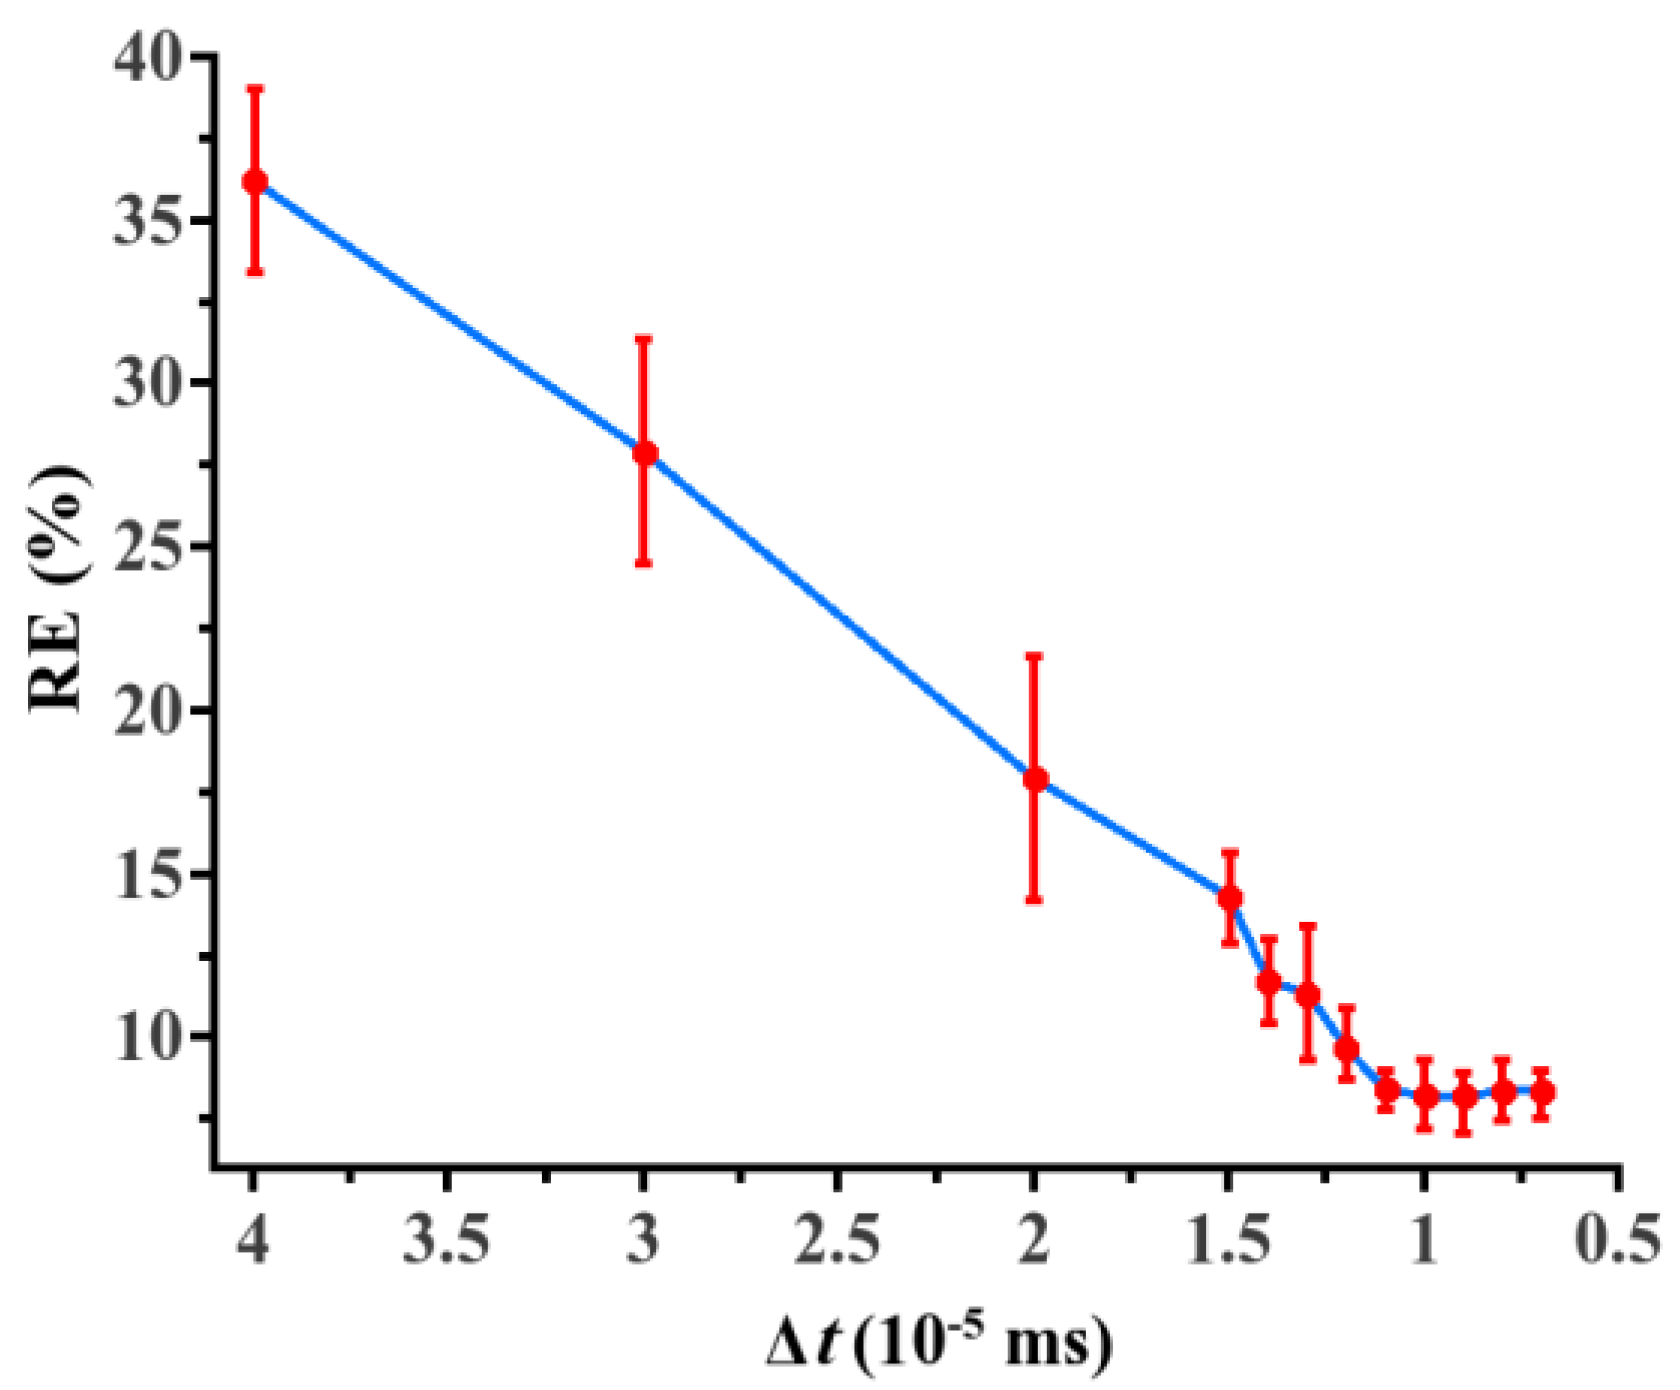
In the pre-tests, by applying different simulation step Δt, all the applied transverse loads on the four different types of fiber were set as 1.5 μN·μm−1, and the obtained average REs for the elastic modulus of the different paper fibers are plotted in Figure 5. It is obvious that, when Δt is less than 1 × 10⁻⁵ ms, the obtained RE becomes stable at as low as 9%. Thus, in the subsequent simulation, the simulation step Δt was set as 1 × 10⁻⁵ ms.

3.5. Validating the Response of a Single Paper Fiber Model with iMSM

For this feasibility study, the validation of the fiber model using iMSM is based on the following two criteria.
(1) The simulated dynamic conformation of a single fiber pressed over the glass rod produces a deformed morphology without full fiber collapse or excessive distortion.
(2) The calculated effective elastic modulus of the fiber model based on the dynamic simulation is comparable to the calculated elastic modulus from the experimental results.

3.5.1. Fiber Morphology Verification During Dynamic Simulation Process

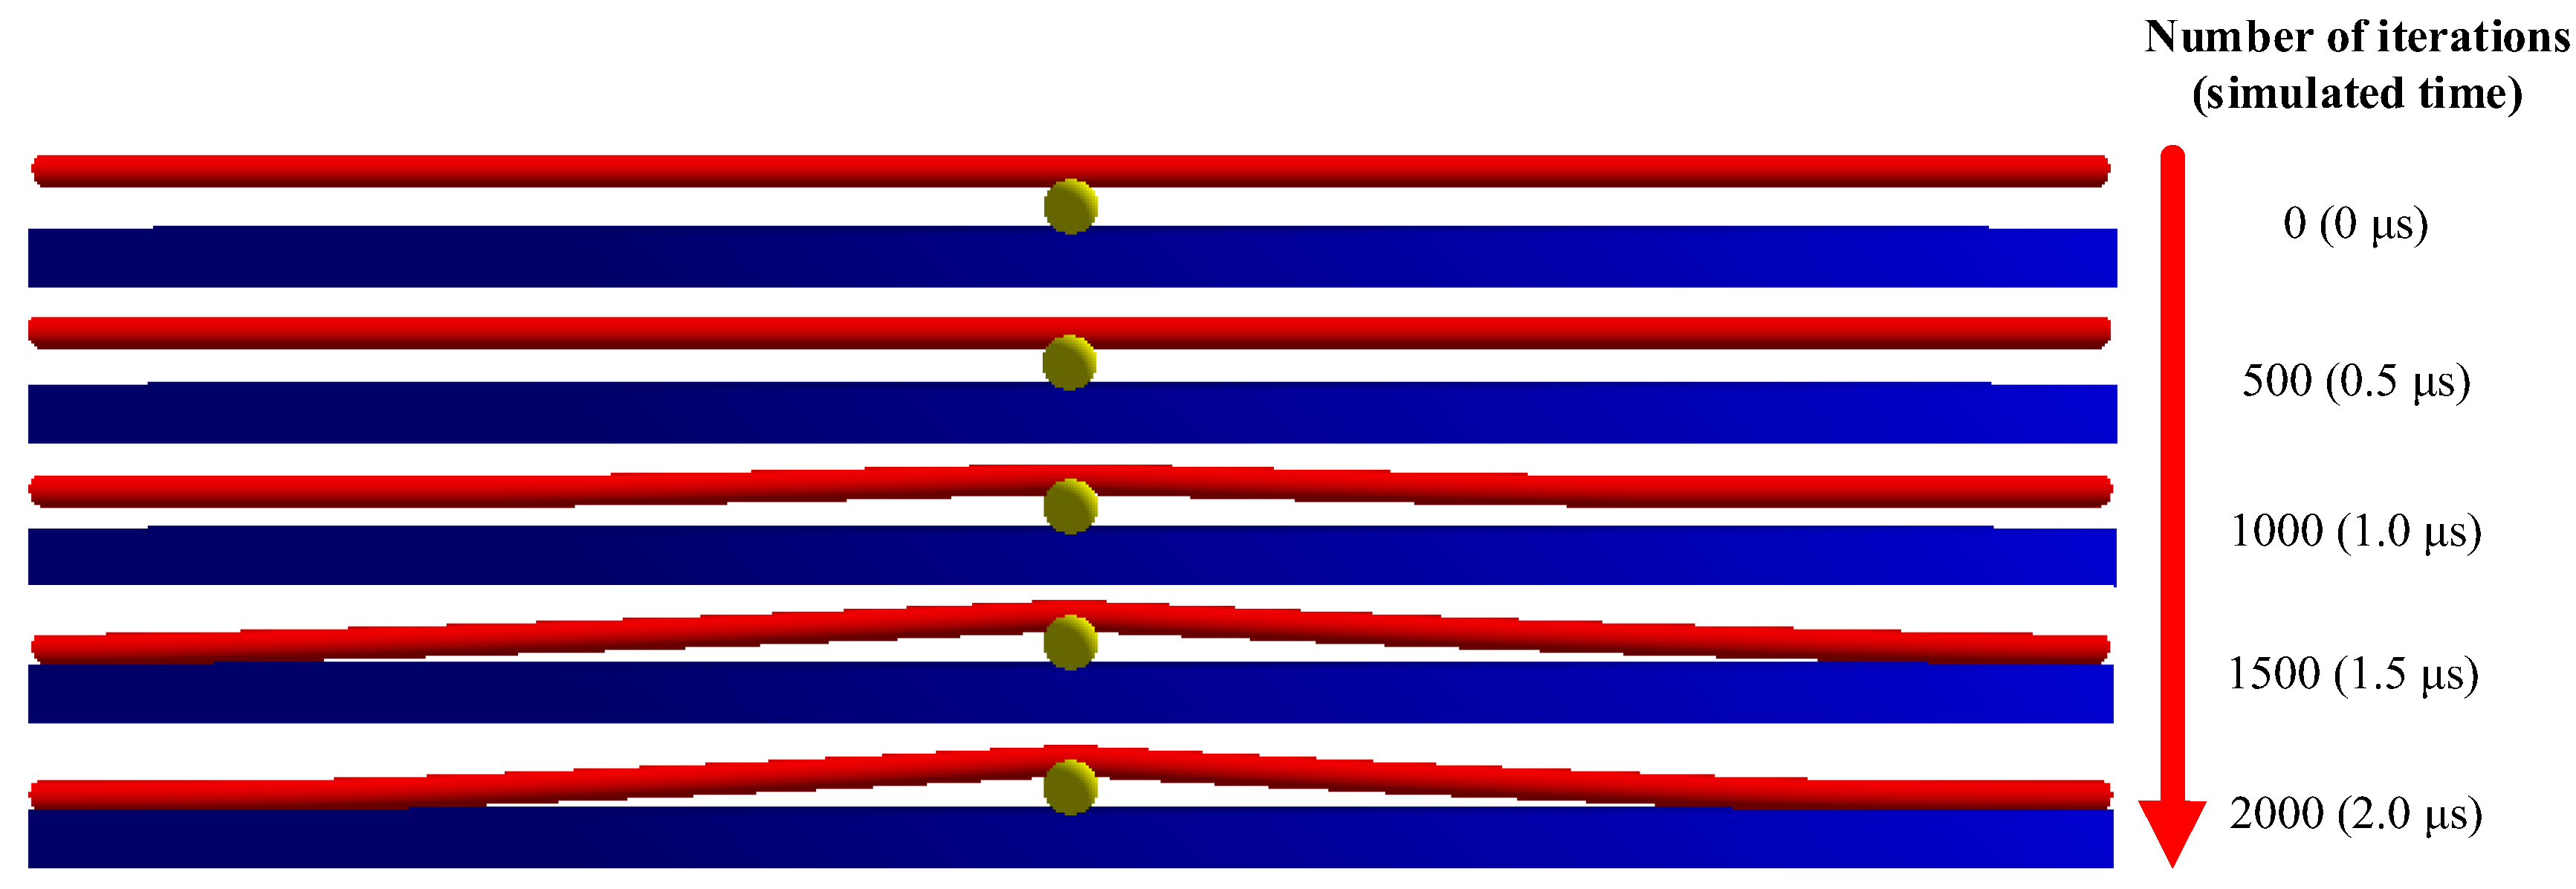
Using the validation model presented in Section 3.4.1 for the Aspen CTMP fiber under the action of the external transverse load q of 1.0 μN·μm−1, a dynamic simulation was conducted, and the result is shown in Figure 6. The simulation process for the single Aspen CTMP fiber was terminated after 2000 iterations because static equilibrium had been reached. Based on the final simulated shape of the Aspen CTMP fiber, the elastic modulus E of Aspen CTMP fiber was calculated as 15.9 GPa.
Furthermore, to verify the applicability of the developed iMSM and improve the credibility of the model, more simulations were conducted under different external transverse loads q (1.0, 1.5, 2.0, and 2.5 μN·μm−1) on the same single paper fiber model, and the final simulation results for the Aspen CTMP fiber under different transverse loads q are displayed in Figure 7.

3.5.2. Single Fiber Model Elastic Modulus Verification

Similar to the above validation of iMSM for the Aspen CTMP fiber in Section 3.5.1, the iMSM for the studied four types of single paper fiber in Table 1 were further validated, and their simulated elastic modulus  E ^ were calculated and compared with the experimental ones, whose verification results are listed in Table 3.
In Table 3, regarding the four types of single fiber, the averaged relative error RE of E calculated by iMSM is about 8.49%, (range is between 7.60% and 10.49%), showing an acceptable accuracy for simulation. Furthermore, the simulated values,  E ^ , have the same sorted ranking from maximum to minimum as the experimental E (Aspen CTMP > Birch BCTMP > Aspen BCTMP > Spruce BKP) with that of the experimental results, and also the values close to the experimental E. It demonstrates that the developed iMSM models for different types of paper fiber can effectively represent the fiber properties, which is meaningful for paper fiber simulation. In addition to the aforementioned acceptable simulation accuracy uncovered in Table 3, the reasonable simulation time of 1.04–2.64 min is positively correlated with the obtained numbers of mass points (Nmp) and mass springs (Ns) for the iMSM paper fiber model (Table 2). These relatively fast simulation speeds are highly significant for real application scenarios, such as modeling the formation of a sheet of paper and the subsequent mechanical properties of paper. Therefore, although this study focuses on the modeling of single paper fiber, the achieved acceptable simulation accuracy and fast simulation speed will be very crucial for the subsequent paper structure simulation and paper sheet property prediction.

4. Conclusions and Perspective

This work proposed an improved Mass–Spring Model (iMSM) for modeling and simulating a single fiber. Four different types of pulp fibers (Aspen CTMP, Aspen BCTMP, Birch BCTMP, and Spruce BKP) with different properties were simulated with iMSM. The model utilizes fiber properties, including the diameter d, wall thickness w, coarseness c, elastic modulus E, Poisson’s ratio μ, and shear modulus G. The main contribution of this work is to demonstrate that the addition of center springs (CSs) to the commonly utilized Structure Spring (ST) and the Shear Spring (SS) avoids the collapse on the cross-section of paper fiber model observed with conventional MSM. A methodology to determine the parameters for the iMSM models based on axial tension and torsion tests was developed to verify the accuracy and practicability of the developed iMSM fiber model, the bending experiments of beams under transverse loads was conducted to determine the effective elastic modulus E for four different single paper fibers. The simulation results showed that the effective elastic modulus obtained from a dynamic simulation using the iMSM model for four different types of pulp fibers resulted in a relative error RE of 8.49% (ranges from 7.60% to 10.49%). This is an acceptable accuracy for modeling and simulation. In addition to the acceptable simulation accuracy, the simulation times of 1.04 to 2.64 min is sufficiently fast to meet the needs of most real application scenarios.
These study results demonstrate that possessing the advantages of accuracy and speed simultaneously, the improved Mass–Spring Model has the potential to be used for the subsequent modeling and simulating of paper structures with a myriad of fiber properties and geometric configurations. In addition, the improved Mass–Spring Model and parameter calculation method proposed in this study can act as a reference to the simulations of similar materials with large flexibility and/or small diameters, such as glass fibers, carbon fibers, and artificial fibers.

Supplementary Materials

The following supporting information can be downloaded at: https://www.mdpi.com/article/10.3390/solids6030050/s1, Measurement of the Elastic Modulus of Single Paper Fiber [33,34,38,39].

Author Contributions

Methodology, Y.L. and W.S.; software, Y.L.; validation, Y.L.; investigation, Y.L.; writing—original draft, Y.L.; writing—review and editing, W.S., D.W.C., T.S., J.-F.B. and J.-P.C.; supervision, W.S.; project administration, Y.L., W.S. and T.S. All authors have read and agreed to the published version of the manuscript.

Funding

This research was funded by the National Key Research and Development Program of China (Grant No. 2022YFF0607201), Project to Attract Foreign Experts by MOST (Grant No. G2022163012L), and the Guangdong University Young Innovative Talents Program Project, China (Grant No. 2024KQNCX086).

Data Availability Statement

The original contributions presented in this study are included in the article/supplementary material. Further inquiries can be directed to the corresponding author.

Acknowledgments

The authors appreciate the support provided by Printing and Packaging New Materials and Intelligent Anti-Counterfeiting Engineering Technology (Development) Center of the Guangzhou Vocational and Technical University of Science and Technology, the Open Regional Industry Education Integration Practice Center for Digital Printing Engineering Majors of Guangzhou Vocational, and the Technical University of Science and Technology.

Conflicts of Interest

There are no conflicts of interest exists in the submission of the manuscript, and the manuscript is approved for publication by all authors.

References

  1. Simon, J.-W. A Review of Recent Trends and Challenges in Computational Modeling of Paper and Paperboard at Different Scales. Arch. Comput. Methods Eng. 2020, 28, 2409–2428. [Google Scholar] [CrossRef]
  2. Kortschot, K. The role of the fibre in the structural hierarchy of paper. In The Fundamentals of Papermaking Materials; Baker, C.F., Ed.; Symp: Cambridge, UK, 1997; pp. 351–399. [Google Scholar]
  3. Hagman, A.; Nygårds, M. Thermographical Analysis of Paper During Tensile Testing and Comparison to Digital Image Correlation. Exp. Mech. 2016, 57, 325–339. [Google Scholar] [CrossRef]
  4. Fadiji, T.; Coetzee, C.J.; Opara, U.L. Analysis of the creep behaviour of ventilated corrugated paperboard packaging for handling fresh produce—An experimental study. Food Bioprod. Process. 2019, 117, 126–137. [Google Scholar] [CrossRef]
  5. Hussain, S.; Coffin, D.W.; Todoroki, C. Investigating Creep in Corrugated Packaging. Packag. Technol. Sci. 2017, 30, 757–770. [Google Scholar] [CrossRef]
  6. Linvill, E.; Östlund, S. The Combined Effects of Moisture and Temperature on the Mechanical Response of Paper. Exp. Mech. 2014, 54, 1329–1341. [Google Scholar] [CrossRef]
  7. Köstner, V.; Ressel, J.; Sadlowsky, B.; Borocz, P. Measuring the creep behaviour of corrugated board by cascade and individual test rig. J. Appl. Pack Res. 2018, 10, 46–61. [Google Scholar]
  8. Bronkhorst, C. Modelling paper as a two-dimensional elastic–plastic stochastic network. Int. J. Solids Struct. 2003, 40, 5441–5454. [Google Scholar] [CrossRef]
  9. Lavrykov, S.; Ramarao, B.V.; Lindström, S.B.; Singh, K.M. 3D network simulations of paper structure. Nord. Pulp Pap. Res. J. 2012, 27, 256–263. [Google Scholar] [CrossRef]
  10. Kulachenko, A.; Uesaka, T. Direct simulations of fiber network deformation and failure. Mech. Mater. 2012, 51, 1–14. [Google Scholar] [CrossRef]
  11. Tojaga, V.; Kulachenko, A.; Östlund, S.; Gasser, T.C. Modeling multi-fracturing fibers in fiber networks using elastoplastic Timoshenko beam finite elements with embedded strong discontinuities—Formulation and staggered algorithm. Comput. Methods Appl. Mech. Eng. 2021, 384, 113964. [Google Scholar] [CrossRef]
  12. Timm, H.; Stegemann, J.; Küppers, M. Photosynthetic induction strongly affects the light compensation point of net photosynthesis and coincidentally the apparent quantum yield. Trees 2001, 16, 47–62. [Google Scholar] [CrossRef]
  13. Corte, H.; Kallmes, O.J. Statistical geometry of a fibrous network. In The Formation and Structure of Paper; Bolam, F., Ed.; FRC: Manchester, UK, 1961; pp. 13–46. [Google Scholar]
  14. Balberg, I.; Binenbaum, N. Computer study of the percolation threshold in a two-dimensional anisotropic system of conducting sticks. Phys. Rev. B 1983, 28, 3799–3812. [Google Scholar] [CrossRef]
  15. Stockie, J.M.; Green, S.I. Simulating the Motion of Flexible Pulp Fibres Using the Immersed Boundary Method. J. Comput. Phys. 1998, 147, 147–165. [Google Scholar] [CrossRef]
  16. Eichhorn, S.J.; Sampson, W.W. Statistical geometry of pores and statistics of porous nanofibrous assemblies. J. R. Soc. Interface 2005, 2, 309–318. [Google Scholar] [CrossRef]
  17. Deng, M.; Dodson, C. Paper: An Engineered Stochastic Structure; Tappi Press: Atlanta, GA, USA, 1994. [Google Scholar]
  18. Kahkonen, S. Elasticity and Stiffness Evolution in Random Fiber Networks. Master’s Thesis, University of Jyvaskyla, Westphalia, Finland, October 2003. [Google Scholar]
  19. Sampson, W.W. A model for fibre contact in planar random fibre networks. J. Mater. Sci. 2004, 39, 2775–2781. [Google Scholar] [CrossRef]
  20. Kawamura, F.; Ohira, T.; Kikuchi, Y. Constituents from the roots of Taxus cuspidata. J. Wood Sci. 2004, 50, 548–551. [Google Scholar] [CrossRef]
  21. Tornberg, A.-K.; Gustavsson, K. A numerical method for simulations of rigid fiber suspensions. J. Comput. Phys. 2006, 215, 172–196. [Google Scholar] [CrossRef]
  22. Vincent, R.; Rueff, M.; Voillot, C. 3-D computational simulation of paper handsheet structure and prediction of apparent density. TAPPI J. 2009, 8, 10–17. [Google Scholar] [CrossRef]
  23. Conceição, E.; Curto, J.; Simões Portugal, A. Coding a simulation model of the 3D structure of paper. In Lecture Notes in Computer Science, International Symposium Computational Modeling of Objects Represented in Images; Springer: Berlin/Heidelberg, Germany, 2010; Volume 6026, pp. 299–310. [Google Scholar]
  24. Shaghaghi, T.; Ghadrdan, M.; Tolooiyan, A. Design and Optimisation of Drainage Systems for Fractured Slopes Using the XFEM and FEM. Simul. Model. Pr. Theory 2020, 103, 102110. [Google Scholar] [CrossRef]
  25. Beraki, M.; Trovão, J.P.; Perdigão, M. Characterization of variable inductors using finite element analysis. Simul. Model. Pr. Theory 2019, 97, 101952. [Google Scholar] [CrossRef]
  26. Borodulina, S.; Kulachenko, A.; Tjahjanto, D. Constitutive modeling of a paper fiber in cyclic loading applications. Comput. Mater. Sci. 2015, 110, 227–240. [Google Scholar] [CrossRef]
  27. Motamedian, H.R.; Kulachenko, A. Rotational Constraint between Beams in 3-D Space. Mech. Sci. 2018, 9, 373–387. [Google Scholar] [CrossRef]
  28. Motamedian, H.R.; Kulachenko, A. Simulating the hygroexpansion of paper using a 3D beam network model and concurrent multiscale approach. Int. J. Solids Struct. 2019, 161, 23–41. [Google Scholar] [CrossRef]
  29. Liu, S.; Zhang, Y.; Zheng, W.; Yang, B. Real-time simulation of virtual palpation system. IoP 2019, 234, 1–6. [Google Scholar] [CrossRef]
  30. Vassilev, T. Mass-Spring Cloth Simulation with Shape Matching; ACM Press: New York, NY, USA, 2017; pp. 257–264. [Google Scholar] [CrossRef]
  31. Ren, D.; Chen, Y.; Lin, B.; Zeng, F.; Huang, J.; Wang, J. Modelling and simulation of vessel surgery based on Mass-Spring. In Proceedings of the 2017 International Conference on Mechanical, Aeronautical and Automotive Engineering (ICMAA 2017), Singapore, 13–14 May 2017; pp. 1–4. [Google Scholar]
  32. Mozafary, V.; Payvandy, P. Study and comparison techniques in fabric simulation using mass spring model. Int. J. Cloth. Sci. Technol. 2016, 28, 634–689. [Google Scholar] [CrossRef]
  33. Yan, D.; Li, K. Measurement of wet fiber flexibility by confocal laser scanning microscopy. J. Mater. Sci. 2007, 43, 2869–2878. [Google Scholar] [CrossRef]
  34. Hibbeler, R. Mechanics of Materials, 8th ed.; Pearson Prentice Hall: Upper Saddle River, NJ, USA, 2011. [Google Scholar]
  35. Hong, Y.; Hou, Q.; Xie, H. Action Mechanism of High-Shear Fiber Kneader Treatment on the Aspen BCTMP Fiber Morphology. Adv. Mater. Res. 2010, 113-116, 689–693. [Google Scholar] [CrossRef]
  36. Heyden, S. Network Modelling for the Evaluation of Mechanical Properties of Cellulose Fiber Fluff. Ph.D. Thesis, Lund University, Lund, Sweden, March 2000. [Google Scholar]
  37. Inin, D.; Cengiz, N. Stability of a Spring-Mass system with generalized piecewise constant argument. In Proceedings of the Progress on Difference Equations and Discrete Dynamical Systems, 2019 International Conference on Difference Equations and Applications, Istanbul, Turkey, 22–26 July 2019; Springer: Cham, Switzerland, 2021; Volume 341, pp. 213–229. [Google Scholar] [CrossRef]
  38. Qi, L.; Huang, S.; Fu, G.; Zhou, S.; Jiang, X. On the mechanics of curved flexoelectric microbeams. Int. J. Eng. Sci. 2018, 124, 1–15. [Google Scholar] [CrossRef]
  39. Steadman, R.; Luner, P. The effect of wet fibre flexibility on sheet apparent density. In Papermaking Raw Materials, Trans. of the VIIIth Fund. Res. Symp, Oxford, UK, 1985; Punton, V., Ed.; MEP: London, UK, 2018; pp. 311–337. [Google Scholar]
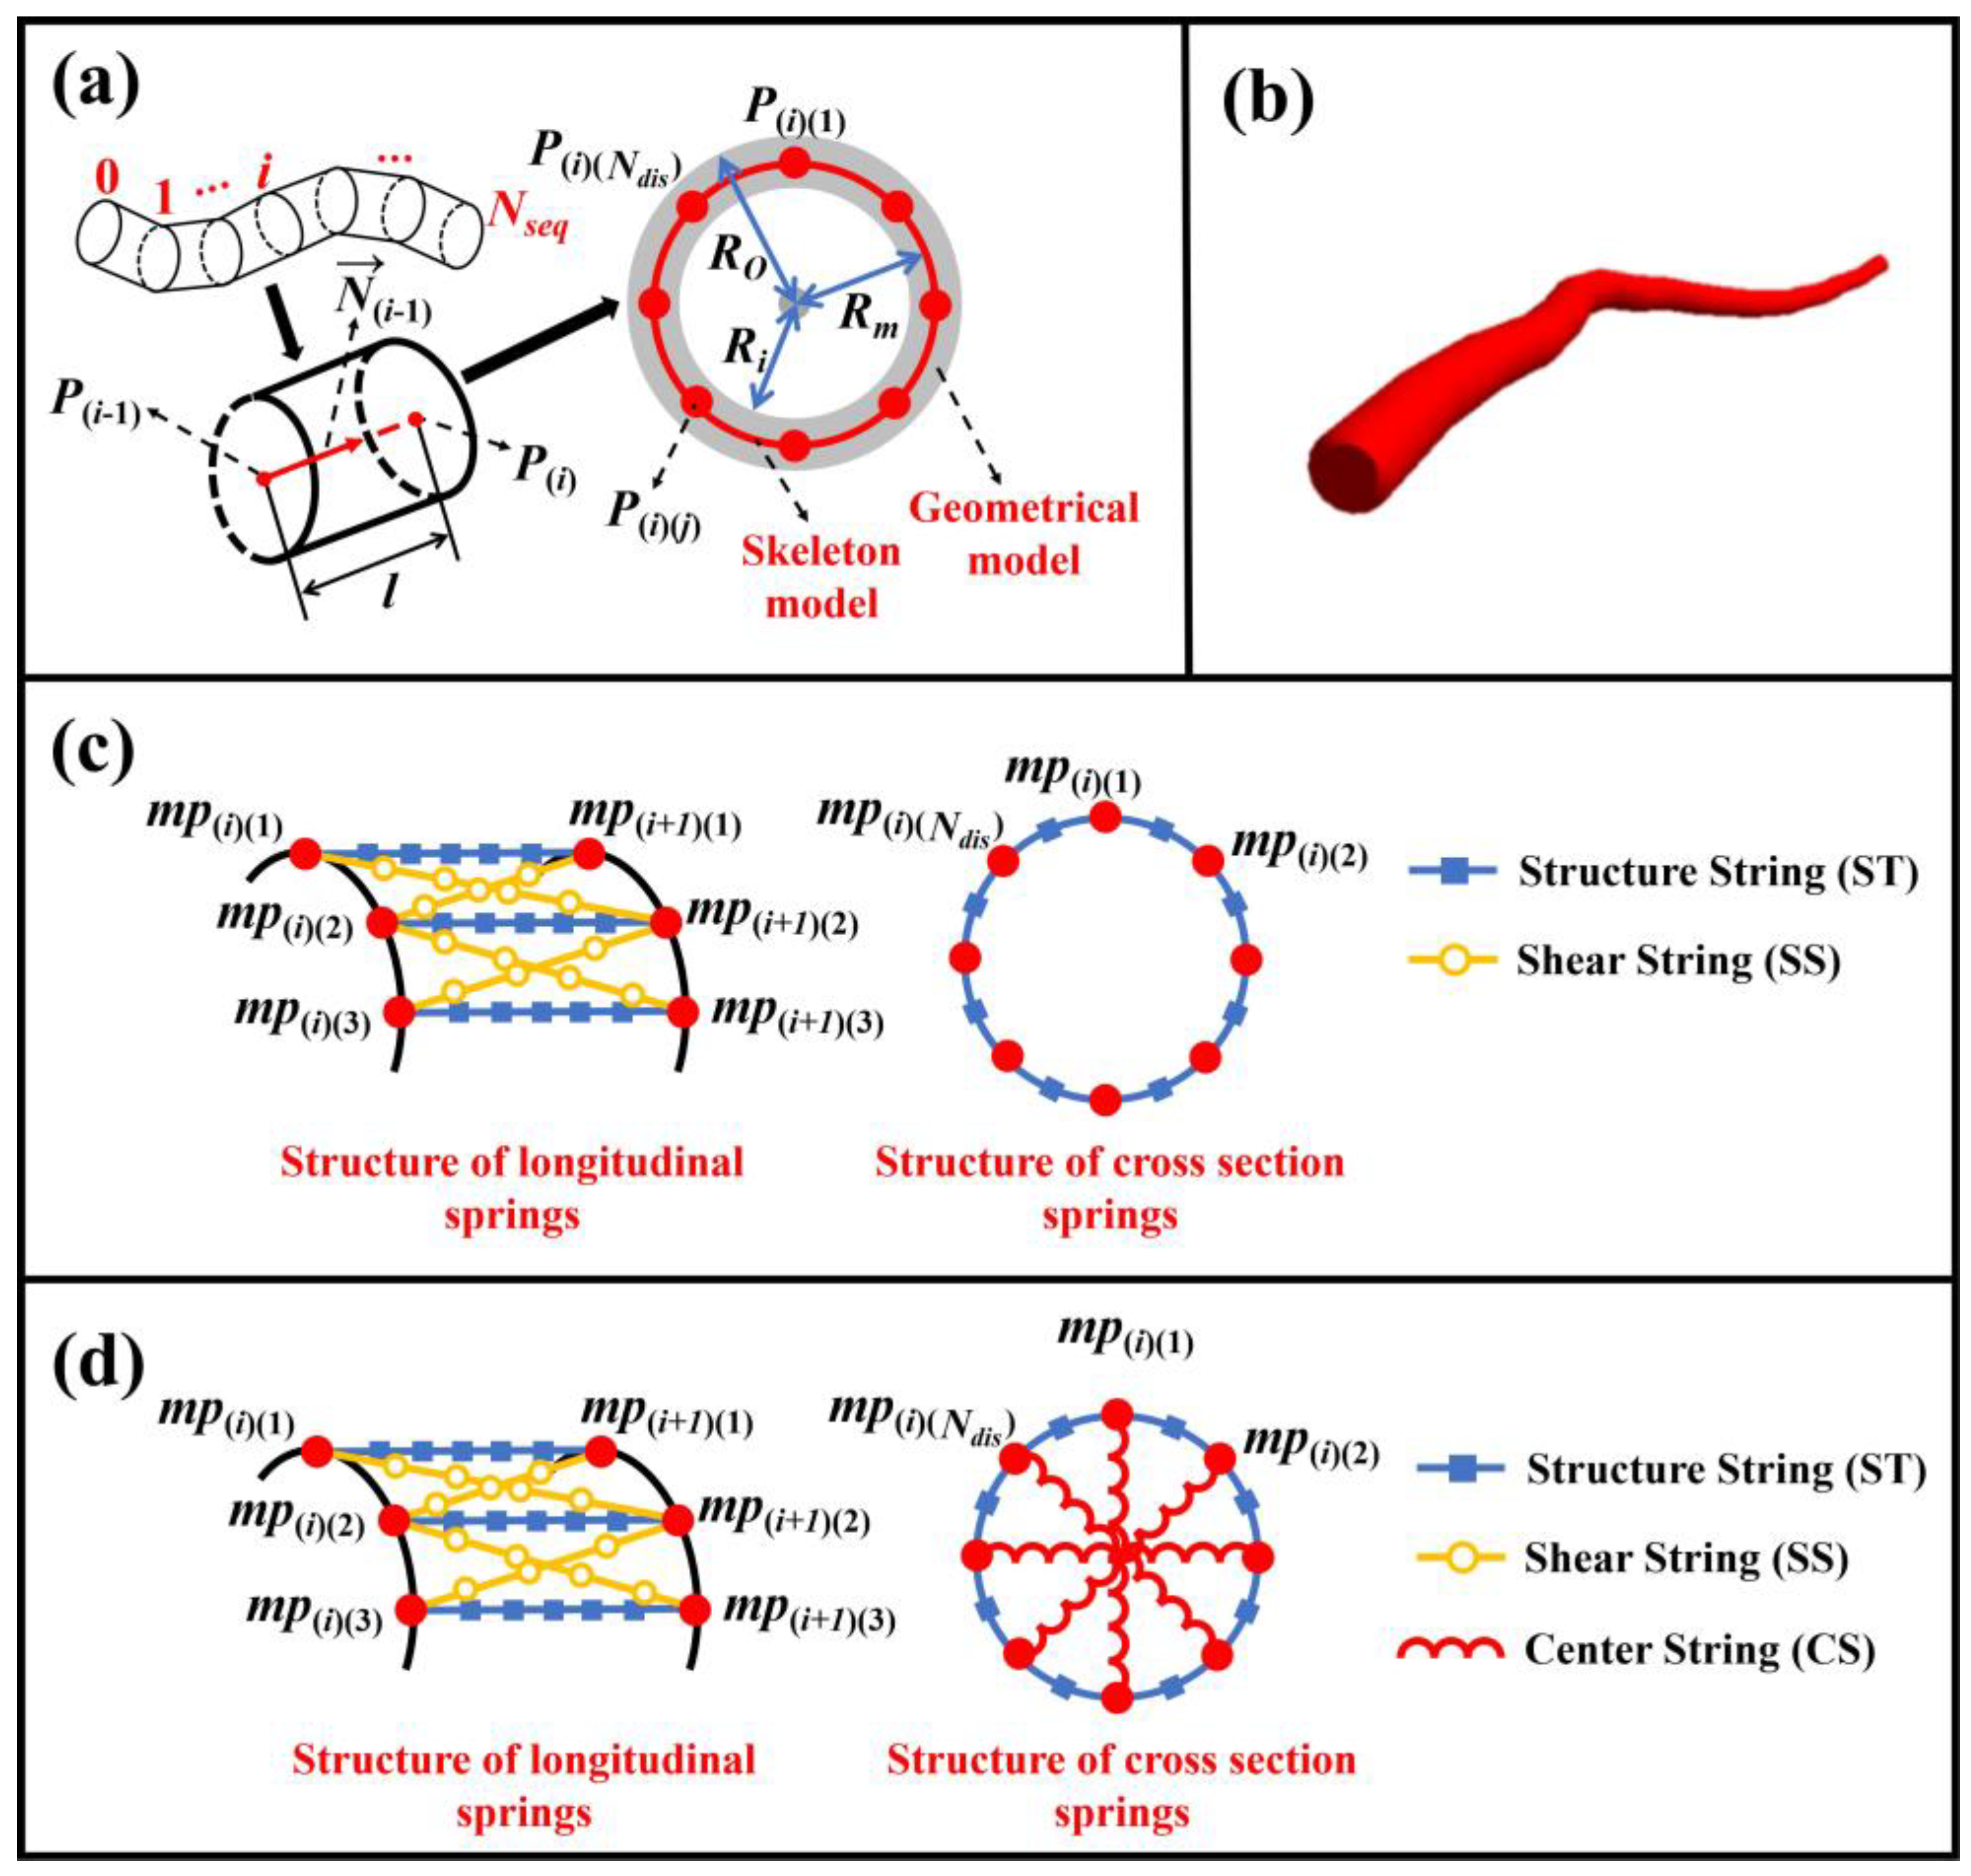
Figure 1. Geometrical model of single pulp fiber: (a) structural sketch of the geometric model of the fiber, (b) display of single model with OpenGL, (c) topological structure of MSM, and (d) topological structure of iMSM.
Solids 06 00050 g001
Figure 2. Strains of iMSM for single paper fiber under (a1a4) one tension force FS, (b1b4) one torsion force FT. (a1,b1) are diagrams of the deformation process of the fiber model under FS and FT; (a2,b2) are the spring shapes when not under force; (a3,b3) are the spring shapes under FS and FT; (a4,b4) are the force analysis based on the spring deformation in (a3,b3).
Solids 06 00050 g002
Figure 3. (a) Preliminary simulation model of paper fiber and the simulation results with (b) MSM and (c) iMSM under the actions of gravity and plane support force.
Solids 06 00050 g003
Figure 5. Relationship between the simulation step Δt and the relative error RE of simulated elastic modulus.
Solids 06 00050 g005
Figure 6. Dynamic simulation process for elastic modulus of single Aspen CTMP fiber under the transverse load of 1.0 μN·μm−1.
Solids 06 00050 g006
Figure 7. Simulation results for elastic modulus of single Aspen CTMP fiber under different transverse loads q.
Solids 06 00050 g007
Table 1. Properties of four types of paper fibers [33].
Types of Paper
Fiber
Diameter d (μm)Wall Thickness w (μm)Elastic Modulus E (GPa)Shear Modulus G (GPa)
Aspen CTMP7.622.2417.177.15
Aspen BCTMP6.732.392.270.95
Birch BCTMP10.353.092.380.99
Spruce BKP3.801.361.470.61
Table 2. Main simulation parameters of iMSM for the four different types of single paper fiber.
Fiber TypeSimulation Parameters
Number of Discretized Points NdisNumber of Segments NseqNumber of Mass Points NmpNumber of Springs Ns
Aspen CTMP3250716,25664,896
Aspen BCTMP16317595223,744
Birch BCTMP3243814,04856,064
Spruce BKP1667010,73642,880
Table 3. Simulated elastic modulus  E ^ for different single paper fibers with iMSM.
Types of Single Paper FiberExternal Transverse Loads q (μN·μm−1)Experimental
Elastic Modulus
E (GPa)
Simulated Elastic Modulus  E ^ (GPa)RE of E
(%)
Simulation Time (Min)
Aspen CTMP117.1715.798.032.80
1.515.489.832.65
216.076.412.60
2.516.126.132.52
Averaged  E ^   of Aspen CTMP15.877.602.64
Aspen BCTMP12.272.0111.541.14
1.52.069.401.08
22.0410.201.00
2.52.0210.800.95
Averaged  E ^   of Aspen BCTMP2.0310.491.04
Birch BCTMP12.382.578.182.26
1.52.557.042.19
22.557.202.14
2.52.6310.632.08
Averaged  E ^   of Birch BCTMP2.588.292.17
Spruce BKP11.471.2711.512.08
1.51.336.851.90
21.346.231.72
2.51.355.861.57
Averaged  E ^   of Spruce BKP1.327.611.82
Averaged relative error of E for all fibers8.491.92
Disclaimer/Publisher’s Note: The statements, opinions and data contained in all publications are solely those of the individual author(s) and contributor(s) and not of MDPI and/or the editor(s). MDPI and/or the editor(s) disclaim responsibility for any injury to people or property resulting from any ideas, methods, instructions or products referred to in the content.