Abstract
Tungsten and tungsten alloys are widely used in important industrial fields due to their high density, hardness, melting point, and corrosion resistance. However, machining often leaves processing marks on their surface, significantly affecting the surface quality of precision components in industrial applications. Electrolytic polishing offers high efficiency, low workpiece wear, and simple processing. In this study, an electrolytic polishing method is adopted and a novel trisodium phosphate–sodium hydroxide electrolytic polishing electrolyte is developed to study the effects of temperature, voltage, polishing time, and solution composition on the surface roughness of a tungsten–nickel–iron alloy. The optimal voltage, temperature, and polishing time are determined to be 15 V, 55 °C, and 35 s, respectively, when the concentrations of trisodium phosphate and sodium hydroxide are 100 g·L−1 and 6 g·L−1. In addition, glycerol is introduced into the electrolyte as an additive. The calculated LUMO value of glycerol is −5.90 eV and the HOMO value is 0.40 eV. Moreover, electron enrichment in the hydroxyl region of glycerol can form an adsorption layer on the surface of the tungsten alloy, inhibit the formation of micro-pits, balance ion diffusion, and thus promote the formation of a smooth surface. At 100 mL·L−1 of glycerol, the roughness of the tungsten–nickel–iron alloy decreases significantly from 1.134 μm to 0.582 μm. The electrochemical polishing mechanism of the tungsten alloy in a trisodium phosphate electrolyte is further investigated and explained according to viscous film theory. This study demonstrates that the trisodium phosphate–sodium hydroxide–glycerol electrolyte is suitable for electropolishing tungsten–nickel–iron alloys. Overall, the results support the application of tungsten–nickel–iron alloy in the electronics, medical, and atomic energy industries.
1. Introduction
Tungsten alloys, due to their advantages of high density, hardness, high melting point, and corrosion resistance, are widely used in integrated circuits; medical devices; and aerospace, atomic energy, and other fields [1,2]. The surface smoothness of alloys is crucial for precision components that require ultra-high surface quality. The surface roughness of tungsten and its alloys is usually subject to strict demands [1,3,4] in industrial applications.
Hard tungsten alloys have low machinability due to their high hardness and superior mechanical properties [5]. Grinding and cutting are two of the most commonly used surface processing techniques [6,7]. However, materials processed by grinding are prone to elastic–plastic deformation. Moreover, obvious grinding marks on the surface reduce the surface quality of the alloys [8]. The use of cutting methods can cause problems, such as brittle fracture of the alloys, subsurface cracking, and tool wear [9,10,11]. A high degree of non-uniformity at far depths along the jet alignment direction is observed with abrasive machining. Neither of the abovementioned methods can perform ultra-precision machining on complex parts.
Electrochemical polishing is a processing technique in which a metal workpiece is used as the anode and the surface of the workpiece is selectively dissolved to obtain a smooth surface. The electrolytic process conforms to Faraday’s [12,13] law and is widely [14,15] used in the processing industry due to its high efficiency, low workpiece loss [13], simple operation, and easy processing. At present, the electrolytic polishing solutions commonly used for tungsten alloys are acidic solutions, mainly sulfuric acid–methanol acidic electrolyte [16]. Wang et al. [17] observed that an appropriate concentration of sulfuric acid can form a dense tungstic acid colloid layer on the surface of Ni-W alloy, which affects the polishing effect of the alloy surface. Electropolishing in the H2SO4-CH3OH electrolyte results in the anodic dissolution of tungsten, where anisotropic and isotropic etchings occur in two stages. The rate-controlling stages include charge transfer and mass transport, respectively [18,19]. However, the high sulfuric acid concentration leads to a high post-treatment cost.
In an alkaline environment, the surface quality of the tungsten alloys can be efficiently improved, and the alkaline electrolyte of NaOH [20] can be used for tungsten alloys. Under this condition, tungsten is oxidized to form WO3, and the resulting WO3 interacts with the electrolyte and dissolves. The reaction equations are shown in Equations (1)–(3).
Anode: W (s) + 6OH− → WO3 (s) + 3HO2 + 6 e−
WO3 (s) + 2OH− → WO42− + H2O
Cathode: 6H2O + 6e− → 3H2 (g) + 6OH−
Due to the high hardness and corrosion resistance of tungsten alloys, alkaline polishing can avoid the excessive corrosion or grain boundary erosion that may be caused by acidic electrolytes. However, sodium hydroxide electrolyte may cause tungsten in the alloy to dissolve quickly, while other metals—such as Ni and Fe—dissolve slowly, resulting in uneven dissolution and poor surface quality. In addition, high concentrations of NaOH are highly corrosive, which presents an issue in ensuring the safety of equipment and operators. Moreover, high concentrations of NaOH lead to continuous etching, causing damage to the W surface. This has prompted the selection of an aqueous electrolyte with an optimized concentration [21]. Recently, Deng et al. [22] analyzed the effects of current- and potential-driven electrochemical polishing techniques, and proposed a two-step polishing process that resulted in a smoother and flatter tungsten surface.
Therefore, the polishing effect of tungsten alloys is greatly [23,24,25,26] influenced by the process conditions. Exploring a more environmentally friendly electrolyte and investigating the mechanism of electrochemical polishing of tungsten alloys can provide theoretical and technical guidance for the surface treatment of other high-hardness alloys. In-depth research on electrochemical polishing in tungsten alloys has both important engineering practical value and scientific significance. In this work, a novel trisodium phosphate–sodium hydroxide–glycerol electrolyte was explored for electrochemical polishing of tungsten–nickel–iron alloy. The rationality of using glycerol as an additive in the electrolyte was investigated through theoretical calculation, and the probable polishing mechanism was proposed.
2. Materials and Methods
The experimental setup is shown in Figure 1. Tungsten alloy from Ganzhou Jiangwu Ferrotungsten Co., Ltd., Nachang, China (Composition: W 95 wt%, Ni 2.8–4.3 wt%, Fe 0.7–2.2 wt%) was cut into 1 cm × 1 cm × 0.2 cm pieces. Before electropolishing, the samples were polished with 400 mesh, 800 mesh, and 1200 mesh sandpaper for 30 min, respectively. To ensure the uniformity of polishing, the sandpaper was replaced after each test, and the direction of sandpaper movement was adjusted by 90°.
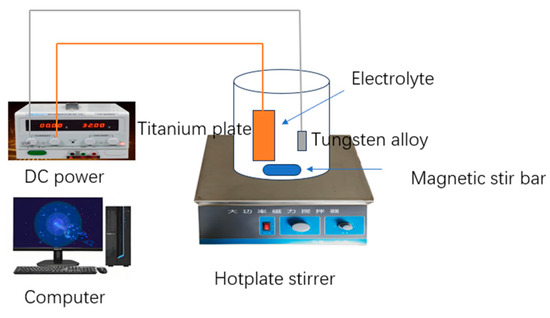
Figure 1.
The experimental setup used to electropolish tungsten alloy.
The samples were rinsed continuously with deionized water for 30 s, then ultrasonically oscillated in anhydrous ethanol to remove possible residual impurities on the surface. The ultrasonic-treated samples were washed again with deionized water to remove the anhydrous ethanol and then dried in air for 12 h. The electrolytic polishing solutions were prepared with sodium trisodium phosphate, sodium hydroxide, and glycerol in different volumes. During the electrochemical polishing process, DC power was supplied by HSPY-20-5 from Beijing han sheng PuYuan technology Co., Ltd., Beijing, China. The rotating speed magnetic stir bar was adjusted to 400 rpm. A titanium plate with a size of 5 cm × 5 cm × 0.02 cm was used as the cathode. The effects of the solution composition, temperature, and voltage on the tungsten–nickel–iron alloy surface were systematically explored.
The molecular structure of the additive was calculated using Materials Studio, and the frontier molecular orbitals and electrostatic potential distribution of the additive molecules were obtained using the Forcite and DMol3 modules, respectively. The molecular dynamics simulation method was used to study the adsorption behavior of additives on the tungsten (110) crystal surface. Firstly, the tungsten atomic crystal plane was constructed. The tungsten crystal was imported, the crystal plane index was input, the tungsten (110) was cut, and a vacuum layer was added to expand into a supercell. Then, a solution model was constructed, and the optimized additive molecules were placed into a solution box. Finally, the tungsten (110) crystal plane was combined with the solution box containing additives, and a 5 nm thick vacuum layer was added above the box to form an adsorption model. Molecular dynamics simulations were conducted using a Forcite module.
The roughness and 3D profile were measured with an Olympus BSX510 (San Diego, CA, USA), and the average of five roughness test points was taken. The “Confocal Mode” was selected and the pinhole was automatically enabled, switching the three-dimensional measurement mode. The sample surface was securely fixed on the stage. After selecting an appropriate magnification objective lens, the lateral and longitudinal parameters were adjusted to select a clear scanning plane. A software was used to rotate, zoom, and adjust the viewing angle to observe the three-dimensional morphology. The “Pseudo-colour Mode” was selected to provide a more intuitive display of surface undulations. The samples were scanned, and a three-dimensional morphology map was generated using a selected area of 499 × 499 μm. Each point was measured five times and the average was taken. The roughness of each sample was measured at five points to obtain the average roughness value. Microscopic topography analysis was conducted using a scanning electron microscope (HITACHI SU8010, Tokyo, Japan) with an acceleration voltage of 10.0 kV and a current of 10.0 μA.
3. Results and Discussion
The process parameters of the electrochemical polishing tungsten–nickel–iron alloy include voltage, temperature, and electrolyte composition. Figure 2 and Figure 3 show the effect of the trisodium phosphate concentration at 6 g/L of sodium hydroxide at 30 °C on electrochemical polishing tungsten–nickel–iron alloy. The alloy surface was the smoothest when the roughness of Sa was 0.582 μm and the trisodium phosphate content was 100 g·L−1. When the trisodium phosphate content was reduced to 60 g·L−1 and 80 g·L−1, Sa was raised to 1.429 μm and 1.150 μm, respectively. As shown in Figure 2a,b, the height difference of the alloy surface profile is distinct, indicating a larger surface roughness. The concentration of trisodium phosphate usually affects the viscosity of the electropolishing solution. When the trisodium phosphate concentration is low, the viscosity of the electrolyte is reduced, the tungsten alloy dissolves too quickly, and it fails to form a stable passivation film. When the trisodium phosphate content was raised to 120 g·L−1 and 140 g·L−1, Sa increased to 0.811 μm and 1.26 μm, respectively. Excessive trisodium phosphate leads to high viscosity in the solution, affecting the ion transfer rate and thereby the polishing effect. Figure 4 shows the optical microscope images of tungsten–nickel–iron alloy under various trisodium phosphate concentrations. The surface was relatively rough at 60 g·L−1 of trisodium phosphate but became smooth at 100 g·L−1, which is consistent with the roughness test results shown in Figure 2 and Figure 3.
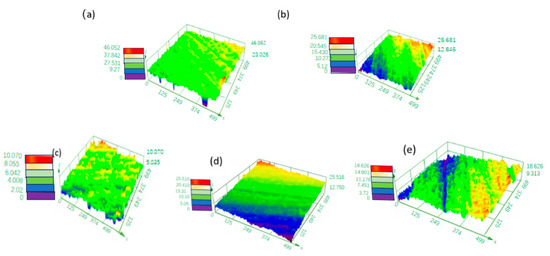
Figure 2.
The effect of the trisodium phosphate concentration on the 3D profile of the surface of tungsten–nickel–iron alloy: (a) 60 g·L−1; (b) 80 g·L−1; (c) 100 g·L−1; (d) 120 g·L−1; (e) 140 g·L−1.
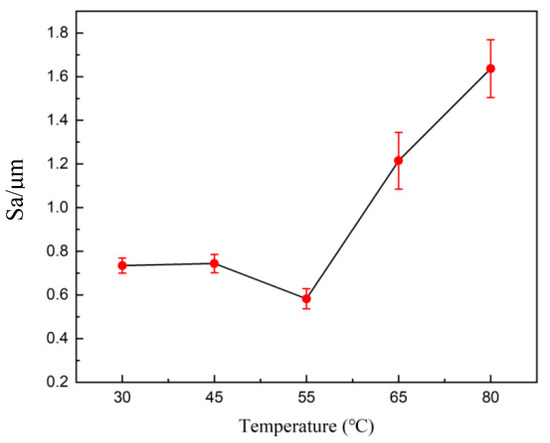
Figure 3.
The surface roughness of tungsten alloy after polishing with varying concentrations of trisodium phosphate.
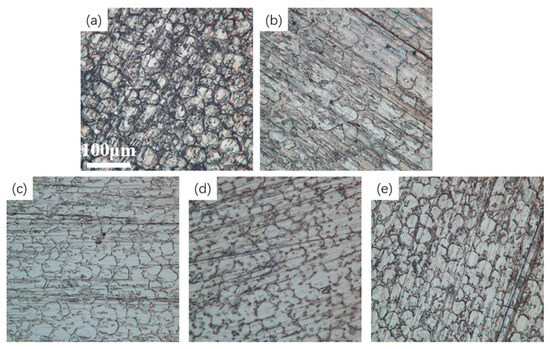
Figure 4.
Optical microscope images of the tungsten–nickel–iron alloy at different trisodium phosphate concentrations: (a) 60 g/L; (b) 80 g/L; (c) 100 g/L; (d) 120 g/L; (e) 140 g/L.
The additive is important to further improve the polishing effect. Glycerol can adsorb onto the anode surface during the polishing process, occupying specific adsorption sites and forming a stable adsorption layer used as a polisher for electropolishing 316 L steel [27]. Glycerol and ascorbic acid additives can synergistically enhance copper surface glossiness and smoothness while slowing down the dissolution rate of the copper [28]. Therefore, in this study, glycerol was chosen as an additive to slow down the polishing rate and make the polishing of tungsten–nickel–iron alloy smoother and more uniform. Molecular dynamics simulations were used to observe the adsorption behavior of additive molecules on the anode surface, which were conducted to study the adsorption process of glycerol on tungsten surfaces. The W(110) characteristic peak of the tungsten alloy was the strongest; therefore, cutting along the W(110) crystal plane simulated the adsorption state of glycerol on the actual tungsten–nickel–iron alloy.
Figure 5 shows the results of the calculation of the glycerol molecule. Figure 5d displays the lowest unoccupied molecular orbitals (LUMO) of the glycerol molecule. The LUMO energy is −5.90 eV and the HOMO energy is 0.40 eV. The lower HOMO energy and the higher LUMO energy suggest that glycerol can readily accept electrons to participate in oxidation reactions. As shown in Figure 5a, glycerol contains three hydroxyl groups, and the high electron density of the hydroxyl groups usually indicates strong polarity. The electron enrichment in the hydroxyl region can form an adsorption layer on the surface of tungsten–nickel–iron alloy, which inhibits the formation of microscopic pits and promotes the formation of smooth surfaces. Therefore, glycerol is a promising additive for use in a trisodium phosphate electrolytic polishing solution for tungsten–nickel–iron alloy.
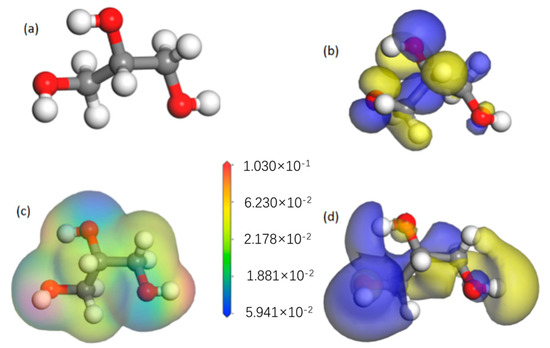
Figure 5.
A molecular orbital diagram of glycerol: (a) molecular structure; (b) highest occupied molecular orbital (HOMO); (c) electrostatic potential diagram; (d) lowest unoccupied molecular orbital (LUMO).
Figure 6 and Figure 7 show the effect of glycerol on the 3D profile and roughness of the surface of tungsten–nickel–iron alloy after electrochemical polishing. As shown in Figure 7, with an increase in the glycerol content, the surface roughness of tungsten alloys first increased and then decreased. When the glycerol concentration was 100 mL/L, Sa reached a minimum of 0.617 μm. With a further increase in glycerol content, the Sa of tungsten alloy began to increase. An excessive amount of glycerol adsorbs on the surface of the tungsten alloy, resulting in a slower diffusion rate of the generated WO42− ions and an increase in roughness. As shown in Figure 6f, when the glycerol content increased to 250 mL/L, the roughness reached a value of 1.850 μm.
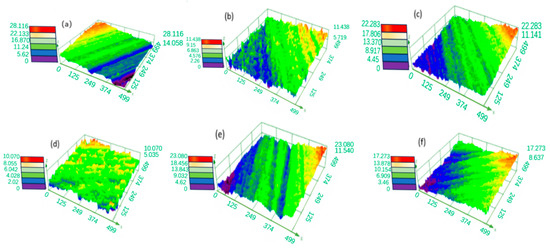
Figure 6.
The effect of glycerol content on the 3D contour of polished tungsten alloy surface: (a) 10 mL/L; (b) 50 mL/L; (c) 100 mL/L; (d) 150 mL/L; (e) 200 mL/L; (f) 250 mL/L.
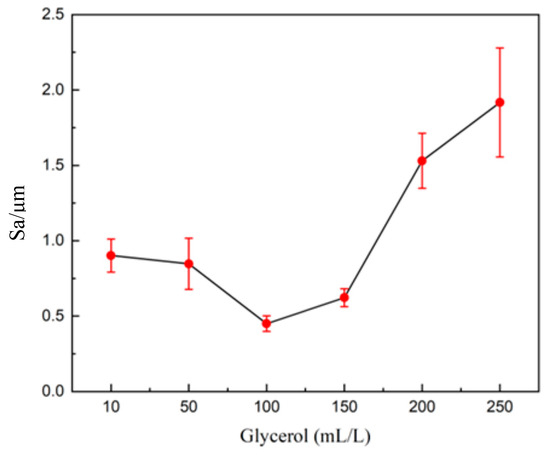
Figure 7.
The surface roughness of tungsten alloy after polishing with glycerol in an electrolytic polishing solution.
Optical microscope images of the tungsten alloy electropolished under various glycerol contents are shown in Figure 8. The surface is relatively smooth when the glycerol concentration was 100 mL/L, which is consistent with the results illustrated in Figure 6 and Figure 7.
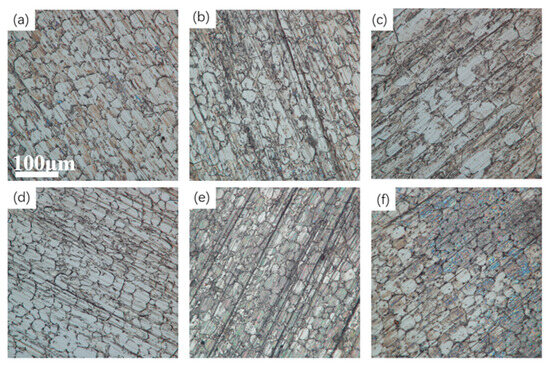
Figure 8.
Optical microscope images of the tungsten alloy electropolished under various glycerol contents: (a) 10 mL/L; (b) 50 mL/L; (c) 100 mL/L; (d) 150 mL/L; (e) 200 mL/L; (f) 250 mL/L.
Voltage is an important factor affecting the polishing effect on tungsten–nickel–iron alloy. If the voltage is too low, the anodic process enters the dissolution zone, causing the workpiece to dissolve. Conversely, if the voltage or current density is too high, anodic polarization causes the release of oxygen gas, creating pits on the surface of the workpiece and increasing the roughness. Figure 9 shows 3D profiles of electrochemical polishing for 35 s at different voltages with electrolyte concentrations of 100 g·L−1 of trisodium phosphate and 8 g·L−1 of sodium hydroxide. Figure 10 demonstrates the corresponding changes in surface roughness of tungsten–nickel–iron alloy. At the optimal working voltage of 15 V, the lowest Sa was 0.560 μm.
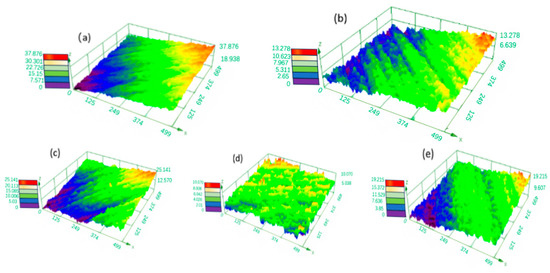
Figure 9.
The 3D surface profile of tungsten–nickel–iron alloys after electrochemical polishing at different voltages: (a) 8 V; (b) 10 V; (c) 12 V; (d) 15 V; (e) 18 V.
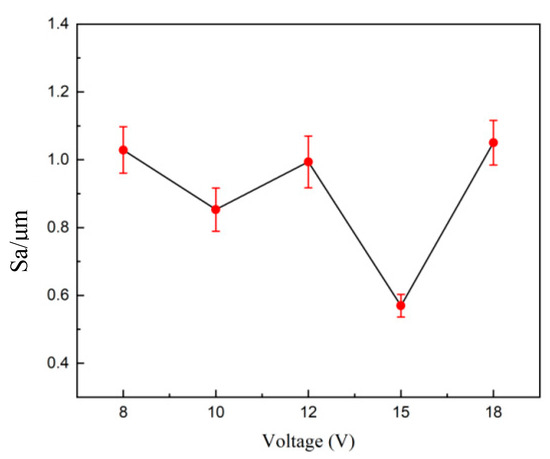
Figure 10.
Surface roughness changes of tungsten–nickel–iron alloys after electrochemical polishing at different voltages.
In addition to the electrolyte and voltage, the temperature affects the rate of electron transfer and diffusion of components in electrolyte which, in turn, affects roughness. When the temperature rises, the electron transfer rate and the diffusion rate increase, but the thermal motion effect reduces the stability of the viscous film. The relationship between temperature and the diffusion coefficient is shown in the following formula:
In the formula, D0 is the preceding factor, Qa is the diffusion activation energy (J/mol), T is the absolute temperature, and K, R is the ideal gas constant (J/mol·K). D is substituted into the relationship between the limiting current (A/m2) and the diffusion coefficient:
where δ is the thickness of the diffusion layer in meters, n is the transfer electron number, and C is the concentration with the unit of mol/L. So,
Therefore, the increase in temperature leads to an exponential increase in current density. When the temperature is low, the viscosity of the electrolyte increases. The anode mucora thickens, which decreases the diffusion of anode products. The bubbles remain on the anode surface, resulting in pockmarks and streaks. As the temperature rises, the viscosity of the diffusion layer decreases, making it difficult to maintain the viscous layer. Therefore, there is an optimal temperature for the electrochemical polishing process. Figure 11 shows the 3D profile of the tungsten–nickel–iron alloy after electrochemical polishing under different temperatures, and Figure 12 presents the roughness changes. The Sa of tungsten–nickel–iron alloy reached the lowest value of 0.582 μm at 55 °C. At lower temperatures of 30 °C and 45 °C, the diffusion coefficient decreased, in accordance with Formula (4). Therefore, the diffusion rate of the anode product was low, and the anodic dissolution efficiency was reduced. The Sa was 0.738 μm and 0.744 μm, respectively. At increased temperatures of 65 °C and 80 °C, the Sa was 1.192 μm and 1.639 μm, respectively. The increased temperature caused the viscous film to become unstable, the solution viscosity to decrease, and the viscous film to thin. Meanwhile, the diffusion coefficient increased, and the anode dissolution rate increased. Therefore, under higher temperatures, local corrosion formed rapidly, causing pits on the surface of tungsten–nickel–iron alloy.
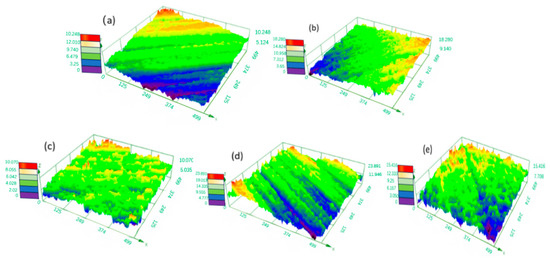
Figure 11.
A surface 3D contour map of tungsten–nickel–iron alloys after electrochemical polishing under different temperatures: (a) 30 °C; (b) 45 °C; (c) 55 °C; (d) 65 °C; (e) 80 °C.
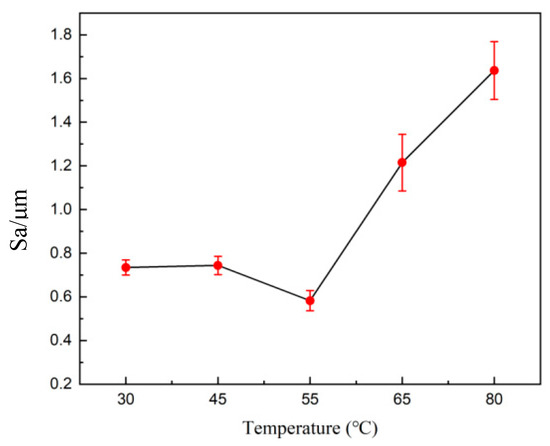
Figure 12.
The effect of the temperature on the roughness of tungsten–nickel–iron alloy after electrochemical polishing.
Figure 13 shows optical microscope images of tungsten–nickel–iron alloy after electrochemical polishing at different temperatures. The images show that at 55 °C, the difference in the surface contour height of the sample was minimal, the surface morphology was relatively uniform, and the unevenness was significantly reduced.
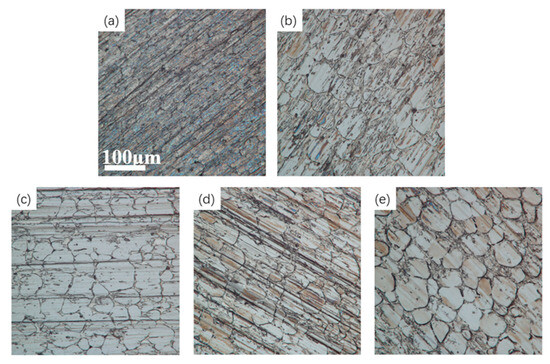
Figure 13.
Optical microscope images of the tungsten alloy at different temperatures: (a) 30 °C; (b) 45 °C; (c) 55 °C; (d) 65 °C; (e) 80 °C.
Moreover, the difference in peak and valley heights on the surface of the tungsten–nickel–iron alloy causes a high current at the beginning of polishing. The height difference gradually decreases, and the difference in current density is reduced, resulting in a slower rate of roughness reduction. Therefore, there is an appropriate polishing time for electrochemical polishing of tungsten–nickel–iron alloy. Figure 14 shows the 3D profiles of the surface of the tungsten–nickel–iron alloy after electrochemical polishing at different times. At a polishing time of 35 s, the height difference of the tungsten alloy surface profile was the smallest, with an Sa of 0.582 μm. There were no obvious ripples or etching pits on the sample surface. When the polishing time increased to 10 s, the Sa was 0.77 μm. When the polishing time was further increased to 120 s, the Sa increased to 3.078 μm. The effect of the polishing time on the surface roughness of tungsten–nickel–iron alloy is summarized in Figure 15.
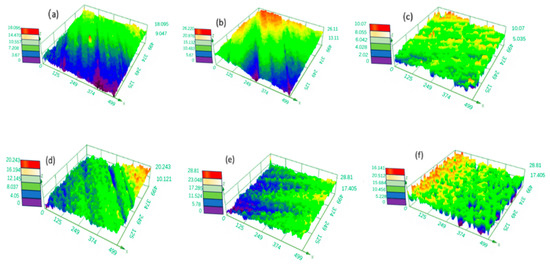
Figure 14.
Surface 3D contour maps of tungsten–nickel–iron alloy after electrochemical polishing for different times: (a) 10 s; (b) 20 s; (c) 35 s; (d) 50 s; (e) 60 s; (f) 120 s.
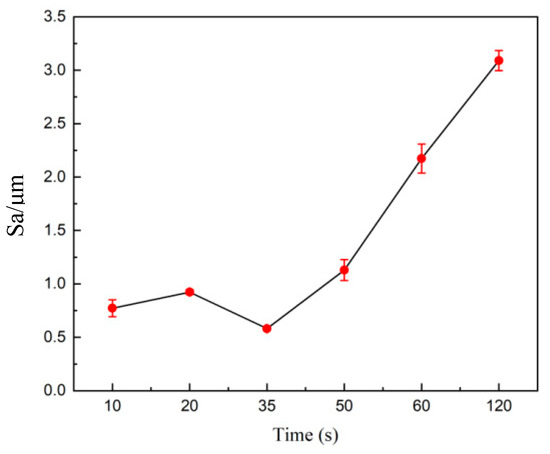
Figure 15.
The effect of the polishing time on the surface roughness of tungsten alloy.
Figure 16 shows surface optical microscopy images of tungsten alloy after electrochemical polishing at different polishing times. With an increase in the polishing time, the surface roughness of the sample first decreased and then increased, which is consistent with the results shown in Figure 14 and Figure 15.
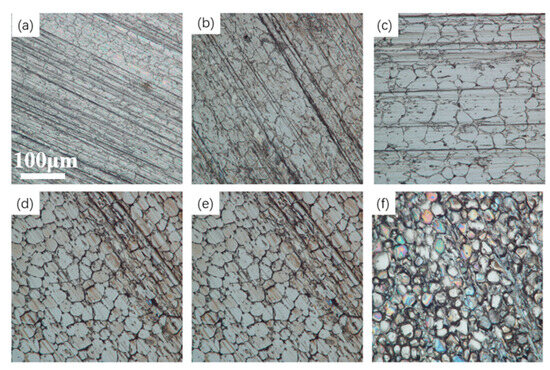
Figure 16.
Optical microscope images of tungsten–nickel–iron alloy after electrochemical polishing for different times: (a) 10 s; (b) 20 s; (c) 35 s; (d) 50 s; (e) 60 s; (f)120 s.
In conclusion, the trisodium phosphate–sodium hydroxide–glycerol electrolyte is effective for electrochemical polishing of tungsten–nickel–iron alloy. The polishing effect of tungsten–nickel–iron alloy is greatly influenced by process conditions. The optimized electropolishing parameters for tungsten alloy are summarized in Table 1.

Table 1.
Optimized electropolishing parameters for tungsten alloy.
The mechanism of electropolishing is also crucial, as it can reveal the essential rules and internal connections, providing guidance for subsequent investigations. The electrochemical polishing mechanisms include the viscous film theory [20], the salt film theory [23], and the oxide dissolution–equilibrium theory [21,24,25]. When a constant voltage is applied for time t of electrolytic polishing, the current gradually decreases to a stable value i0. Elmore et al. [29] believe that the formation of the platform is due to the generation of a viscous film layer. The solubility of the viscous film layer in the electrolyte reaches saturation. The limit of the diffusion rate determines the intensity of the limiting diffusion current. Therefore, the stable electrolytic polishing current is determined by the value of the limiting diffusion current. i0t1/2 is a constant value. Figure 17a,b show the i-t curves measured at different voltages, and the i0t1/2 values can be calculated at different voltages, respectively. As shown in Figure 17a, after applying a certain voltage for electrochemical polishing, the voltage gradually became stable. As shown in Figure 17b, the i0t1/2 values at different voltages were nearly equal. Therefore, electrochemical polishing of the trisodium phosphate electrolyte is considered to be performed through the sticky film mechanism.
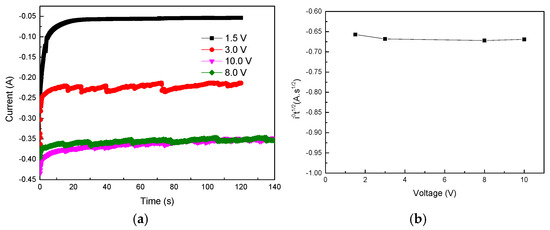
Figure 17.
(a) The relationship between i-t and (b) i0t1/2-V at different voltages.
Figure 18 shows the scanning electron microscope images of the tungsten–nickel–iron alloy surface before and after electrochemical polishing. Before polishing, there were obvious protrusions and striped mottling distribution on the surface of the sample, thus having a higher roughness. After polishing, the protrusions on the tungsten–nickel–iron alloy surface decreased significantly. Meanwhile, the pitting disappeared, and the height difference between peaks and valleys obviously decreased. All of these factors indicate a decrease in surface roughness. The grains and grain boundaries on the surface of tungsten–nickel–iron alloy could be observed. The Sa was 0.582 μm, which is much lower than the original Sa of 1.134 μm. This shows that the electrolyte with trisodium phosphate, sodium hydroxide, and glycerol is effective for electropolishing tungsten alloy. To the contrary, no obvious improvement in smoothness was observed when using sodium hydroxide electrolyte for electropolishing tungsten alloy [14].
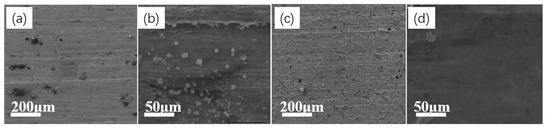
Figure 18.
The surface topography (SEM) of tungsten–nickel–iron alloy before and after electrochemical polishing: (a) 50 iterations before polishing; (b) 2000 iterations before polishing; (c) 50 iterations after polishing; (d) 2000 iterations after polishing.
4. Conclusions
This work showed that a novel trisodium phosphate–sodium hydroxide–glycerol electrolyte is effective for electrochemical polishing of tungsten–nickel–iron alloy. The optimal composition of the electrolytic polishing solution was 100 g·L−1 of trisodium phosphate and 6 g·L−1 of sodium hydroxide. Glycerol was found to be a suitable additive for electrochemical polishing of tungsten–nickel–iron alloy, and electron enrichment in the hydroxyl region of glycerol allows for the formation of an adsorption layer on the surface of the tungsten alloy. The optimal glycerol content was 100 mL·L−1, the optimal polishing temperature was 55 °C, the optimal polishing time was 35 s, and the optimal voltage was 15 V. Under these conditions, the surface roughness was significantly decreased from 1.134 μm to 0.582 μm. This process promotes the application of tungsten–nickel–iron alloy in electronics, medical, and atomic energy industries. The novel, environmentally friendly, and efficient electrochemical polishing electrolyte presents a key direction for future research.
Author Contributions
Y.M.: Investigation, Formal analysis, Data curation, Writing—Original Draft. Y.X.: Investigation, Formal analysis, Data curation, Writing—Review and Editing. S.L.: Methodology, Supervision, Writing—Review and Editing. Z.W. and M.A.: Writing—Review and Editing. Y.Z.: Investigation and Validation. All authors have read and agreed to the published version of the manuscript.
Funding
This work was supported by the Research and Industrialization of Ultra Low Profile Copper Foil (HVLP), No. MH20230513.
Data Availability Statement
Dataset available on request from the authors. The raw data supporting the conclusions of this article will be made available by the authors on request.
Conflicts of Interest
The authors declare no conflicts of interest.
References
- Micallef, C.; Zhuk, Y.; Aria, A.I. Recent Progress in Precision Machining and Surface Finishing of Tungsten Carbide Hard Composite Coatings. Coatings 2020, 10, 731. [Google Scholar] [CrossRef]
- Hu, K.; Li, X.Q.; Ai, X.; Qu, S.G.; Li, Y.Y. Fabrication, characterization, and mechanical properties of 93W-4.9Ni-2.1Fe/95W-2.8Ni-1.2Fe-1Al2O3 heavy alloy composites. Mater. Sci. Eng. A-Struct. Mater. Prop. Microstruct. Process. 2015, 636, 452–458. [Google Scholar] [CrossRef]
- Deng, H.; Huang, R.; Liu, K.; Zhang, X. Abrasive-free polishing of tungsten alloy using electrochemical etching. Electrochem. Commun. 2017, 82, 80–84. [Google Scholar] [CrossRef]
- Wang, F.; Zhang, X.; Deng, H. A comprehensive study on electrochemical polishing of tungsten. Appl. Surf. Sci. 2019, 475, 587–597. [Google Scholar] [CrossRef]
- Micallef, C.; Chiu, C.W.; Zhu, Y.; Aria, A.I. Rapid surface finishing of chemical vapour deposited tungsten carbide hard coatings by electropolishing. Surf. Coat. Technol. 2021, 428, 127900. [Google Scholar] [CrossRef]
- Zhang, Z.; Cui, J.; Zhang, J.; Liu, D.; Yu, Z.; Guo, D. Environmentally friendly chemical mechanical polishing of copper. Appl. Surf. Sci. 2019, 467, 5–11. [Google Scholar] [CrossRef]
- Dongxia, H.S.Z.Y.H. Analysis of Fore Characteristic in rail Belt Griding. J. Inn. Mong. Poly Tech. Univ. 1998, 17, 30–34. [Google Scholar]
- Lyczkowska-Widlak, E.; Lochynski, P.; Nawrat, G. Electrochemical Polishing of Austenitic Stainless Steels. Materials 2020, 13, 2557. [Google Scholar] [CrossRef] [PubMed]
- Lebedeva, O.; Kultin, D.; Zakharov, A.; Kustov, L. Advantages of Electrochemical Polishing of Metals and Alloys in Ionic Liquids. Metals 2021, 11, 959. [Google Scholar] [CrossRef]
- Mu, J.; Sun, T.; Leung, C.L.A.; Oliveira, J.P.; Wu, Y.; Wang, H.; Wang, H. Application of electrochemical polishing in surface treatment of additively manufactured structures: A review. Prog. Mater. Sci. 2023, 136, 101109. [Google Scholar] [CrossRef]
- Zhangwu, S.P.L. Chip-Breaking by Forcing Chip Deform at Ion to Realize to Automatic Machinning. J. Inn. Mong. Poly Tech. Univ. 1998, 17, 52–56. [Google Scholar]
- Lin, T.R.; Su, C.R. Experimental study of lapping and electropolishing of tungsten carbides. Int. J. Adv. Manuf. Technol. 2008, 36, 715–723. [Google Scholar] [CrossRef]
- Dubrovski, O.; Tietze, S.; Zigelman, A.; Drese, K.S.; Lindner, G.; Manor, O. The Enhancement of Ion Transport in an Electrochemical Cell Using High Frequency Vibration for the Electropolishing of Copper. J. Electrochem. Soc. 2018, 165, E236–E244. [Google Scholar] [CrossRef]
- Han, W.; Fang, F.Z. Investigation of electropolishing characteristics of tungsten in eco-friendly sodium hydroxide aqueous solution. Adv. Manuf. 2020, 8, 265–278. [Google Scholar] [CrossRef] [PubMed]
- Xu, Y.; Mao, Y.; Ijaz, H.M.; Ibrahim, M.E.; Le, S.; Jiang, J.; Chi, D.; An, M.; Song, S.; Huang, Y. Principles and Applications of Electrochemical Polishing. J. Electrochem. Soc. 2024, 171, 093506. [Google Scholar] [CrossRef]
- Song, P.; Xing, P.; Chen, J. Feasibility study on electrolytic polishing of tungsten in sulfuric acid-methanol electrolyte. Electroplat. Finish. 2009, 28, 27–30. [Google Scholar]
- Liu, F.; He, D.; Liu, P. Effects of sodium citrate on electrolytic polishing of tungsten metal. Funct. Mater. 2018, 49, 11163–11167. [Google Scholar]
- Yi, R.; Ji, J.; Zhan, Z.; Deng, H. Mechanism study of electropolishing from the perspective of etching isotropy. J. Mater. Process. Technol. 2022, 305, 117599. [Google Scholar] [CrossRef]
- Bojinov, M.; Penkova, Y.; Betova, I.; Karastoyanov, V. Mechanism of Anodic Dissolution of Tungsten in Sulfate–Fluoride Solutions. Metals 2024, 14, 1004. [Google Scholar] [CrossRef]
- Wang, X.; Li, C.; Yu, Z. Study on electrochemical polishing process of Ni-W alloy baseband. Rare Met. Mater. Eng. 2012, 41, 1075–1079. [Google Scholar]
- Fernandes, J. Optimization of Tungsten Electropolishing for Enhanced Anodic Nanostructured WO3 Growth in Solar Water Splitting. Ph.D Thesis, Universidade do Porto, Porto, Portugal, 2023. [Google Scholar]
- Zhou, X.; Wang, F.; Zhang, X.; Deng, H. Electrochemical polishing of microfluidic moulds made of tungsten using a bi-layer electrolyte. J. Mater. Process. Technol. 2021, 292, 117055. [Google Scholar] [CrossRef]
- Landolt, D. Fundamental-Aspects of Electropolishing. Electrochim. Acta 1987, 32, 1–11. [Google Scholar] [CrossRef]
- West, A.C.; Deligianni, H.; Andricacos, P.C. Electrochemical planarization of interconnect metallization. IBM J. Res. Dev. 2005, 49, 37–48. [Google Scholar] [CrossRef]
- Han, W.; Fang, F. Fundamental aspects and recent developments in electropolishing. Int. J. Mach. Tools Manuf. 2019, 139, 1–23. [Google Scholar] [CrossRef]
- Wu, Y.F.; Trai, T.; Lin, J.Y. Some Aspects of Mechanism of Electropolishing of Copper in Phosphoric Acid. Int. J. Electrochem. Sci. 2019, 14, 11035–11047. [Google Scholar] [CrossRef]
- Han, W.; Fang, F. Two-step electropolishing of 316L stainless steel in a sulfuric acid-free electrolyte. J. Mater. Process. Technol. 2020, 279, 116558. [Google Scholar] [CrossRef]
- Zhan, Q.; Li, H.; Wang, Y.; Wang, Z. Effect of eco-friendly organic additives on copper electropolishing and process parameter optimization. Surf. Eng. 2024, 40, 883–894. [Google Scholar] [CrossRef]
- Li, D.Y. Research on the influence factors and mechanism of copper electroplating in phosphoric acid. Ph.D Thesis, Harbin Institute of Technology, Harbin, China, 2013. [Google Scholar]
Disclaimer/Publisher’s Note: The statements, opinions and data contained in all publications are solely those of the individual author(s) and contributor(s) and not of MDPI and/or the editor(s). MDPI and/or the editor(s) disclaim responsibility for any injury to people or property resulting from any ideas, methods, instructions or products referred to in the content. |
© 2025 by the authors. Licensee MDPI, Basel, Switzerland. This article is an open access article distributed under the terms and conditions of the Creative Commons Attribution (CC BY) license (https://creativecommons.org/licenses/by/4.0/).