1. Introduction
Rare earth (RE)-doped phosphate glasses have garnered significant research interest in recent decades due to their exceptional optical properties. These materials exhibit superior rare earth ion solubility, large stimulated emission cross-sections, low nonlinear refractive indices, and high gain coefficients. Such outstanding characteristics have enabled their widespread application in optical amplifiers and laser systems [
1,
2,
3,
4,
5]. Despite extensive research efforts to develop novel RE-doped phosphate glass systems, the fabrication of high-quality RE-doped phosphate glasses remains challenging [
6,
7,
8]. The primary challenge involves effectively eliminating hydroxyl content from the phosphate glass—a critical factor for enhancing laser efficiency and optical quality. Residual hydroxyl groups in the glass matrix interact with active ions, thereby quenching radiative transitions of rare earth (RE) ions and degrading performance [
9,
10,
11,
12,
13]. Moreover, the residual hydroxyl groups in the glass can significantly impact its optical, physical, and chemical properties [
14,
15]. To eliminate the residual hydroxyl groups in phosphate glass, the most commonly employed and effective method is the reactive atmosphere processing (RAP) dehydroxylation technique. In this process, dry oxygen is frequently utilized as both a carrier gas and a protective gas, while carbon tetrachloride (CCl
4), chlorine gas (Cl
2), phosphorus oxychloride (POCl
3), thionyl chloride (SOCl
2), and ammonium hydrogen fluoride (NH
4HF
2) are commonly used as reaction gases [
16,
17]. At high temperatures, the reaction gases chemically react with the hydroxyl groups, and the resulting gases are removed from the phosphate glass matrix. During the glass melting process, chemical reactions can lead to increased volatilization of volatile raw materials, especially phosphorus which, in turn, causes instability in the glass composition [
18,
19,
20,
21,
22]. Furthermore, the dehydroxylation reaction accelerates the erosion of the crucible and stirring facilities, thereby increasing the impurity content [
7,
23,
24,
25]; in addition, the generation of reaction gases is toxic, which poses an environmental hazard.
Recently, Francisco Muñoz et al. reported a dehydroxylation method based on a two-step melting procedure [
26]. Phosphate glass was initially melted in a ceramic crucible at a relatively high temperature. Subsequently, it was re-melted in a graphite crucible at a lower temperature under a nitrogen gas flow. Re-melting the phosphate glass in a graphite crucible at a lower temperature with a nitrogen gas flow is conducive to reducing the hydroxyl content. Moreover, freely molding the phosphate glass in the graphite crucible without casting helps reduce stripes. By employing this two-step melting procedure, the authors obtained Nd
3+-doped phosphate glasses with lower hydroxyl content and high optical homogeneity [
27]. However, during the second melting process, the composition of the phosphate glass and the carbon invasion from the graphite crucible were not systematically investigated.
In this work, the two-step melting method was utilized to fabricate Er3+-Yb3+ co-doped phosphate glasses. The influence of the re-melting procedure on the glass composition and the effects of carbon on the optical properties of phosphate glasses were systematically investigated. Additionally, the dehydroxylation mechanism that was involved in the re-melting process was discussed. We believe that this work will contribute to the further development of novel and high-quality phosphate glasses.
2. Materials and Methods
The two-step melting method was adopted for the fabrication of Er3+-Yb3+ co-doped phosphate glasses. The glass composition was 62P2O5-13K2O-14BaO-2Al2O3-Nb2O5-Sb2O3-4La2O3-2Yb2O3-1Er2O3 (mol %). The precursor glass was obtained through the conventional melting-quenching method. High-purity (99.99%) P2O5, KPO3, Ba(PO3)2, Al(PO3)3, Nb2O5, Sb2O3, La2O3, Yb2O3, and Er2O3 were used as starting materials. A 300 g mixture of the raw materials was weighed according to the aforementioned nominal compositions. The weighed raw materials were homogeneously ground and thoroughly mixed. Subsequently, the mixture was transferred into an alumina crucible and then placed into an electric furnace preheated to 1000 °C. The glass was melted at 1250 °C for 2 h while being stirred with an alumina rod. After melting, the molten glass was poured onto a stainless steel plate preheated to 450 °C. Finally, the glass sample was annealed at 450 °C for 3 h. After annealing, the prepared glass was cut into different sizes and placed in a graphite crucible. It was then transferred into a tube furnace for secondary melting under a N2 atmosphere. The secondary melting temperature was set at 900 °C, and the durations were 8, 12, and 16 h, respectively. Once the re-melting procedure was completed, the furnace was turned off and allowed to cool down naturally. Finally, the glass samples were obtained. To explore the influence of the infiltrated carbon element on the residual hydroxyl content and optical properties of the glasses, a series of glasses with the composition of 62P2O5-13K2O-14BaO-2Al2O3-Nb2O5-Sb2O3-4La2O3-2Yb2O3-1Er2O3 (mol %) − xC (x = 0.01, 0.05, 0.1, 0.15, 0.2, 0.5, 1.0, 1.5, 2.0 wt%) were prepared using the conventional melting-quenching method. The glasses were melted at 1250 °C for 30 min and subsequently annealed at 450 °C for 3 h. The two large surfaces of the obtained glass samples were polished for physical and optical measurements.
The sample was analyzed by DSC using NETZSCHSTA449F3 from Germany. The test conditions were as follows: the heating range was from room temperature to 800 °C, the heating rate was 10 °C per minute, and nitrogen protection was used in the process. The Raman scattering spectra were measured using a commercial triple spectrometer (Jobin Yvon Model T64000) equipped with a charge-coupled device (CCD) detector. An argon-ion laser operating at a wavelength of 514 nm was employed to excite the samples. The absorption and transmission spectra of the glasses in the ultraviolet, visible, and near-infrared (NIR) regions were recorded using a Perkin-Elmer-Lambda 980 spectrophotometer. The infrared transmission spectra of the glass samples were measured with a NICOLET Is10 infrared spectrometer. The element content of the glasses was analyzed based on the X-ray fluorescence (XRF) spectra obtained using an Axios max X-ray fluorescence spectrometer. The NIR fluorescence spectra and decay curves were measured using an Edinburgh FLS920 fluorospectrophotometer, which was excited by a continuously operating diode laser at 976 nm and a pulse laser. The glass densities were calculated according to the Archimedes method. All measurements were carried out at room temperature.
3. Results and Discussion
Figure 1 shows the differential thermal analysis (DSC) curve of the precursor glass sample. The glass transition temperature (
Tg) of the glass was approximately 523 °C, and the initial crystallization temperature (
Tx) was around 704 °C. The difference between the glass transition temperature and the initial crystallization temperature, denoted as
ΔT (
ΔT = Tx −
Tg), was approximately 181 °C. A larger
ΔT value indicates that the glass exhibits excellent anti-crystallization performance, which is conducive to preventing crystallization during the cooling process of the glass liquid along with the furnace.
Figure 2 presents the glass samples obtained after secondary melting in a tube furnace under a N
2 atmosphere. These samples vary in terms of mass, re-melting time, and the size of the graphite crucible used. The secondary melting temperature was set at 900 °C for all the glass samples. The glasses were prepared by re-melting 50 g of precursor glass in a graphite crucible with dimensions of 115 × 22 × 10 mm. These samples were denoted as P–50–8–L, P–50–12–L, and P–50–16–L, corresponding to re-melting times of 8, 12, and 16 h, respectively. The P–25–8–L and P–25–12–L glasses were obtained by re-melting 25 g of precursor glass in a graphite crucible with the same dimensions (115 × 22 × 10 mm). The P–25–8–S glass was re-melted in a square-shaped graphite crucible with dimensions of 44 × 34 × 10 mm. Compared with the untreated glass, the color of the re-melted glasses transitioned from light pink to light purple. As the re-melting time was prolonged and the re-melting mass was decreased, the color of the glass darkened. The color of P–25–8–S is lighter than that of P–25–8–L. This change in the glasses is attributed to the infiltration of carbon (C) into the glasses. The content of the infiltrated carbon depends on the re-melting time and the contact area between the graphite crucible and the glass.
Figure 2b shows the unpolished P–25–8–L glass under red laser irradiation. Photos of the polished glass and the glass under blue laser illumination are presented in
Figure 2c and
Figure 2d, respectively. The glass exhibits high optical homogeneity, with no bubbles or stripes observed in the glass sample.
To explore changes in the composition of the glass during the secondary melting process, X-ray fluorescence (XRF) analysis was conducted on the glasses labeled as P, P–50–8–L, P–50–12–L, and P–50–16–L. The XRF results are presented in
Figure 3. It is evident that the composition of the glasses does not undergo significant changes during re-melting. Based on the formula
, the lattice concentration of Er
3+ ions was calculated and is listed in
Table 1. The lattice concentration of Er
3+ ions and the density of the glass show a slight increase upon re-melting. This increase is attributed to the reduction of hydroxyl groups rather than a change in the glass composition.
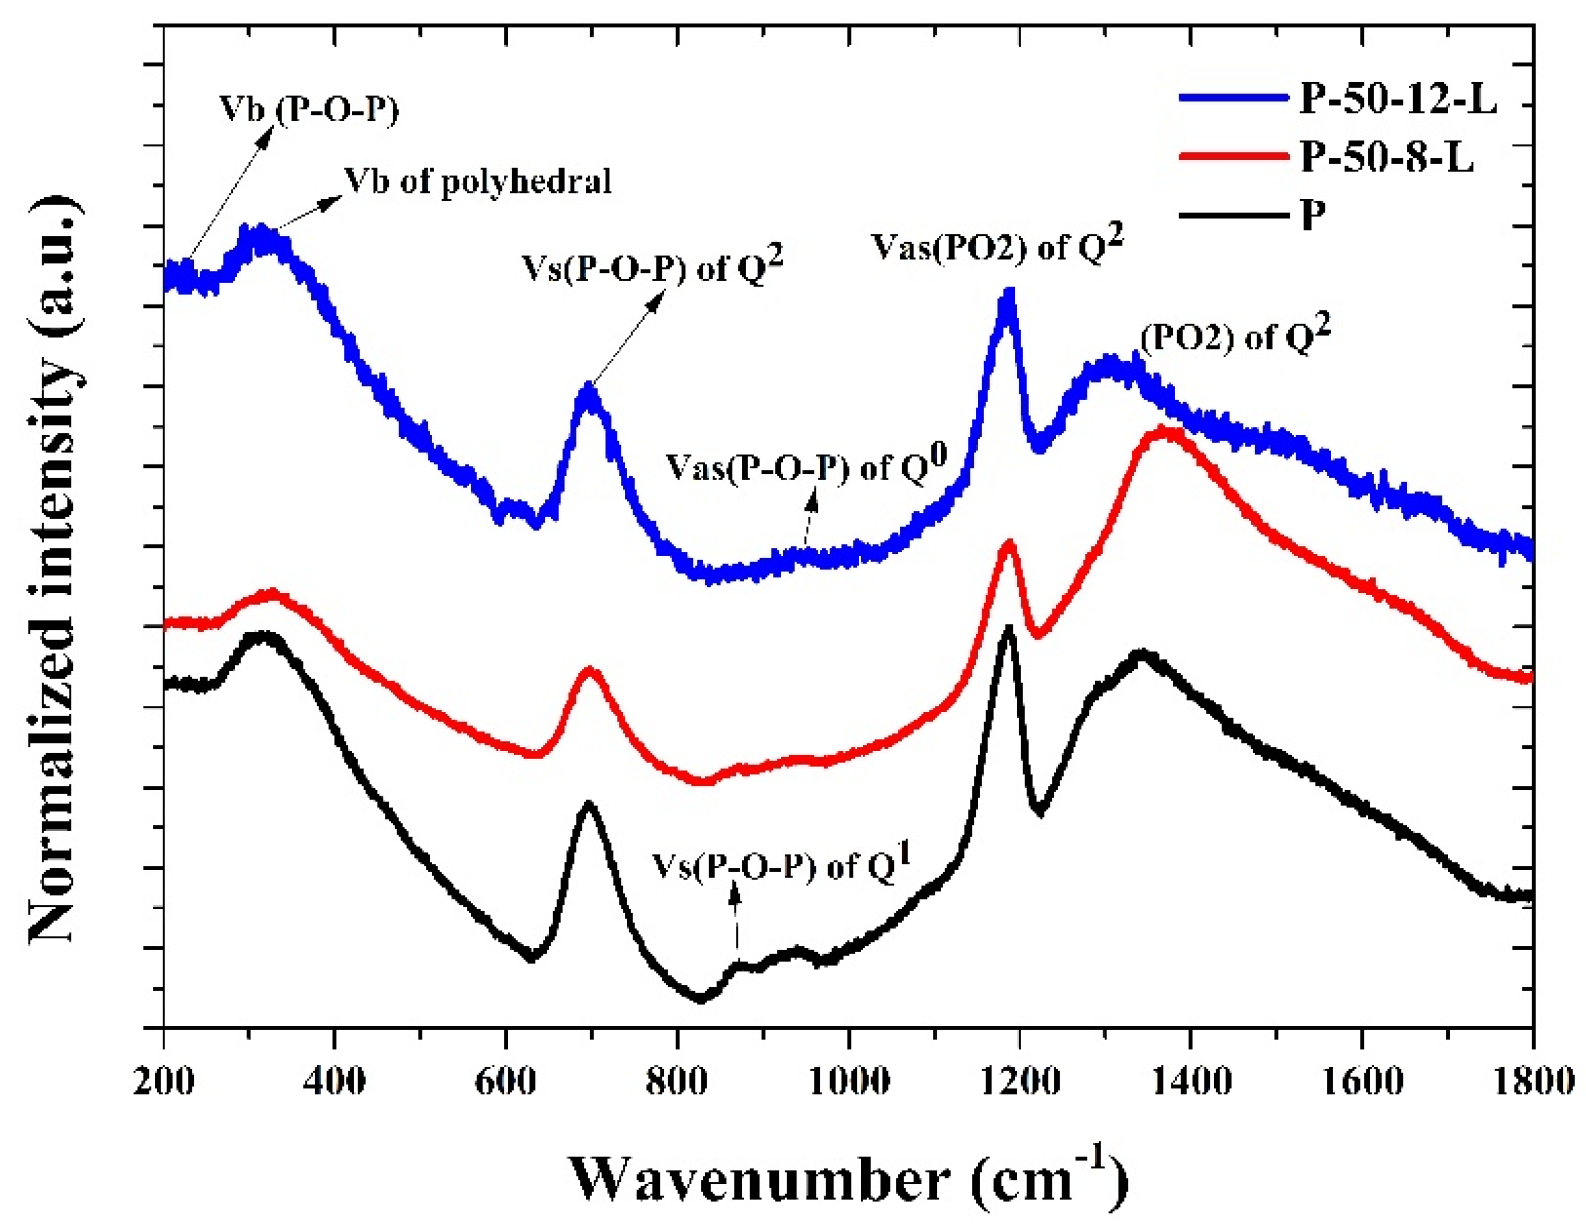
Figure 4 shows the normalized Raman scattering spectra of the P, P–50–8–L, and P–50–12–L glasses. The vibration peak at around 318 cm
−1 is assigned to the bending vibration of the RE-O-RE bond, which is recorded as the (PO) symmetric vibration mode. The vibration peak at approximately 700 cm
−1 is attributed to the symmetrical stretching vibration of the bridge oxygen in the phosphorus–oxygen tetrahedron. The vibration peak near 1200 cm
−1 results from the symmetrical stretching vibration of the non-bridge oxygen in the phosphorus–oxygen tetrahedron, while the vibration peak near 1260 cm
−1 is derived from the asymmetric stretching vibration of the non-bridging oxygen in the phosphorus–oxygen tetrahedron [
28]. The vibration peaks of the glasses re-melted at 900 °C for 8 and 16 h exhibit a blue-shift, indicating that the glass structure becomes more compact and the chemical stability improves as the hydroxyl groups are reduced. The relative vibration peak intensities of the P–50–8–L and P–50–12–L glasses at 700 cm
−1, 1200 cm
−1, and 1260 cm
−1 are greater than those of the untreated glass. This suggests that the stretching vibration of the corresponding groups becomes stronger, and the glass network structure is more condensed. Consequently, this contributes to a slight increase in the lattice concentration of Er
3+ ions and the density of the glass.
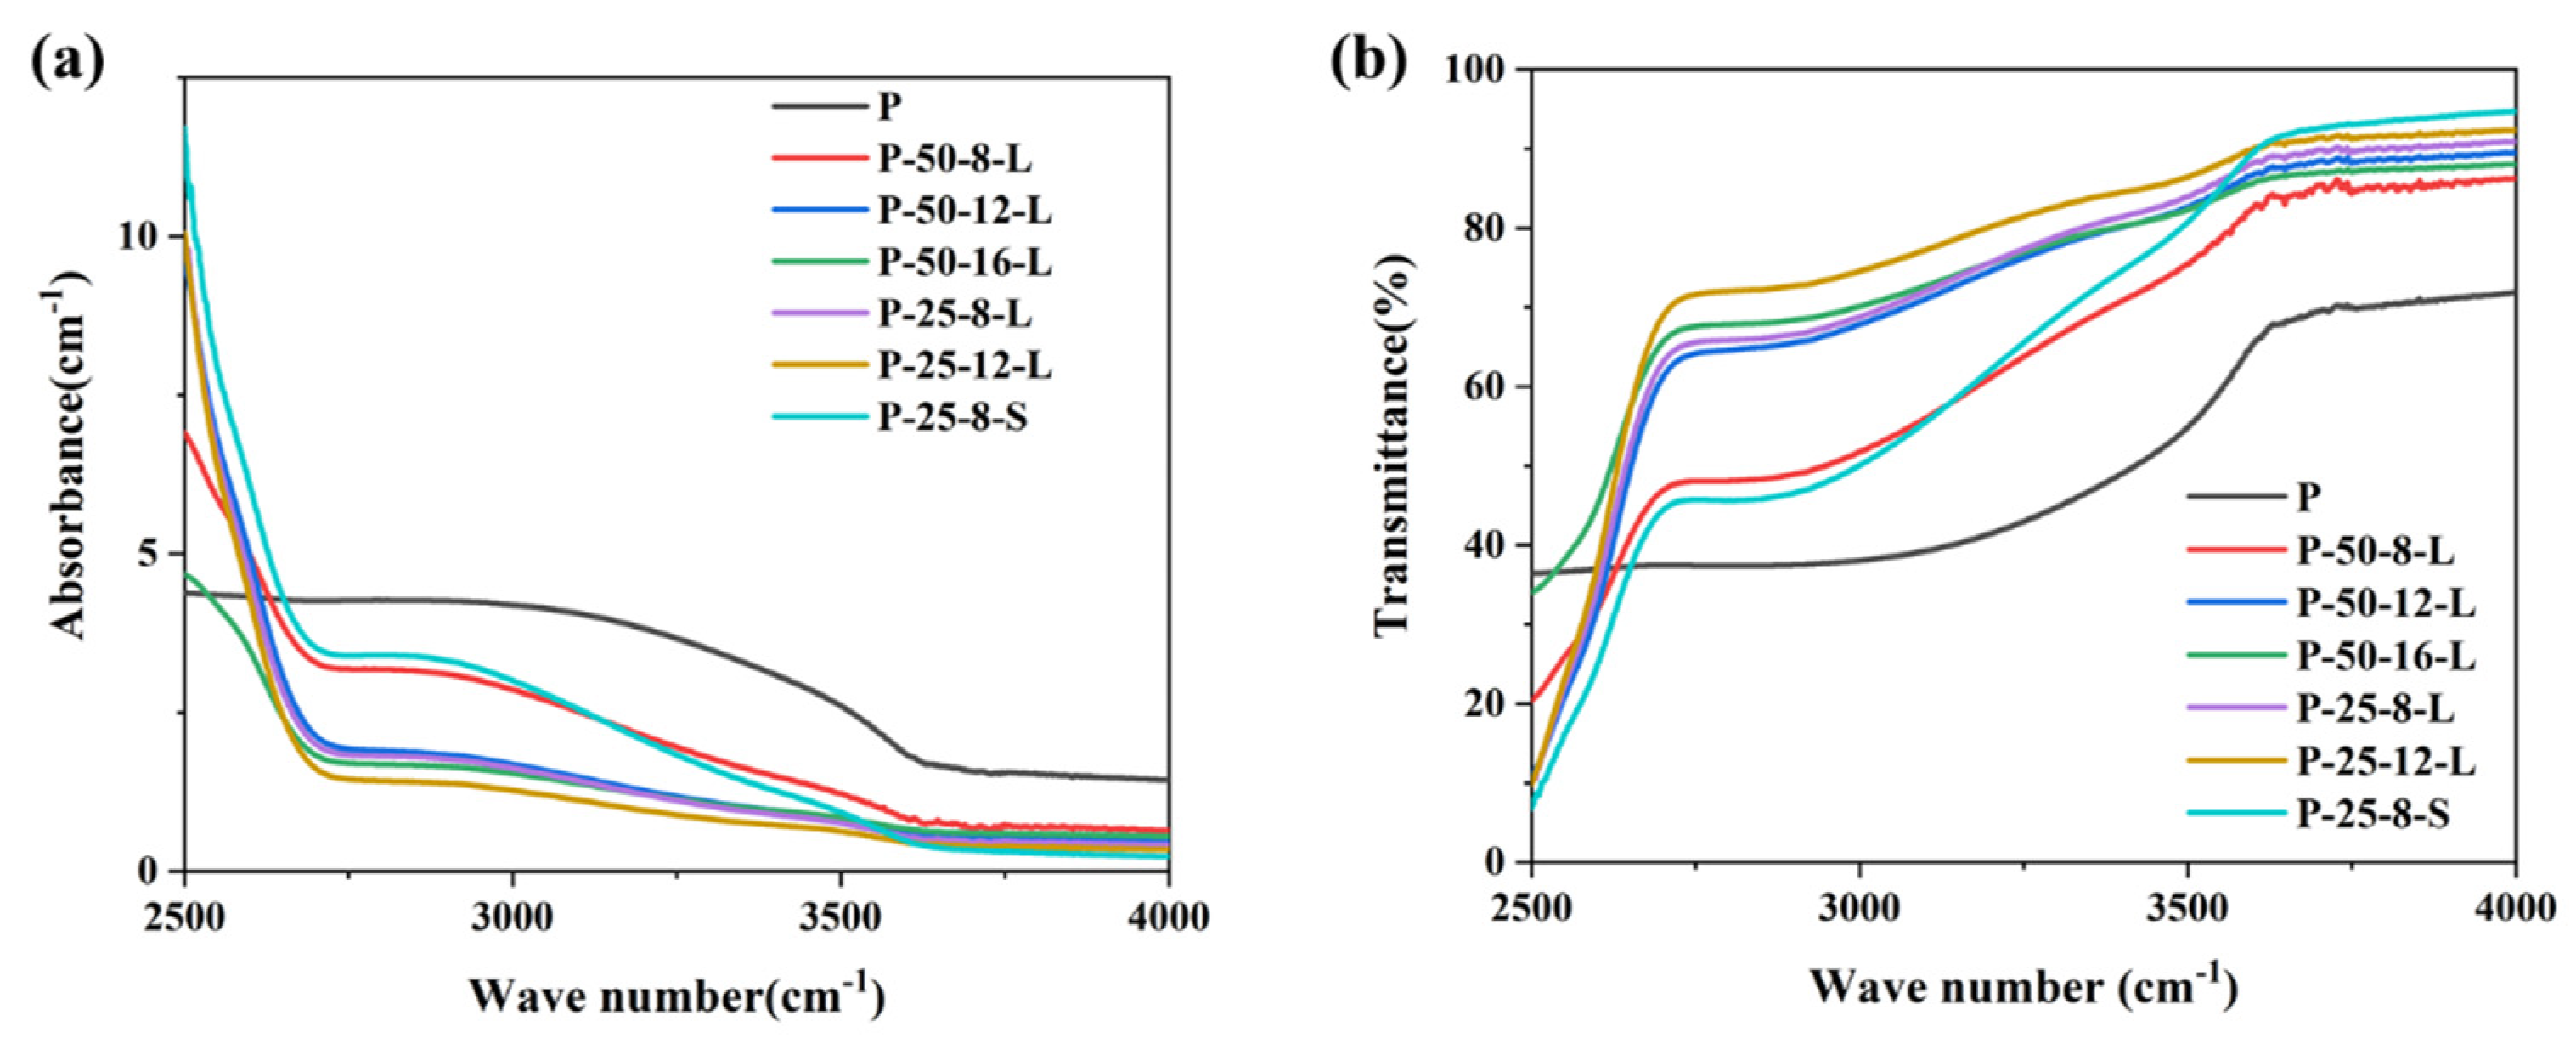
Figure 5a,b present the infrared absorption spectra and transmission spectra of the glass samples in the range of 2500–4000 cm
−1, respectively. A broadband absorption peak is observed at around 2880 cm
−1, which is attributed to the absorption of hydroxyl groups [
29]. The absorption coefficient (
α-OH) can be calculated using the following Equation (1):
where
l is the thickness of the glass sample,
T0 is the transmission of the glass at 4000 cm
−1, and
T is the transmission of the glass at 2880 cm
−1. The calculated
α-OH values of the glass samples are listed in
Table 1. The
α-OH of each glass sample depended on the re-melt mass, the duration, and the contact area between the graphite crucible and the glass. Upon increasing the re-melting time from 8 to 16 h for the glasses with a mass of 50 g, the
α-OH decreased from 2.44 to 1.06 cm
−1. When the re-melt glass was reduced from 50 g to 25 g, the
α-OH was about 50% of that the P–50–8–L glass sample when the same graphite crucible was used. The
α-OH of the P–25–8–S glass sample was about 3.02, which was higher than that of the untreated glass sample. According to the results, we proposed that the dehydroxylation process was related to the physical diffusion of hydroxyl groups. The infiltrated carbon has no effect on the elimination of hydroxyl groups. The depth of the glass liquid in the graphic crucible seriously affects the dehydroxylation process. The depth of the glass liquid of P–25–8–L was about half of that of P–50–8–L, resulting in the lower
α-OH of P–25–8–L when compared with that of P–50–8–L. Upon increasing the re-melting time, the rate of diffusion of the hydroxyl groups became slower, which resulted in the slower decrease in α
-OH in the P–50–16–L and P–25–12–L glasses. The higher
α-OH of the P–25–8–S glass sample was because the glass was not thin enough to allow the efficient diffusion of hydroxyl groups.
Figure 6a exhibits the absorption spectra of the glass samples in the wavelength range 300–1700 nm. The glass samples were highly transparent in the visible to near infrared wavelength range. The glass samples obtained through re-melting showed a weak broadband absorption in the visible wavelength 300–900 nm, which may be due to the reduction in hydroxyl group content and the infiltration of carbon. And the absorption cut-off edge in the ultraviolet range showed a slight red-shift. The ultraviolet region absorption edge was assigned to the transition from localized states at the top of the valence band to the delocalized states in the conduction band. The relationship between the photon energy of the glass and the absorption can expressed by Equation (2) [
30]:
where
α(
ω) is the optical absorption coefficient,
B is a constant,
ħ is the reduced Planck constant,
ω = 2πv and
Eopt are the optical energy gap, and
r is an index that can assume values of 2, 3, 1/2, and 3/2 depending on the nature of the electronic transitions responsible for the absorption. For phosphate glasses, the r was estimated to be 2 [
31]. We re-plotted the optical absorption in terms of absorption by indirect transitions for the glasses, and these are presented in
Figure 6b. The
Eopt can be deduced from the extrapolation of the linear portion of these curves. The value of the
Eopt was consistent with the content of hydroxyl groups in the glasses, as a higher hydroxyl group content produced a higher
Eopt value. The red-shift of the ultraviolet absorption band was due to the transitions of non-bridging oxygen, which binds an excited electron less tightly than bridging oxygen [
32]. When the content of hydroxyl groups decreased, the non-bridging oxygen content of the glass matrix decreased, which resulted in an increase in
Eopt, and the absorption band shifted to a longer wavelength.
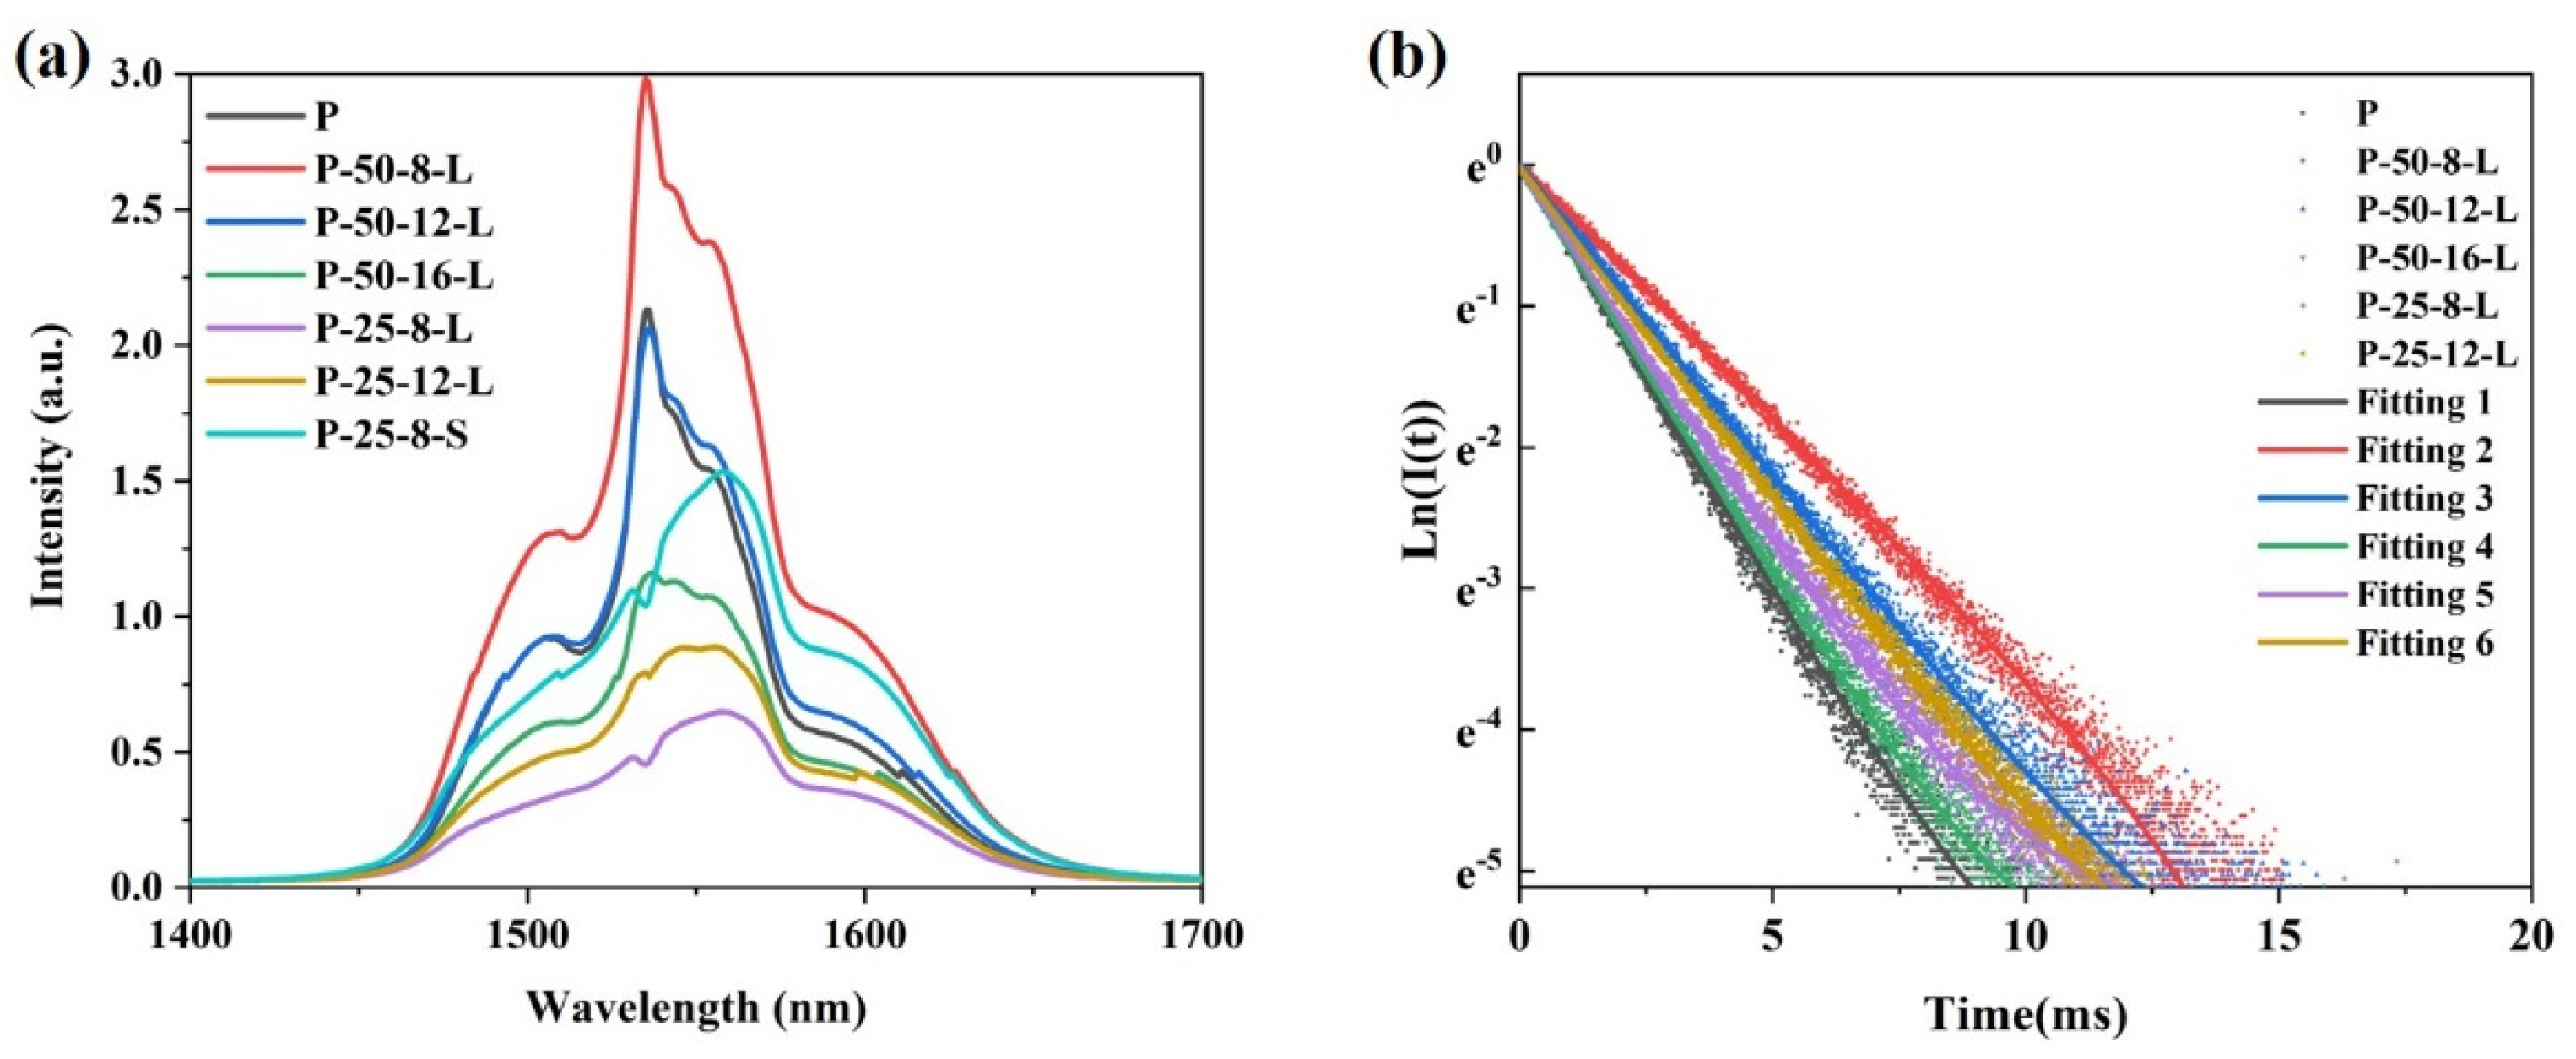
Figure 7a presents the near-infrared (NIR) fluorescence spectra of the glass samples excited by a diode laser operating at 980 nm. A broadband fluorescence band centered at approximately 1550 nm is observed for all the glass samples. Notably, the shape of the peak remains relatively unchanged with variations in the content of residual hydroxyl groups. The intensity of the NIR fluorescence is influenced not only by the content of residual hydroxyl groups in the glass, but also by the reabsorption of Er
3+ within the glass matrix. Due to the greater thickness of the P–50–16–L, P–25–8–L, and P–25–12–L glass samples compared to that of the P glass, the intensity of the NIR fluorescence is weaker for these samples, despite their lower residual hydroxyl group content relative to the precursor glass.
Figure 7b shows the NIR fluorescence decay curves of the glass samples pumped by a diode laser operating at 980 nm. All the fluorescence decay curves follow a single exponential decay pattern. The fluorescence lifetimes of the glass samples were determined by fitting the fluorescence decay curves and are listed in
Table 1. The fluorescence lifetime of Er
3+ is significantly affected by both the hydroxyl group content and the thickness of the glass sample. For the P glass and P–50–8–L glass, which have similar thicknesses, the fluorescence lifetime increases from 1.93 ms to 2.28 ms as the
α-OH value decreases from 2.68 cm
−1 to 2.44 cm
−1. In the case of the P–50–12–L and P–25–8–L glasses, which have similar
α-OH values, the fluorescence lifetime decreases from 2.261 ms to 1.852 ms as the thickness increases from 1.9 mm to 3.63 mm.
Based on the aforementioned results, the two-step melting method has proven to be an efficient approach for fabricating phosphate glasses with reduced hydroxyl group content. The dehydroxylation process is associated with the physical diffusion of hydroxyl groups at elevated temperatures. During this dehydroxylation process, carbon (C) is introduced into the phosphate glass matrix. To elucidate the impact of the introduced carbon on the optical properties of phosphate glass, a series of phosphate glasses with varying carbon contents were prepared using the conventional melting-quenching method. The composition of these phosphate glasses was identical to that of the glasses described above, with the carbon content ranging from 0.01 to 2.0 wt%. The purity of the added carbon powder was 99.99%, and the number of meshes was 20 nm. These glasses are presented in
Figure 8. All the glass samples exhibited high transparency, and no discernible color change was observed with increasing carbon content. The densities of the glasses were measured and are listed in
Table 2. The densities of the glasses containing carbon showed a slight increase, which can be attributed to the introduction of carbon.
Figure 9 displays the infrared transmission spectra of the glasses containing varying amounts of carbon (C). The absorption coefficients (
α-OH) at 2880 cm
−1 for the glasses with different C contents are listed in
Table 2. It was observed that the
α-OH values of the glasses exhibit a random variation with increasing C content. This indicates that the reduction in hydroxyl groups is primarily due to physical diffusion rather than the infiltration of carbon.
Figure 10a presents the absorption spectra of glasses with different C contents. As the C content increases, the glasses gradually absorb more in the visible range. The optical energy gap (
Eopt), derived from the re-absorption spectra (
Figure 10b), does not show a clear correlation with the content of the introduced carbon. However, it is consistent with the changes in
α-OH. This suggests that the weak and broad absorption bands in the visible range, as well as the red-shift of the cut-off edge in the ultraviolet range, result from the reduction in hydroxyl group content rather than the introduction of carbon.
Figure 10c shows the near-infrared (NIR) fluorescence spectra of the glasses. The shape of the fluorescence spectra remains relatively unchanged. The variation in fluorescence intensity is attributed to the hydroxyl group content and re-absorption effects.
Figure 10d presents the NIR fluorescence decay curves of the glasses. The fitted fluorescence lifetimes are listed in
Table 2. The fluorescence lifetimes are consistent with the α
-OH values of the glasses, further confirming the relationship between the hydroxyl group content and the optical properties of the glasses.


