Article

Influence of Germanium Sulfide on the Structure, Ag-Ion Conductivity and Stability of Glasses in the GeS2-Sb2S3-AgI System

Deapartment of Applied Chemistry, Peter the Great Saint-Petersburg Polytechnic University, Saint Petersburg 195251, Russia
*
Author to whom correspondence should be addressed.
Solids 2025, 6(2), 22; https://doi.org/10.3390/solids6020022
Submission received: 27 March 2025 / Revised: 18 April 2025 / Accepted: 3 May 2025 / Published: 9 May 2025

Abstract

:
This article discusses the superionic glassy GeS2-Sb2S3-AgI system with mobile silver ions as a material for creating new energy-efficient solid-state ion emitters. The effect of replacing silver iodide with germanium sulfide on the structure of the electrolyte, activation energy of diffusion, and specific ionic conductivity was studied. Electrolytes (2.5 + x)GeS2-27.5Sb2S3-(70 − x)AgI, x = 0, 5, 10, 15 were synthesized using the melt-quenching technique in evacuated quartz ampoules. The temperature dependence of conductivity and glass stability parameters (Hruby’s, Weinberg’s and Lu–Liu’s) were determined for them, and the mechanism for increasing glass-forming ability was clarified. It was shown that the presence of iodine in a germanium structural unit is more preferable than in an antimony structural unit; germanium structural units compete for iodine, reducing the number of SbI3 crystallization centers and chain terminations, resulting in additional structural connectivity and stability. It was shown that when silver iodide was replaced by germanium sulfide, the decrease in conductivity due to the reduction in charge carriers was less than expected due to the expansion of the conduction channels.

Graphical Abstract

1. Introduction

For the last 20 years, a class of solid-state ion emitters has appeared and has been actively developing [1]. These are all-solid-state devices where the emission of ions from a solid body occurs under the influence of an extraction potential. The emitter is a solid electrolyte deposited on a metal base, the ions of which carry out conductivity in the electrolyte. The emitter is placed into a vacuum chamber where, under the influence of an electric field from one to several tens of kilovolts, ions evaporate from the surface of the solid electrolyte. The use of such emitters as the main component of the propulsion systems of ultra-small satellites of the “CubeSat” format [2], which imposes the requirement to use the largest possible ion mass while maintaining high mobility characteristics, is promising.
One of the most popular types of electrolytes for such emitters is a silver-conductive one. Emitters with silver-ion electrolytes based on phosphate [1] glasses, silicate [3] ones, and crystalline RbAg4I5 [4] are known, but not with sulfide systems. In addition to ion mass, an important characteristic of the electrolyte for ion emission is ionic conductivity. A large number of sulfide silver-ion electrolytes with a conductivity of 10−3 S/cm and even 10−2 S/cm are known: for example, AgI-Ag3AsO4 [5] materials based on AgI and Ag2CrO4, Ag2MoO4, and Ag2WO4 [6]. However, they lose their conductivity properties due to crystallization and degradation, which makes them unsuitable for practical use. Among crystalline superionic silver-conducting electrolytes, materials based on rubidium silver pentaiodide stand out [4]. However, they also have a problem with resistance to decomposition, react with atmospheric gases, and are unstable at low temperatures.
Of the large number of known highly conductive Ag+-ion electrolytes, the GeS2-Sb2S3-AgI system, published by Lin et al. [7,8], stands out. Its main advantage, as described in the literature, is its low activation energy of the diffusion of silver ions (0.07 eV). The authors also declare this system to be resistant to atmospheric gases and to decomposition into phases over time. Such advantages make this system a good candidate in the search for stable glassy electrolytes with a conductivity of 10−3 S/cm for all-solid-state silver-ion batteries and silver-ion emitters, and the relatively low activation energy makes the conductivity properties more stable, which ensures the operation of such devices over a wider temperature range without significantly changing their characteristics. Potentially, a low value of activation energy of diffusion may have a positive effect on the threshold voltage of the silver-ion emission current. A flexible chalcogenide network may compensate for mechanical stresses arising from temperature changes during operation.
According to the available literature data, when silver iodide is introduced into non-vitreous Sb2S3, the structural chemical units—tetrahedra [SbS3/2]—are transformed into structural units of the [Sb3−xIx] type, forming chains [8,9], which explains the region of stable glass transition in the range of 30–67 mol.% AgI [10]. Silver ions occupy the voids formed by tetrahedra, and the chains are interconnected by Van der Waals forces. With an increase in silver iodide content above 67 mol.%, the iodine content in structural units increases until the formation of SbI3, which are chain terminators. That leads to a decrease in the average chain length and an increase in the tendency to crystallize due to a decrease in viscosity in the glass transition range.
However, the best composition, 2.5GeS2-27.5Sb2S3-70AgI, obtained in [8], is still characterized by a tendency to crystallize, which is indirectly expressed in the production method by quenching in ice water. To clarify the effect of GeS2 on the structure and understand the mechanism of increasing glasses’ stability in this system, a number of compositions, (2.5 + x)GeS2-27.5Sb2S3-(70 − x)AgI, x = 0, 5, 10, 15, were chosen with the replacing of silver iodide as a source of iodine terminating the chain and reducing the glass-forming ability with germanium (IV) sulfide.
The aim of this research was to expand the range of stable solid Ag+-ion electrolytes with conductivity at the level of 10−3 S/cm and low activation energy for ion emission and other applications.

2. Materials and Methods

Glassy electrolytes (2.5 + x)GeS2-27.5Sb2S3-(70 − x)AgI (x = 0, 2.5, 5, 10, 15) were synthesized from Ge, Sb, and S (all chemical grades), and AgI was mixed in a stoichiometric amount. Silver iodide was synthesized in advance from silver nitrate and potassium iodide (both chemical grade) and washed with distilled water and filtered 2 times. The mixture was placed into a quartz ampoule and then evacuated (residual gas pressure was 10−3 Pa). Synthesis was carried out in a rocking furnace. The synthesis temperature was 980 °C, the synthesis time was 5 h. Before quenching, the temperature was lowered to 750 °C. Quenching was carried out in water cooled to 1–2 °C. To eliminate internal stresses, annealing was carried out for 3 h at a temperature of 40 °C below the glass transition temperature.
The amorphous nature of the glasses was confirmed by X-ray diffraction (XRD) measurement (Bruker D8 Advance, Karlsruhe, Germany; 40 kV; 40 mA; CuKα).
Differential thermal analysis was carried out on a AnalitpriborTermoscan-2 device in heating mode, used to determine phase transitions of the first and second order at a heating rate of 5 °C/min; Al2O3 powder was used as a standard. The measurement error was no more than ±5 °C.
Raman spectra were recorded at a room temperature using a Bruker Senterra Dispersive Raman spectrometer with a confocal microscope in back reflection geometry. The radiation source was a semiconductor laser with a wavelength of 532 nm and a power of 10 mW. The radiation was focused using an X40 microlens. The measured spectra were normalized to 1 s.
The specific ionic conductivity of the glasses under study was determined using an MNIPI E7-30 immittance analyzer. Conductive layers of graphite (Graphit 33 spray) were deposited onto the resulting glassy electrolytes on both sides and were used as blocking electrodes. The measurements were carried out in the frequency range from 25 Hz to 3 MHz. The cell constant was determined as the ratio of the graphite layer area to the thickness of the electrolyte. Based on the data obtained, Nyquist plots were plotted, and the conductivity was determined as the reciprocal value of the real resistance obtained by modeling the equivalent circuit in the Z-View program.
The density of the samples d (g/cm3) was determined by hydrostatic weighing in toluene, the density of which, in turn, was controlled using a single-crystal germanium sample; lever scales of the VLR-200g-M brand were used with an error of 0.0001 g.
To assess the stability of the glass, the 3 most popular parameters were used: the Hruby’s parameter (KH), the Weinberg parameter (KW), and the Lu–Liu parameter (KLL). They were calculated according to the following expressions [11]:
K H = T x T g T m T x ,
K W = T c T g T m ,
K L L = T x T g + T m ,
where Tx is the onset crystallization temperature, Tg is the glass transition temperature, Tm is the melting temperature, and Tc is the maximum crystallization peak temperature.

3. Results and Discussion

3.1. Glass Formation and Short-Range Order Structure

Figure 1 shows the extended ternary diagram for the GeS2-Sb2S3-AgI system. The ternary diagram was originally presented by Lin et al. [7,8].
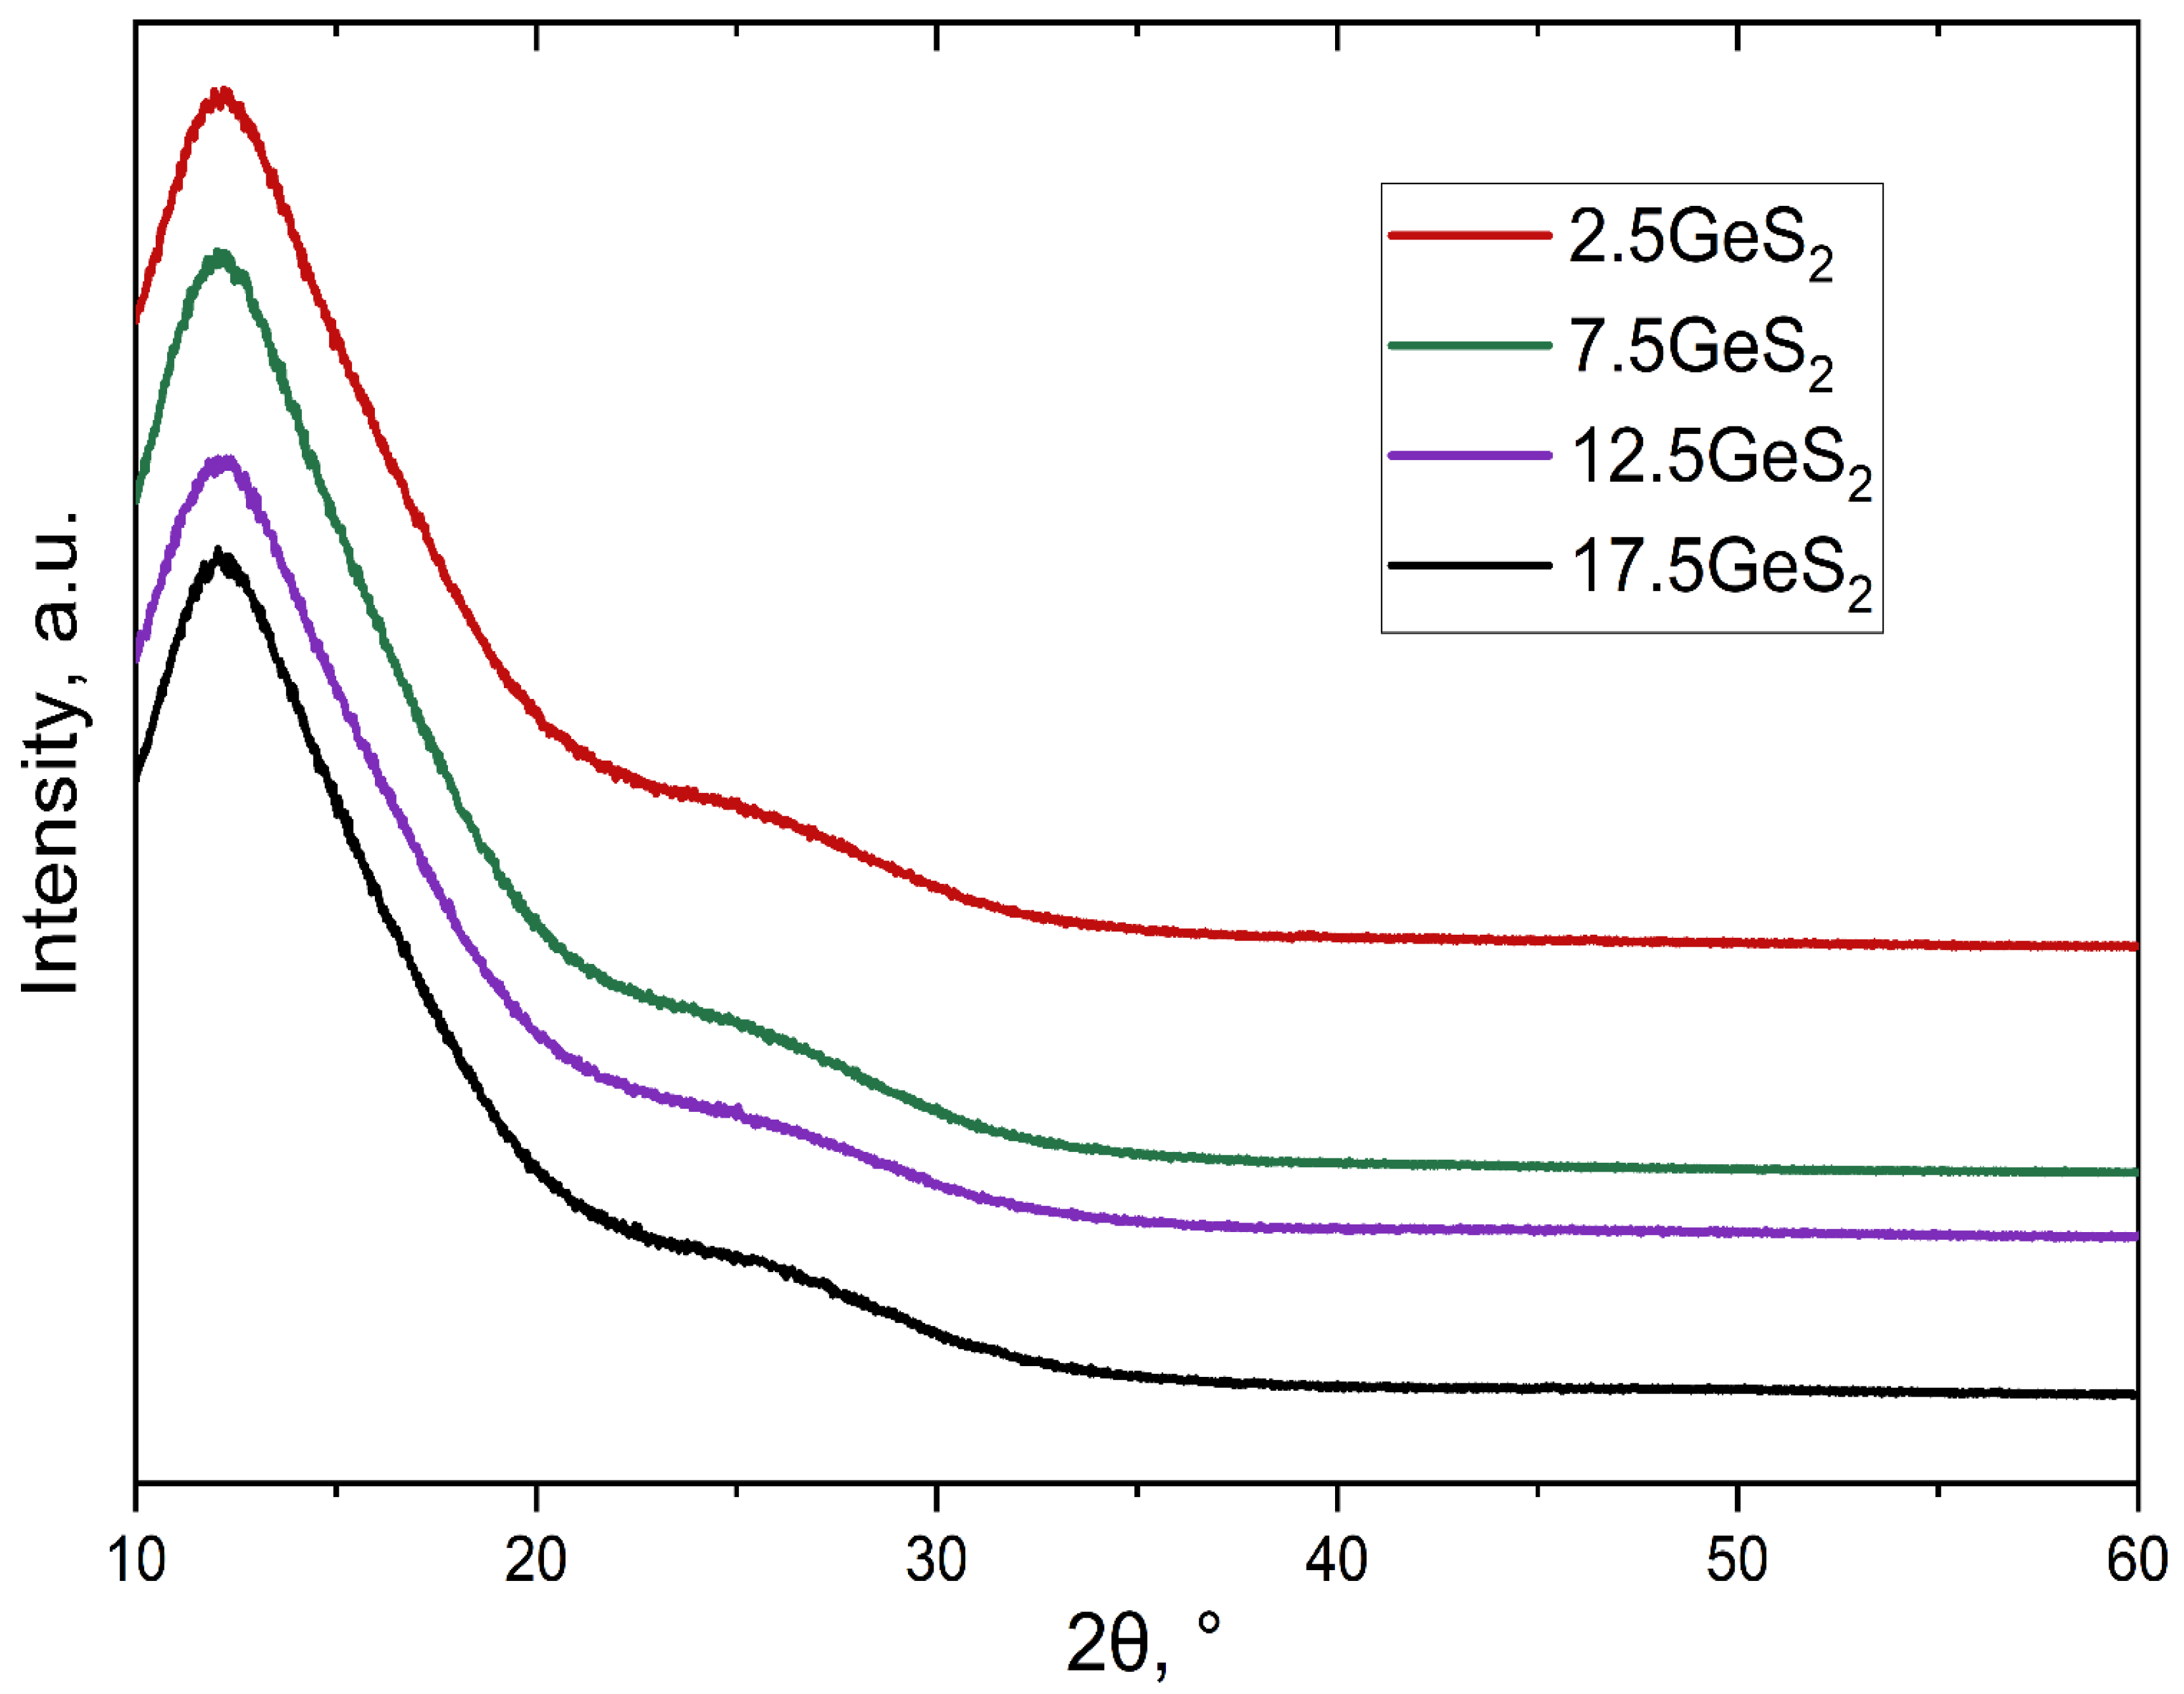
It can be seen that the samples of the system under study were obtained in the glass-formation region. Their amorphous characteristics were confirmed by X-ray diffraction. Figure 2 shows the X-ray diffraction patterns of the synthesized glasses. The figure shows that the glasses were amorphous and no crystalline phases were detected.
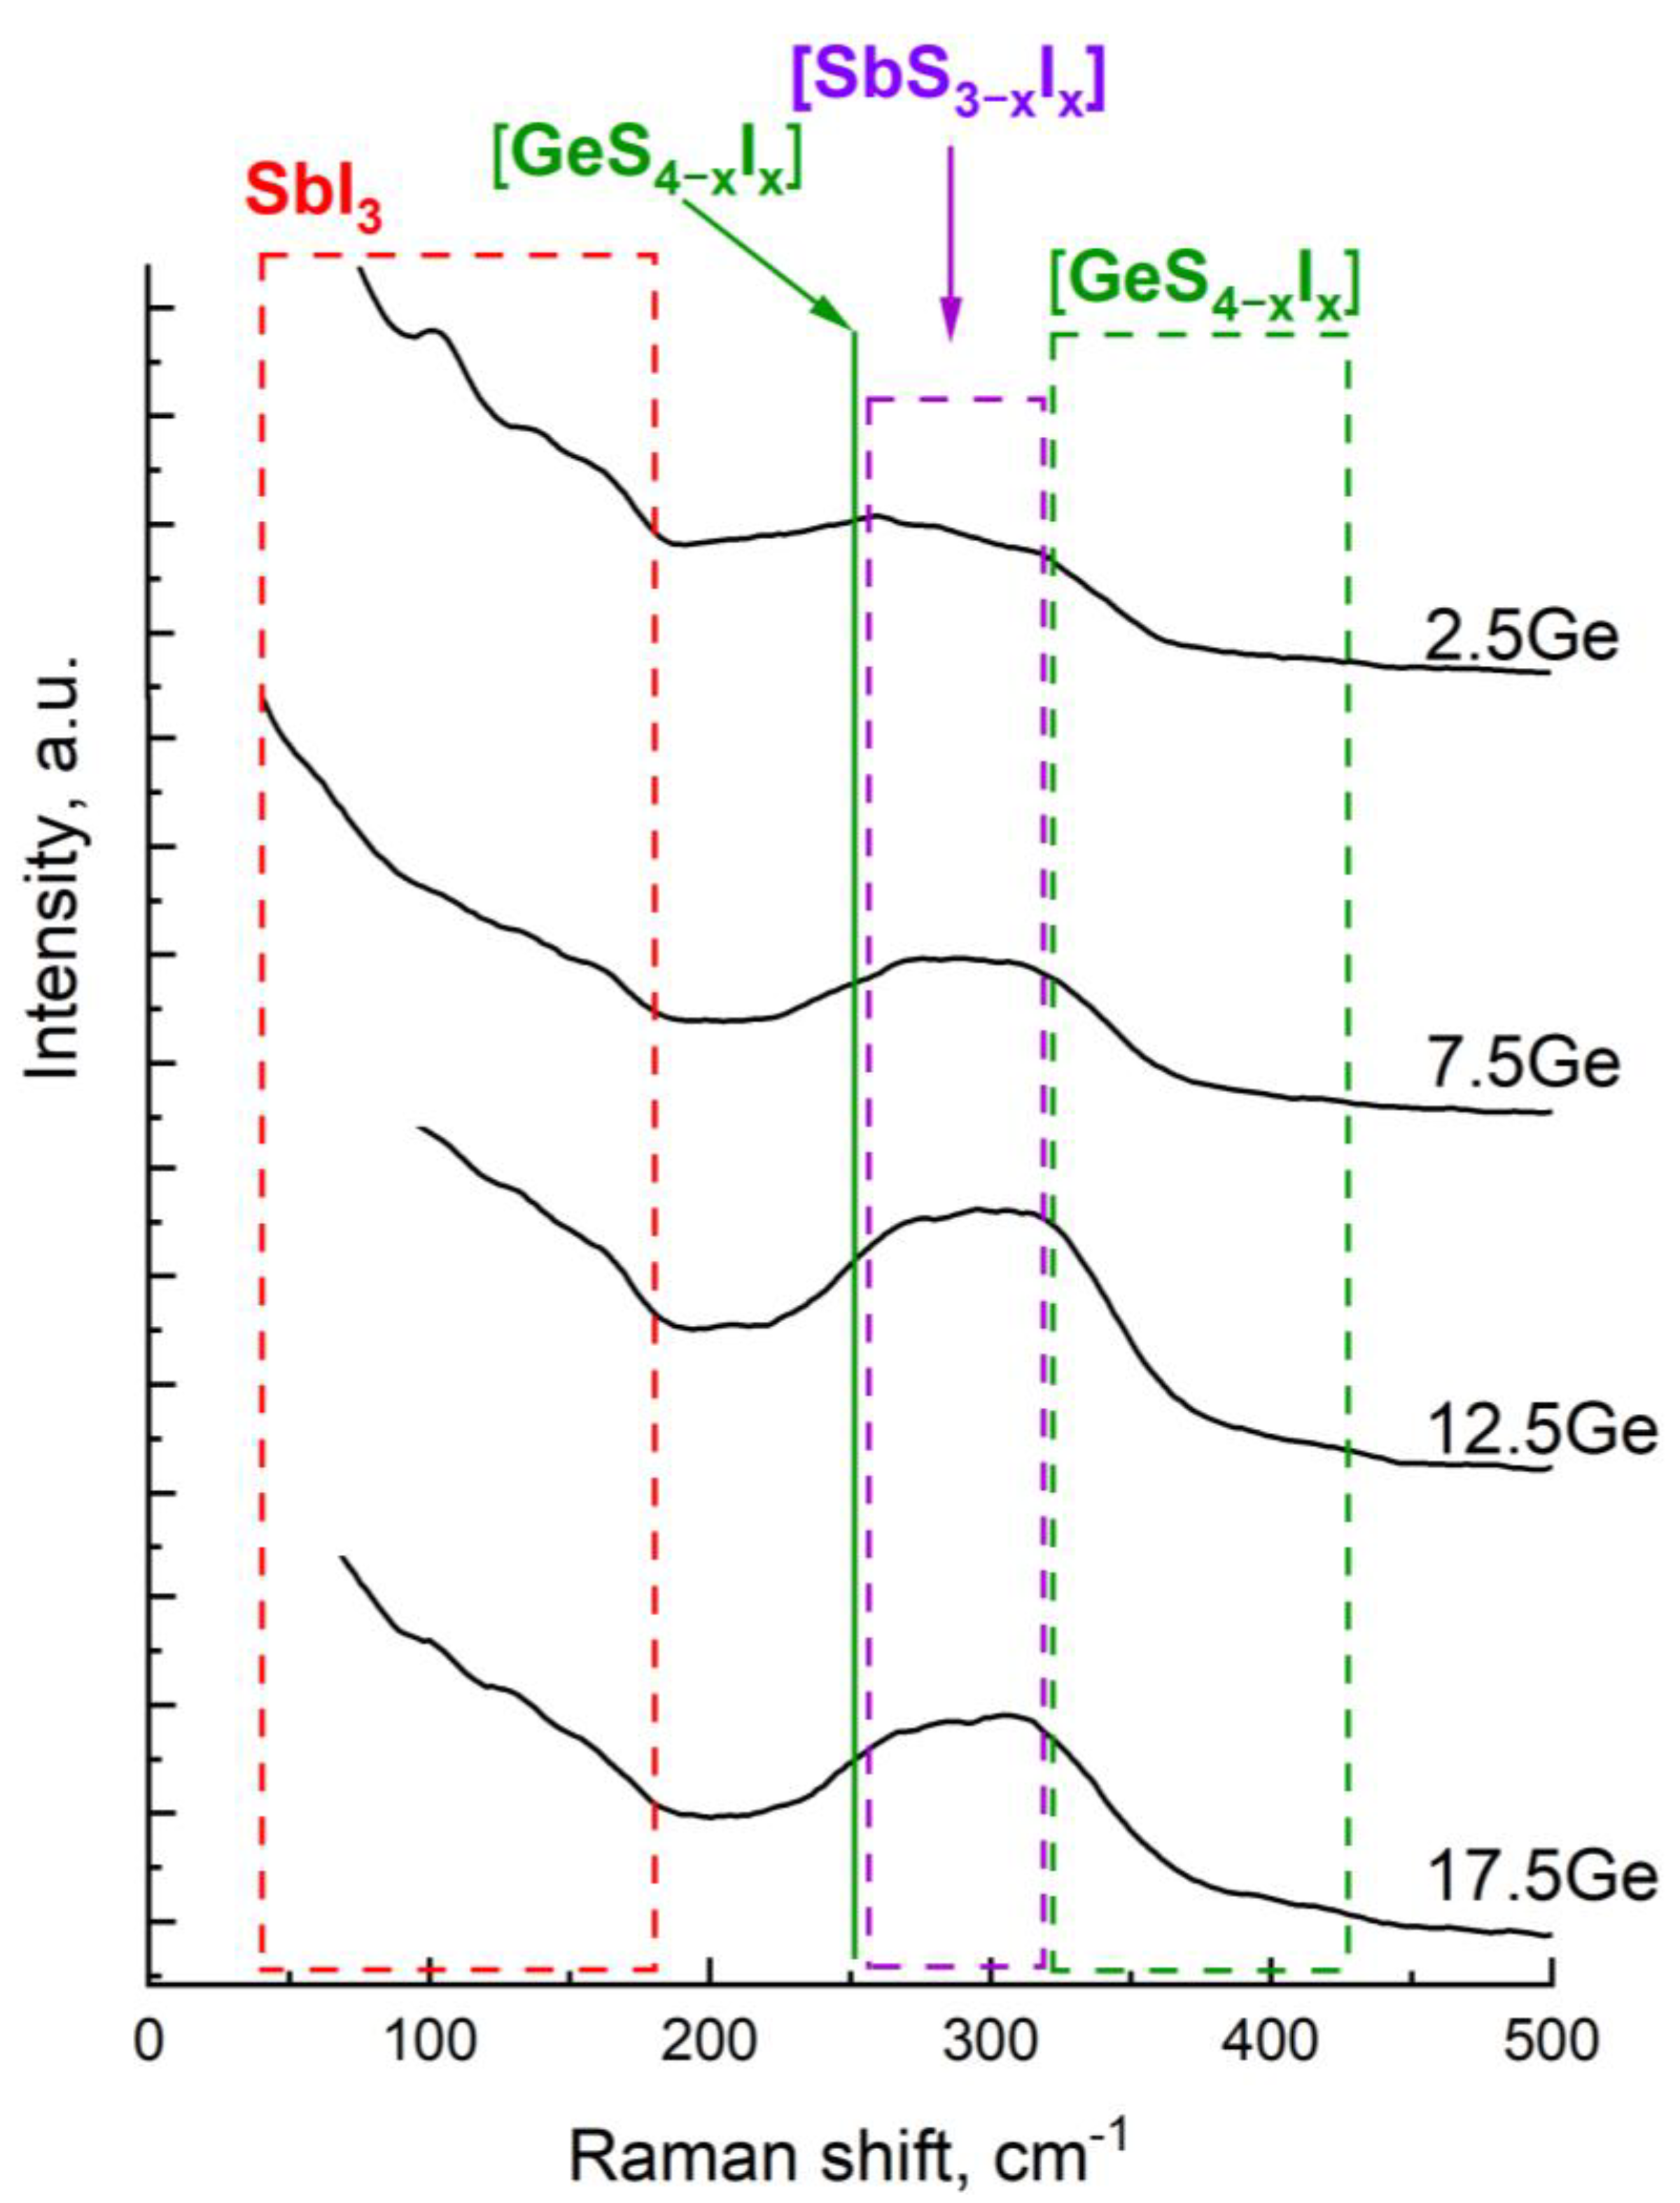
To establish the direct influence of germanium (IV) sulfide on the structure of short-range order, we recorded the Raman spectra of our samples when germanium sulfide replaced silver iodide in the structure. Despite the strong Rayleigh scattering in the low-frequency region, all the bands described in the literature were identified.
As it is known from the literature, with the addition of germanium sulfide (GeS2), a new structural chemical unit [GeS4−xIx] is formed [12] which expands the conduction channels [8], reducing steric hindrances during the movement of ion in the structure, and reducing thereby the activation energy. However, the effect of GeS2 has not been fully studied, in particular on the properties of ionic conductivity.
It is clear from Figure 3 that when silver iodide is replaced by germanium sulfide, the intensity of vibrations corresponding to the structural group SbI3 [13] weakens (bands in the range of 106–163 inverse centimeters), the intensity of the band in the region of 250 inverse centimeters increases, corresponding to the structural unit [GeSxI4−x] [14], and the intensity in the region of 314 inverse centimeters, responsible for vibrations in Sb2S3, increases [15].
As can be seen from Figure 3, the bands overlap greatly, forming ranges. To obtain more information, the peaks were decomposed (Figure 4, Table 1) into individual bands corresponding to those previously published in the literature.
Figure 4a,c shows that the intensity of the bands associated with SbI3 33, 70, 135, 161, and SbSI 105 cm−1 is greatly reduced.
As can be seen from Figure 3 and Figure 4 and Table 1, with an increase in germanium content, the intensity of vibrations in the range of 200–450 cm−1 increases significantly. In particular, the intensity of the bands in the region of 315, 290 cm−1, associated with Sb2S3, increases, and the intensity of the bands in the region of 410, 370, 260, associated in literature with GeS4, increases as well. In the publication [23], the band at 240 cm−1 is attributed to Sb-S vibrations. The intensity of the band at 230 cm−1 present in this range, attributed to Sb-S vibrations [24], decreases. It is worth noting that even without decomposing the peaks into components, with increasing germanium content the peaks shift to higher frequencies. These changes in the Raman spectra indicate an increase in the sulfur content (a decrease in x) in the structural units [SbS3−xIx] and [GeS4−xIx].
The results of Raman spectroscopy demonstrate a decrease in the intensity of the bands corresponding to SbI3 and an increase in the intensity of the bands corresponding to Sb2S3, which occurs to a much greater extent than the decrease in iodine content in the glass composition due to the substitution of silver iodide by germanium sulfide. This finding suggests that iodine binds preferentially to germanium rather than to antimony. This hypothesis can be substantiated by the higher energy of the Ge-I bond in GeI4 (219.4 kJ/mol of bonds) in comparison to Sb-I (196.8 kJ/mol of bonds) in SbI3, as calculated in accordance with Hess’s law using thermochemical tabular data (data for calculation: ∆H0formSbI3gas = −7.9 kJ/mol, ∆H0formSbgas = 268.2 kJ/mol, ∆H0formIgas = 106.76 kJ/mol, ∆H0formGeI4 gas = −74 kJ/mol, ∆H0form Ge(gas) = 376.6 kJ/mol [25]).
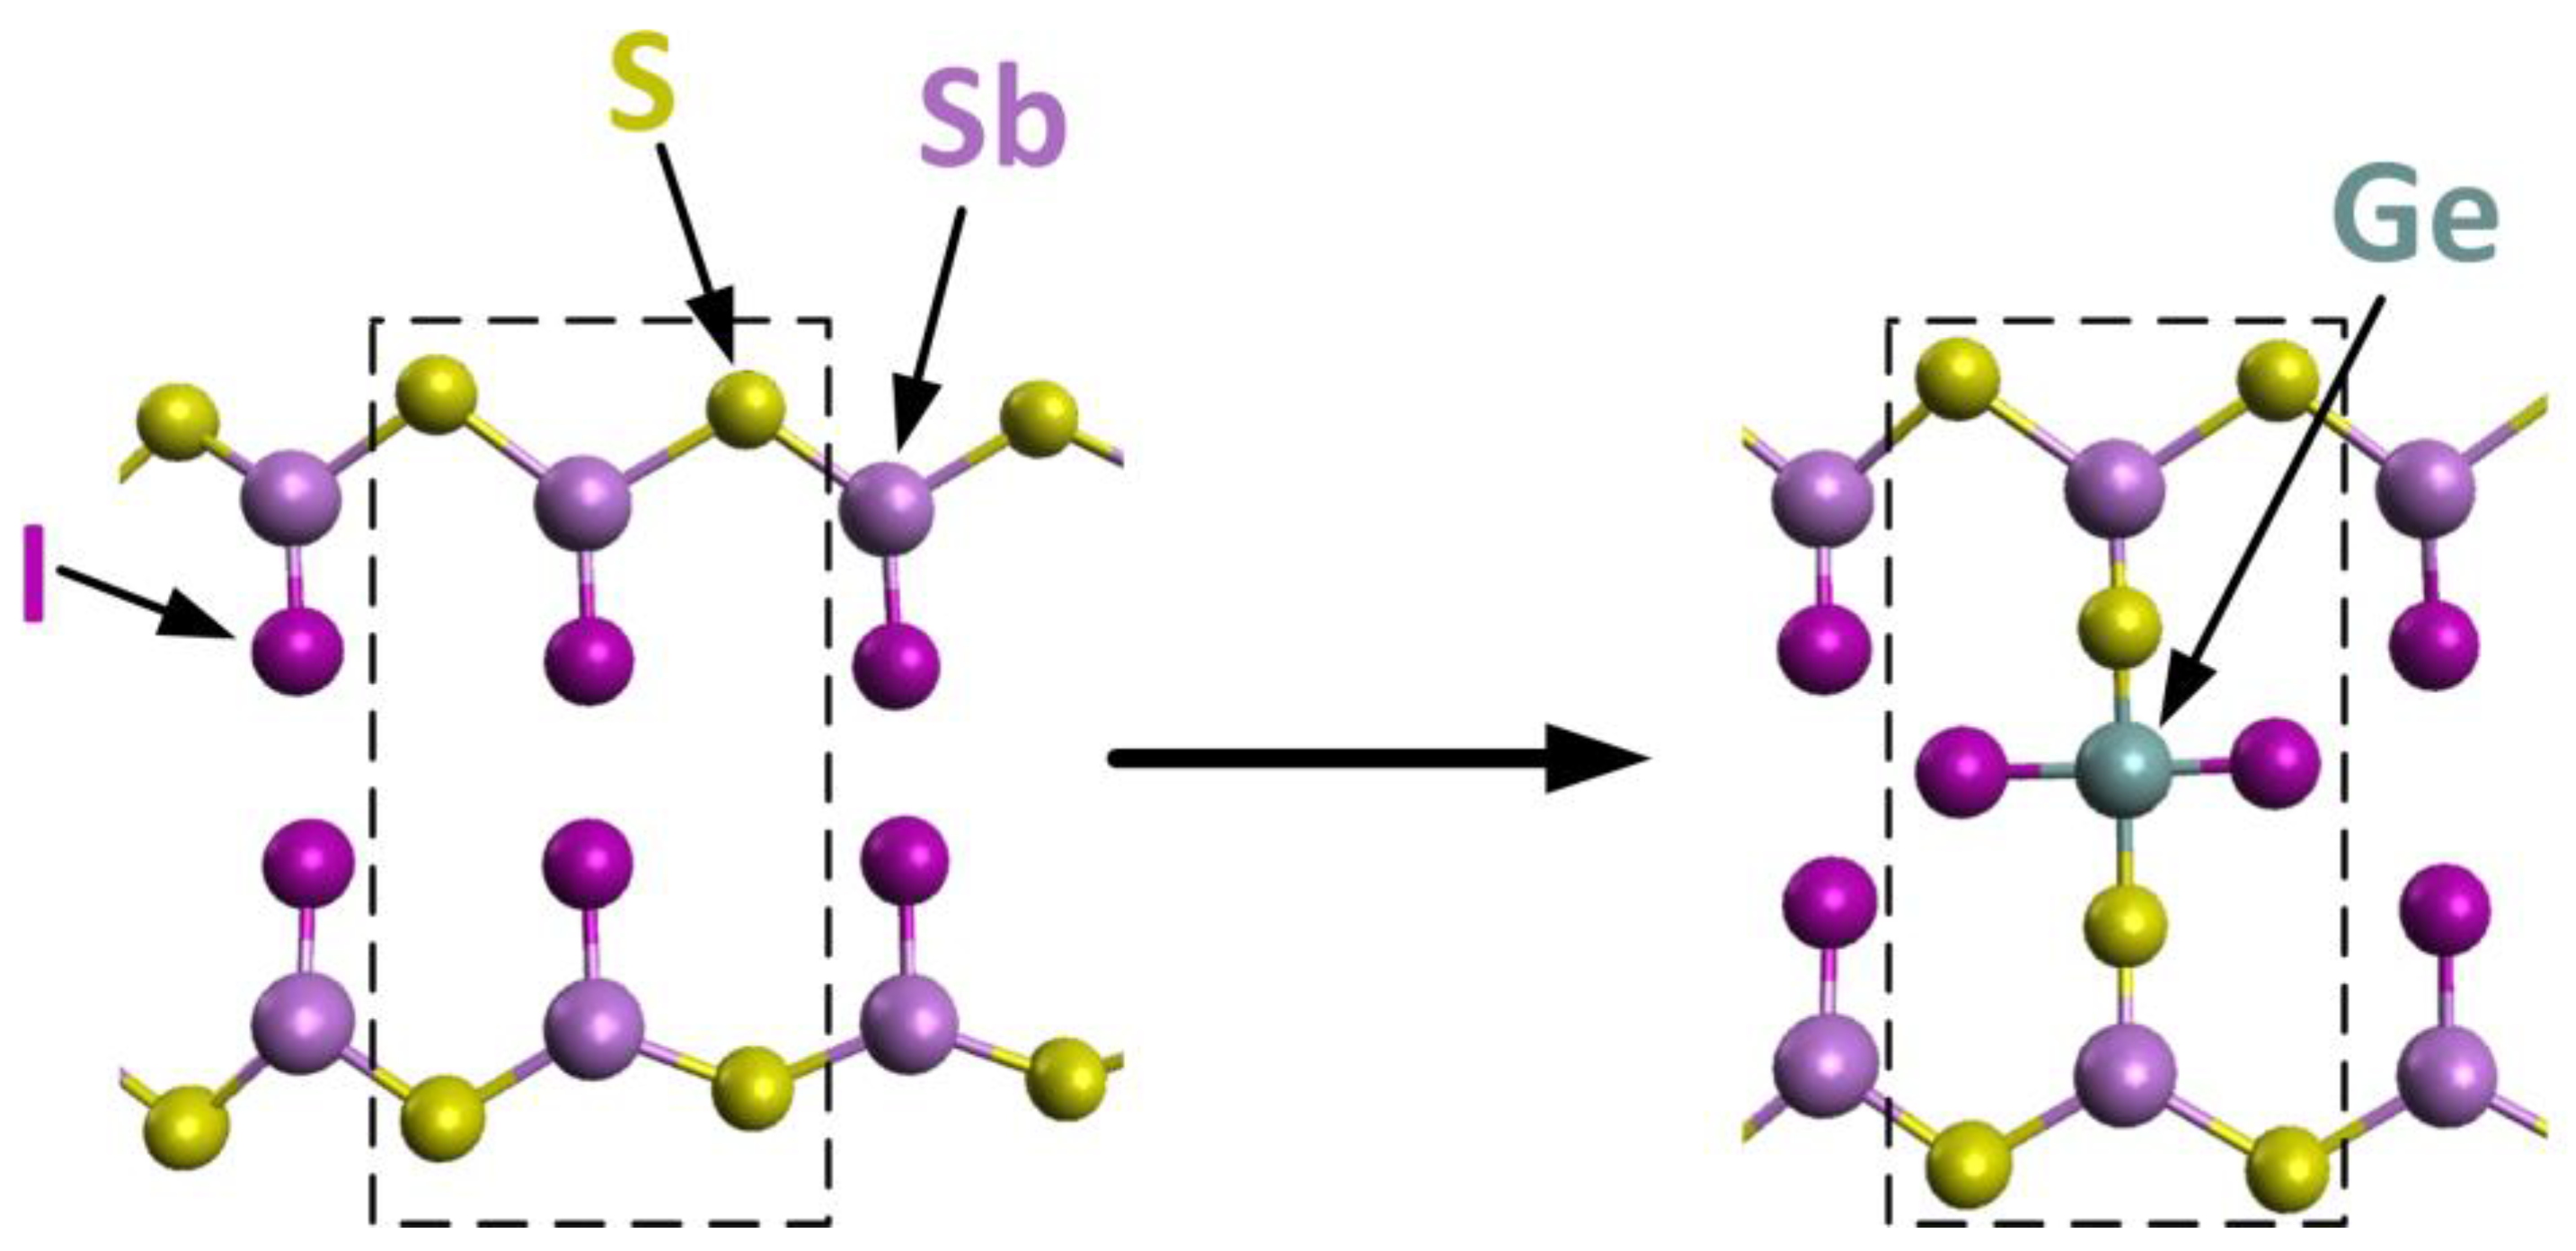
Given the higher affinity of iodine for germanium as opposed to antimony, the incorporation of a germanium structural chemical unit between [SbS2I] chains is likely to result in [GeS2I2] structural unit formation. This is due to the crosslinking of layers, which enhances stability and creates steric hindrances during the diffusion of ions in the conduction channel, as illustrated in Figure 5 and expressed in the following equation:
2[SbS2I] (SbSI) + [GeS4] → 2[SbS3] + [GeS2I2]
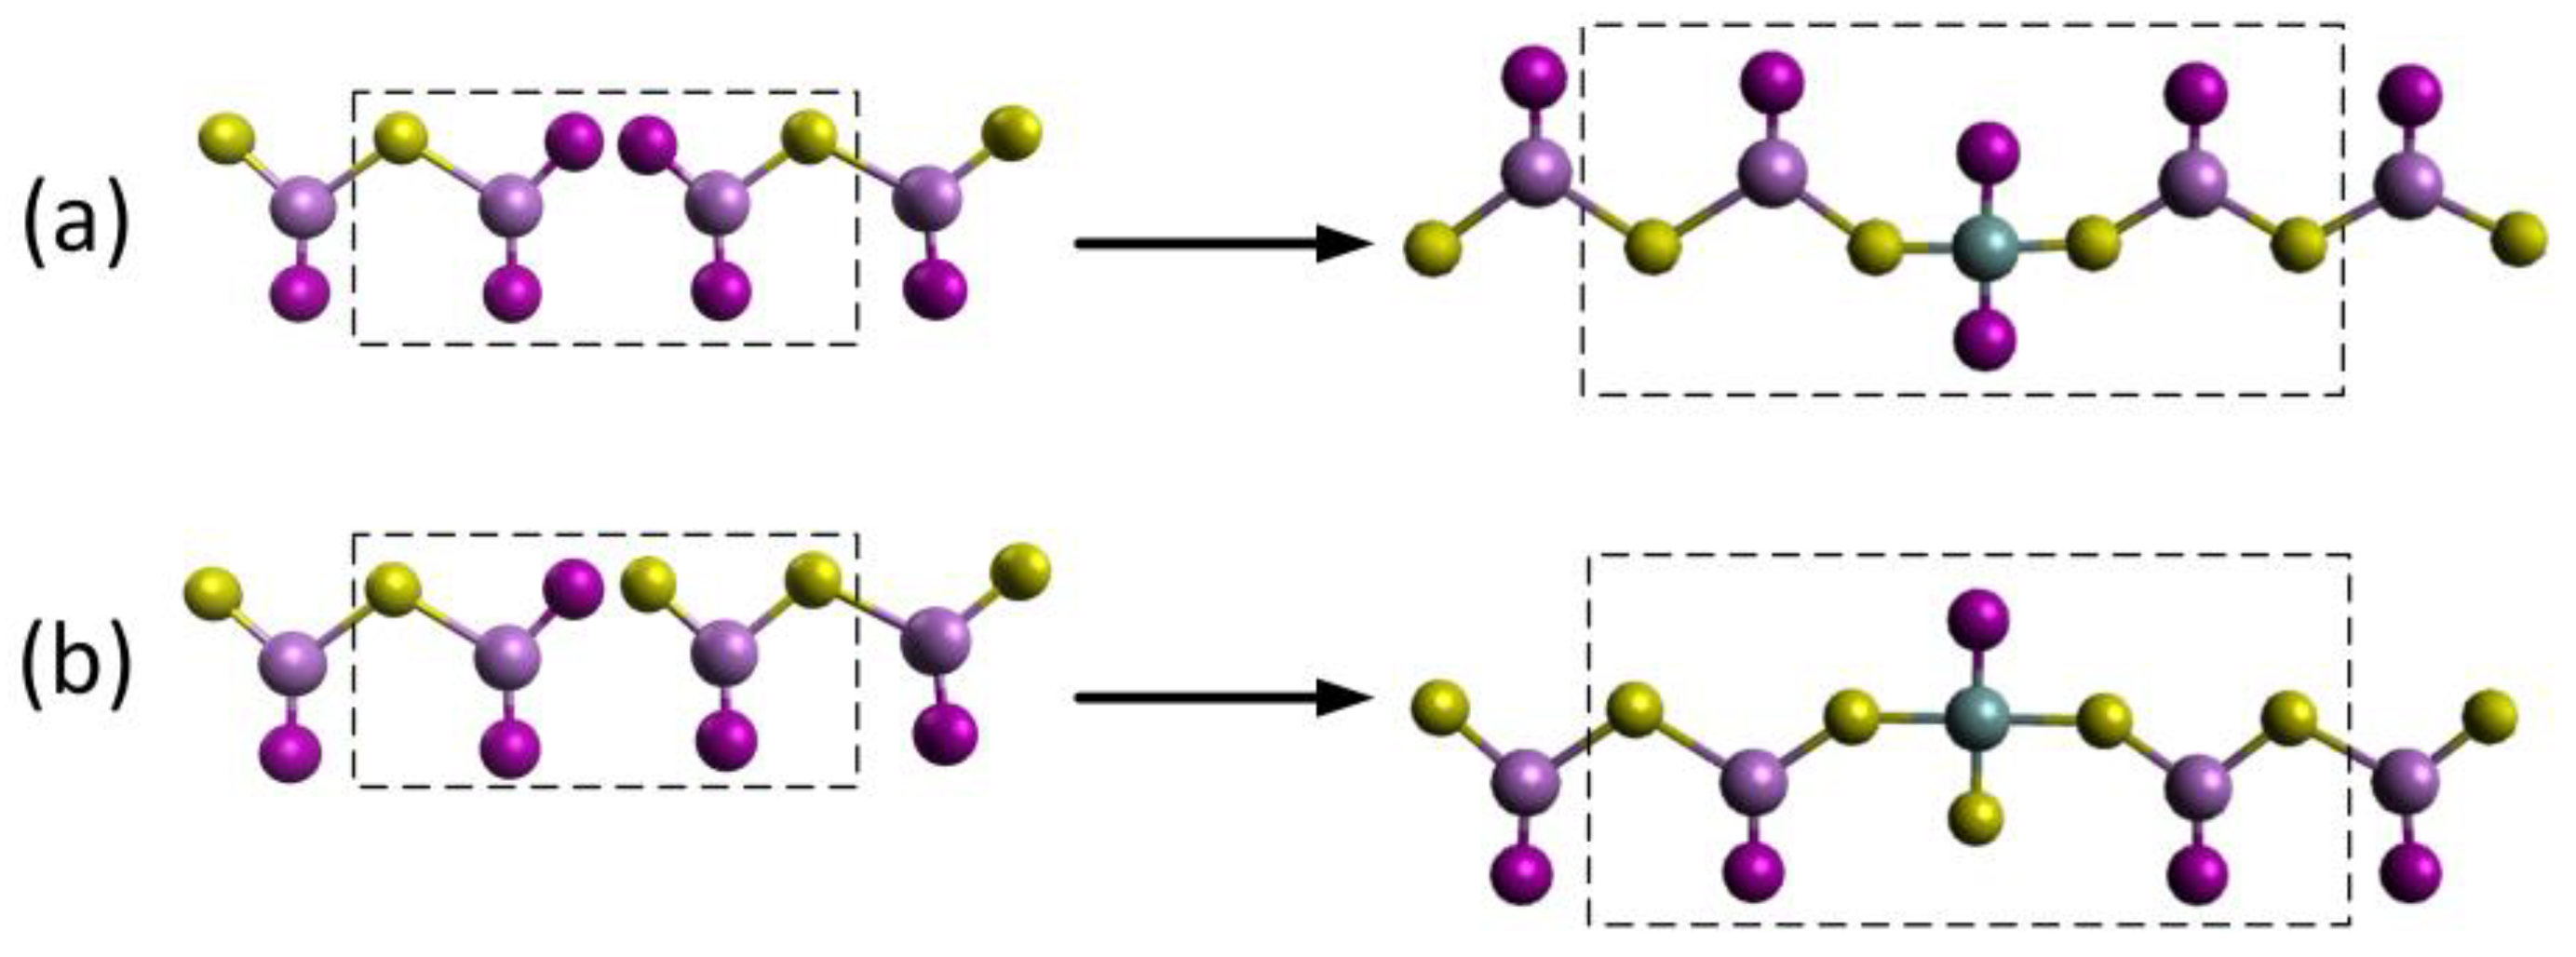
It is also likely that the structure contains fragments where the chain termination by the [SbSI2] terminator can be neutralized by the incorporation of a germanium tetrahedron. This should facilitate the diffusion of silver ions due to reduced steric hindrance and an increase in the average chain length, as illustrated in Figure 6 and expressed in the following equations:
2[SbSI2] + [GeS4] → 2[SbS2I]+ [GeS2I2]
[SbS2I] + [SbSI2] + [GeS4] → 2[SbS2I]+ [GeS3I]
Thus, replacing silver iodide with germanium sulfide leads to the following changes in the structural chemical units:
SbI3 + [GeS4] → [SbS3−xIx] + [GeS4−xIx]
This change in structure reduces the number of structural elements of SbI3, which is a terminator of the antimony containing chains and also increases the average chain length, which provides greater viscosity and, as a consequence, greater glass-forming ability due to the greater number of bonds per structural unit.
Analyzing these data and comparing them with the literature on similar systems, we can conclude that the introduction of germanium sulfide increases glass stability not only due to cross-linking of [SbS3−xIx] chains, as described in literature [8], but also due to the reduction of the negative impact of iodine ions on the length of these chains and, as a consequence, the glass-forming ability and stability of the resulting glasses. There is a competition for iodine between the structural units [SbS3−xIx] and [GeSxI4−x]. Germanium chemical units attract part of the iodine, which reduces the average x in [SbS3−xIx] structural units; thus, these chains lengthen, further stabilizing the glass-forming framework.
In addition to Raman spectroscopy, we carried out differential thermal analysis of the samples under study.

3.2. Differential Thermal Analysis

The results of differential thermal analysis are shown in Figure 7. Thermograms have different scales since the 12.5Ge and 17.5Ge samples have weak thermal effects, so the thermograms of the 12.5Ge–17.5Ge samples were greatly enlarged, and to improve the signal quality, a Lowess smoothing filter and peak analyzer built into Origin Pro were applied.
An exothermic peak with a maximum of 166–182 °C can be identified in the thermogram, which practically does not change its position depending on the composition; it corresponds to the transition of β-AgI to α-AgI. This transition in crystalline AgI occurs at 147 °C, but according to the change in conductivity in [26], it is shown that in the Agl-Sb2S3 system, upon heating it occurs at around 180 °C, and upon cooling at 147 °C. Before the crystallization peak, there is an area of the glass transition. The temperature of this phase transition increases linearly with increasing germanium sulfide content, which may indicate a strengthening of the structure, which confirms the literature data on the cross-linking of structural chemical units of the [GeSxI4−x] type with chains of structural chemical units of the [SbS3−xIx] type.
With a germanium sulfide content increase from 2.5Ge to 17.5Ge, the intensity of the crystallization peaks decreases greatly, and in the 17.5Ge thermogram, the crystallization temperature and melting temperature of the resulting crystal are poorly distinguishable. To carry out the analysis, equal amounts of glass by mass were loaded into the ampoule, which may indirectly be evidence of the greater resistance of glasses to crystallization. For a more accurate assessment of the glass-forming ability, we calculated the Hruby’s parameter. The calculation results and phase transition temperatures are presented in Table 2.
As can be seen from Table 2, the Hruby’s and the Lu–Liu parameters increase with increasing germanium sulfide content, while the Weinberg parameter for the 17.5Ge sample decreases. However, even the Weinberg parameter shows a tendency toward increasing glass stability. Using 3 coefficients is more objective, since different parameters are more applicable to different glassy systems [11].

3.3. Ionic Transport Properties

An example of frequency dependencies of complex resistance is shown in Figure 8.
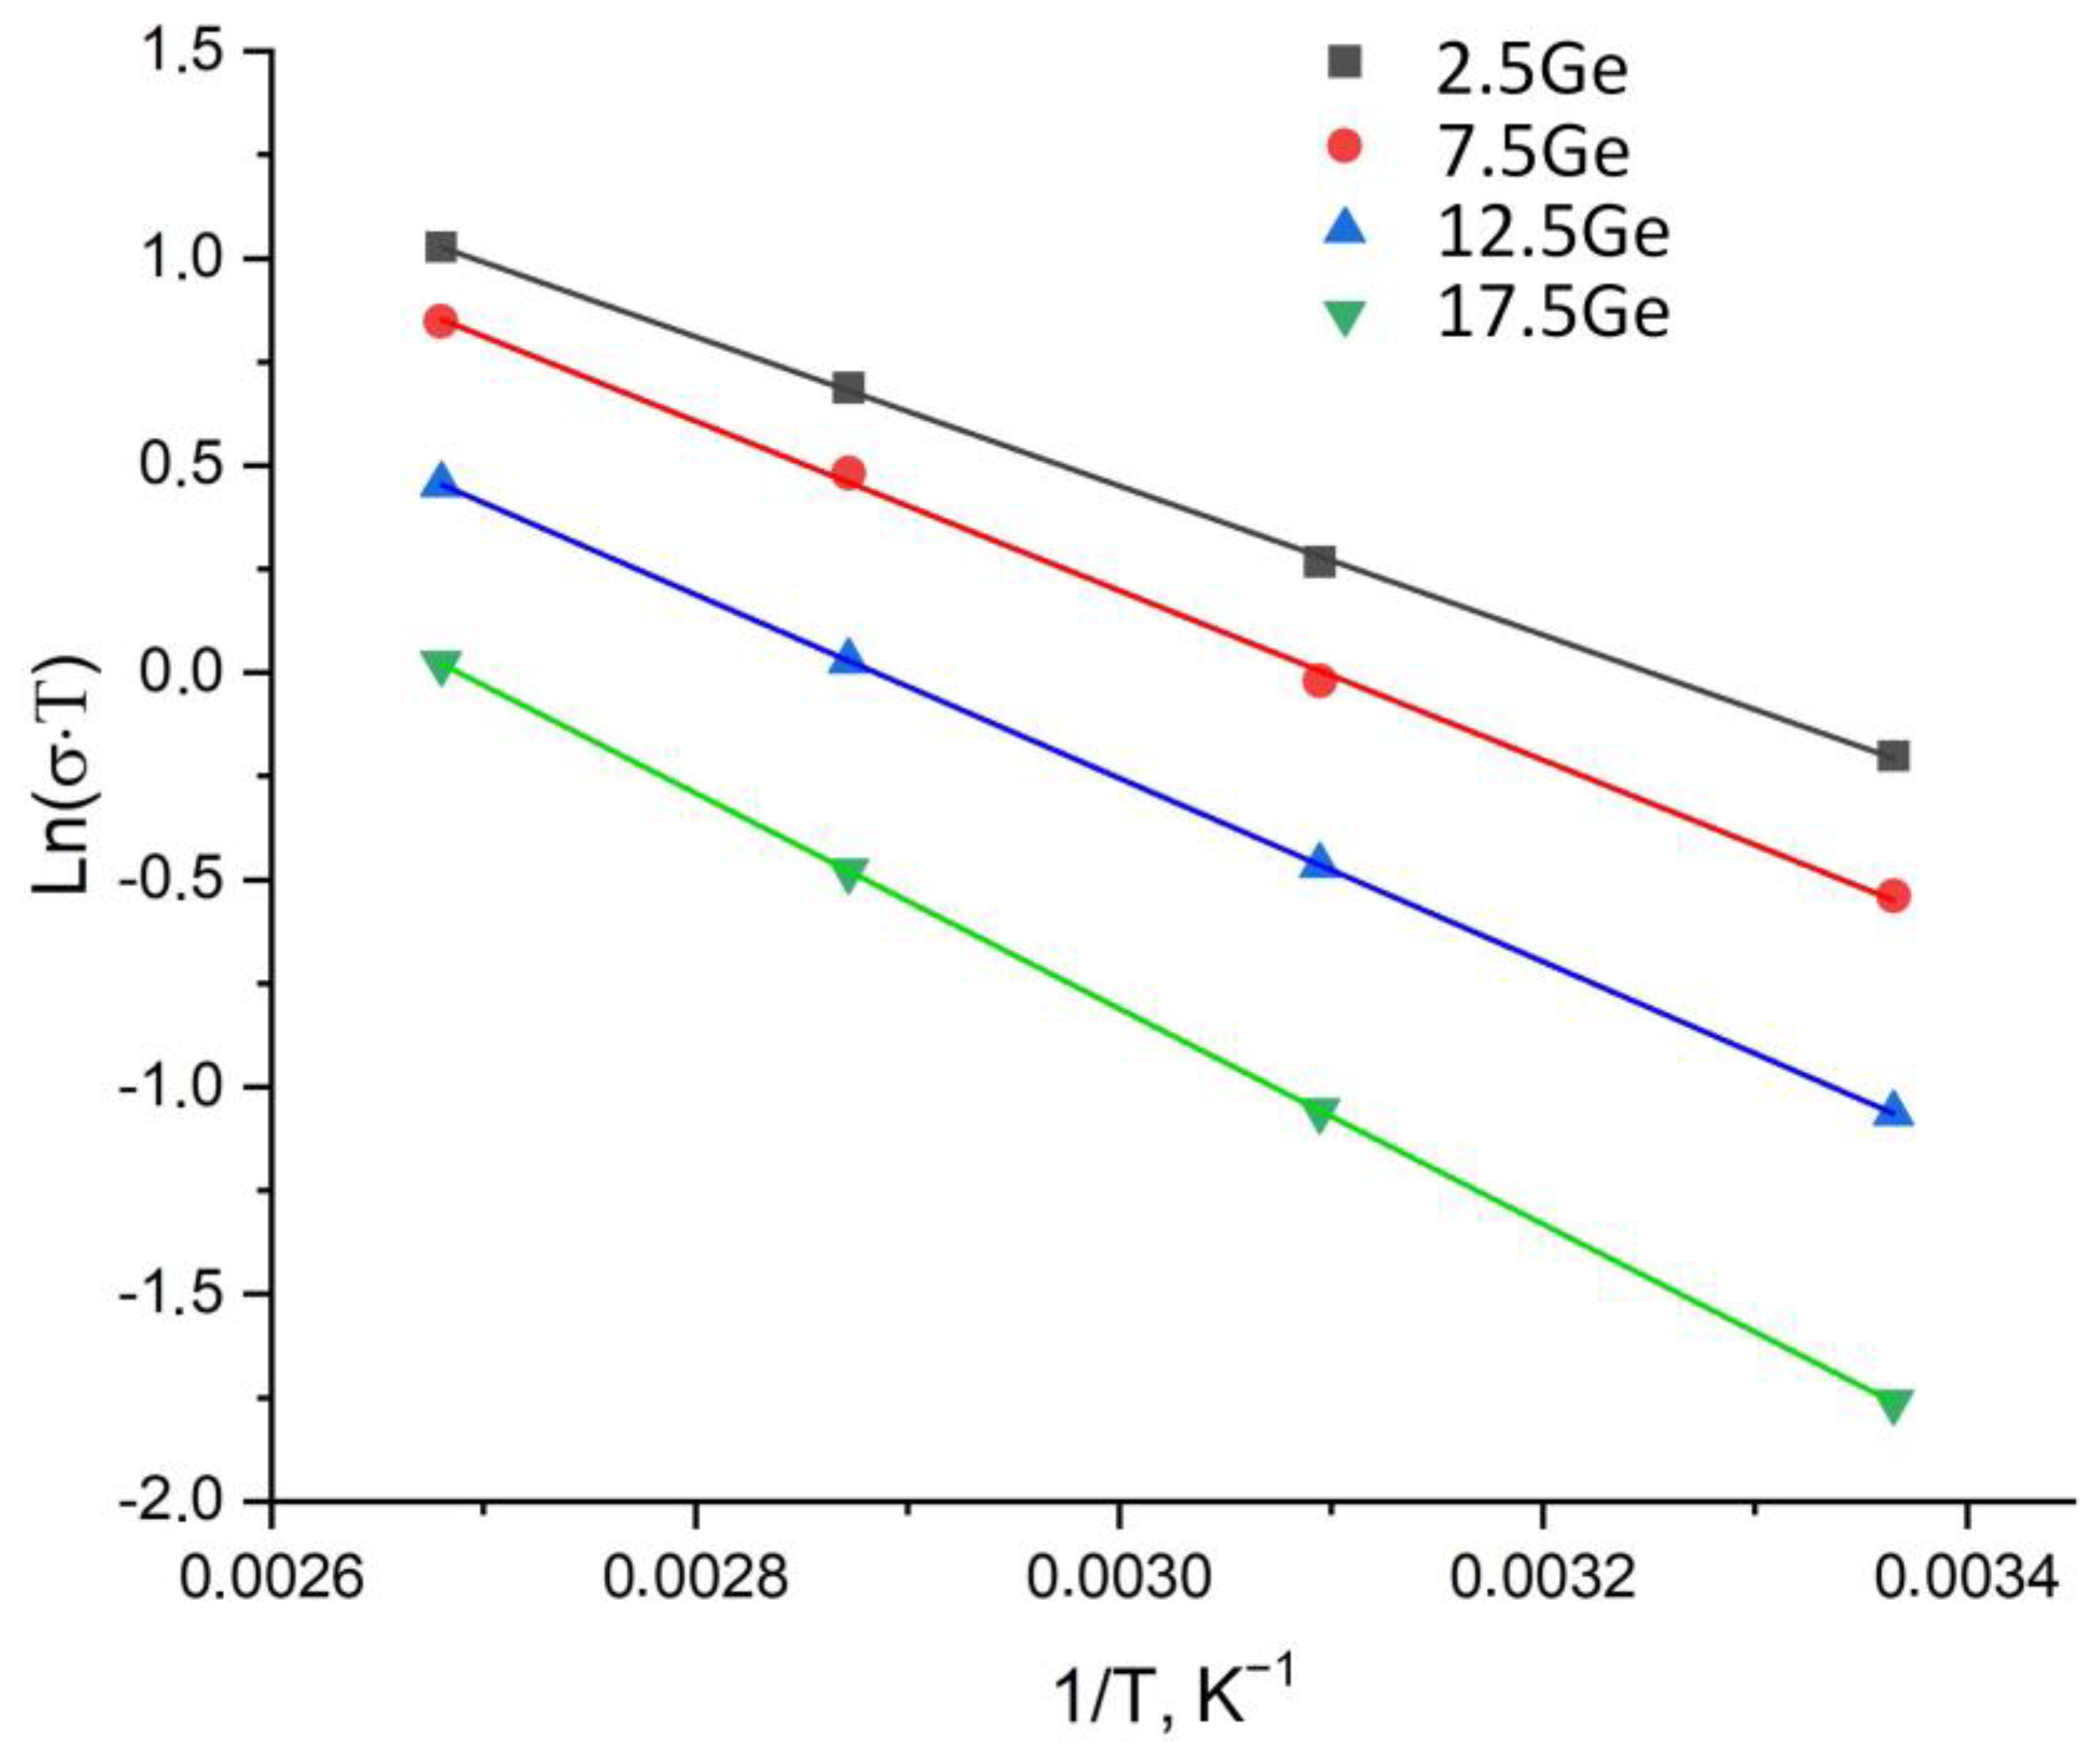
As can be seen from Figure 8, the dependencies represent a semicircle and a polarization branch typical for cells with blocking electrodes. The temperature dependence of conductivity is presented in Figure 9; data on conductivity at a room temperature and activation energies are given in Table 3.
It can be seen from Figure 9 and Table 3 that with an increase in germanium sulfide content from 2.5 to 17.5 mol.%, there is a smooth decrease in ionic conductivity. However, this decrease in conductivity from 2.5Ge to 17.5Ge for compositions with minimum and maximum germanium sulfide content is less than order, while the number of charge carriers and silver ions, according to the composition, decreased by 34%, from 25 to 18 at.%. Also, with an increase in germanium sulfide content, the activation energy for the diffusion of silver ions monotonically increases.
Ionic conductivity is an activation process, and it is described by the Arrhenius equation
σ A g + T = σ 0 exp E a R T ,
where σ A g + is the Ag+-ionic conductivity, T is the absolute temperature, σ 0 is the pre-exponential factor, E a is activation energy of ion migration, and R is the universal gas constant.
It is worth noting that various authors use both σ A g + T and σ A g + variations of the Arrhenius equation [27], which may create inconsistencies in the results. The activation energy is determined from the slope of the temperature dependence of ionic conductivity in Arrhenius coordinates. It is also worth noting here that a large number of authors use the decimal logarithm instead of the natural logarithm, which creates an error in determining the activation energy since the Arrhenius equation contains an exponent. However, there are quite a lot of works using the decimal logarithm, and this should be taken into account when considering issues of determining the activation energy. Considering the above, Table 3 shows three activation energy estimates. The estimate of σ 0 is given for Arrhenius coordinates L n ( σ A g + T ) − 1/T.
The activation energy values for the 2.5Ge sample in our work, 0.066 eV (Table 3), coincided within error with those published in the literature of 0.07 eV [8]. However, the conductivity is significantly different: 9.18·10−3 S/cm in [8] and 2.75·10−3 S/cm in the present study, which is probably due to our use of graphite electrodes, while the authors of [8] used gold ones.

3.4. Microscopic Model

To clarify the effect of germanium sulfide on conductivity, we used a microscopic model.
To understand ion transport at the microscopic level in glassy systems, it is possible to use the point defect model originally developed for ionic crystals but successfully applied to glassy materials [28], according to this model:
σ A g + = F 2 C A g + l 2 ν 0 6 R T exp Δ G R T ,
where F is the Faraday constant; C A g + is the volume concentration of Ag ions; l is the jump distance between two stable states; ν0 is the fundamental vibrational frequency; ∆G is the free energy change required for a diffusion jump, including both charge carrier formation and migration and expressed by the following equation:
Δ G = Δ H T Δ S ,
where ∆H and ∆S are the activation enthalpy and entropy of the ion migration. Combining equations, we obtain the following expression [29]:
σ A g + = F 2 C A g + l 2 ν 0 6 R T exp Δ S R exp Δ H R T ,
Comparing (6) and (7), we obtain the expression for the theoretical estimate of the pre-exponential factor in the Arrhenius equation:
σ 0 = F 2 C A g + l 2 ν 0 6 R exp Δ S R ,
Substitute expression (8) into expression (4):
σ T = v 0 L 2 F 2 C A g + 6 R e x p Δ S R e x p E a R T ,
where v 0 —the attempt frequency of silver ions [Hz], could be estimated according to [25] as 1013 Hz, F —the constant of Faraday [C/mol], C A g + —the volume concentration of silver ions [cm−3], l —the jump distance [cm], T —the absolute temperature [K], E a —the activation energy [J/mol], R —the gas constant [J·(K·mol)−1], and Δ S —the migration entropy change of silver ions [J·(K·mol)−1]. From Equation (10), we calculated the change in migration entropy by taking the logarithm from Equation (8) and by using the values of the pre-exponential factor from Table 3. σ 0 was defined as a constant in the equation of a straight line in Arrhenius coordinates L n ( σ A g + T ) − 1/T.
The results of the calculation are shown in Table 4, which indicated the migration entropy change of silver cations was increased with increasing GeS2 content.
Δ S = R · ( ln ( σ 0 ) l n A )
  A = v 0 L 2 F 2 C A g + 6 R
The volume concentration of charge carriers was calculated as follows:
C A g + = ρ · N A M ,
where ρ is the density of a sample; NA is the Avogadro’s number; and M is the molar mass of a sample.
The distance between stable states is given by
l = 1 C A g + 3 ,
As can be seen from Table 4, with equimolar replacement of AgI with GeS2, the number of charge carriers and the average hop length remain virtually unchanged. Comparing the experimentally determined value of the pre-exponential factor in the Arrhenius equation with that calculated using the microscopic model, it is evident that the role of the entropy factor increases with increasing germanium sulfide content. Despite the decrease in conductivity with the introduction of GeS2 over 2.5 mol.%, the conductivity of such glasses is higher than in similar systems not doped with GeS2. This can be traced by comparing the conductivity of the 17.5Ge sample (17.5GeS2-27.5Sb2S3-55AgI) σRT = 6.7 × 10⁻⁴ S/cm with the conductivity of the most similar glassy electrolyte not containing germanium 50Sb2S3-50AgI σRT = 5.0 × 10⁻⁵ S/cm [16], which indicates the positive effect of the entropy factor increases with increasing germanium sulfide on conductivity.

4. Conclusions

More stable compositions of (2.5 + x)GeS2-Sb2S3-(70 − x)AgI glass system were obtained with an increased glass-forming ability, described with the Hruby’s coefficient that was more than 0.7 (KW = 0.17, KLL = 0.48), the ionic conductivity in the order of 10−3 S/cm for 2.5 ≤ x ≤ 12.5 samples, and activation energy not exceeding 0.1 eV.
The role of GeS2 in enhancing the resistance of glasses to crystallization was clarified; GeS2 promotes an increase of glass-forming stability due to both cross-linking of layers formed by [SbS3−xIx] structural units and to the competition for iodine between [SbS3−xIx] and [GeSxI4−x]. Based on Raman spectra and thermodynamic data, the formation of a bond between iodine and germanium is more preferable than with antimony. Germanium structural chemical units are able to include more iodine, up to x = 2, which does not make them a terminator of glass-forming chains. Although increasing the GeS2 content above 2.5 mol.% negatively affects to the ionic conductivity and raises activation energy, it enhances the system’s suitability for conductivity by increasing the entropy and pre-exponential factors in the Arrhenius equation. Moreover, compared to similar glass systems without GeS2 doping, the presence of GeS2 has a positive effect on the ionic transport properties.

Author Contributions

V.M.: Writing—review and editing, Conceptualization, Investigation, Data curation, Methodology, Formal analysis, Supervision. T.F.: Writing—original draft, Conceptualization, Validation, Writing—review and editing, Methodology, Investigation, Formal analysis, Data curation. N.D.: Data curation, Investigation, Methodology, Formal analysis, Visualization. All authors have read and agreed to the published version of the manuscript.

Funding

This research was conducted under the financial support of the Russian Science Foundation (grant No 23-79-01323).

Data Availability Statement

The raw data supporting the conclusions of this article will be made available by the authors on request.

Acknowledgments

The authors thank Daria Volova for help with proofreading.

Conflicts of Interest

The authors declare no conflicts of interest.

References

  1. Escher, C.; Thomann, S.; Andreoli, C.; Fink, H.-W.; Toquant, J.; Pohl, D.W. Vacuum ion emission from solid electrolytes: An alternative source for focused ion beams. Appl. Phys. Lett. 2006, 89, 053513. [Google Scholar] [CrossRef]
  2. Tolstoguzov, A.B.; Belykh, S.F.; Gololobov, G.P.; Gurov, V.S.; Gusev, S.I.; Suvorov, D.V.; Taganov, A.I.; Fud, D.J.; Ai, Z.; Liu, C.S. Ion-Beam Sources Based on Solid Electrolytes for Aerospace Applications and Ion-Beam Technologies (Review). Instrum. Exp. Tech. 2018, 61, 159–172. [Google Scholar] [CrossRef]
  3. Daiko, Y.; Segawa, K.; Honda, S.; Iwamoto, Y. Ag+ ion emission from a sharp Ag2O-Al2O3-P2O5-SiO2 glass-fiber emitter. Solid State Ion. 2018, 322, 5–10. [Google Scholar] [CrossRef]
  4. Tolstogouzov, A.; Aguas, H.; Ayouchi, R.; Belykh, S.F.; Fernandes, F.; Gololobov, G.P.; Moutinho, A.M.C.; Schwarz, R.; Suvorov, D.V.; Teodoro, O.M.N.D. Vacuum solid-state ion-conducting silver source for application in field emission electric propulsion systems. Vacuum 2016, 131, 252–258. [Google Scholar] [CrossRef]
  5. Scrosati, B.; Ricci, A.; Lazzari, M. Electrochemical properties of a new solid electrolyte in the system silver iodide? silver dichromate. J. Appl. Electrochem. 1976, 6, 237–242. [Google Scholar] [CrossRef]
  6. Chiodelli, G.; Magistris, A.; Schiraldi, A. Some solid electrolyte cells. Electrochim. Acta 1974, 19, 655–656. [Google Scholar] [CrossRef]
  7. Li, Z.; Lin, C.; Qu, G.; Calvez, L.; Dai, S.; Zhang, X.; Xu, T.; Nie, Q. Formation and properties of chalcogenide glasses based on GeS2–Sb2S3–AgI system. Mater. Lett. 2014, 132, 203–205. [Google Scholar] [CrossRef]
  8. Lin, C.; Zhu, E.; Wang, J.; Zhao, X.; Chen, F.; Dai, S. Fast Ag-Ion-Conducting GeS2–Sb2S3–AgI Glassy Electrolytes with Exceptionally Low Activation Energy. J. Phys. Chem. C 2018, 122, 1486–1491. [Google Scholar] [CrossRef]
  9. Ma, B.; Jiao, Q.; Zhang, Y.; Lin, C.; Zhang, X.; Ma, H.; Dai, S.; Jia, G. Conductivity and structural properties of fast Ag-ion-conducting GaGeSbS–AgI glassy electrolytes. Ceram. Int. 2020, 46, 24882–24886. [Google Scholar] [CrossRef]
  10. Samoilenko, G.V.; Arif, M.; Blinov, L.N. Phase Diagram and Glass Formation in the Sb2S3-AgI System. Glas. Phys. Chem. 2005, 31, 656–660. [Google Scholar] [CrossRef]
  11. Kozmidis-Petrović, A.F. Theoretical analysis of relative changes of the Hruby, Weinberg, and Lu–Liu glass stability parameters with application on some oxide and chalcogenide glasses. Thermochim. Acta 2009, 499, 54–60. [Google Scholar] [CrossRef]
  12. Ren, J.; Yan, Q.; Wagner, T.; Zima, V.; Frumar, M.; Frumarova, B.; Chen, G. Conductivity study on GeS2-Ga2S3-AgI-Ag chalcohalide glasses. J. Appl. Phys. 2013, 114, 023701. [Google Scholar] [CrossRef]
  13. Hsueh, H.C.; Chen, R.K.; Vass, H.; Clark, S.J.; Ackland, G.J.; Poon, W.C.-K.; Crain, J. Compression mechanisms in quasimolecular. Phys. Rev. B 1998, 58, 14812–14822. [Google Scholar] [CrossRef]
  14. Sanghera, J.S.; Heo, J.; Mackenzie, J.D. Chalcohalide glasses. J. Non-Cryst. Solids 1988, 103, 155–178. [Google Scholar] [CrossRef]
  15. Zhao, X.; Long, N.; Sun, X.; Yin, G.; Jiao, Q.; Liu, X.; Dai, S.; Lin, C. Relationship between composition, crystallization, and phase separation behavior of GeS2–Sb2S3–CsCl chalcogenide glasses. Infrared Phys. Technol. 2019, 102, 102978. [Google Scholar] [CrossRef]
  16. Sun, H.W.; Tanguy, B.; Reau, J.-M.; Videau, J.J.; Portiek, J. Investigations on glasses in the Sb2S3 Agl system. J. Non-Cryst. Solids 1988, 99, 222–232. [Google Scholar] [CrossRef]
  17. Yu, S.; Siegel, D.J. Grain Boundary Contributions to Li-Ion Transport in the Solid Electrolyte Li7La3Zr2O12 (LLZO). Chem. Mater. 2017, 29, 9639–9647. [Google Scholar] [CrossRef]
  18. Ying, L.; Lin, C.; Xu, Y.; Nie, Q.; Chen, F.; Dai, S. Glass formation and properties of novel GeS2–Sb2S3–In2S3 chalcogenide glasses. Opt. Mater. 2011, 33, 1775–1780. [Google Scholar] [CrossRef]
  19. Zhang, M.; Yang, Z.; Li, L.; Wang, Y.; Qiu, J.; Yang, A.; Tao, H.; Tang, D. The effects of germanium addition on properties of Ga-Sb-S chalcogenide glasses. J. Non-Cryst. Solids 2016, 452, 114–118. [Google Scholar] [CrossRef]
  20. Sakaguchi, Y.; Hanashima, T.; Ohara, K.; Simon, A.-A.A.; Mitkova, M. Structural transformation in. Phys. Rev. Mater. 2019, 3, 035601. [Google Scholar] [CrossRef]
  21. Koudelka, L.; Frumar, M.; Pisárčik, M. Raman spectra of Ge-Sb-S system glasses in the S-rich region. J. Non-Cryst. Solids 1980, 41, 171–178. [Google Scholar] [CrossRef]
  22. Heo, J.; Yoon, J.M.; Ryou, S.-Y. Raman spectroscopic analysis on the solubility mechanism of La3+ in GeS2–Ga2S3 glasses. J. Non-Cryst. Solids 1998, 238, 115–123. [Google Scholar] [CrossRef]
  23. Kassem, M.; Benmore, C.J.; Tverjanovich, A.; Usuki, T.; Khomenko, M.; Fontanari, D.; Sokolov, A.; Ohara, K.; Bokova, M.; Kohara, S.; et al. Glassy and liquid Sb2S3: Insight into the structure and dynamics of a promising functional material. J. Mater. Chem. C 2023, 11, 4654–4673. [Google Scholar] [CrossRef]
  24. Lin, C.; Li, Z.; Ying, L.; Xu, Y.; Zhang, P.; Dai, S.; Xu, T.; Nie, Q. Network Structure in GeS2–Sb2S3 Chalcogenide Glasses: Raman Spectroscopy and Phase Transformation Study. J. Phys. Chem. C 2012, 116, 5862–5867. [Google Scholar] [CrossRef]
  25. Lide, D.R. (Ed.) CRC Handbook of Chemistry and Physics, 90th ed.; CRC Press: Boca Raton, FL, USA, 2010. [Google Scholar]
  26. Mentus, S.V.; Šušić, M.V.; Gajinov, S.P. Electrical conductivity of the solid system AgI-Sb2S3. Solid State Ion. 1983, 11, 143–149. [Google Scholar] [CrossRef]
  27. Tiliakos, A.; Iordache, M.; Răceanu, M.; Marinoiu, A. Remediation of activation energy anomalies, scaling distortions, and bandwidth limitations in superionic conductivity modeling of NZSP NaSICON synthesized by an augmented SSR method. Ceram. Int. 2023, 49, 10588–10607. [Google Scholar] [CrossRef]
  28. Souquet, J.L. Ionic transport in glassy electrolytes. In Solid State Electrochem; Cambridge University Press: Cambridge, UK, 1994; pp. 74–94. [Google Scholar] [CrossRef]
  29. Leo, C.; Chowdari, B.V.; Rao, G.V.S.; Souquet, J. Lithium conducting glass ceramic with Nasicon structure. Mater. Res. Bull. 2002, 37, 1419–1430. [Google Scholar] [CrossRef]
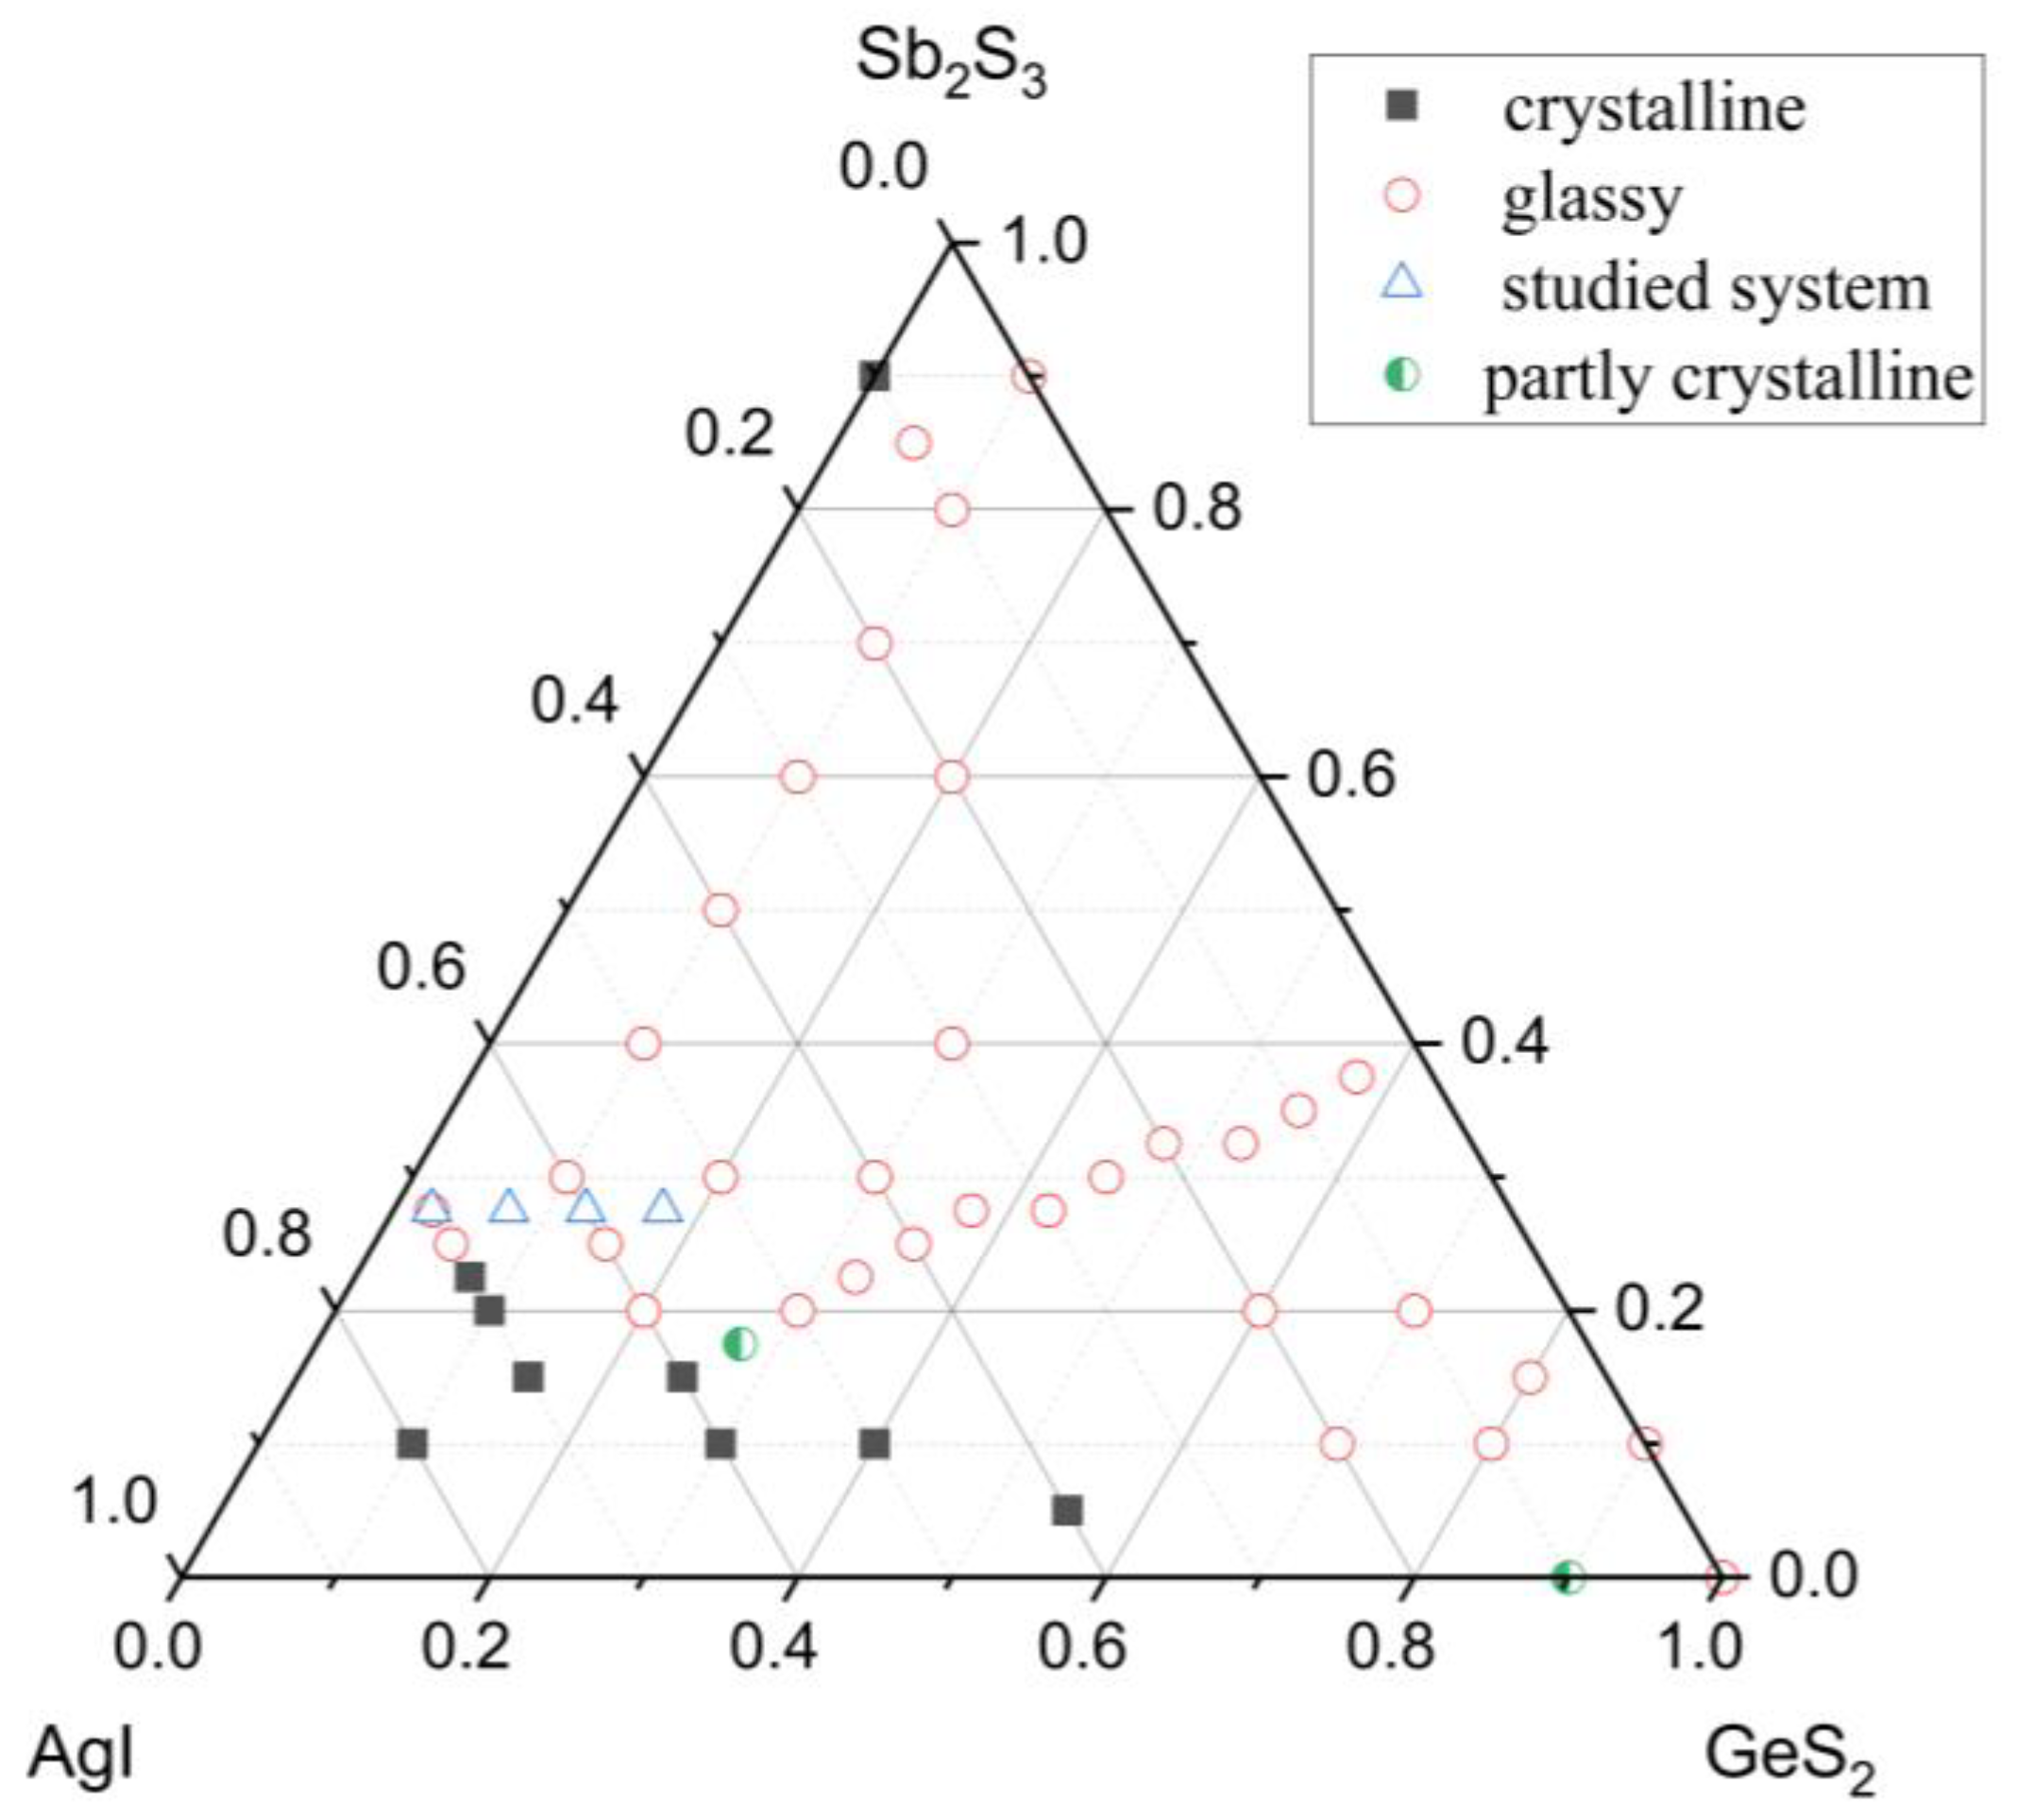
Figure 1. Ternary diagram for the GeS2-Sb2S3-AgI system; points except those defined in this paper are taken from [7,8].
Solids 06 00022 g001
Figure 2. XRD patterns for glasses of the following compositions: (2.5 + x)GeS2-27.5Sb2S3-(70 − x)AgI, x = 0, 5, 10, 15.
Solids 06 00022 g002
Figure 3. Raman spectra for glasses of the following compositions: (2.5 + x)GeS2-27.5Sb2S3-(70 − x)AgI, x = 0, 5, 10, 15.
Solids 06 00022 g003
Figure 4. Deconvoluted peaks in the range of 50–200 cm−1 for 2.5Ge (a), 17.5Ge (c); deconvoluted peaks in the range of 200–360 cm−1 for 2.5Ge (b), 17.5Ge (d).
Solids 06 00022 g004
Figure 5. Proposed scheme for the insertion of a germanium structural chemical unit between the chains of [SbS2I] units.
Solids 06 00022 g005
Figure 6. Proposed scheme for inserting a germanium structural chemical unit between (a) [SbSI2] units, (b) [SbS2I] and [SbSI2] units.
Solids 06 00022 g006
Figure 7. Thermograms of the samples 2.5Ge–17.5Ge.
Solids 06 00022 g007
Figure 8. Dependence of the complex resistance on the Nyquist diagram for a 17.5Ge sample at 24 °C.
Solids 06 00022 g008
Figure 9. Temperature dependencies of ionic conductivity for samples 2.5Ge–17.5Ge.
Solids 06 00022 g009
Table 1. Bands’ centers and their correspondence to structural elements.
Structural ElementRaman Shift, cm−1Ref.
SbI338, 57, 70, 80,138, 165[13]
SbSI108, 115, 138, 139, 165, 290, 315[16]
Sb2S3107, 138, 155, 162,280, 290, 300, 308, 310, 315, 319[15,17,18]
GeS2, S3Ge-GeS3, GeS4101, 200, 255, 330, 340, 343, 365, 373[15,16,18,19,20,21,22]
Table 2. Phase transition temperatures and the Hruby’s, Weinberg, and Lu–Liu parameters.
SampleTg, °CTx, °CTc, °CTm, °CKHKWKLL
2.5Ge1992192323290.180.100.41
7.5Ge2252652833380.550.170.47
12.5Ge2352802943430.710.170.48
17.5Ge2592993143440.890.160.50
Table 3. RT conductivity, activation energy and pre-exponent of samples under study.
SampleσRT·10−3, S/cm L n ( σ A g + ) L n ( σ A g + T ) L g ( σ A g + ) L n ( σ 0 )
Ea, eV
2.5Ge2.750.1270.180.0665.85
7.5Ge1.960.150.180.0646.33
12.5Ge1.330.160.190.0706.39
17.5Ge0.670.200.220.0856.99
Table 4. Values of parameters of the pre-exponential factor calculated using the microscopic model in comparison with the experimentally determined ones.
Sampleρ, g/cm3Vm, cm3/molNAg+·10−22, cm−3l, Å Lnσ0expLnσ0calcΔS, J·(K·mol)−1
2.5Ge5.2050.261.204.375.854.30417.4
7.5Ge5.1050.291.204.376.334.29721.4
12.5Ge5.0449.871.214.366.394.29621.9
17.5Ge4.8750.601.194.386.994.28026.9
Disclaimer/Publisher’s Note: The statements, opinions and data contained in all publications are solely those of the individual author(s) and contributor(s) and not of MDPI and/or the editor(s). MDPI and/or the editor(s) disclaim responsibility for any injury to people or property resulting from any ideas, methods, instructions or products referred to in the content.