1. Introduction
Due to their unique electronic, optical, and catalytic properties and relatively easy production [
1,
2,
3], metallic nanoparticles have been at the forefront of nanotechnological advances [
4,
5,
6]. In terms of application, the interactions between nanoparticles and their surrounding objects, such as solvents, substrates, ion/electron beams, as well as other nanoparticles, are of fundamental importance for optimizing their storage and performance [
7,
8,
9,
10]. The strong attraction among nanoparticles often results in their agglomeration, changing their desired functional properties. For instance, metallic/superconductor conjunctions [
11], light scattering and absorption [
12], and sorting [
13] of nanoparticles are examples dealing with this challenge. Hence, studying nanoparticles’ interactions is crucial to control and improve their synthesis, assembly, and application.
The surface energy of a nanoparticle can be a significant portion of its total energy, inversely increasing with its size. As a result, the surface has dramatic effects on the thermal stability of nanoparticles. It is well-known that the melting temperature of nanoparticles is also size-dependent, significantly lower than that of the bulk [
14]. These make the interaction process strongly size-dependent, driven by a reduction in the total energy, mainly the surface energy, while having temperature-dependent kinetics. The interaction can involve either preserving the shape of the nanoparticles at low enough temperatures or changing their ultimate shape and size via a coalescence at higher temperatures. The latter can result in permanent agglomeration of the nanoparticles, with critical implications for their properties and performance. In this study, we explore the role of the surface reduction and its size dependence during the coalescence of gold (Au) nanoparticles and using the molecular dynamics (MD) simulation method.
Au nanoparticles are among the most interesting metallic nanoparticles that have found important applications in various contexts [
15], e.g., as a remarkable catalyst [
16,
17,
18], in printed electronics [
19], or in biotechnology [
20]. The notable development of the Au nanoparticle is indebted to the noble nature of the element, remaining free of environmental contamination. In the shadow of its nobility, the interesting electronic properties and morphological diversity of Au nanoparticles were explored [
21,
22,
23]. For high-temperature applications, both the phase and geometrical stability of Au nanoparticles become extremely important, often limiting their applications [
24], but on certain occasions enabling their processing [
25]. In either case, the temperature effects on nanoparticles need to be understood and controlled. The thermal sensitivity of Au nanoparticles is primarily dependent on their size but is also influenced by the shape of nanoparticles [
26]. In a process of coalescence, both the size and shape of the nanoparticles vary, dynamically changing the thermal response of the nanoparticles. Such temperature-dependent features are most extreme in the coalescence of ultrafine particles.
In this work, we study the temperature and size dependence of the Au nanoparticles’ coalescence. First, we consider the equilibrium melting behavior of single Au nanoparticles, to reveal their size-dependent thermal stability. We then study the coalescence of free nanoparticles. Detailed analyses of Lindemann index and potential energy distribution across the nanoparticles were performed to understand the mechanisms of nanoparticles’ melting and coalescence. We reveal that the size-dependent surface effects can expand deep inside the nanoparticles, assisting with the coalescence at temperatures much lower than their melting temperature. For certain conditions discussed below, the surface energy released upon the coalescence adds to this effect, leading to the melting of the nominally solid nanoparticles during the coalescence.
2. Materials and Methods
For the current MD simulations, the glue potential for Au, created by the force matching method, is used [
27]. The force matching method is an effective tool to obtain realistic interatomic potentials based on fitting the potential to ab-initio atomic forces of many atomic configurations [
28,
29]. The glue potential,
contains a standard pair potential term
and a so-called glue function
, which is an energy associated with the coordination number of the atoms,
, with
being a short-range monotonically decreasing density function and
representing the distance between
and
atoms. The glue potential has been successfully employed in several previous works for studying nanoparticles [
30,
31,
32] and has also been shown to give reliable information on the surface properties of nanoparticles [
33].
To perform the current simulations, modular software has been developed in MATLAB. We employed a listing algorithm for effectively updating the group of neighboring atoms. The Verlet velocity algorithm was used to solve the equations of motion. The desired temperature was obtained using the uniform kinetic energy scaling method, i.e., canonical sampling through velocity rescaling (CSVR). CSVR has been broadly used in MD simulations with applications to various problems [
34,
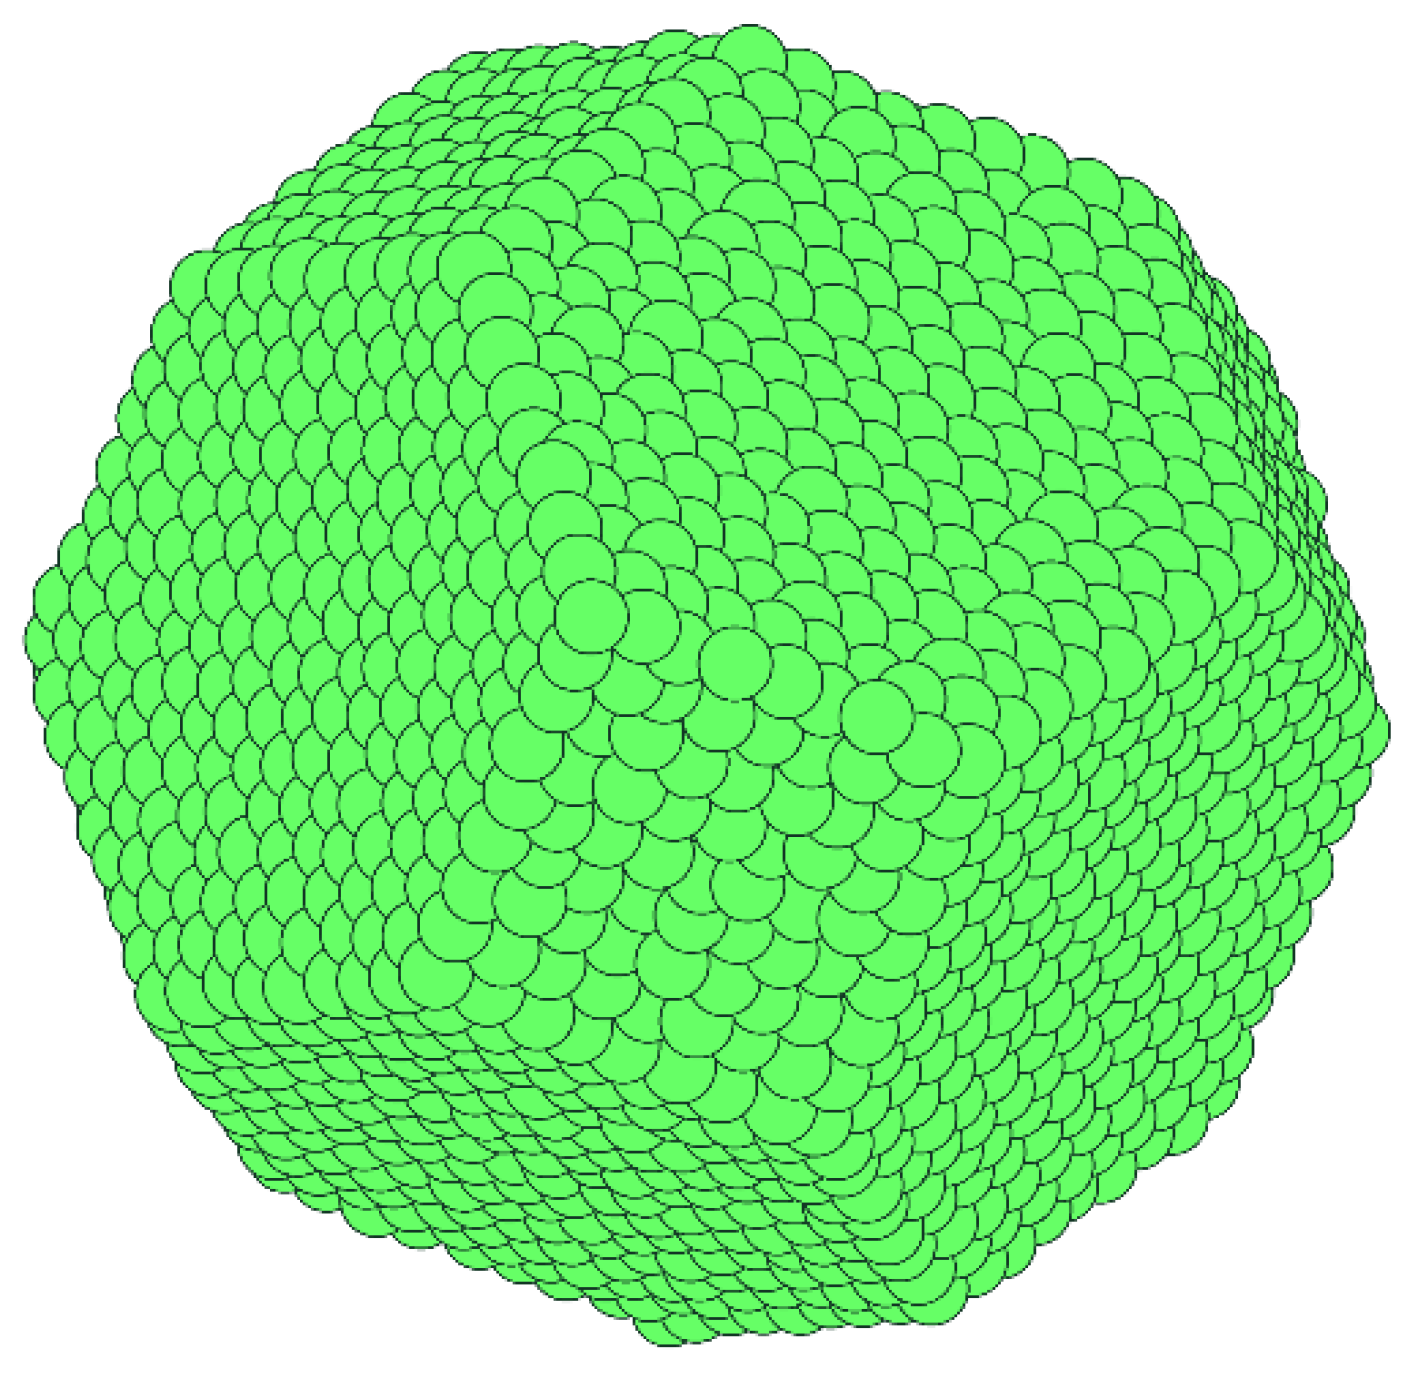
35]. This method best applies to studying heterogeneous melting phenomena and, particularly, for obtaining the equilibrium melting temperature and latent heat as we apply in the current study. The temporal constancy of temperature and energy with finite fluctuations has been carefully benchmarked. A small time-step of 1.7 fs guaranteed the convergence of the calculations. We considered fine Au nanoparticles with 586, 1289, and 2406 atoms. All nanoparticles were initially constructed to a prefect truncated polyhedral structure, as shown in
Figure 1, that is the equilibrium Wulff structure for the FCC Au [
36].
First, the melting points of the nanoparticles were approximated by studying the equilibrium potential energy as a function of temperature. A bulk system (NVT ensemble), i.e., a cubic simulation box of ten unit-cells per edge with a periodic boundary condition, has been simulated over a range of temperatures of interest for the purpose of (i) benchmarking our simulation tools, in particular the performance of the glue potential [
27], and (ii) comparing the results against the nanoparticle systems to reveal the size-effect on the equilibrium melting temperature and latent heat. We also monitored the Lindemann index (LI) as a function of temperature, which gives extended insights about the activity of atoms within the system. The nanoparticles were equilibrated during an initial (minimum) 250,000 time-steps for each temperature, followed by another (minimum) 150,000 time-steps, depending on the system size, to average the values of potential energy and LI. For larger systems the equilibration needed more than 1,000,000 time-steps. The LI of each atom,
, and of the entire nanoparticle,
, was calculated by [
37]
and
respectively, where
is the number of atoms and
is the time average value at temperature
. The LI has been widely used for analyzing solid-liquid transitions but also provides excellent spatial information about the mobility and order of individual atoms across a given system. As a function of temperature, a sharp increase in the LI over a small temperature change reveals the melting point of the system [
38,
39]. Within the nanoparticles, the LI of individual atoms reflects on the atomic neighborhood and, in this case, surface-induced radial heterogeneities across the nanoparticle. In particular, the relative energy and mobility of surface atoms are interesting, to understand the physics of coalescence.
For studying the coalescence of nanoparticles, identical equilibrated Au nanoparticles of different sizes were brought into contact (separated by 0.2 nm) at different temperatures below and above their corresponding melting temperature. Each simulation has been studied for a minimum 200,000 time-steps. No external forces were applied during the coalescence. We note that the melting and coalescence of nanoparticles are heterogeneous (rather than homogeneous), which is due to the natural and significant role of free surfaces and eges. During the coalescence of nanoparticles, no temperature scaling is performed. Upon the coalescence, the mean diameter of the nanoparticles pair decreases. For a diameter less than 10% of the minimum diameter, the coalescence is assumed to be completed [
40]. The temporal evolution of the size, shape, energy, and temperature of the nanoparticles sheds light on the possible phase transition (melting) upon coalescence, which is discussed in the following. For more details on the simulation methods, see [
41].
3. Results
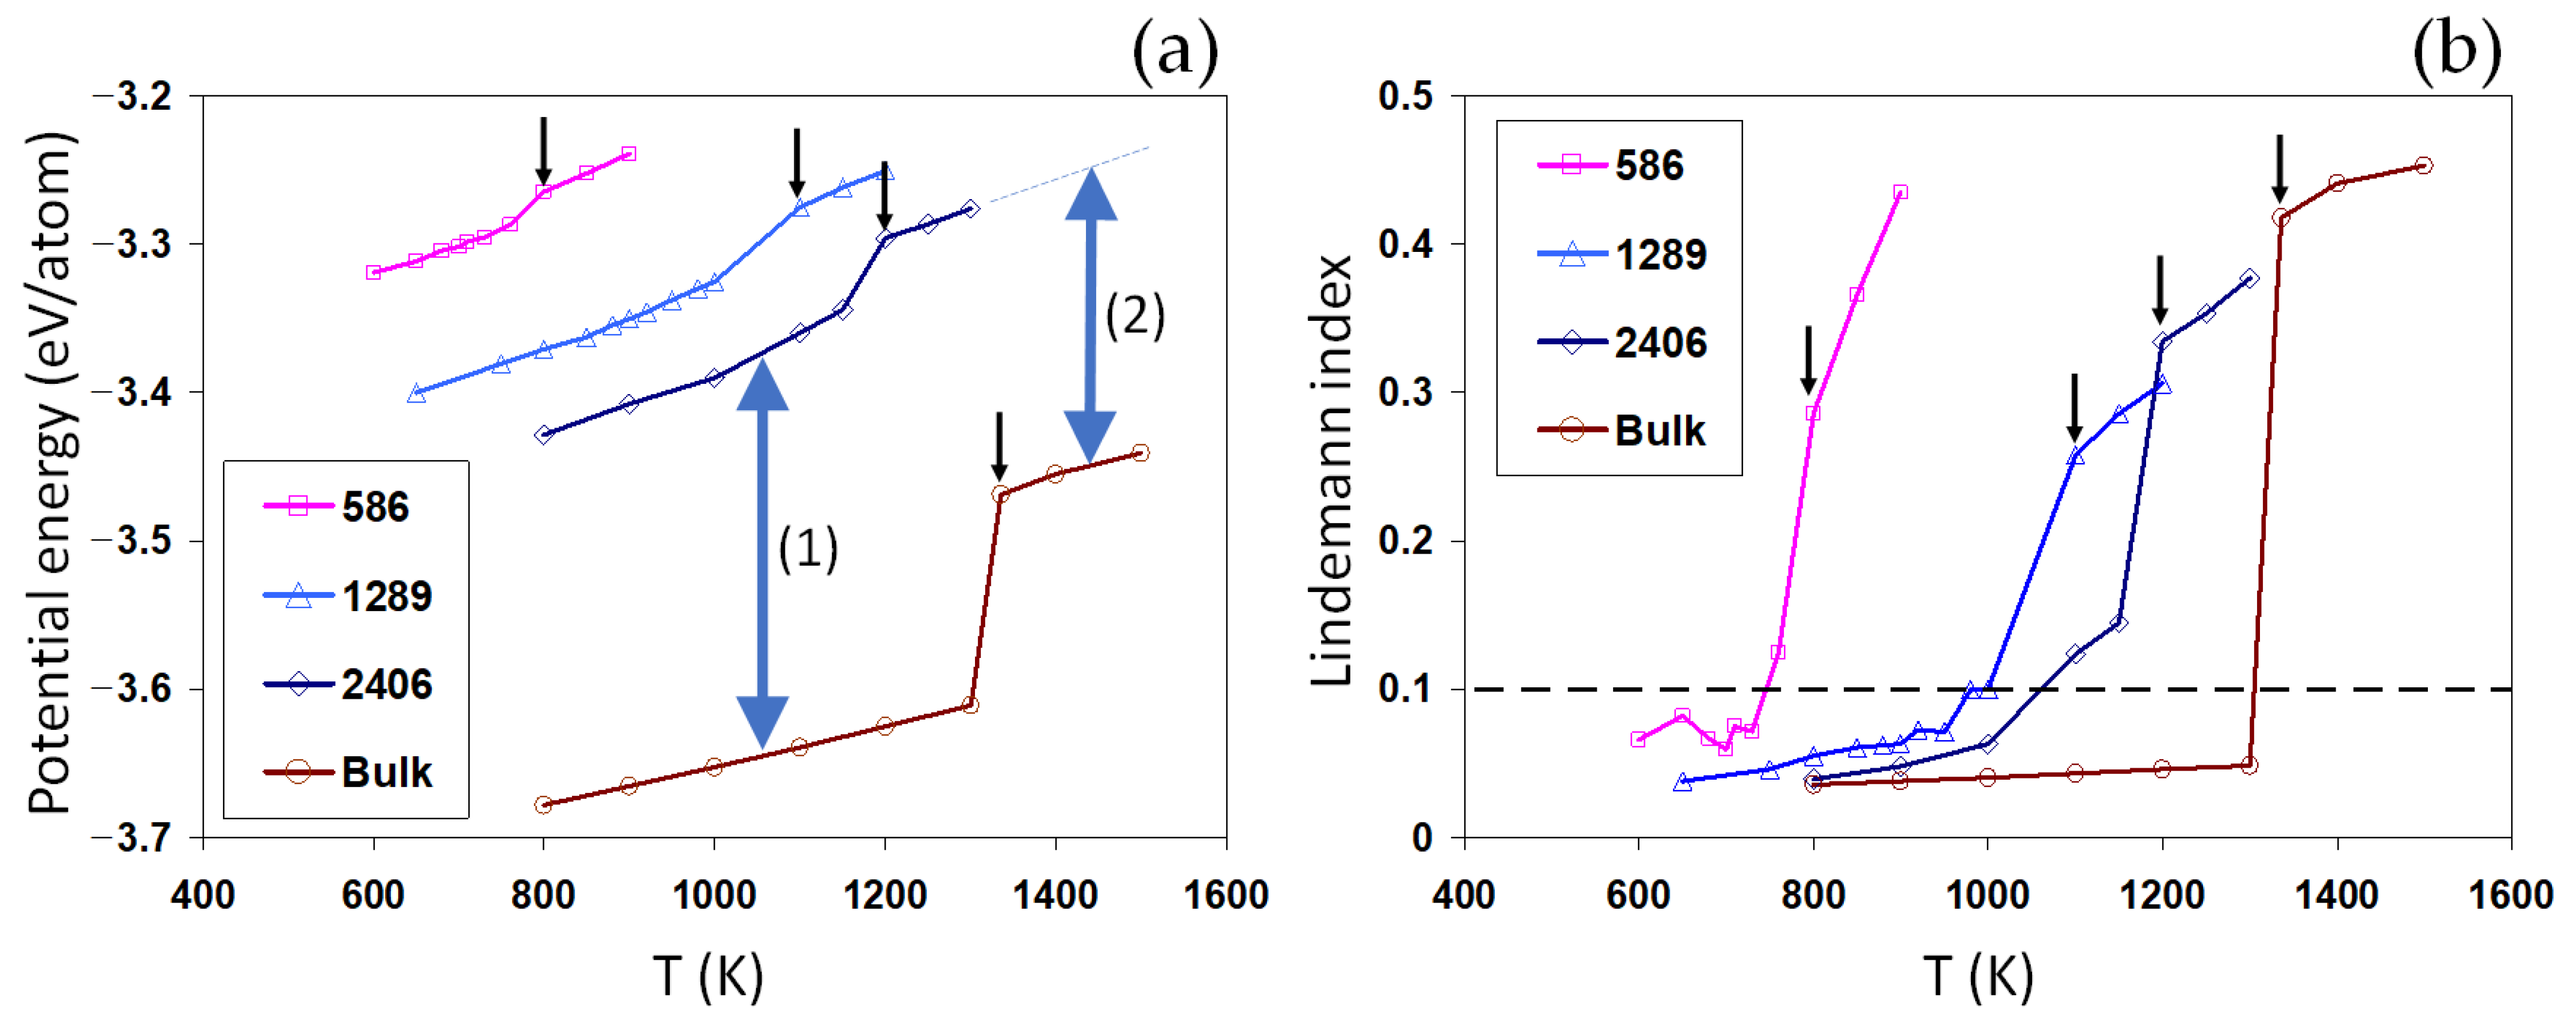
Melting is a first-order phase transition involving a latent heat, i.e., an abrupt increase in the energy of the system.
Figure 2a shows the potential energy for Au nanoparticles and the bulk system, computed as functions of temperature. Here, we study the equilibrium potential energy, as the temperature in all systems is kinetically scaled to the desired temperature [
34,
35], i.e., the nucleation of the liquid phase and its corresponding energy barrier do not appear as a part of the potential energy. In such a scaling process, superheating and associated metastable phenomena become irreverent [
42].
For each curve in
Figure 2a, the jump in the potential energy reveals the solid-liquid phase transition. The approximated melting temperatures are listed in
Table 1. A good agreement is obtained here between the current results and previous works [
43,
44]. We note that the well-reproduced bulk melting temperature not only indicates the correctness of the current implementation of the glue potential [
27], but also gives a reliable reference for comprehending the size-dependent melting properties of individual nanoparticles.
We found that the smaller the nanoparticle, the lower the melting point, which reflects the well-known Gibbs–Thompson size effect. Furthermore, the latent heat of melting is also found to be size-dependent, decreasing for smaller nanoparticles, as shown in
Table 1. This confirms the size-dependent latent heat observed in the previous works [
45,
46].
At a given temperature, the potential energy of nanoparticles is significantly higher than the bulk values, increasing for smaller nanoparticles, indicated by the two-sided arrow (1) in
Figure 2a. In the context of classical thermodynamics, this can be understood as the Laplace pressure induced by the surface energy (
), equal to
, for a spherical particle of radius
. For the liquid nanoparticle, we found that the increase in the potential energy is much lower than the solid nanoparticle (two-sided arrow (2) compared to arrow (1),
Figure 2a). This can be understood as the origin of the size-dependent latent heat for nanosystems. Interestingly, the size-dependent vertical shifts in the potential energy (indicated by the two-sided arrows) are found to be much larger than the melting latent heat of the nanoparticles and almost comparable to the latent heat for the melting in the bulk system. A small latent heat means a rather low energy barrier for melting. As the size of particles increases, the potential energy decreases and the latent heat increases, approaching the bulk values.
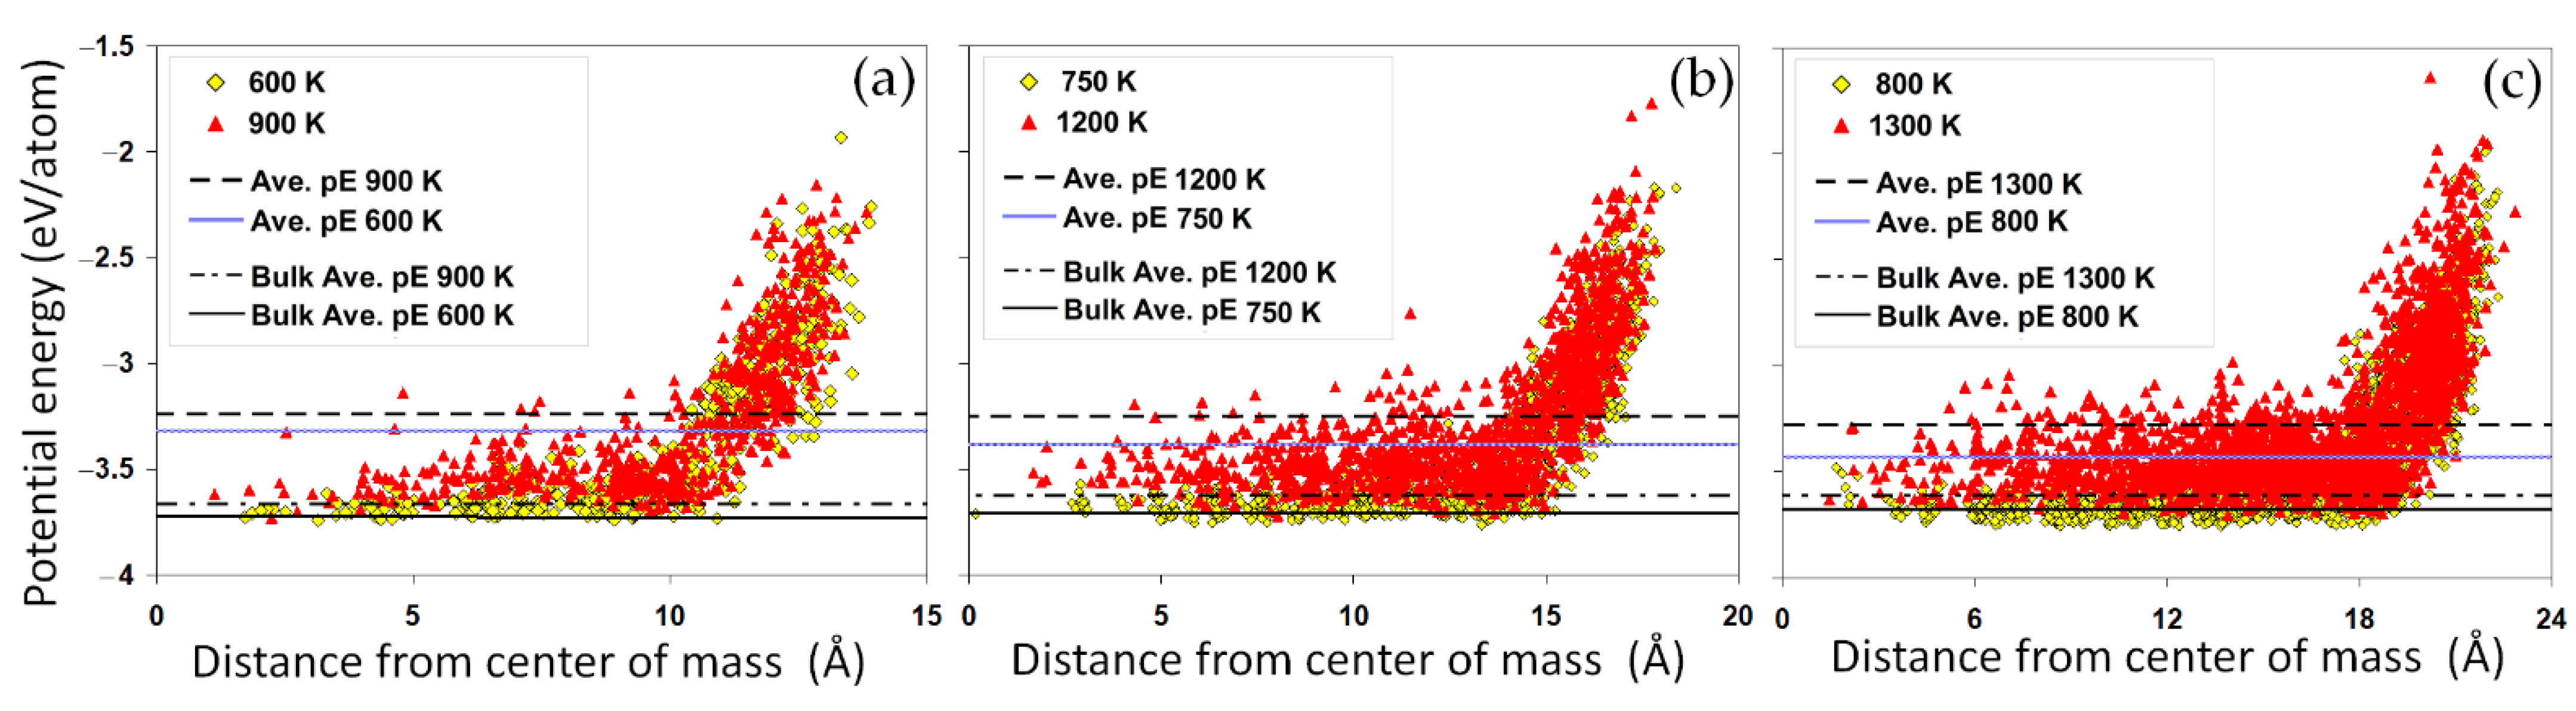
The spatial distribution of the potential energy across the nanoparticles can shed more light on the size-dependent energetics of the nanoparticles.
Figure 3a–c compare the potential energy distributions of different nanoparticles. For each case, the distributions are shown at two temperatures corresponding to a solid and a liquid state, respectively. The horizontal lines present the average potential energy of the nanoparticles and the bulk system for the same temperatures. We have found that although the absolute energy difference between the two solid and liquid states can be relatively small, in the range of 0.1 eV/atom, the radial distribution greatly varies from the center to the surface. Core-shell heterogeneous energy distribution is evidenced within all nanoparticles, with a core region showing an almost uniform energy distribution rapped in a shell of high energy atoms. It is clear that a large number of atoms in the surface region of the nominally solid nanoparticle (for example Au
1289 at 750 K,
Figure 3b) have a much higher potential energy, even higher than the average potential energy of a liquid nanoparticle. This implies that it is possible for a premature surface melting to occur before reaching the melting temperature of the nanoparticle.
Similar to the potential energy, the average LIs, as shown in
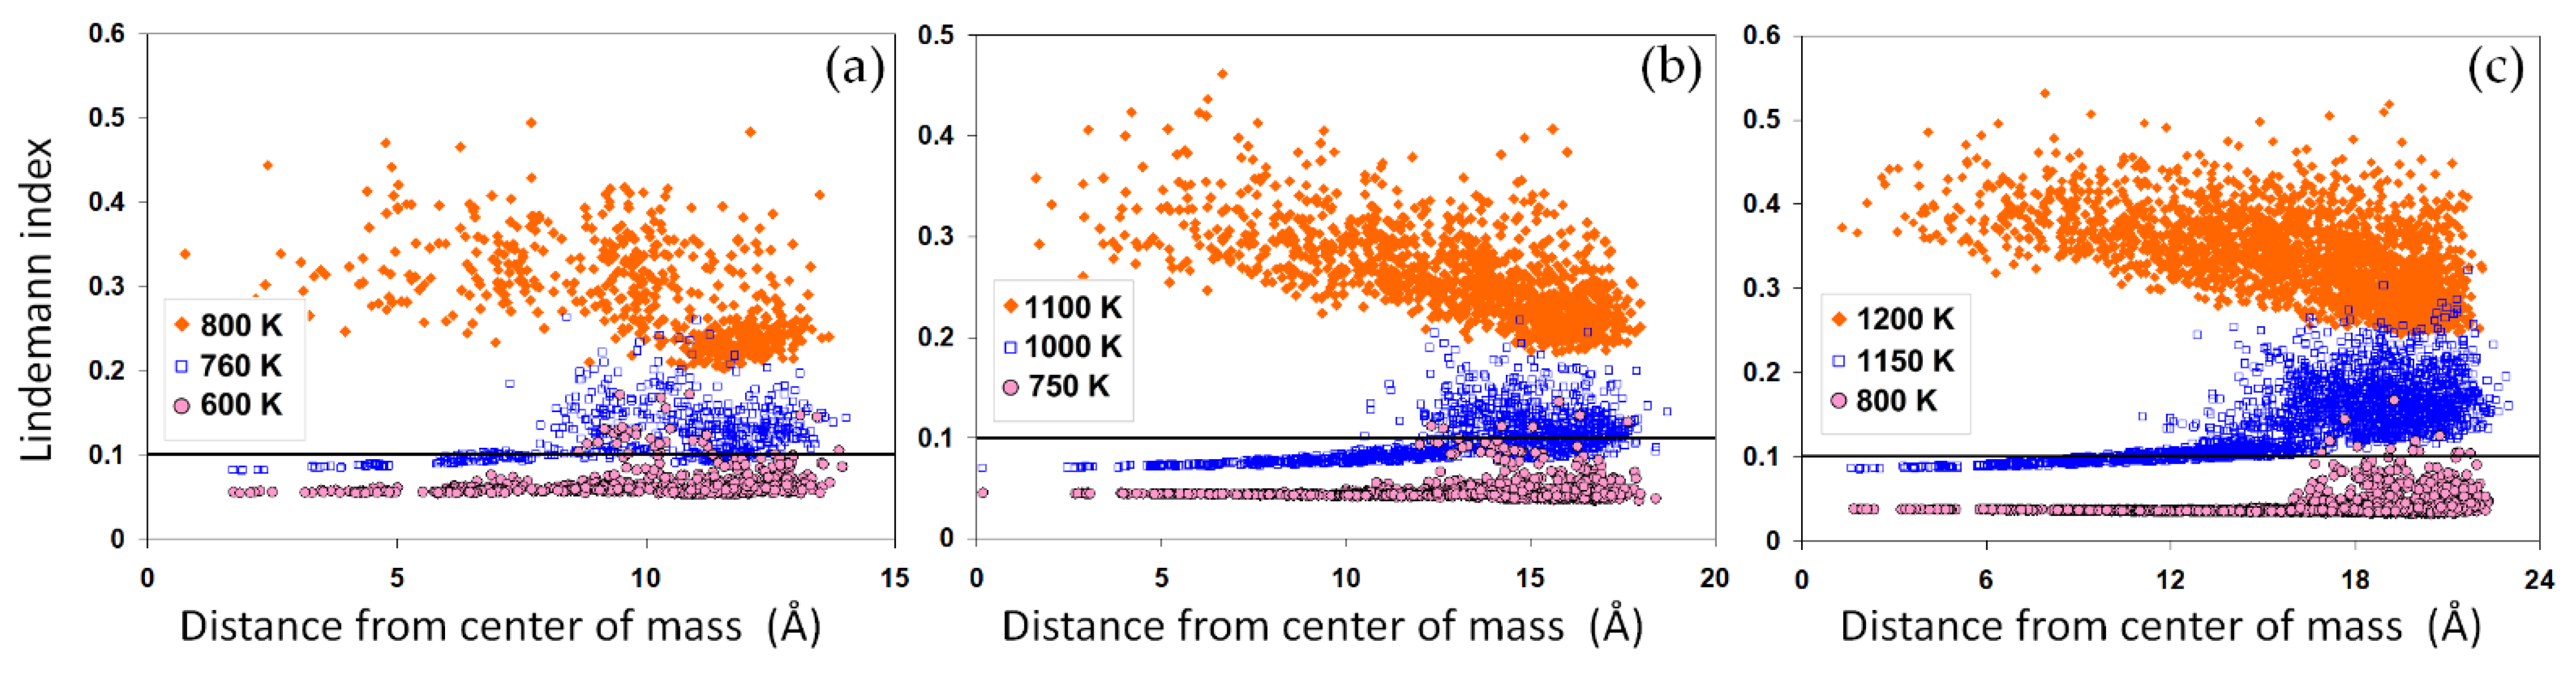
Figure 2b, indicate an abrupt increase upon the solid-liquid phase transition. The LI reflects on the average atomic mobility within each system. Thus, a sharp increase in this value, generally greater than 0.1, marks a solid-liquid phase transition. For the nanoparticles, while the sharpest increase in the LI values closely correlates with the jump in the potential energy, a significant temperature-dependent increase is also visible below their corresponding melting point, indicating the possibility of a surface-induced premelting. To elaborate on the large LI values in the nanoparticles, we studied the radial distribution of atomic LI values across the nanoparticles, as shown in
Figure 4a–c. The results show that a large portion of atoms in the nominally solid nanoparticles have a liquid-like high atomic LI value above 0.1. These results are consistent with the potential energy distribution shown in
Figure 3a–c. This suggests that the surface plays a destabilizing role in the nanoparticles, thus increasing the mobility of surface atoms and therefore the LI values. Close to the melting point, the mobility of atoms and the corresponding LIs rapidly increase, enhancing the possibility of a surface melting phenomenon. For smaller nanoparticles, surface melting can occur over a wider range of temperatures, as shown in
Figure 2b, with important implications for the coalescence of the solid-state nanoparticles. The distributions of LIs after melting are distinctly different,
Figure 4a–c.
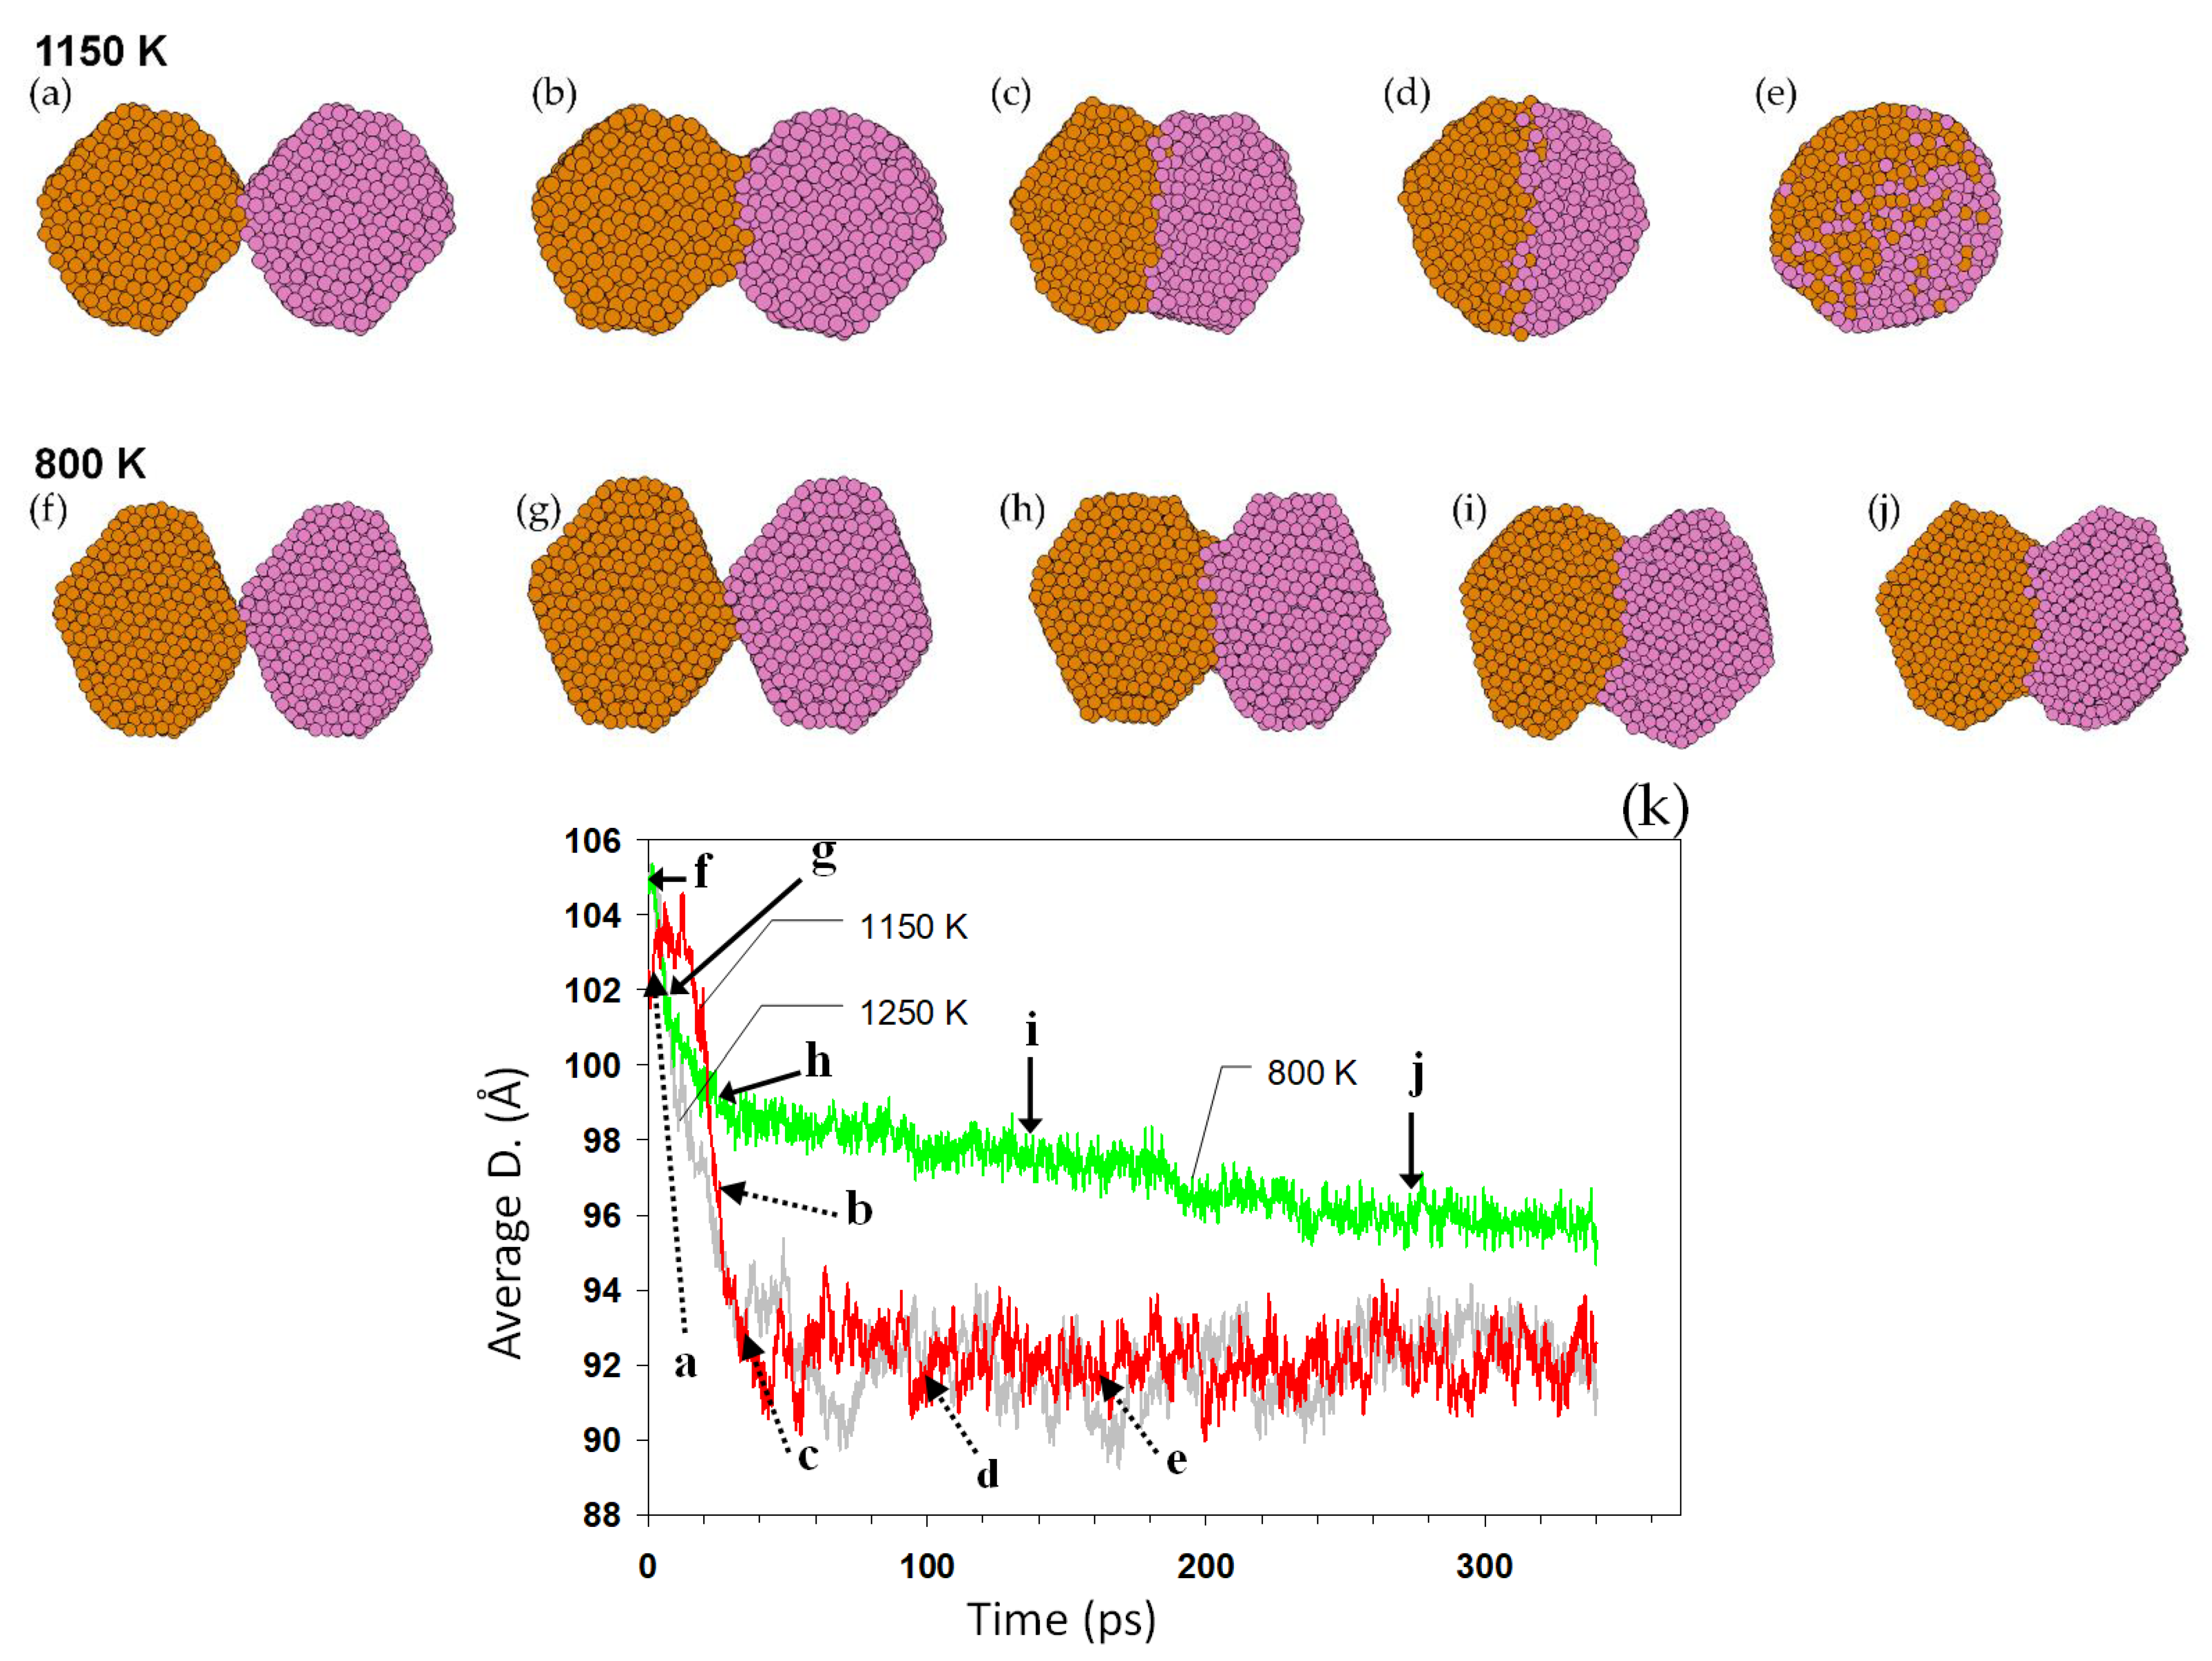
The coalescence of the nanoparticles, naturally initiating on their surfaces, is a heterogeneous process and mainly influenced by the energetics and kinetics of the surface atoms. During the coalescence simulations, the initial contact between the two particles is established by the weak attractive forces between them.
Figure 5 shows the coalescence of two pairs of Au
2406 nanoparticles at 1150 and 800 K (initial temperatures). When two nanoparticles touch, a necking region immediately forms. Atomic diffusion takes place, automatically working to reduce the total energy of the system (joined nanoparticles), generally by reducing the high-energy regions. The size evolution of the nanoparticles is exemplified in
Figure 5k. The diffusion process and thus the progress in the coalescence strongly depend on the temperature. When the temperature is high enough, e.g., the 1150 K case in
Figure 5, the necking rapidly develops towards forming a single larger nanoparticle. The coalescence is much slower at 800 K, developed here up to a necking but preserving the initial outer shape and structure of the nanoparticles.
Table 1 lists the minimum full-coalescence temperatures (
) measured in our simulations for nanoparticles of different sizes.
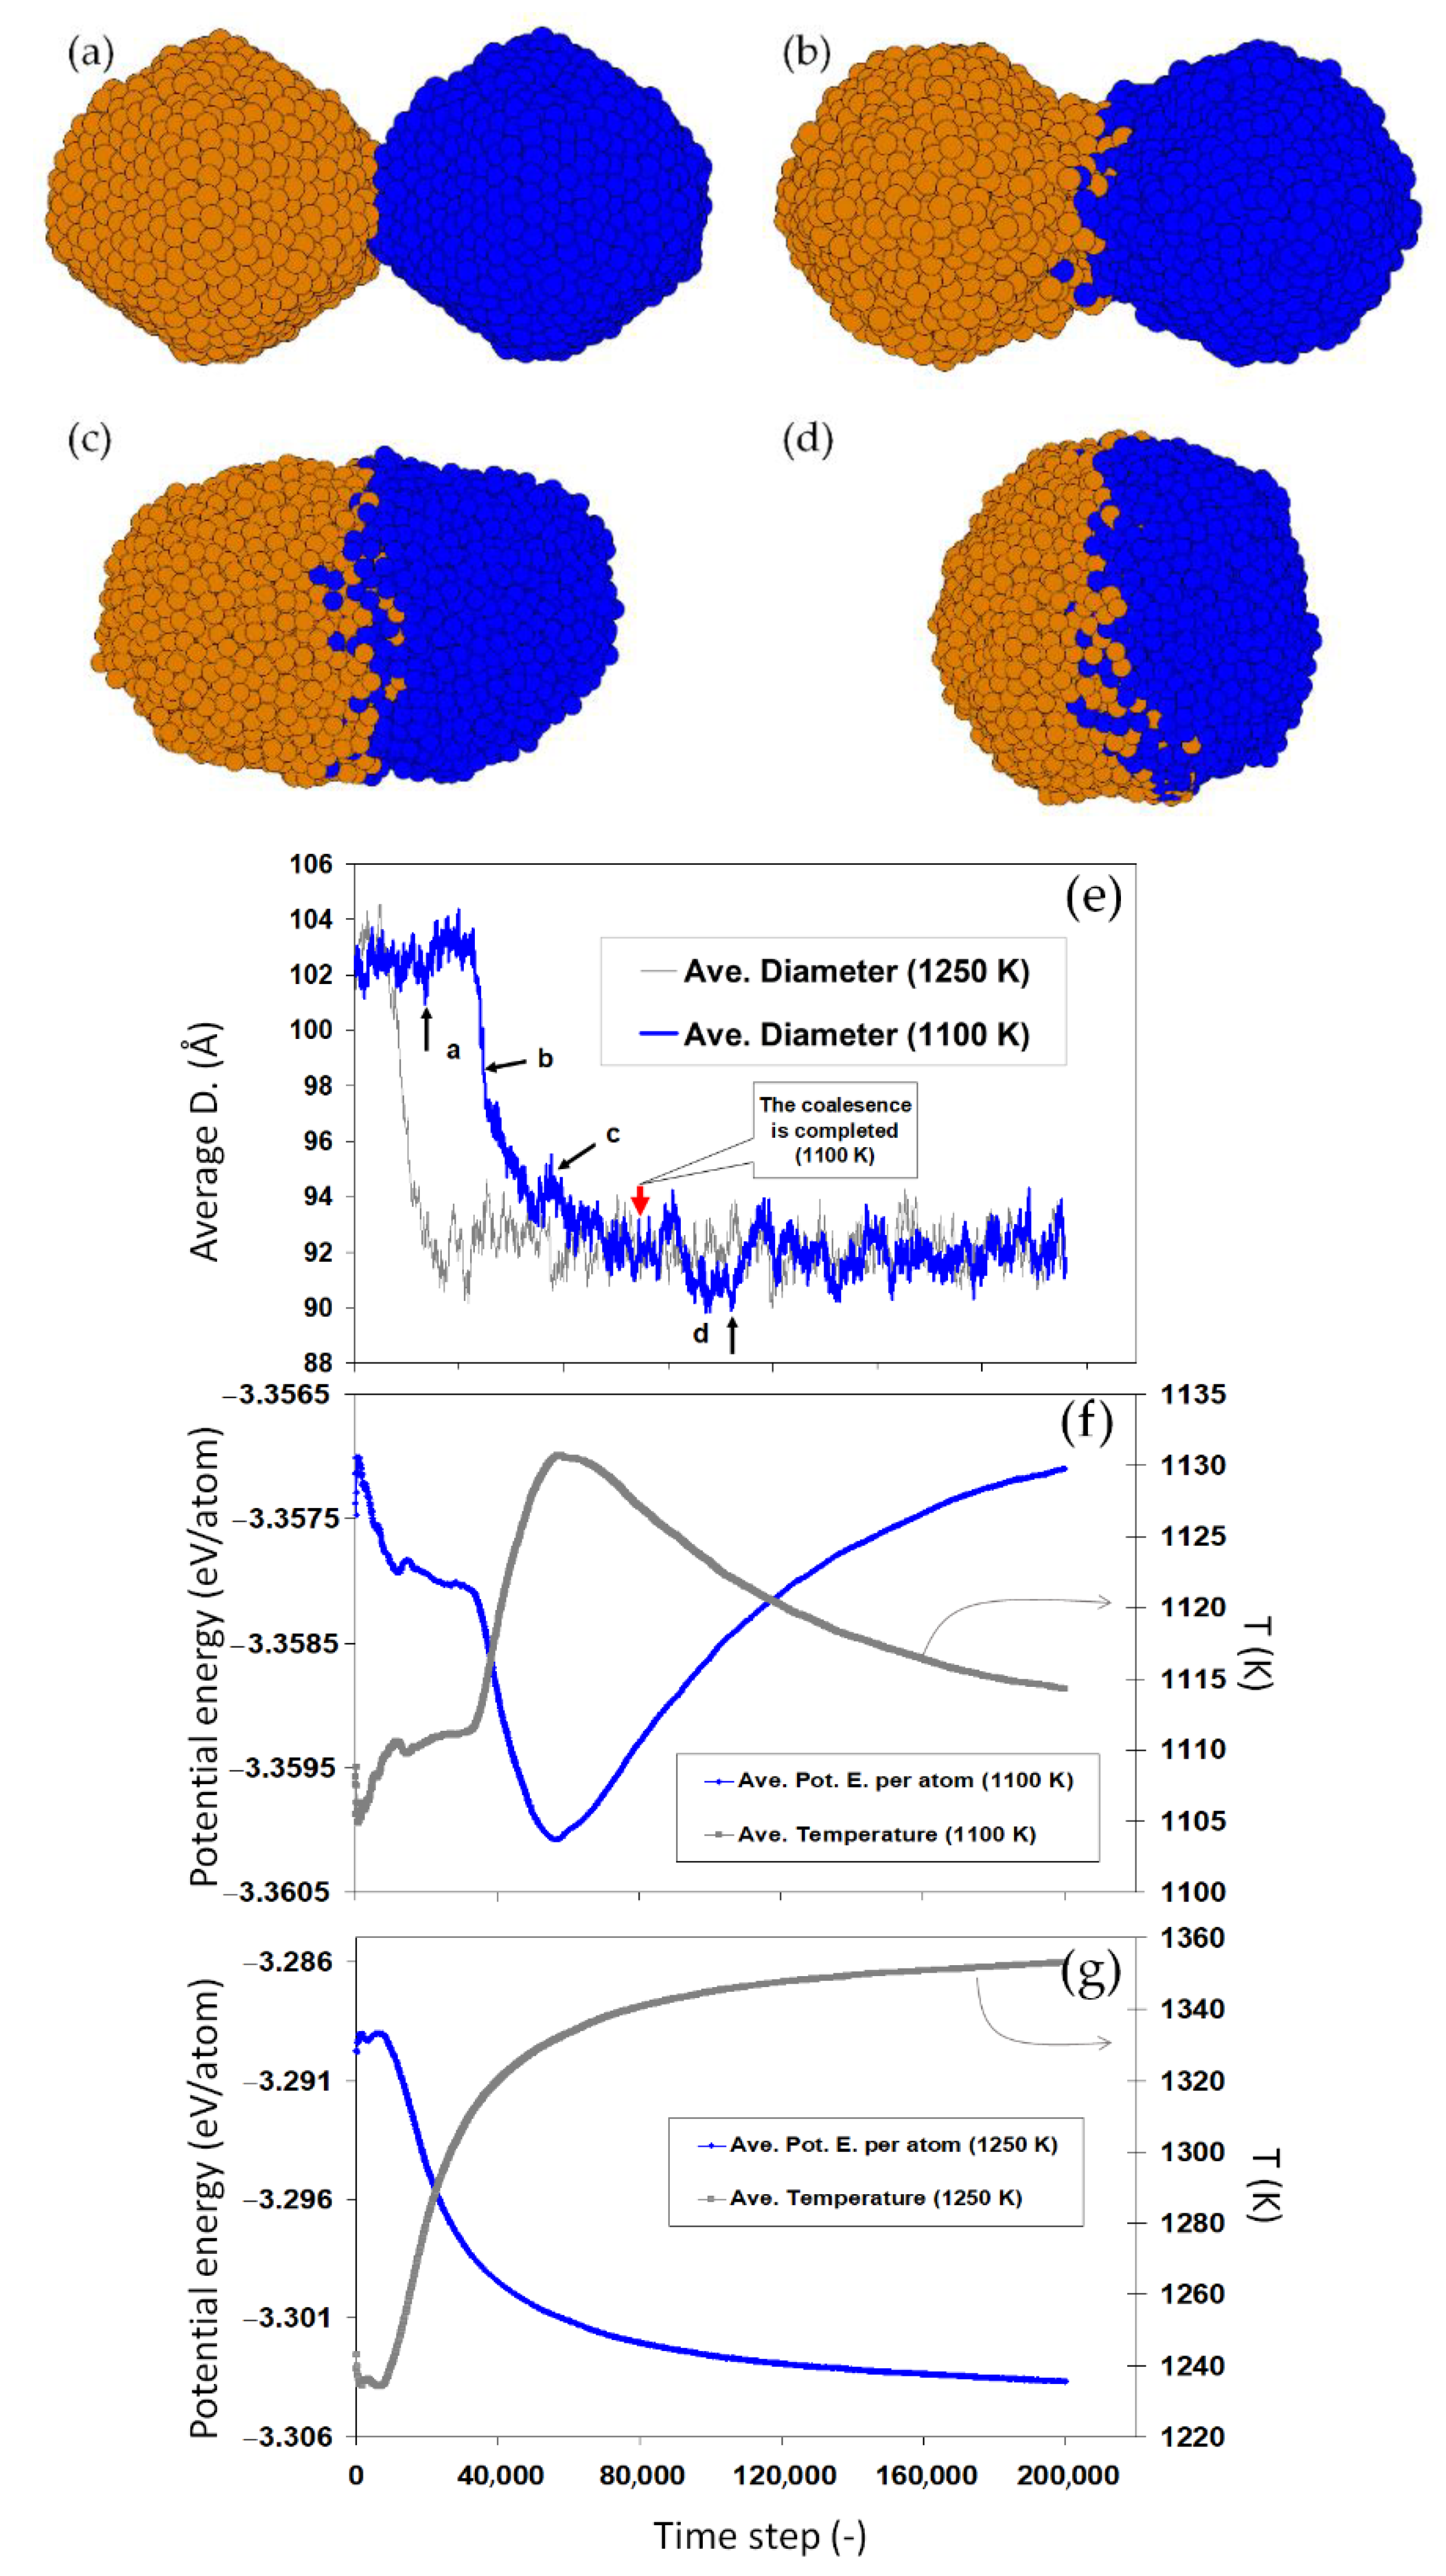
Figure 6a–d show the coalescence of two Au
2406 nanoparticles at initial temperature 1100 K (solid-state).
Figure 6e–g compare the size, potential energy, and the corresponding temperature evolution of this system versus an analogous pairs of nanoparticles coalescing at 1250 K (liquid-state). The size evolution during the two simulations shows a complete coalescence of the nanoparticles for both conditions. Analysis of the potential energy and temperature of the two systems, however, reveals a fundamental difference in the mechanisms of coalescence: For the liquid droplets (at 1250 K), coalescence occurs rapidly with a continuous increase in the temperature, due to the heat released upon the reduction in the total surface area. In the case of the two solid nanoparticles at 1100 K, a nontrivial path is taken in which an initial decrease (increase) in the potential energy (temperature) is inversed during the coalescence, as shown in
Figure 6f. This sudden change in the potential energy and temperature indicates a phase transition in the coalescing nanoparticles. The sudden decrease in the energy implies that the energy released due to the surface reduction is invested in
melting the two coalescing solid nanoparticles (coalescence-induced melting), manifested then by the decrease in the temperature. This reveals synergetic mechanism of coalescence in which the coalescence accelerates itself by the energy released due to the surface reduction, resulting in the melting of solid nanoparticles.
4. Discussion
Coalescence induces size and shape changes in nanoparticles that can have huge impact on their physical properties and functional performance. It is, for instance, demonstrated that the catalytic properties of nanoparticles dramatically change upon coalescence [
47]. At elevated temperatures, the nanoparticles’ tendency for interaction increases, which is due to the higher atomic mobilities, easing the formation of a larger common interface with surrounding objects. Since almost all properties of nanoparticles are strongly size-dependent, the nanoparticles’ coalescence then results in a coupled problem, as it modifies the size distribution as well as the thermal energy distribution within the system.
The current results show that solid-state nanoparticles are able to have a complete coalescence, confirming several previous works [
40,
43,
48]. Our analysis shows that the mechanism of coalescence is surface diffusion (high energy and high mobility surface-atoms). A rapid neck growth and a relatively slow reshaping of the attached nanoparticles were observed, as shown in
Figure 5. At higher temperatures, nanoparticles rapidly reshape, while at lower temperatures (for example Au
2406 at 800 K,
Figure 5) the coalescence begins quickly, but cannot be completed, because of the slow diffusion. Although our simulations times were many orders of magnitude smaller than real experimental times, the coalescence was completed much below their melting points. Thus, in experimental times, it may be expected that even lower coalescence temperatures can be observed given the longer time for diffusion. Because of the surface area reduction, the coalescence is accompanied by an energy release, increasing the temperature, which accelerates the entire process. This confirms previous reports on the sintering process of nanoparticles [
49].
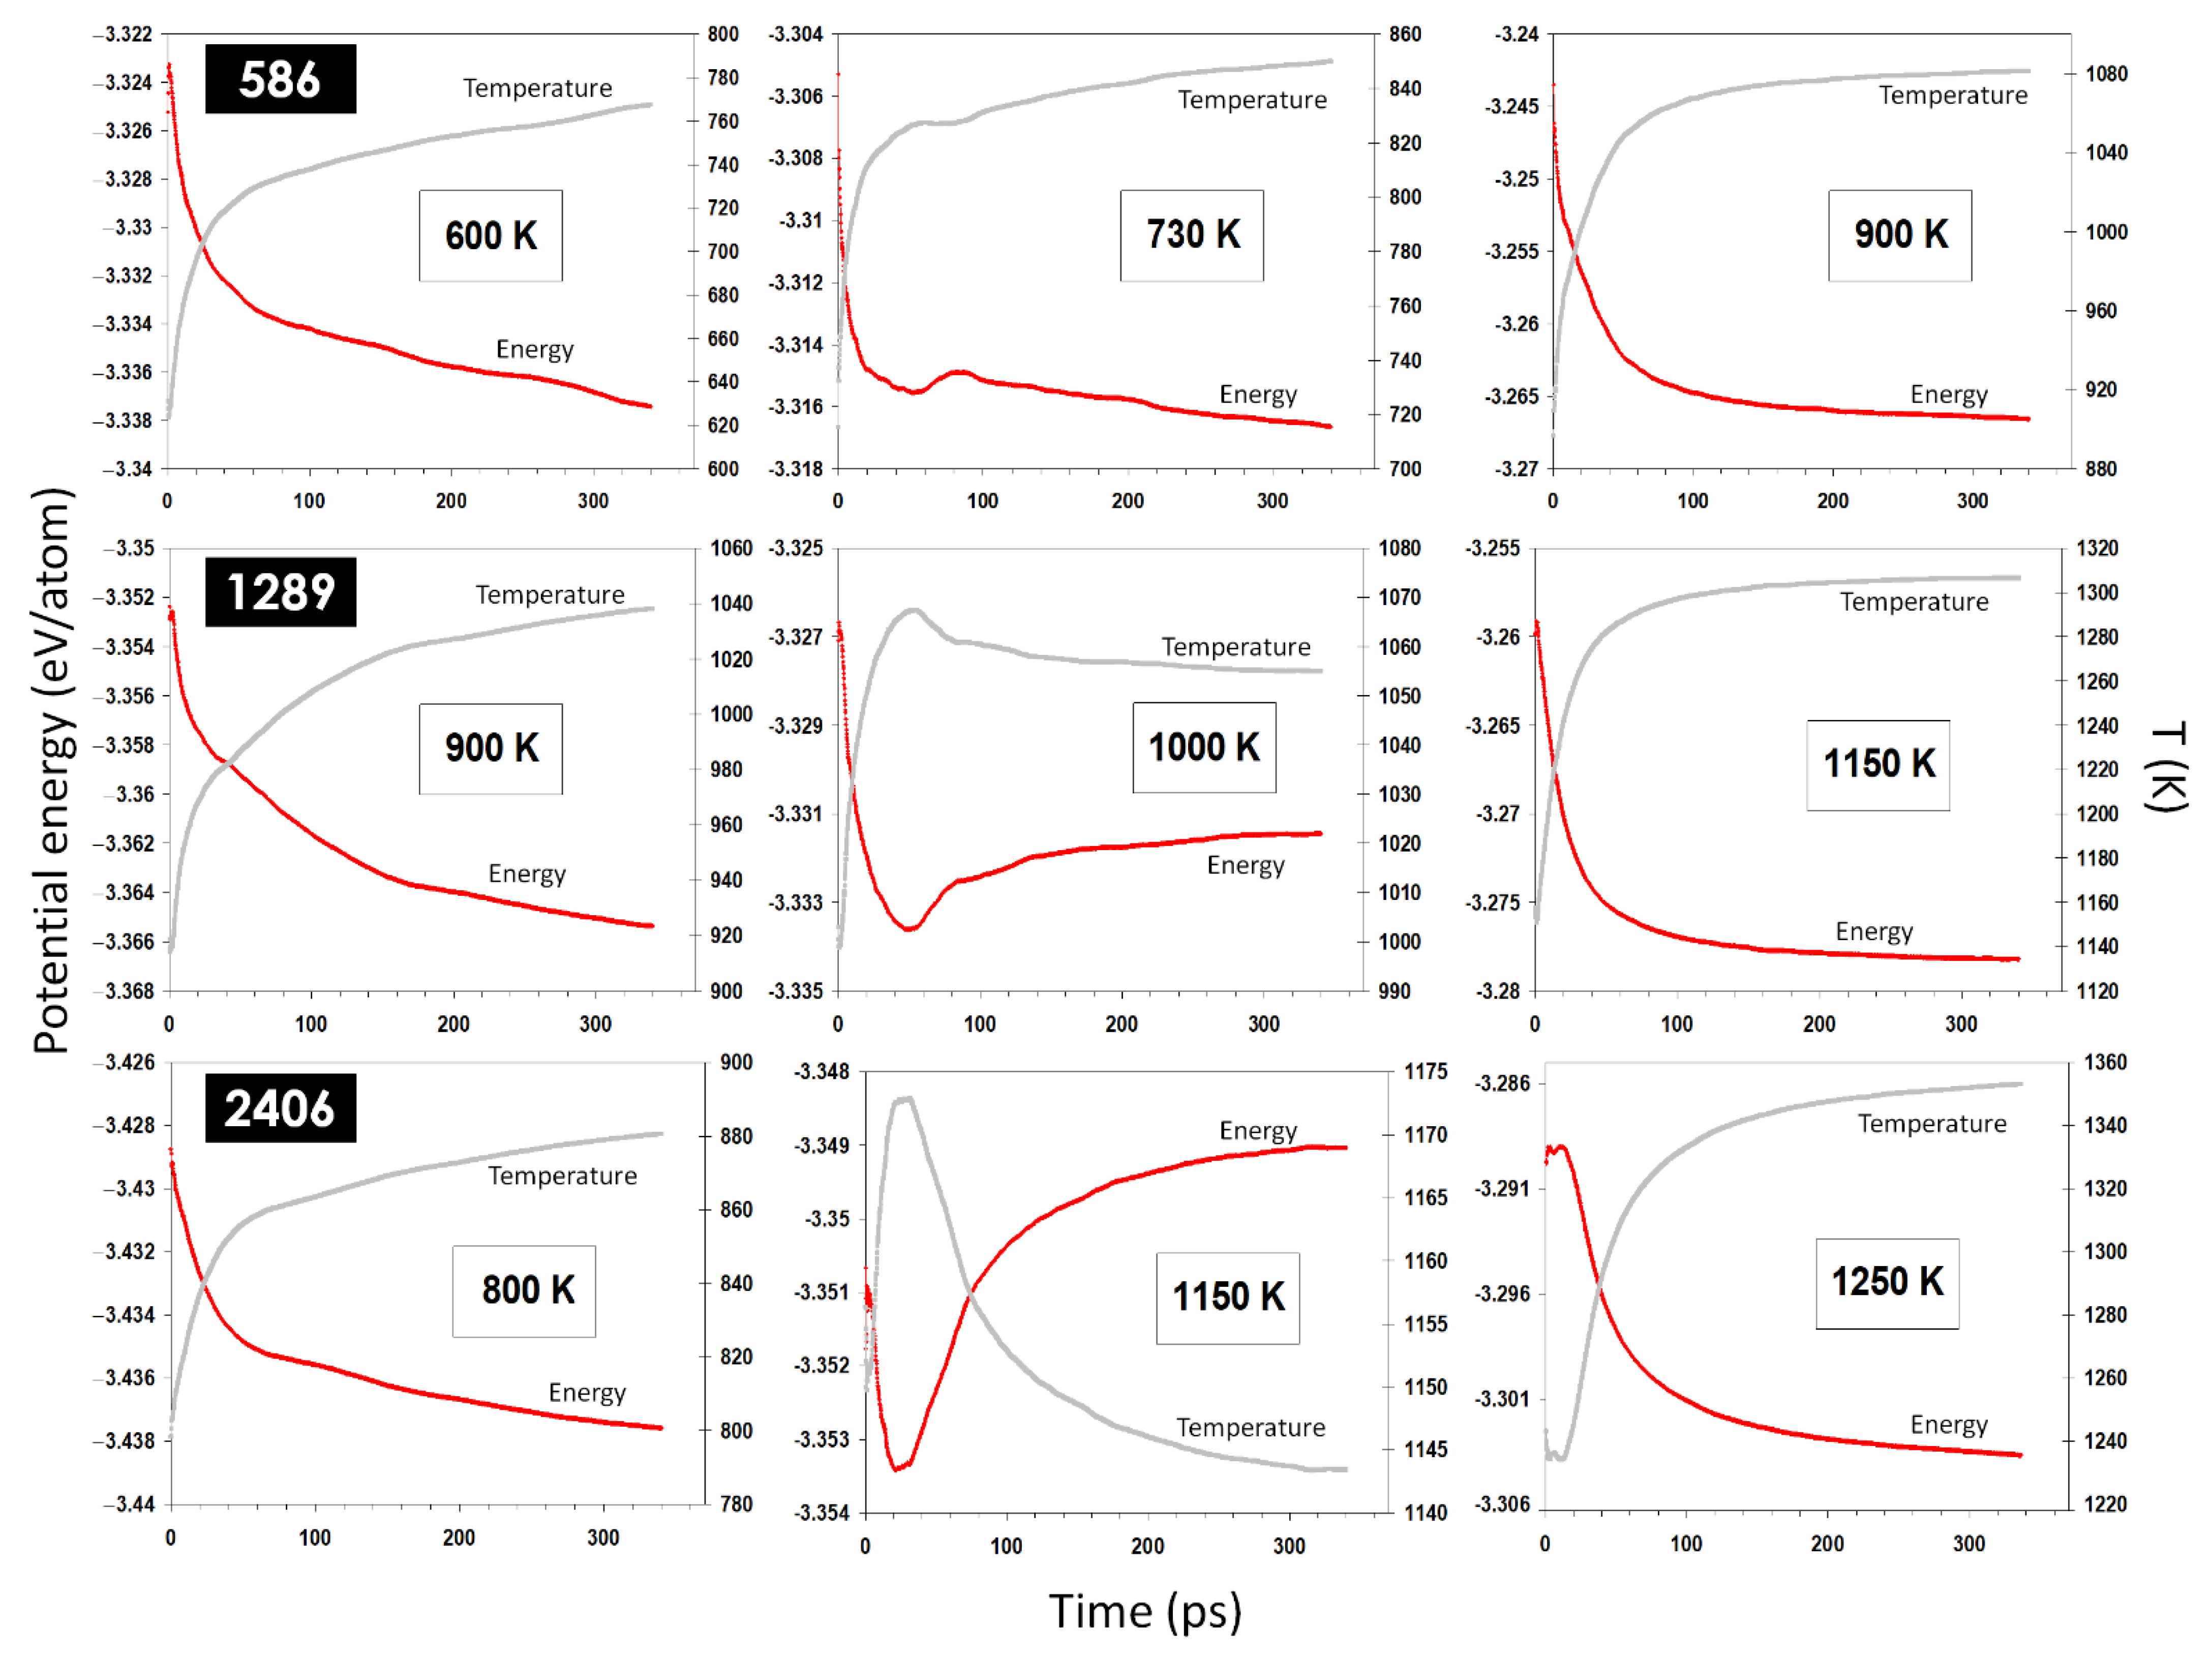
Beyond the solid-state coalescence, we found that, in certain conditions, the nominally solid nanoparticles can undergo a melting transition, induced by the energy released upon the coalescence. This is evidenced by a sudden change in the nanoparticles’ energy and temperature, as shown in
Figure 6. Further simulations of coalescing nanoparticles of different sizes and initial temperatures, as shown in
Figure 7, have confirmed this conclusion. The current results establish that the melting transition can be induced for a coalescence of small enough nanoparticles and/or at temperatures close enough to the melting temperature.
The mechanism of melting during the coalescence can be related to the surface reduction. The energy released due to the surface reduction results in a temperature increase in the system. The simplest approximation of this energy is
(J/mol), which gives the corresponding increase in the temperature
Here, we assume full coalescence, spherical nanoparticles and neglect all additional surface effects and temperature dependence of the properties, with
the surface energy,
the molar volume,
the molar heat capacity, and
the radius of the particle. For a gold nanoparticle, considering a surface energy of
J/m
2, we obtain
and
, that is, for the coalescence of two Au
2406 nanoparticles (of a radius about 2.4 nm), we can approximate
kJ/mol (0.041 eV/atom) and
K. For the melting to occur, the energy released during the coalescence must split between heating up (increasing the temperature) and accommodating the melting latent heat. Thus, the minimum condition for the melting to occur is
. For the Au
2406 system,
eV/atom. As shown
Figure 2 and
Table 1, the latent heat
is also size-dependent, reducing with decreasing the nanoparticle size. This makes the melting even easier during the coalescence of small nanoparticles. Obviously, additional effects, such as stress effects and the effect of surface anisotropy, can play important roles which need further studies.
Besides the surface energy discussed here, more excess energies can be stored in the nanoparticles through lattice defects, which can further contribute to their melting upon coalescence. This mainly depends on the production process. For instance, nanoparticles that are produced in a (nonequilibrium) thermal shock and condensation process are shown to maintain a significant dislocation population and nonequilibrium surface structures [
50]. These structural defects carry strain energies which can be released upon the coalescence of nanoparticles. The investigation of these aspects requires the simulation of nonequilibrium nanoparticles, which could be the topic of a future study.
The melting of nanoparticles has been broadly analyzed using differential scanning calorimetry (DSC). Experimental examination of the coalescence-induced melting, however, may need more accurate measurements due to its possible overlap with natural melting upon heating. Simultaneous synchrotron X-ray and DSC analysis can offer a possible route for studying this phenomenon [
51]. Two challenges to overcome in such measurements could be the size distribution of nanoparticles being broad and the pre-attachment of nanoparticles before reaching the critical temperature, which, respectively, increases the broadness of the heat curve close to the melting transition and reduces the surface effect. An investigation of a rather narrow size distribution and a good preparation of nanoparticles to remain detached can critically improve the experimental investigation of a coalescence-induced melting phenomenon.
5. Conclusions
We have studied the surface effects on the melting and coalescence of Au nanoparticles of different sizes and at different temperatures, using MD simulations based on the glue potential. The size-dependent melting point and latent heat of nanoparticles were revealed in agreement with previous studies. We analyzed these in terms of the spatial heterogeneous distribution of energy and LI within the nanoparticles. The coalescence of nanoparticles was found to be markedly sensitive to these surface features.
In particular, it has been revealed that the coalescence of two solid nanoparticles may result in the melting of the nanoparticles. This phenomenon is discussed in relation to the surface energy released upon the coalescence, thus making it size- and temperature-dependent. The occurrence of the melting upon coalescence is assisted by the low latent heat of melting that itself originates in the difference between the solid and liquid nanoparticles’ surface energy.
The melting during the coalescence of solid nanoparticles can have important implications for their storage and applications. Our results imply that solid-state nanoparticles applied at intermediate temperature, far below their nominal melting temperature, may still undergo a melting transition upon coalescence. Such a transition then results in a discontinuous change in the physical properties of nanoparticles that can be responsible for a dramatic decline in the performance of nanoparticles. Even single nanoparticles are shown here to have liquid-like surface activities that need to be accounted for during their applications in the intermediate temperature range.


