
Low-Cost Surface Enhanced Raman Scattering for Bio-Probes

Abstract
:1. Introduction
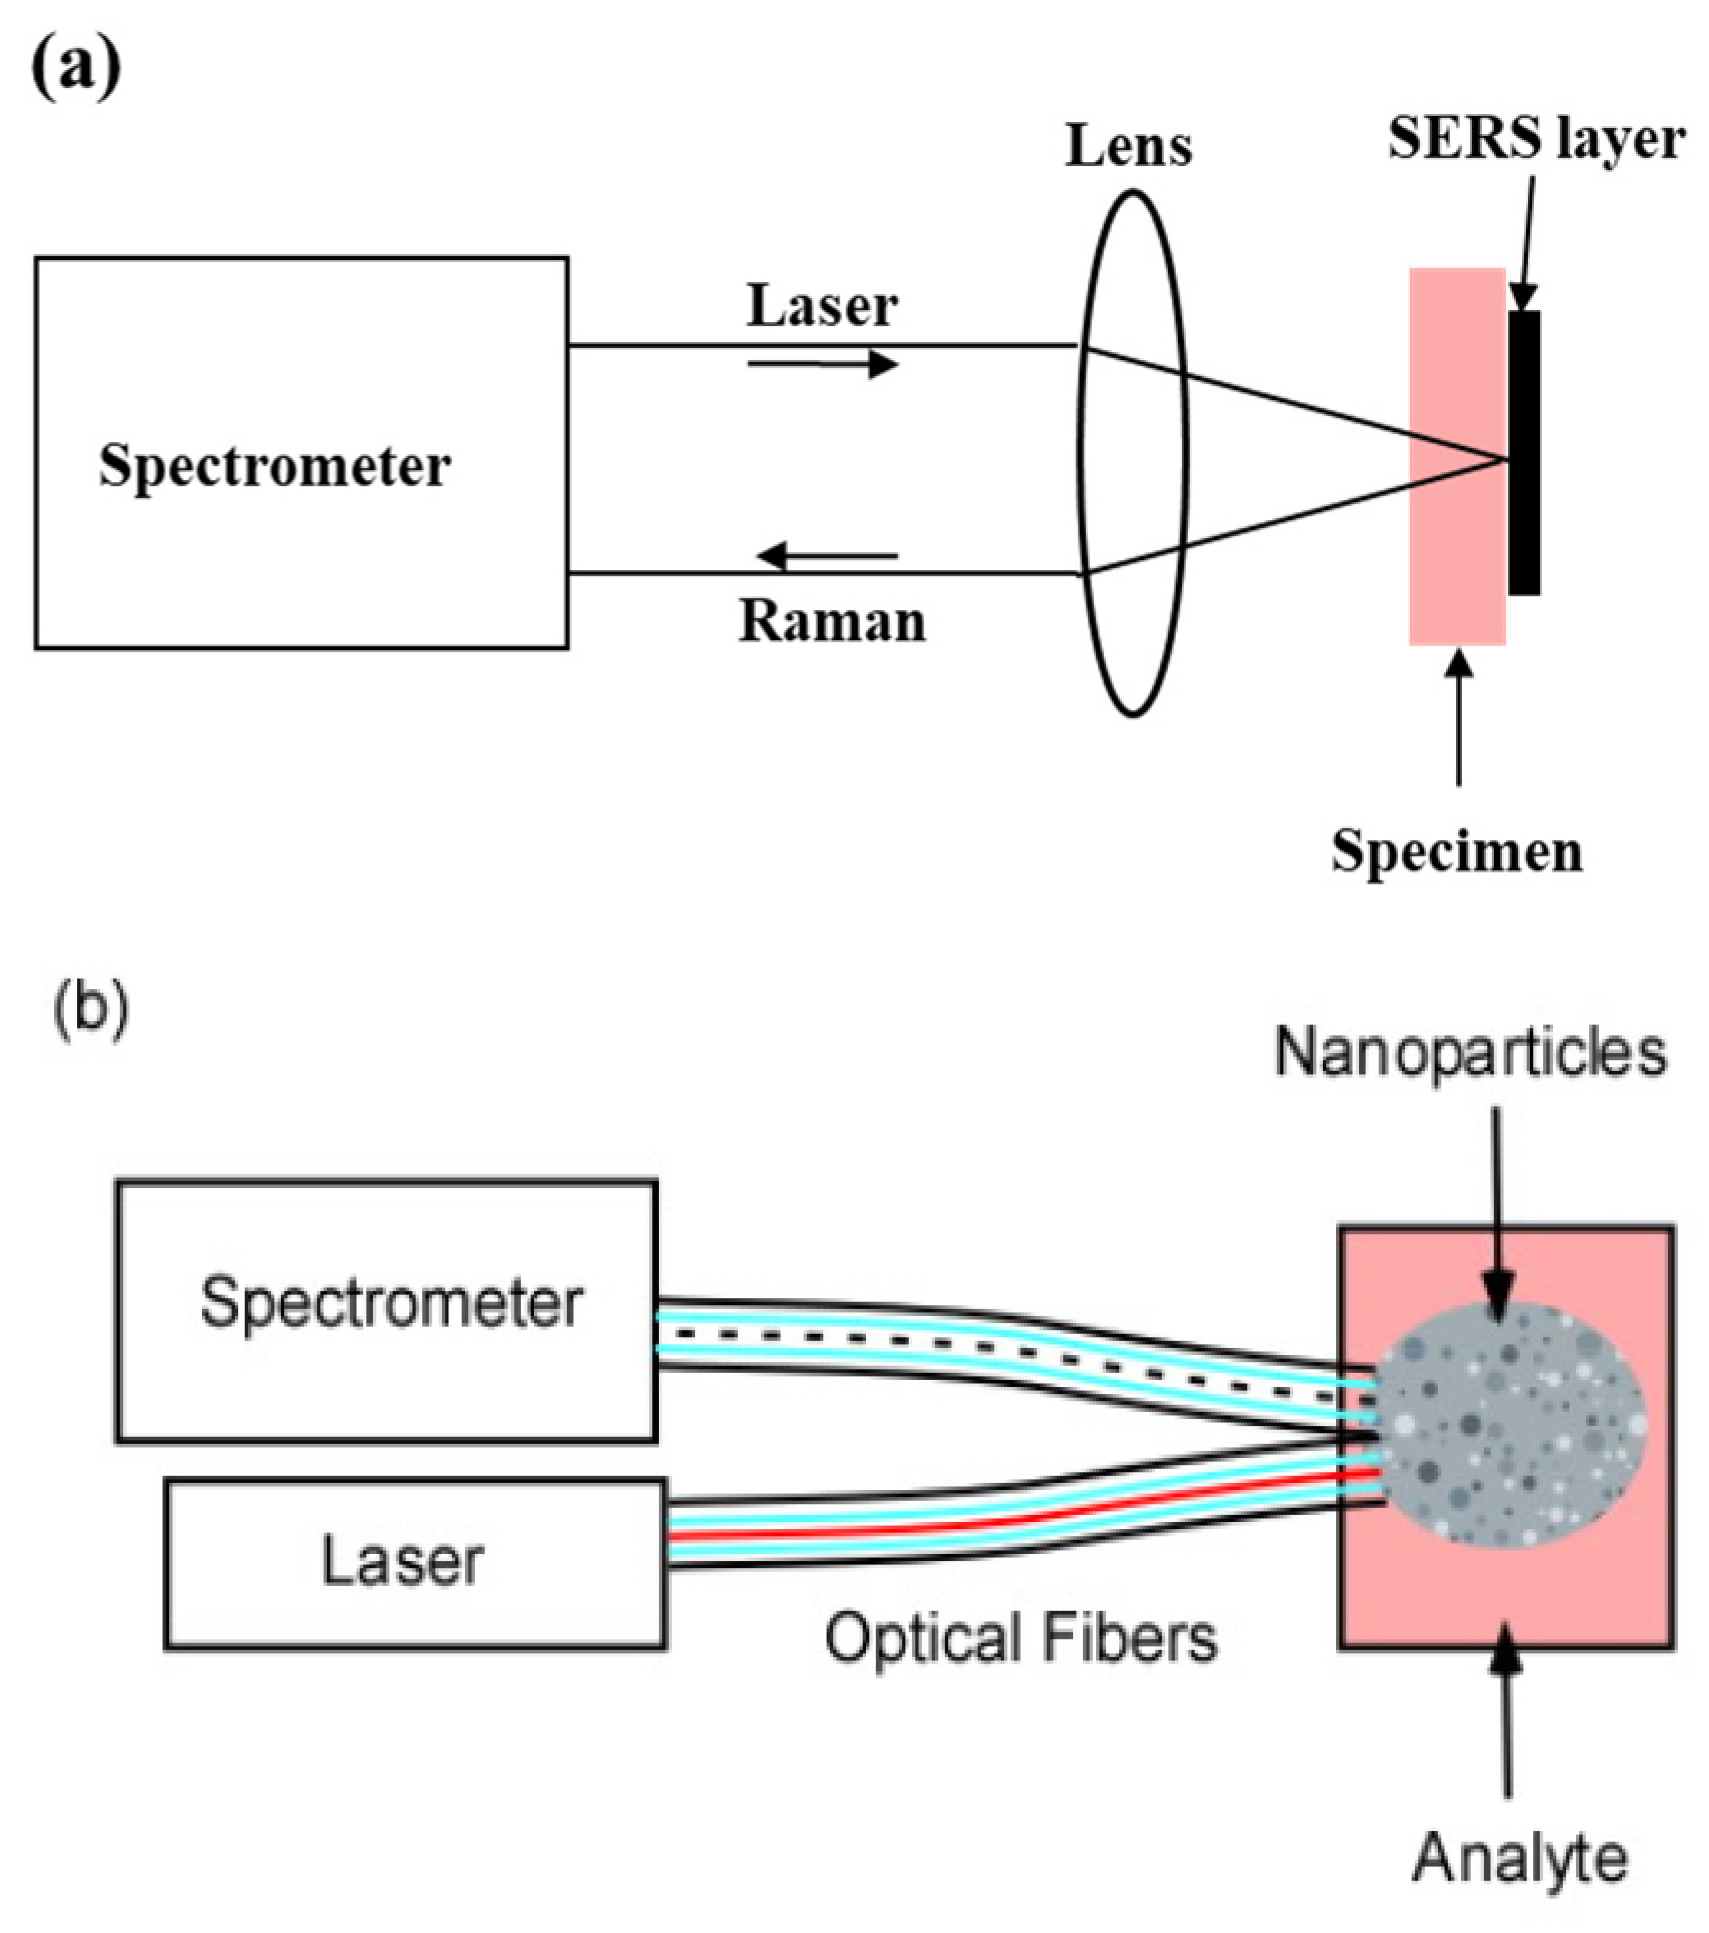
- (a)
- If the sample is inhomogeneous, adjacent areas may be compared with high spatial resolution.
- (b)
- The large solid angle sustained by the microscope objective collects a substantial fraction of the emitted isotropic Raman light.
- (c)
- Because the Raman light originates from a small area it is readily focused and transmitted through the spectrometer slit.
- (a)
- ERS substrates suitable for bio-probes or remote sampling without the disadvantages associated with injected clouds substrates and multiple fiber collection systems.
- (b)
- A low-cost alternative for SERS self-assembly fabrication method with no lithography or chemical synthesis.
2. Materials and Methods
2.1. Nanoparticles
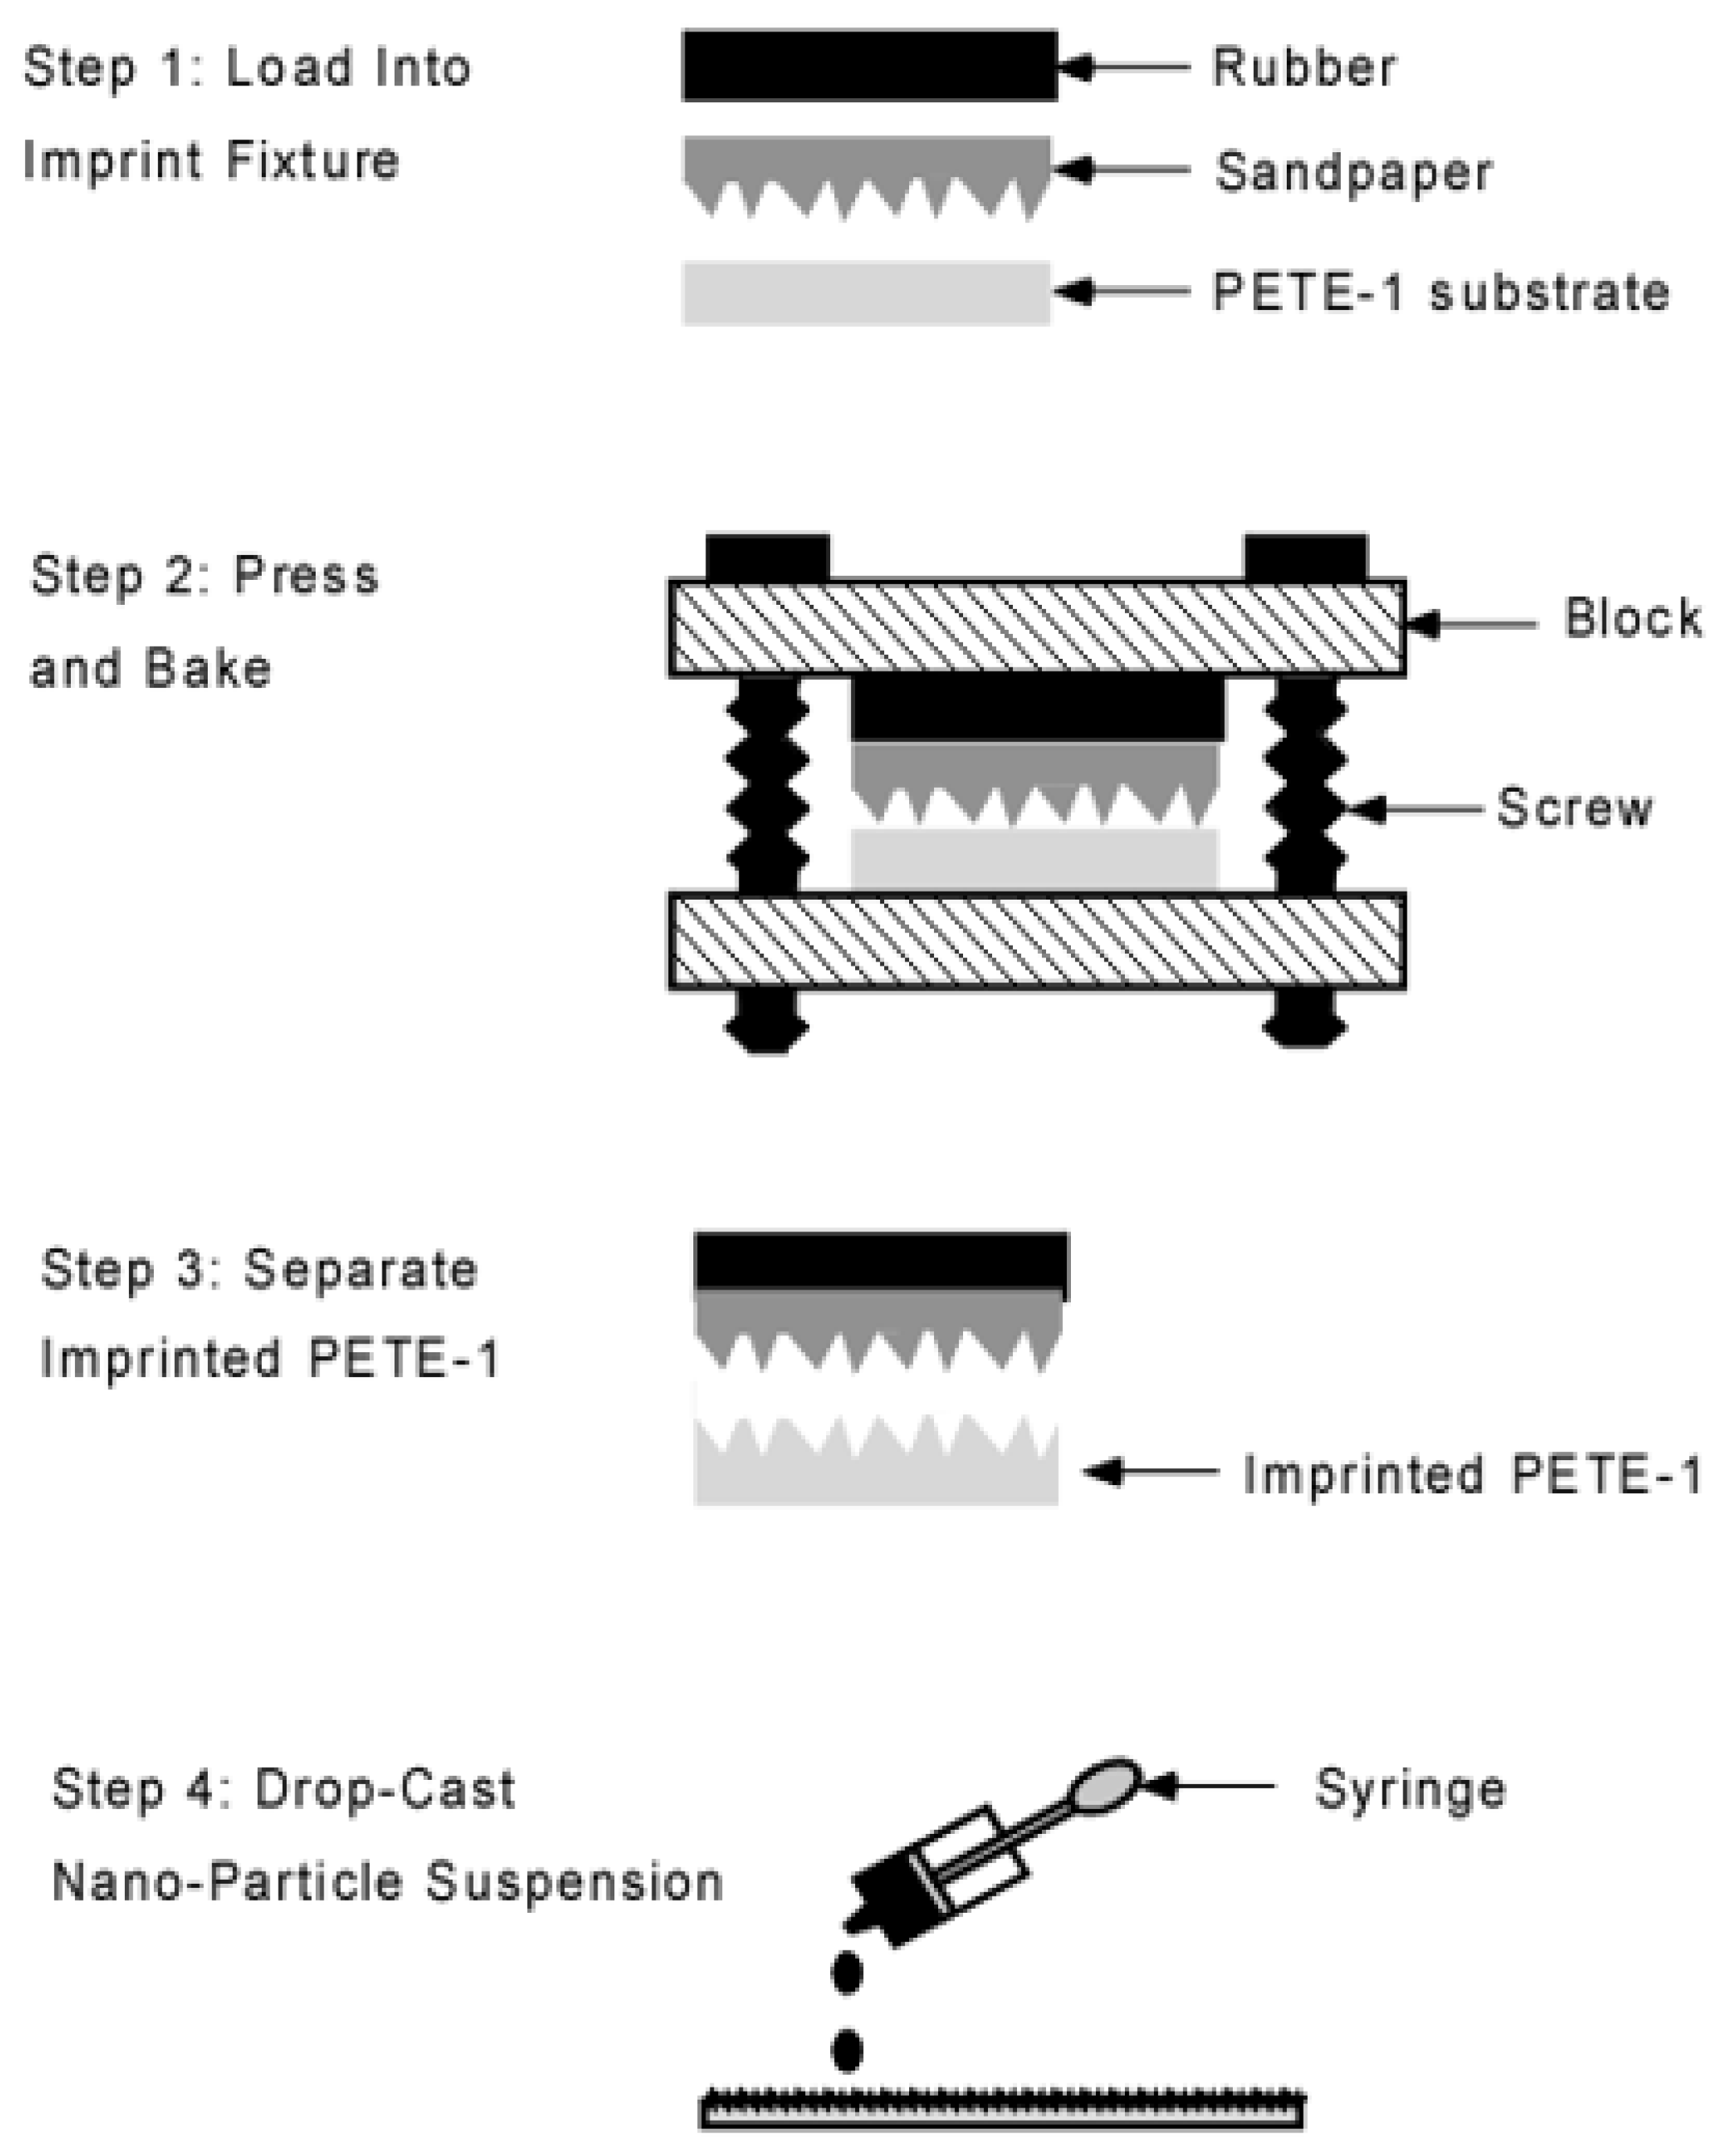
2.2. Imprinting
2.3. Self Assembly
2.4. Transfer to Different Substrates
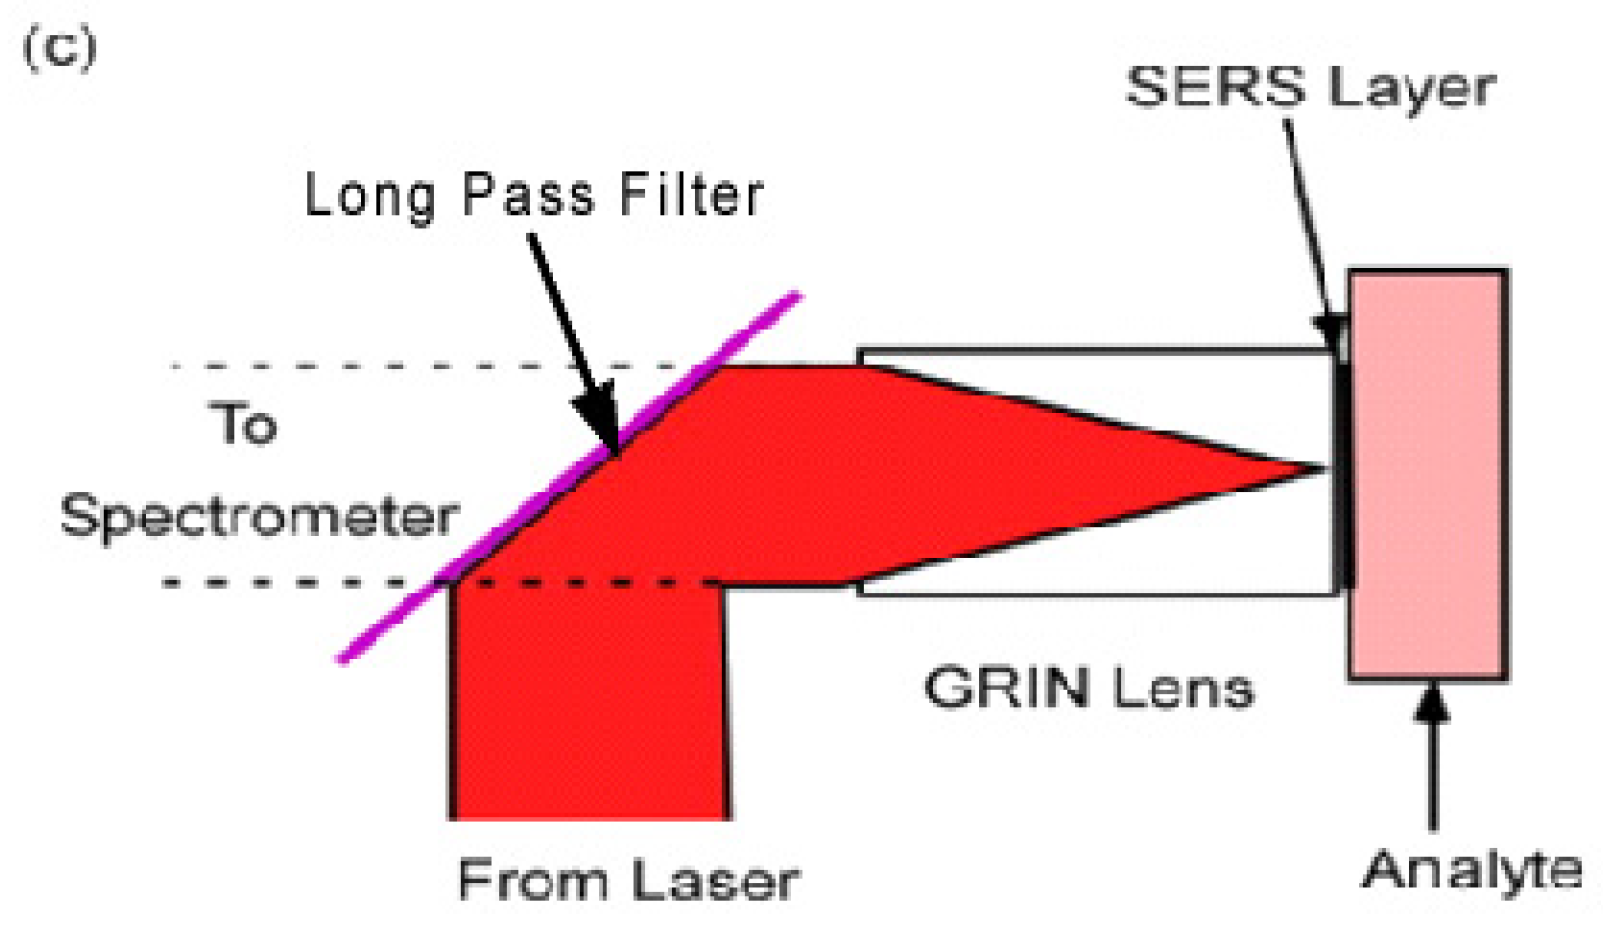
- (a)
- The nanospheres must be securely attached so they do not fall off and remain in the tissue.
- (b)
- Transmission to the spectrometer is poor without a lens to collect and collimate the Raman light to focus it on the spectrometer slit.
2.5. Measurements and Characterization
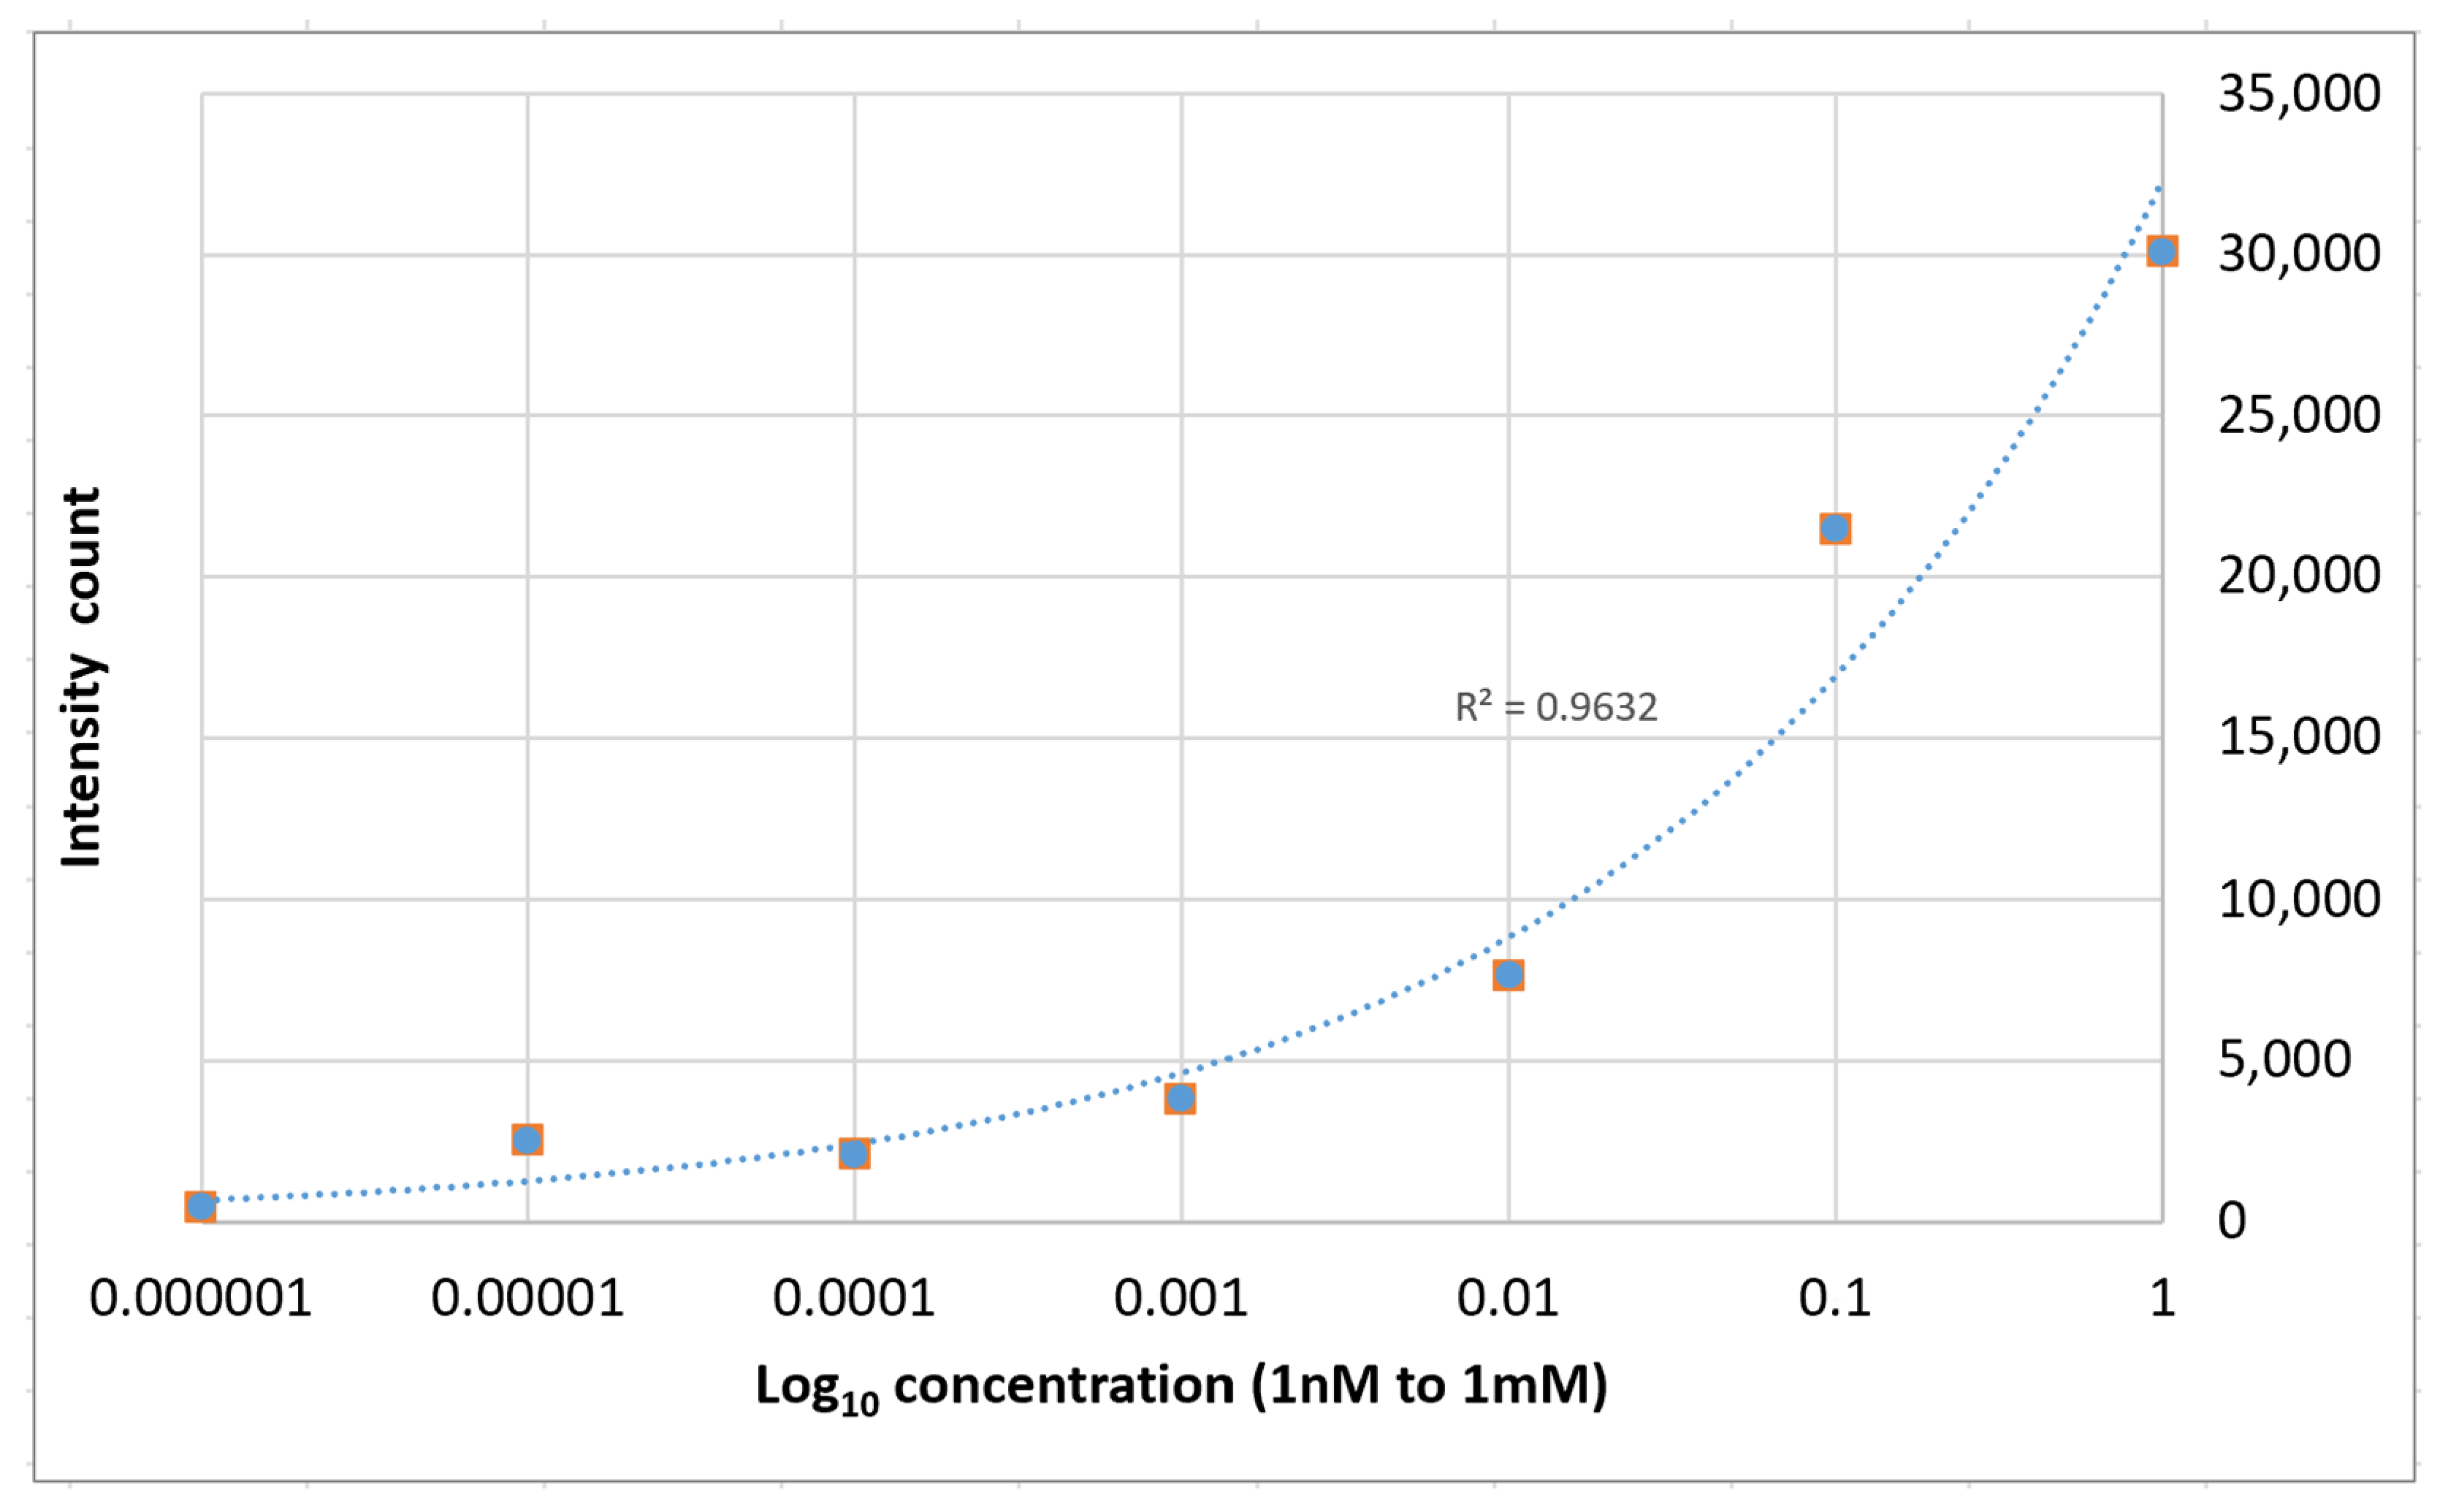
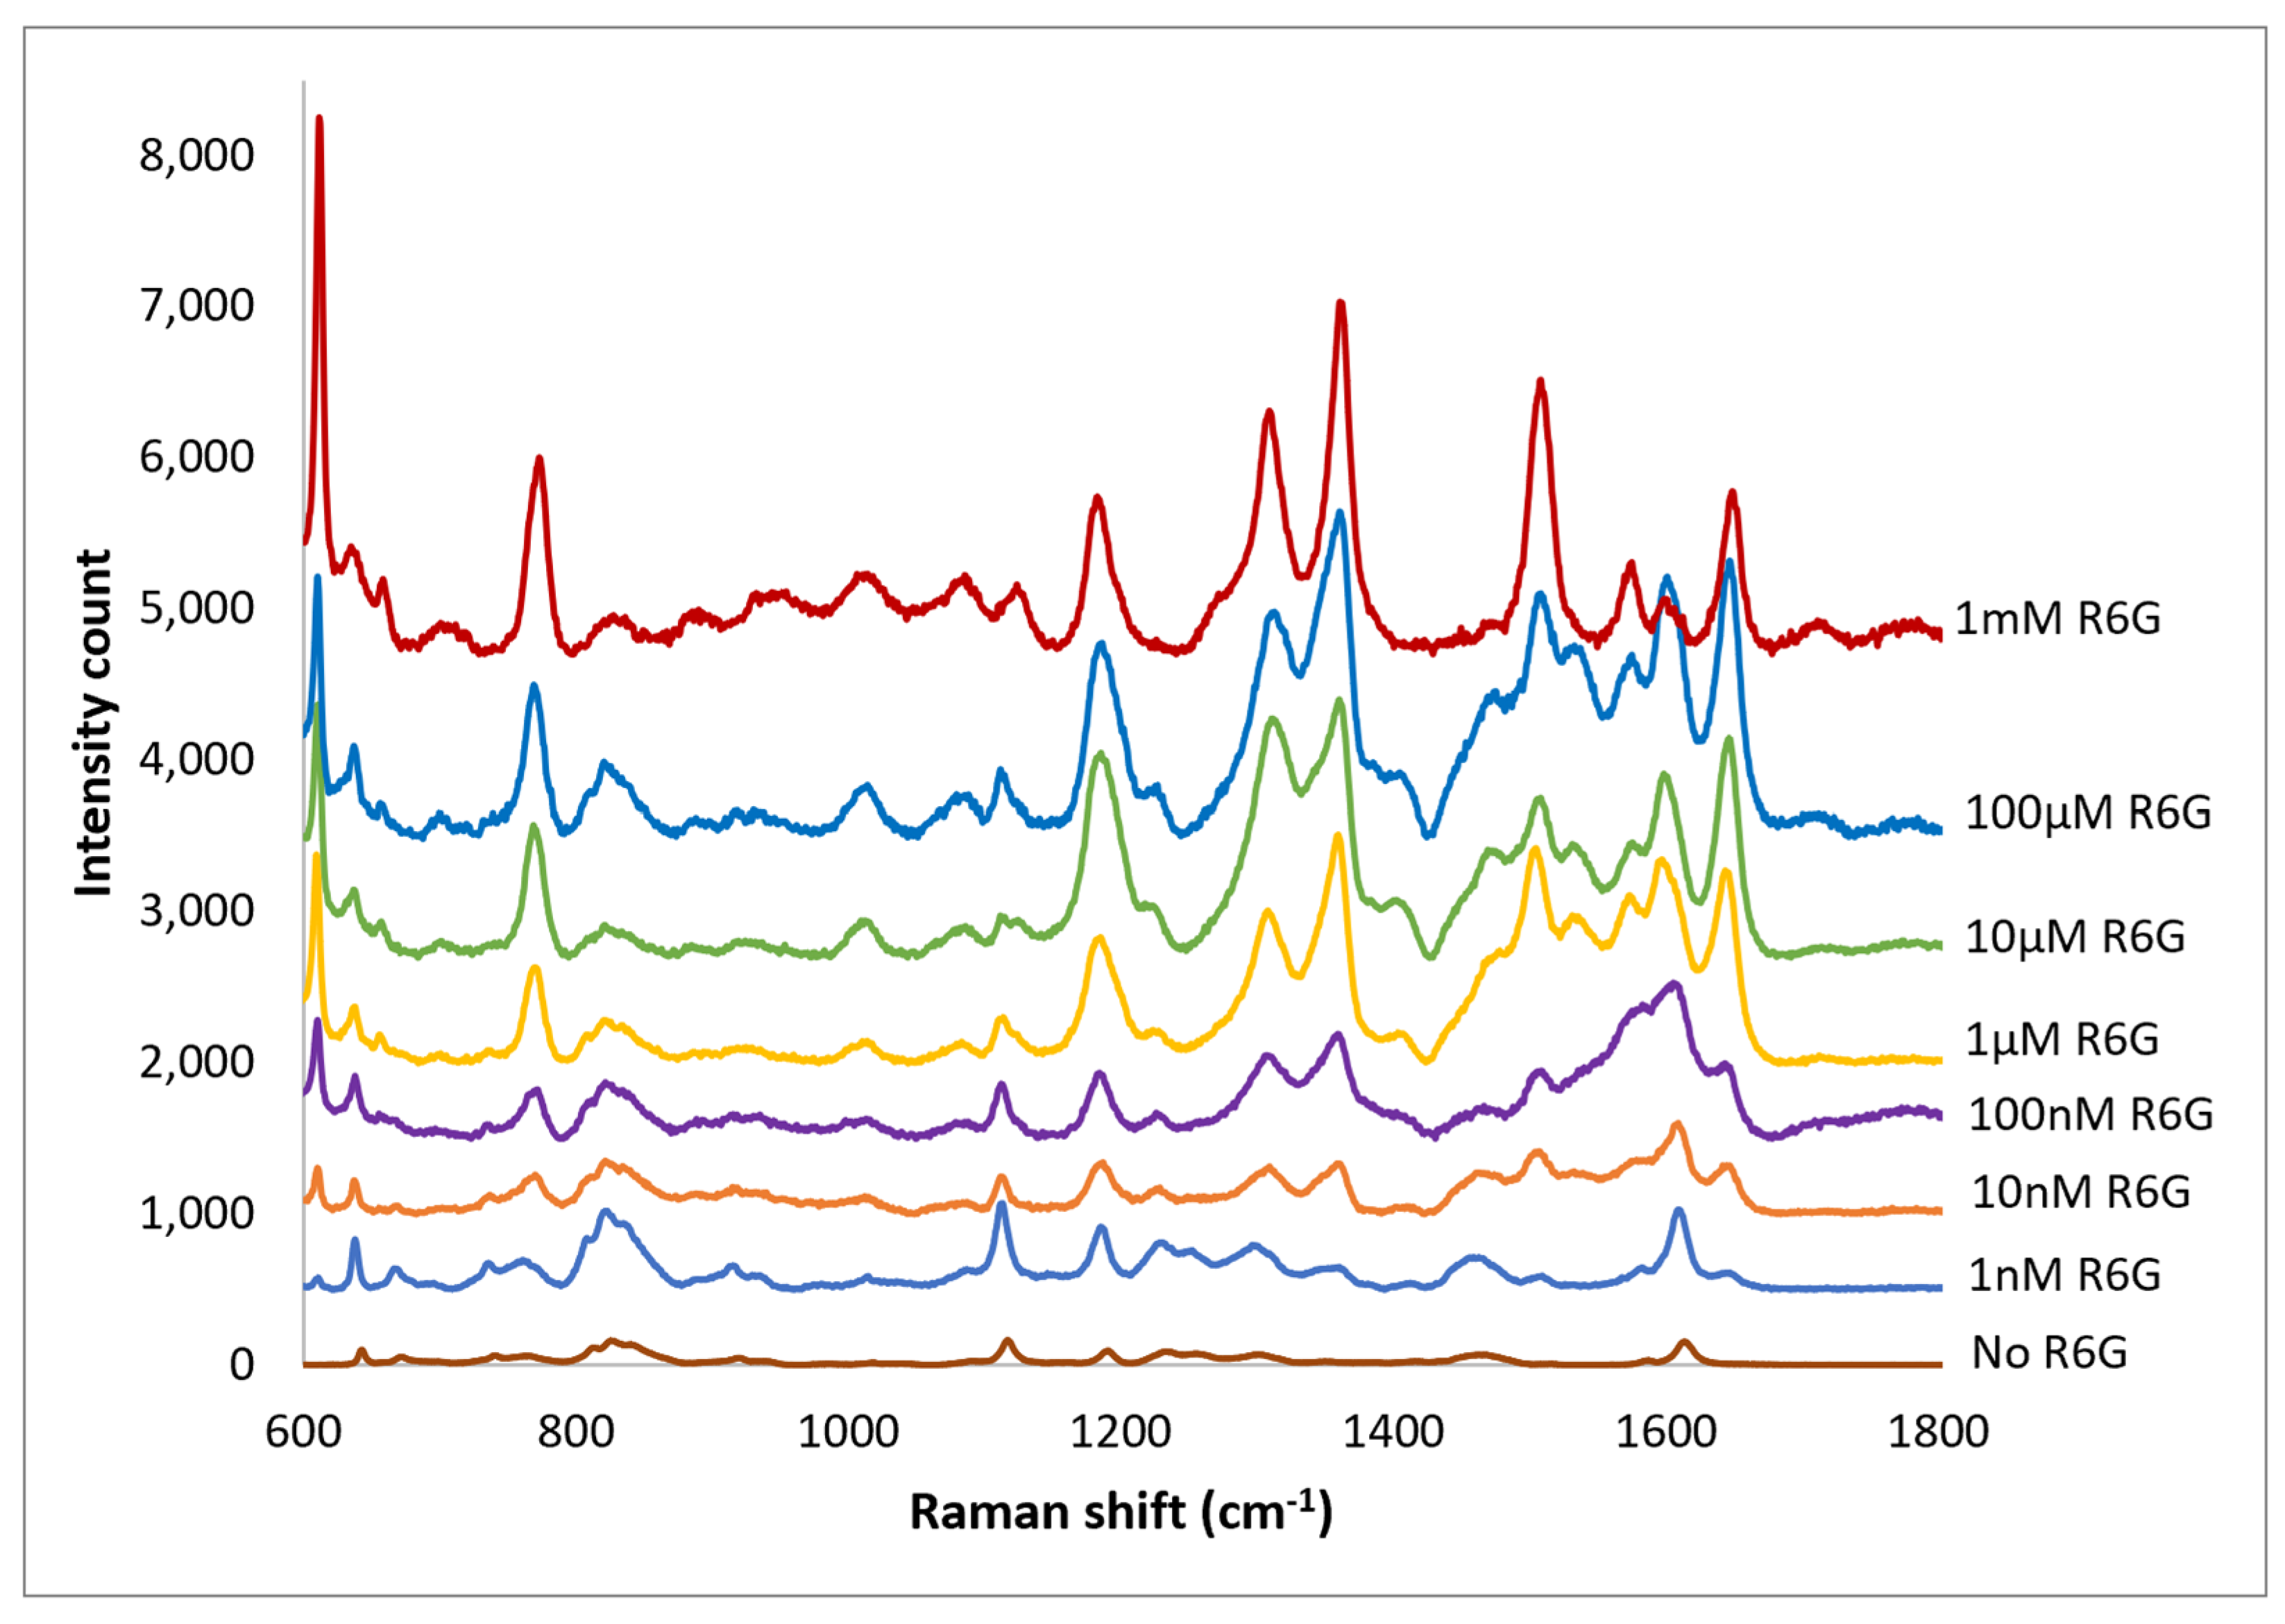
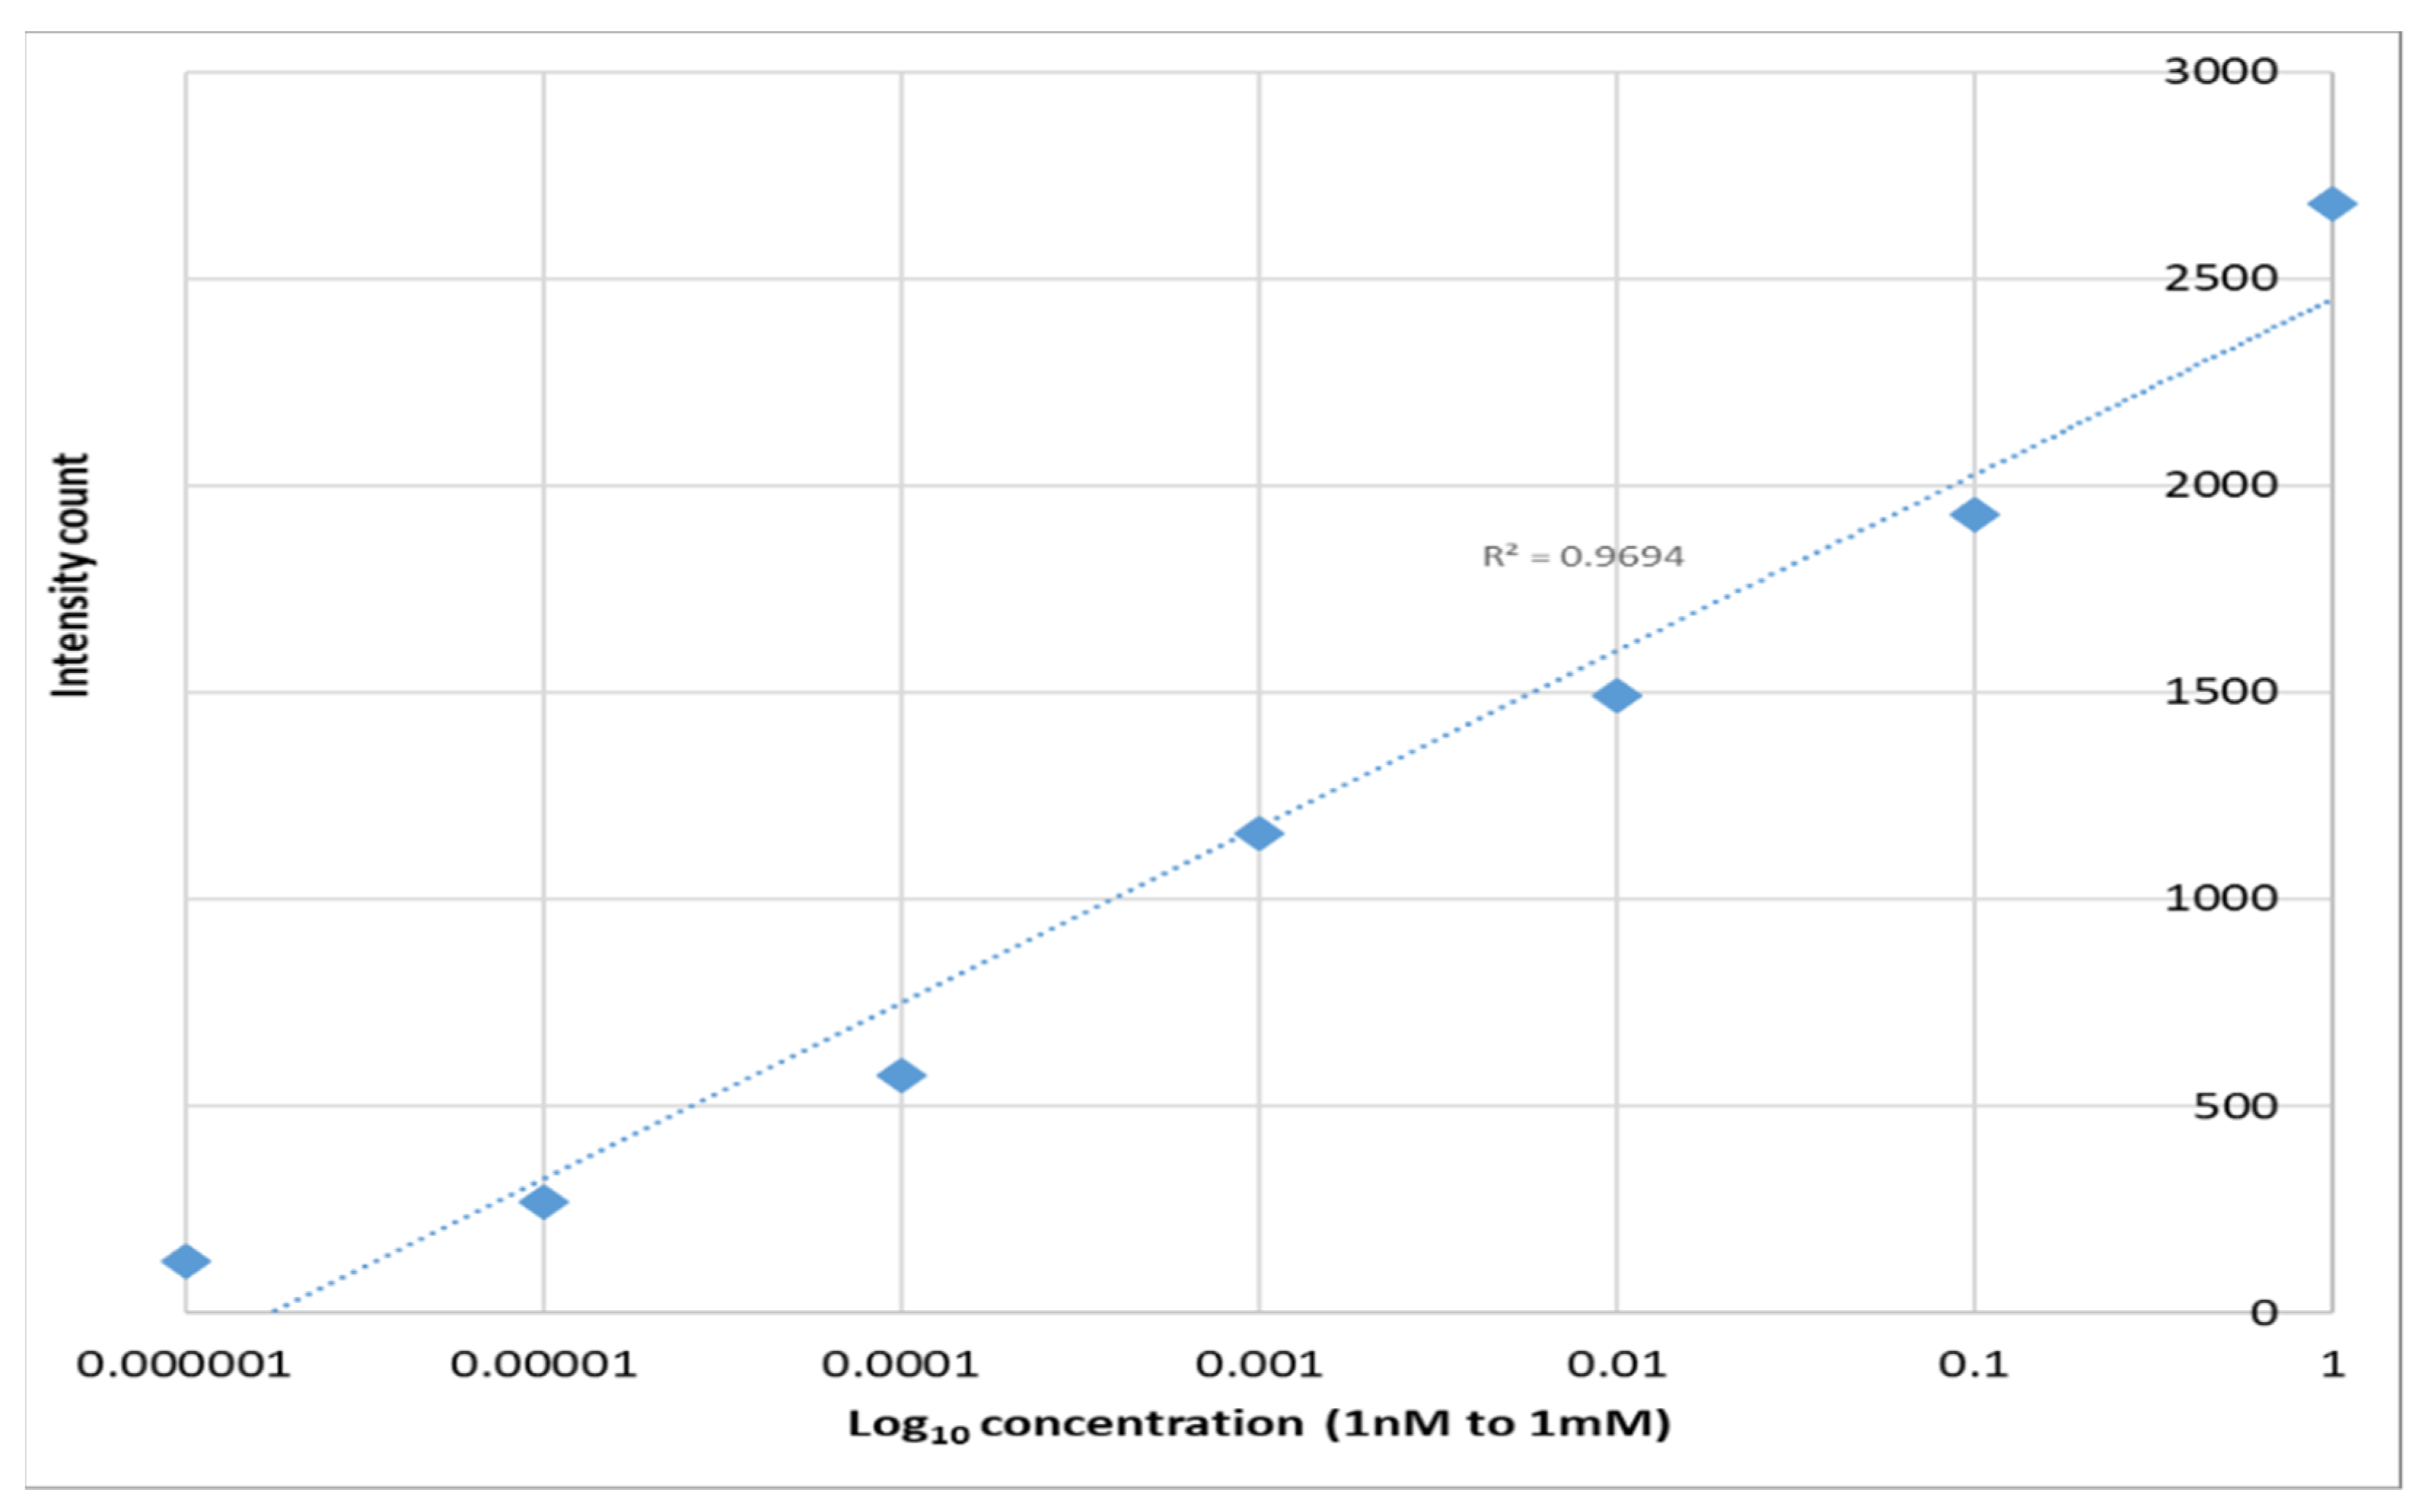
3. Results
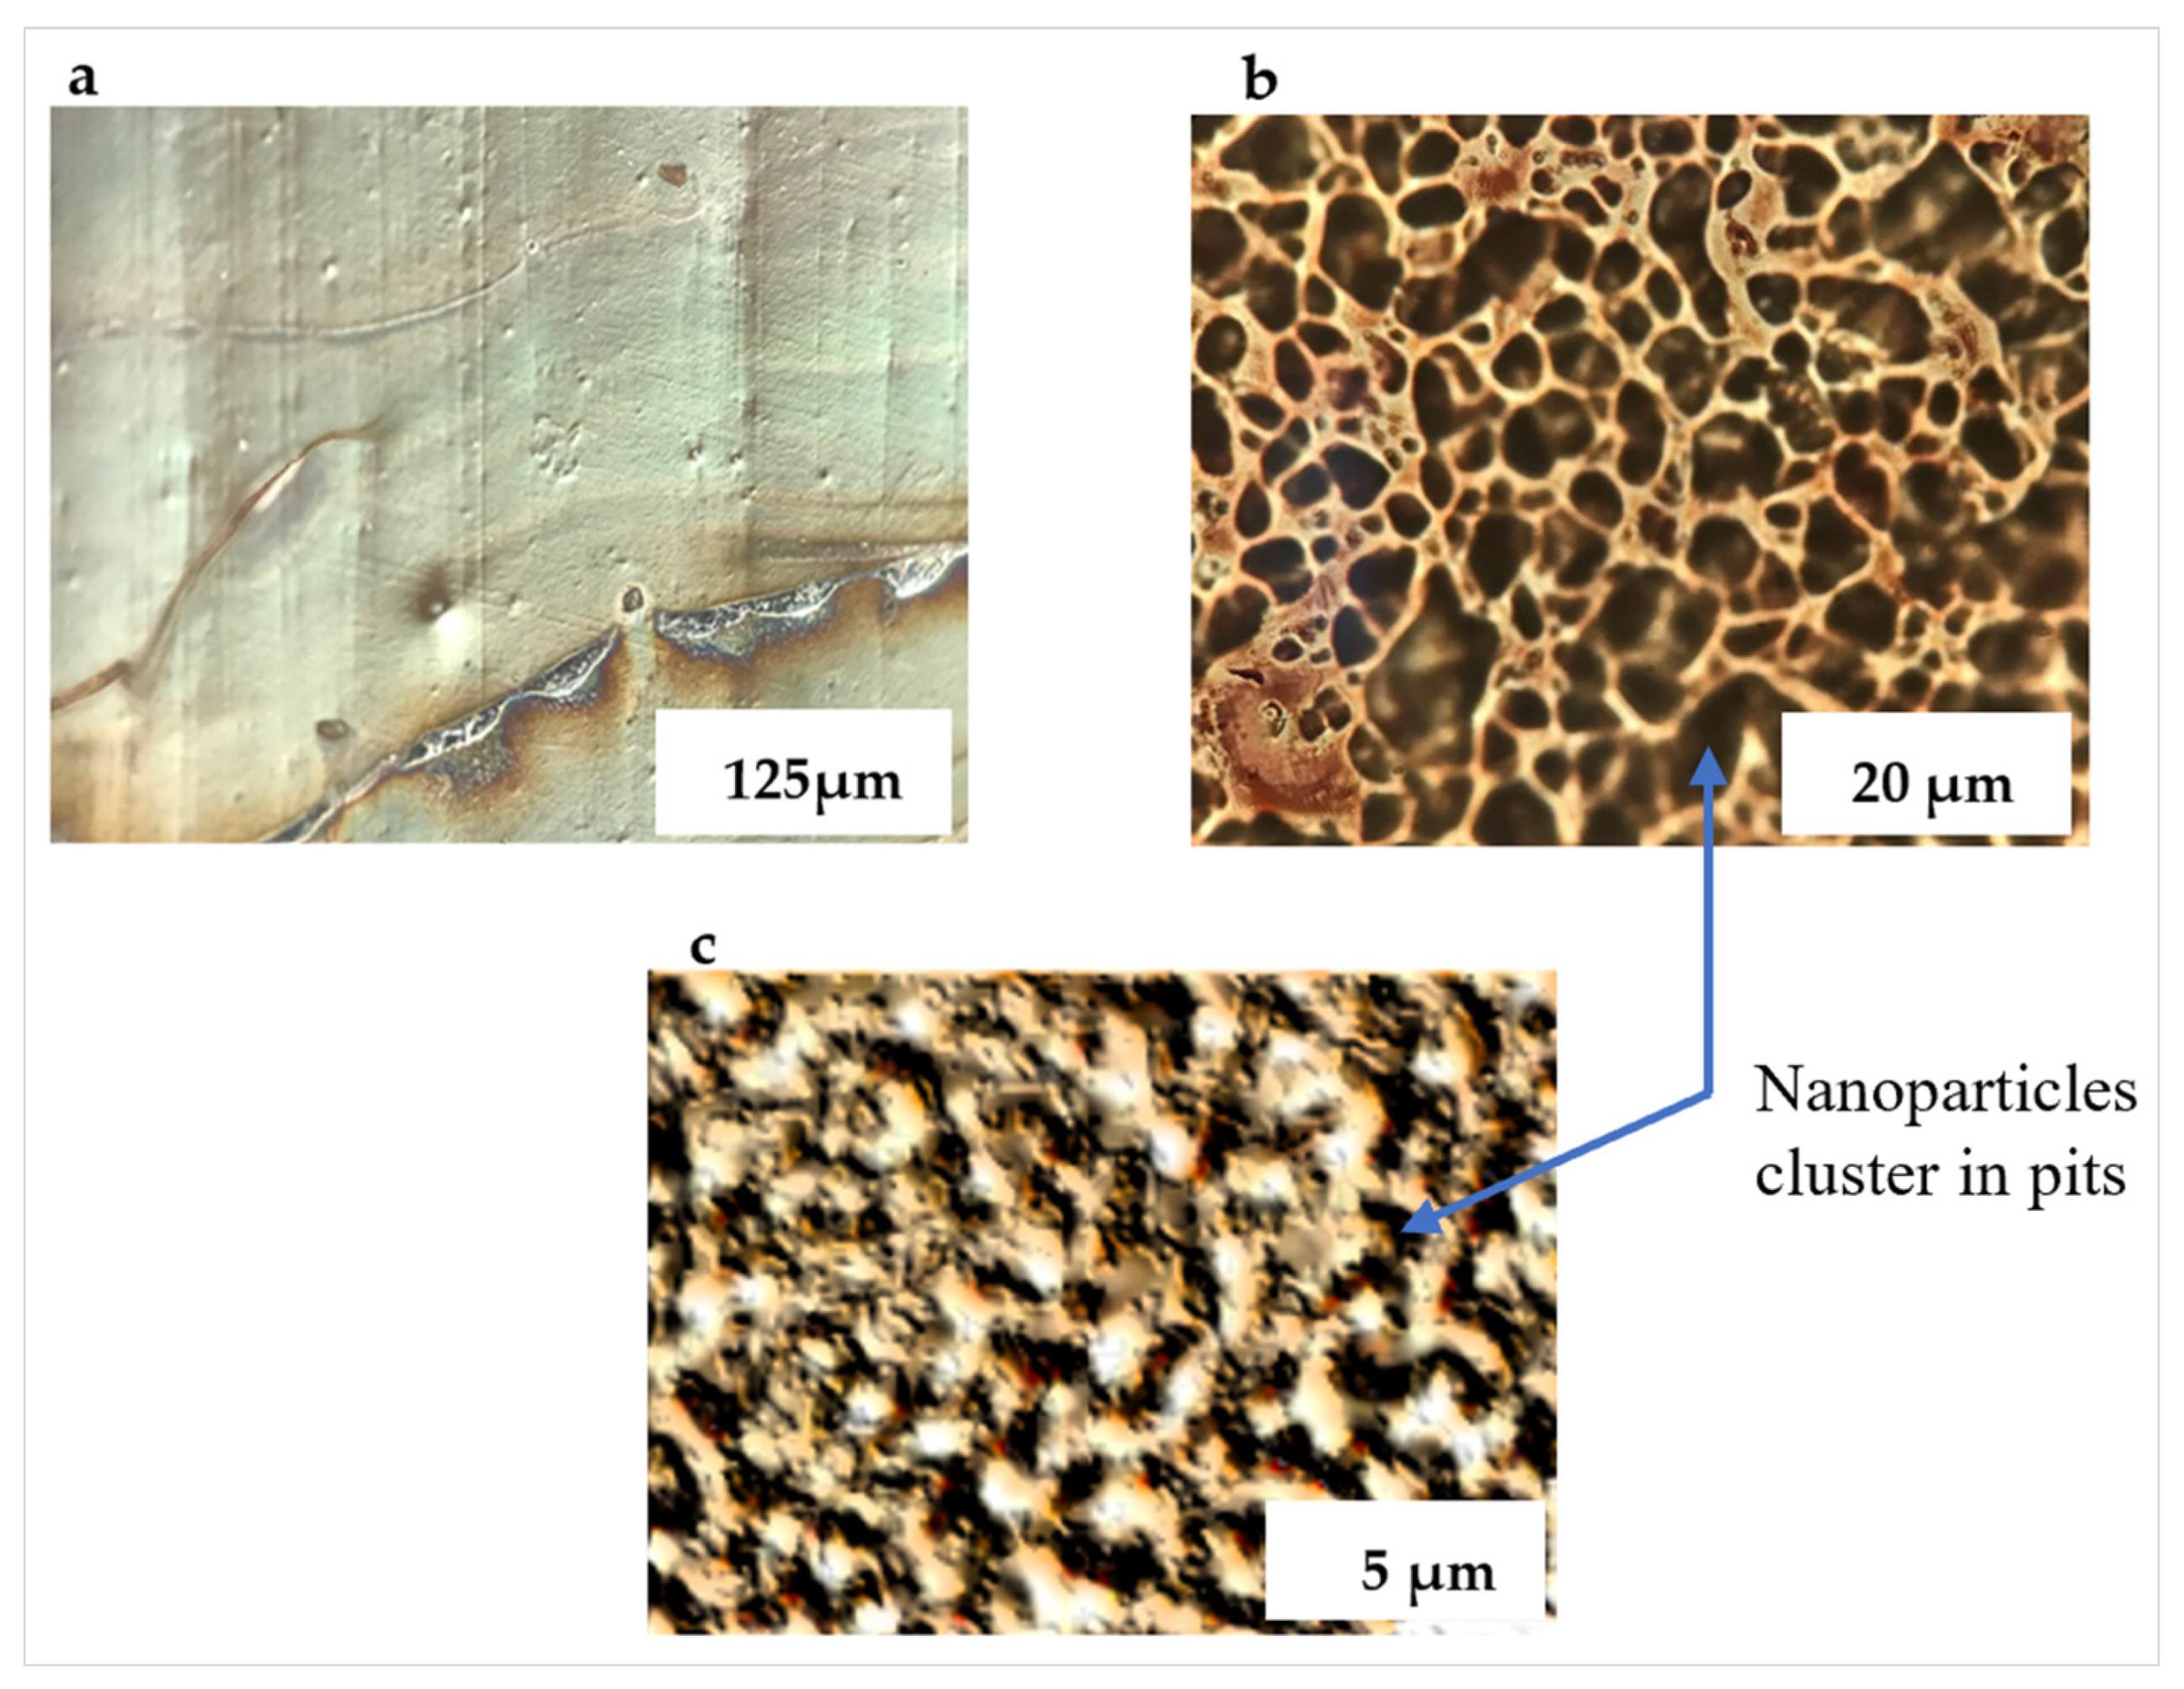
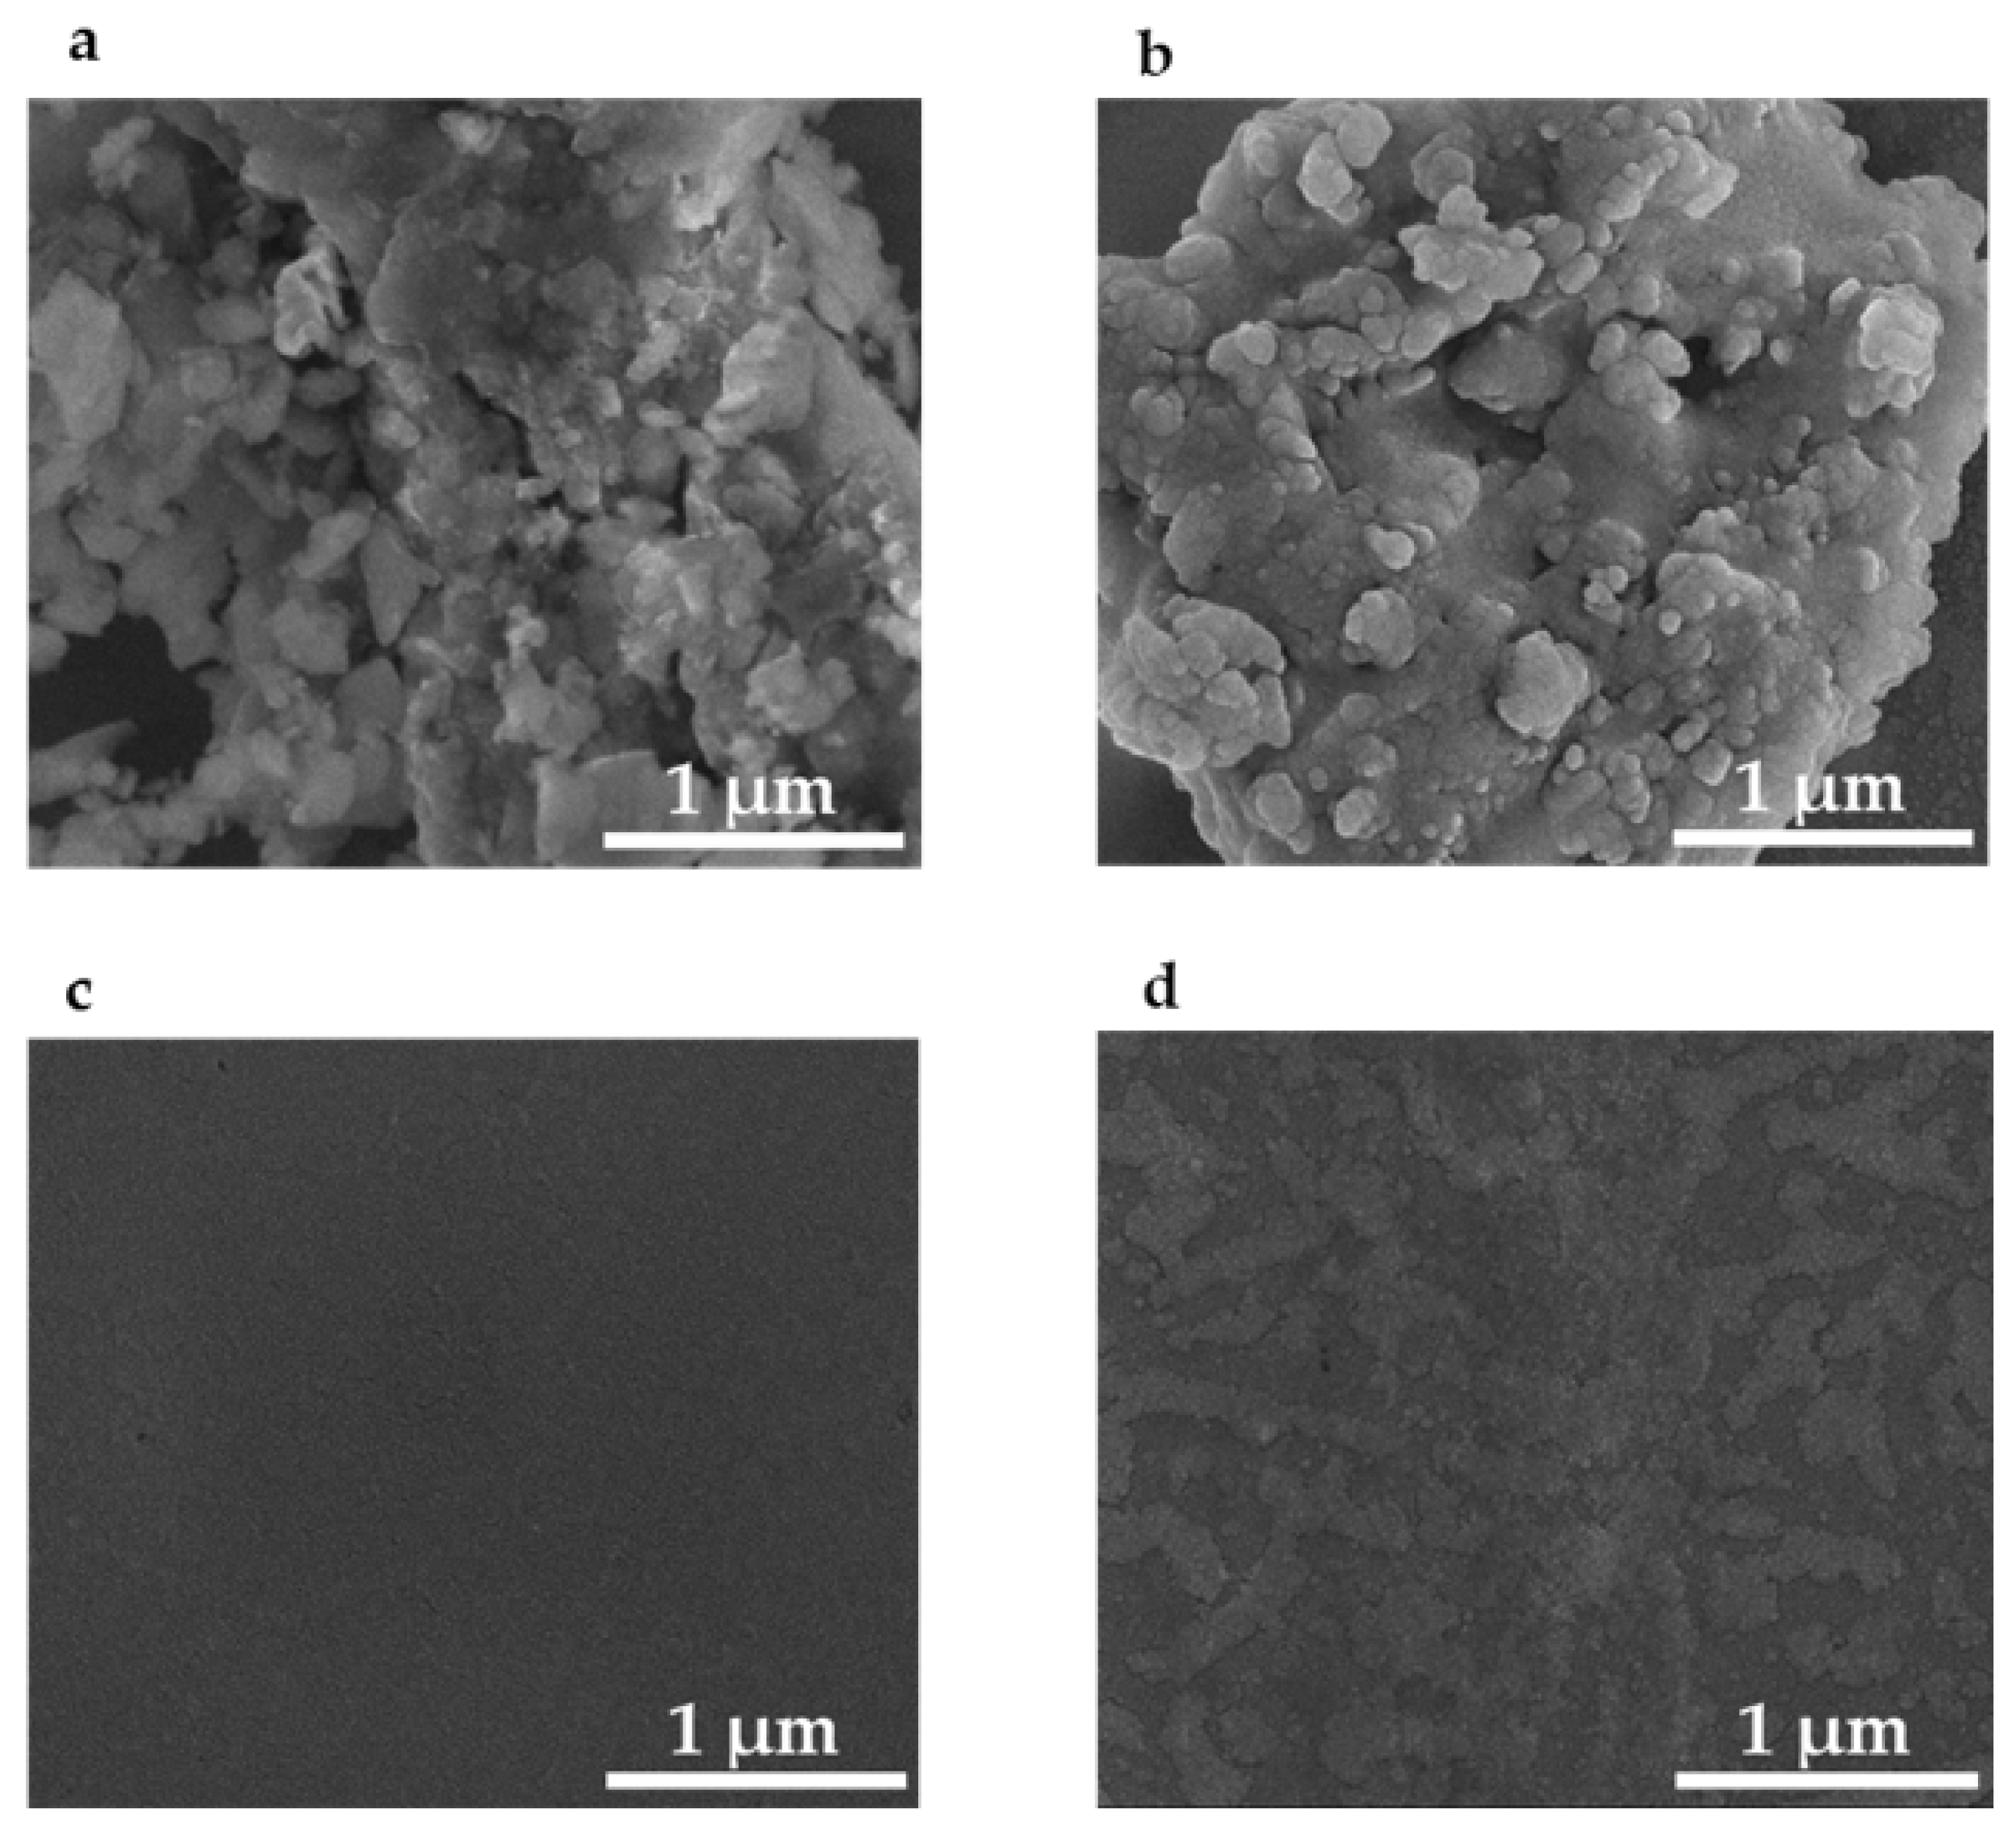
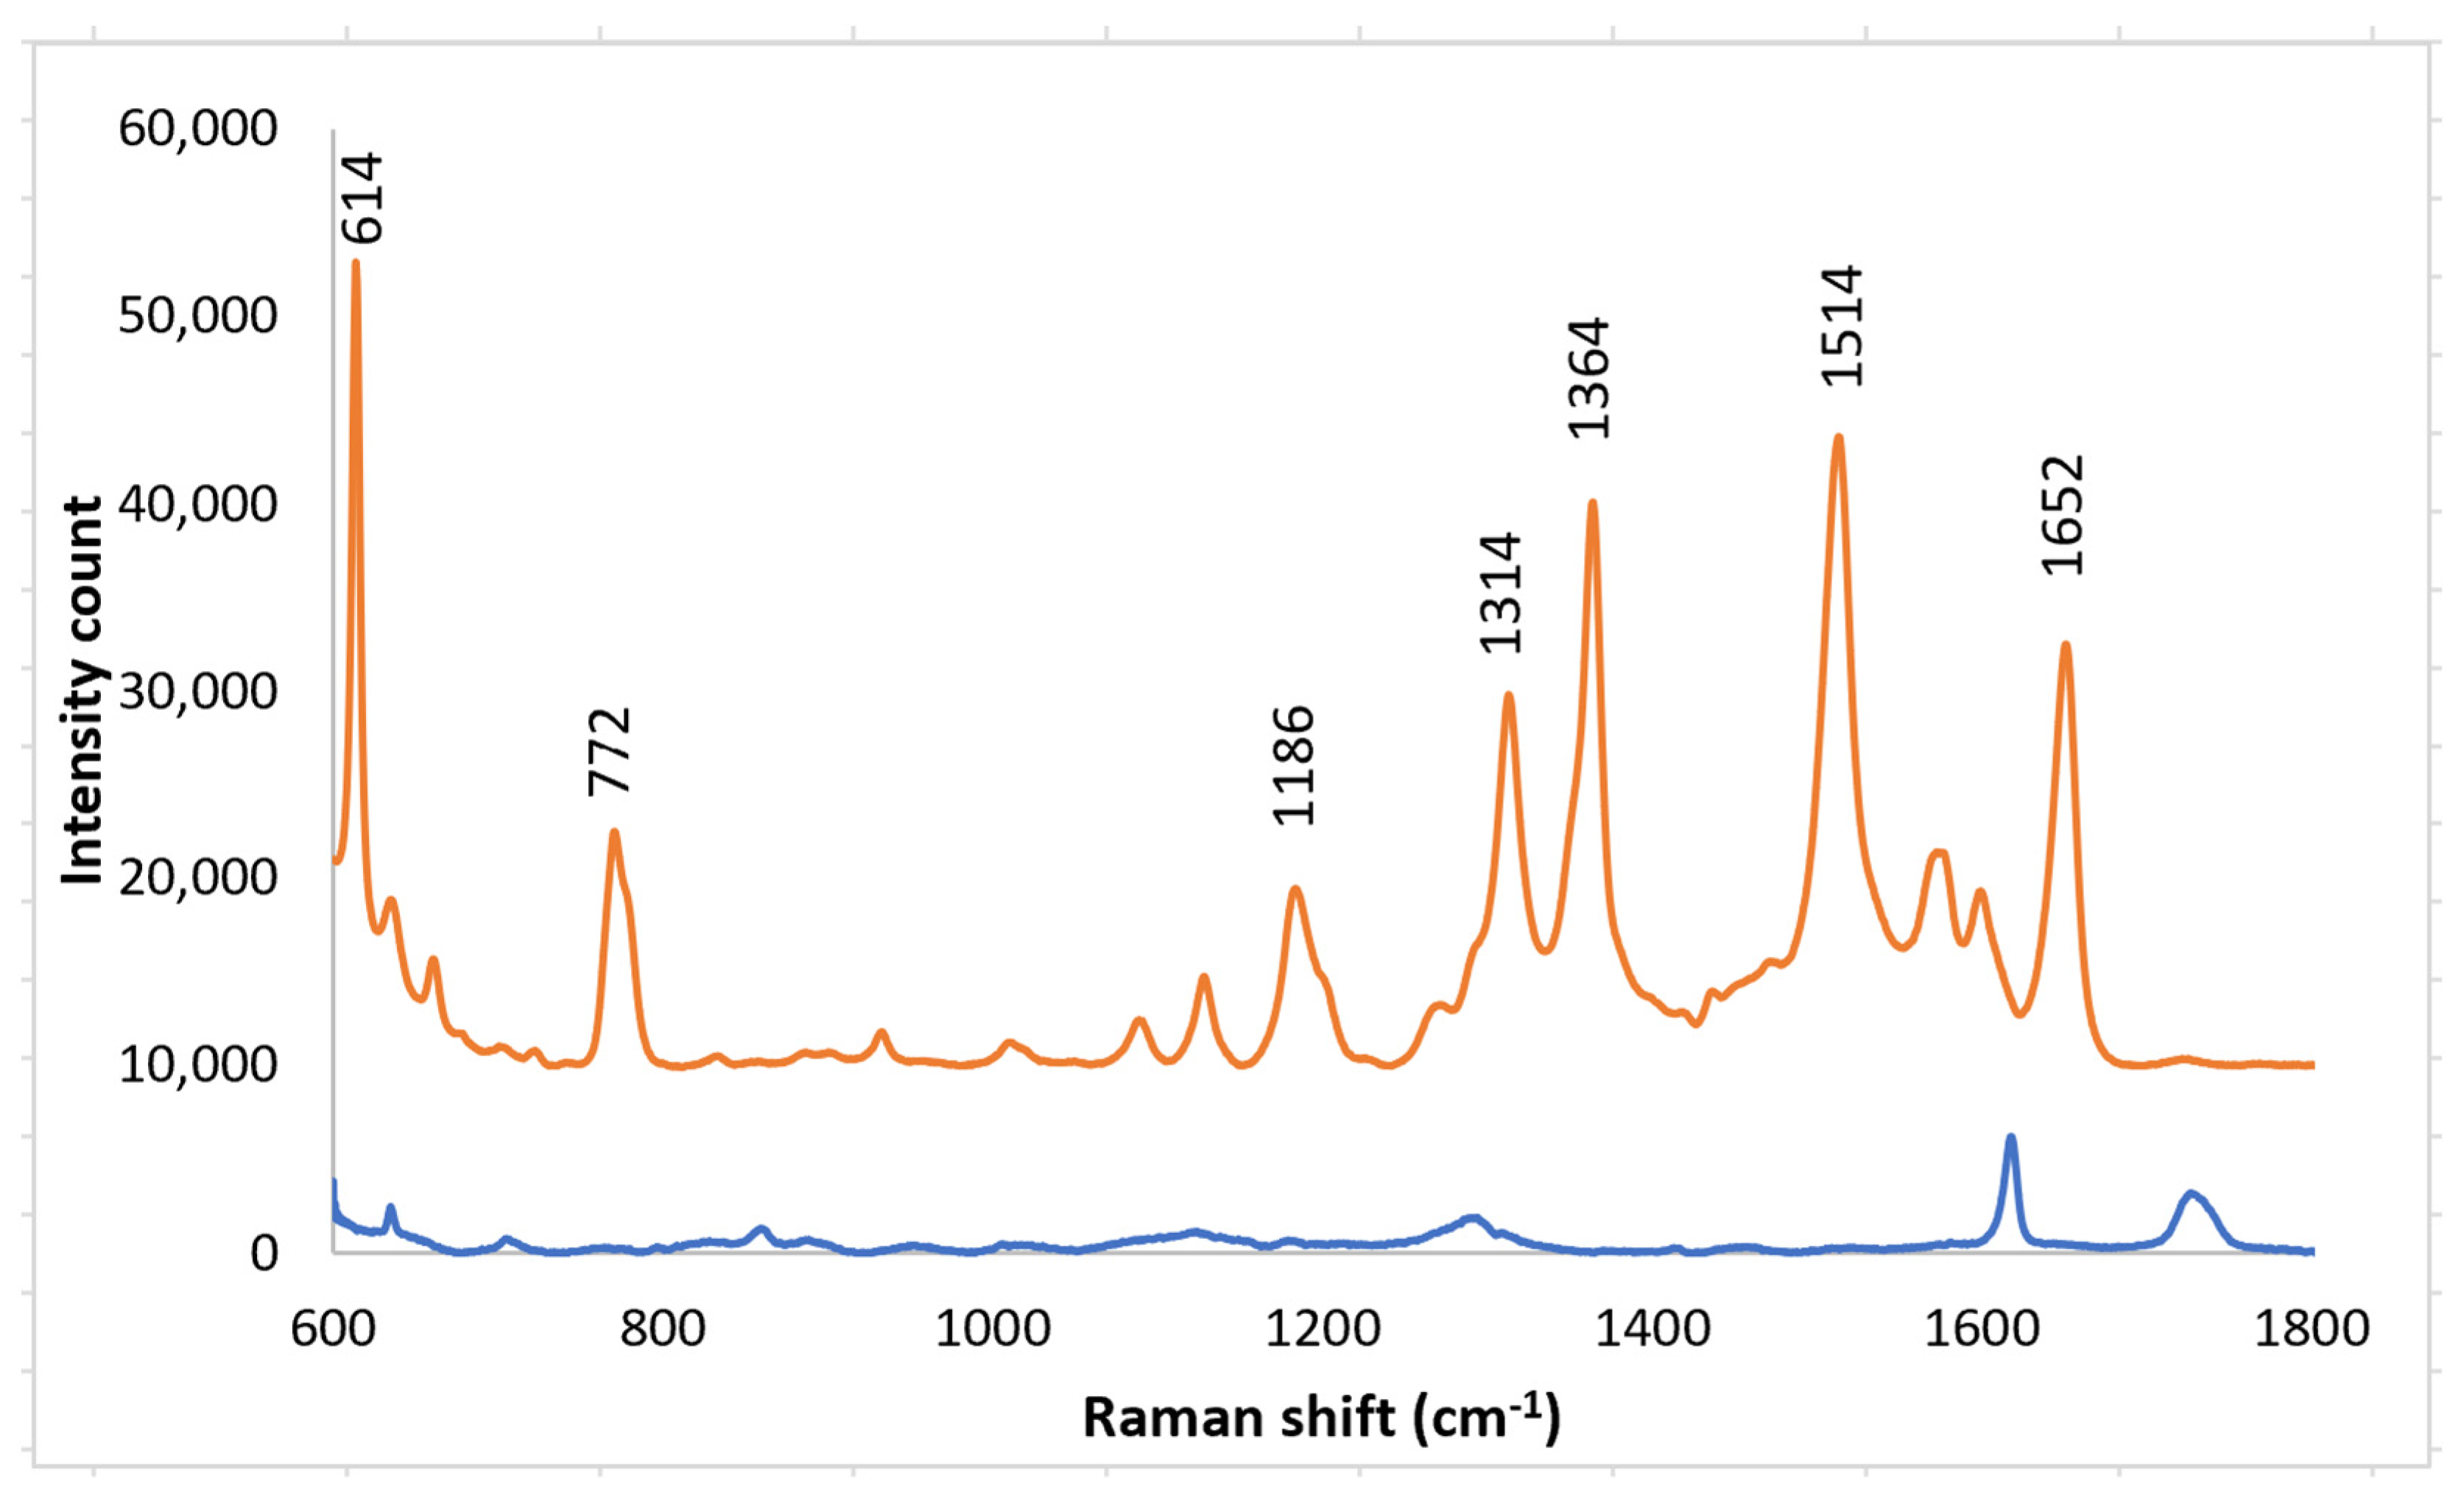
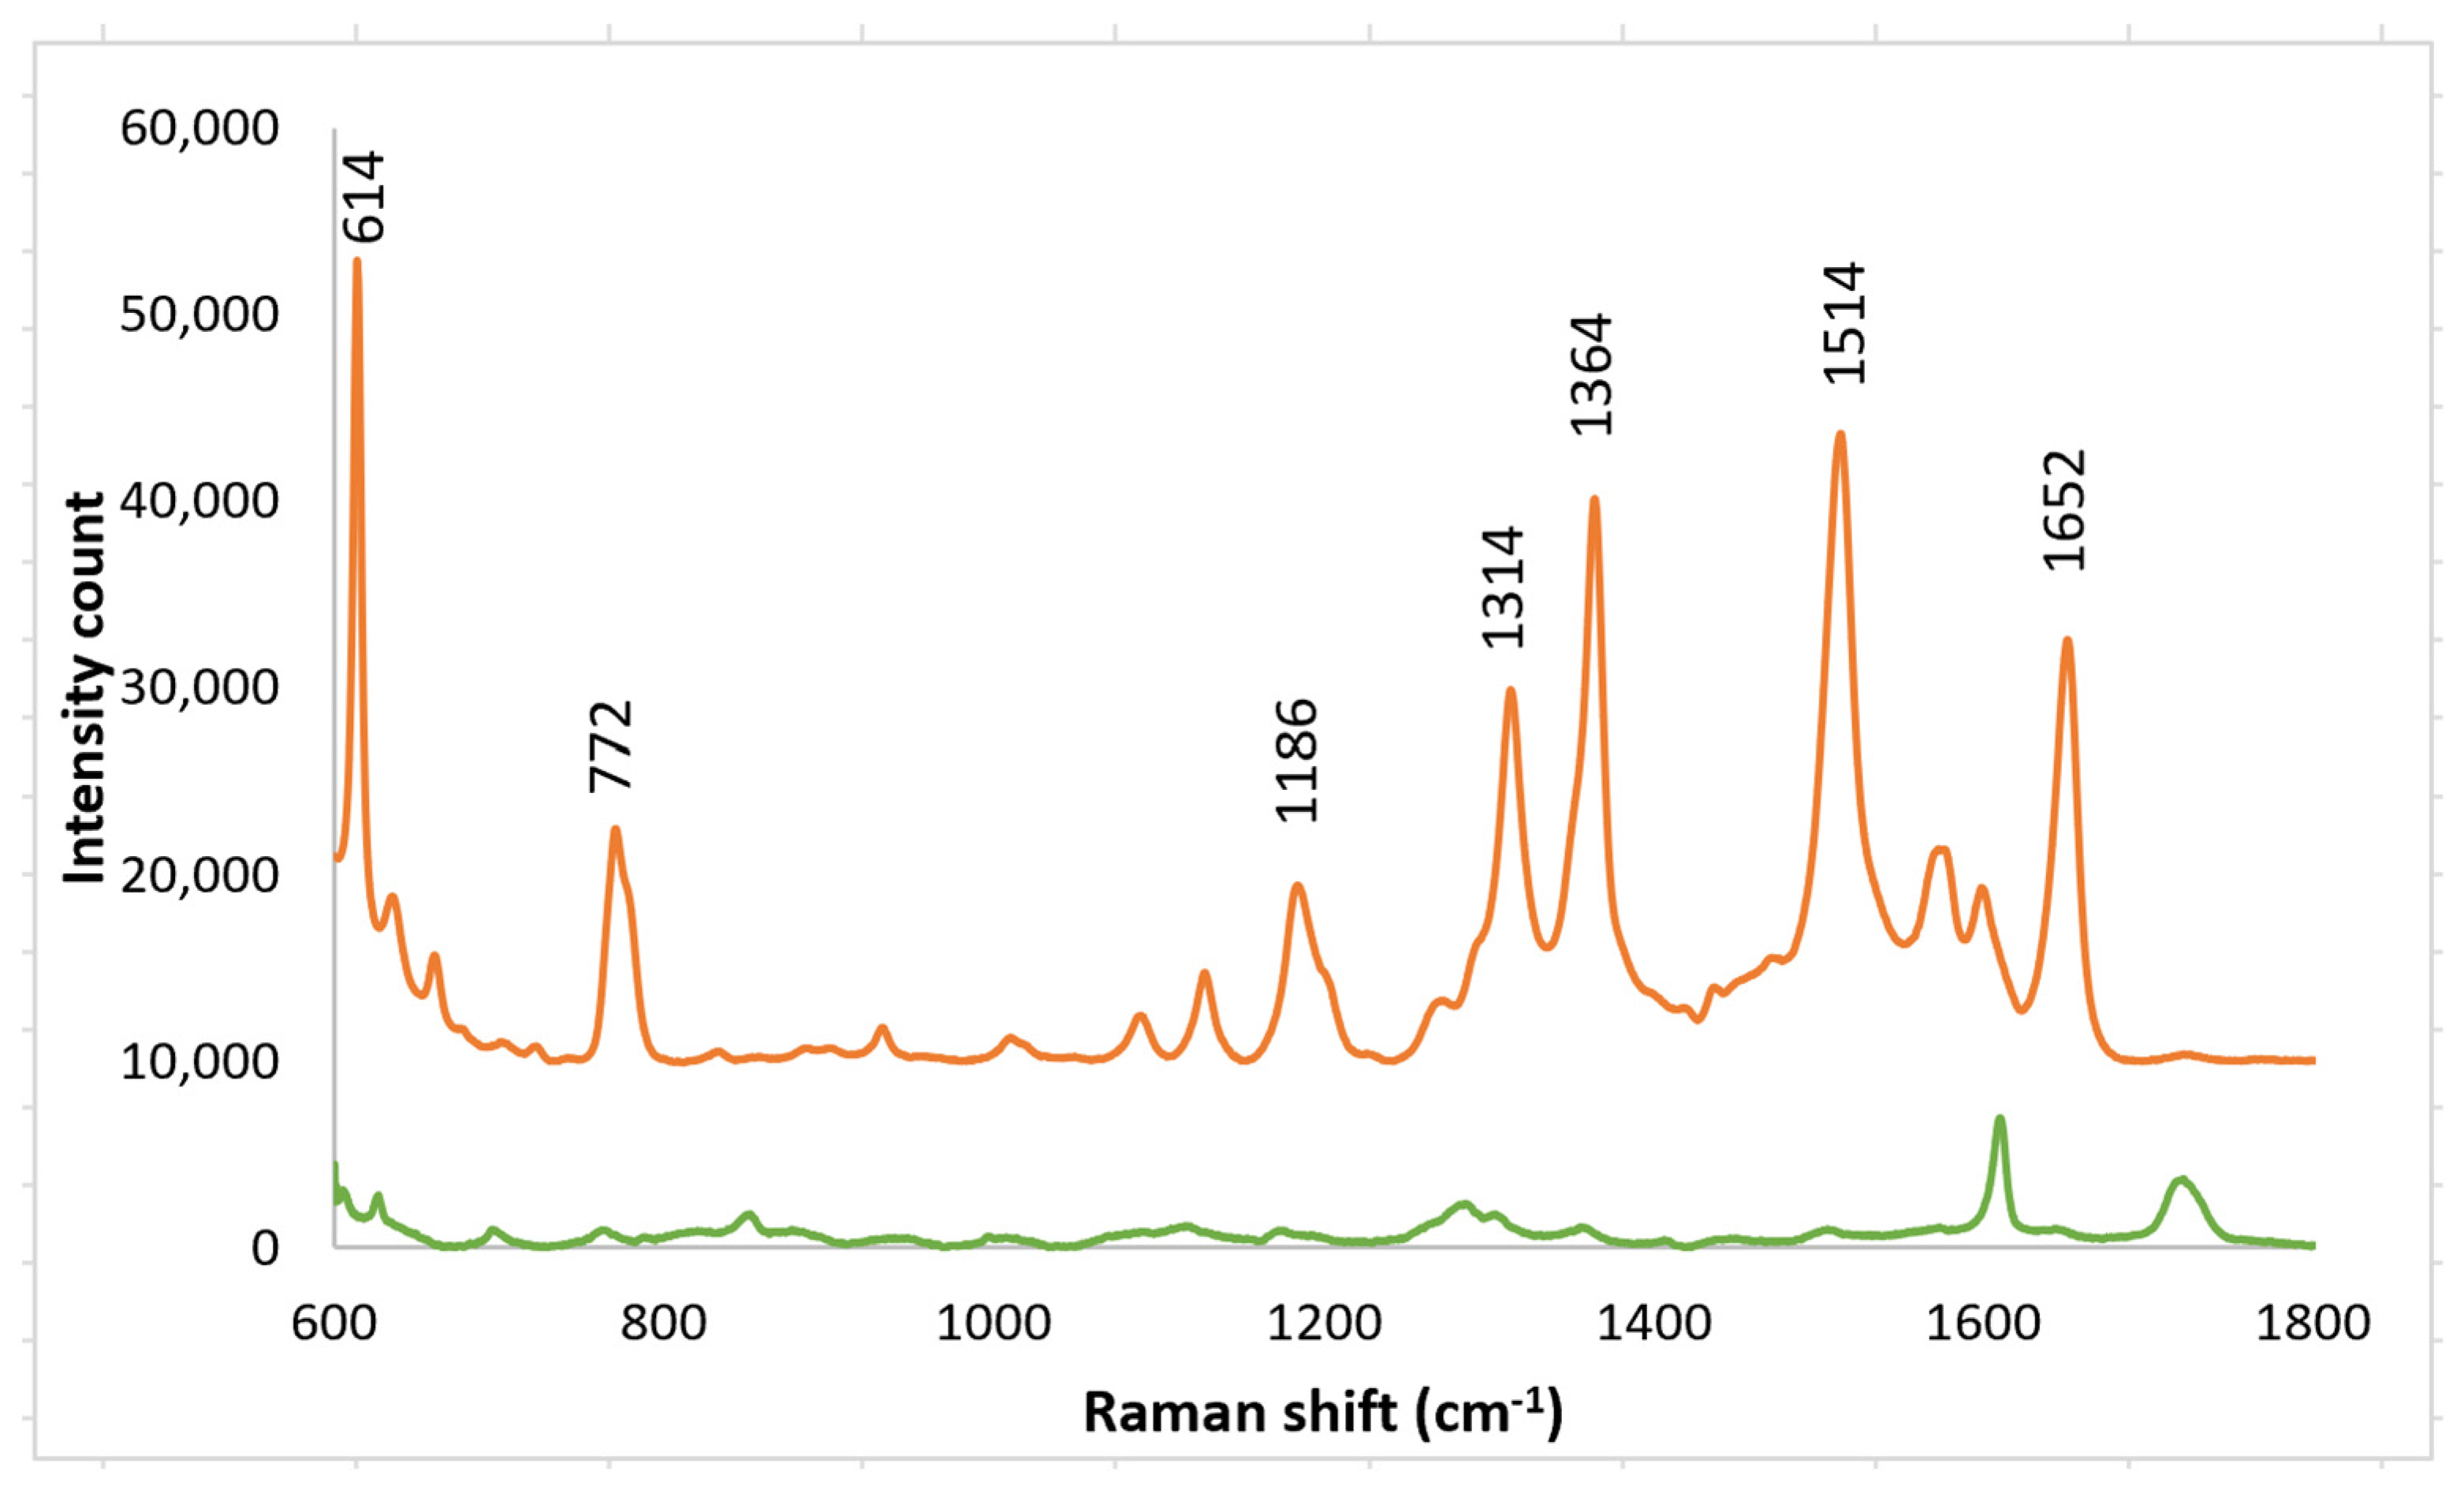
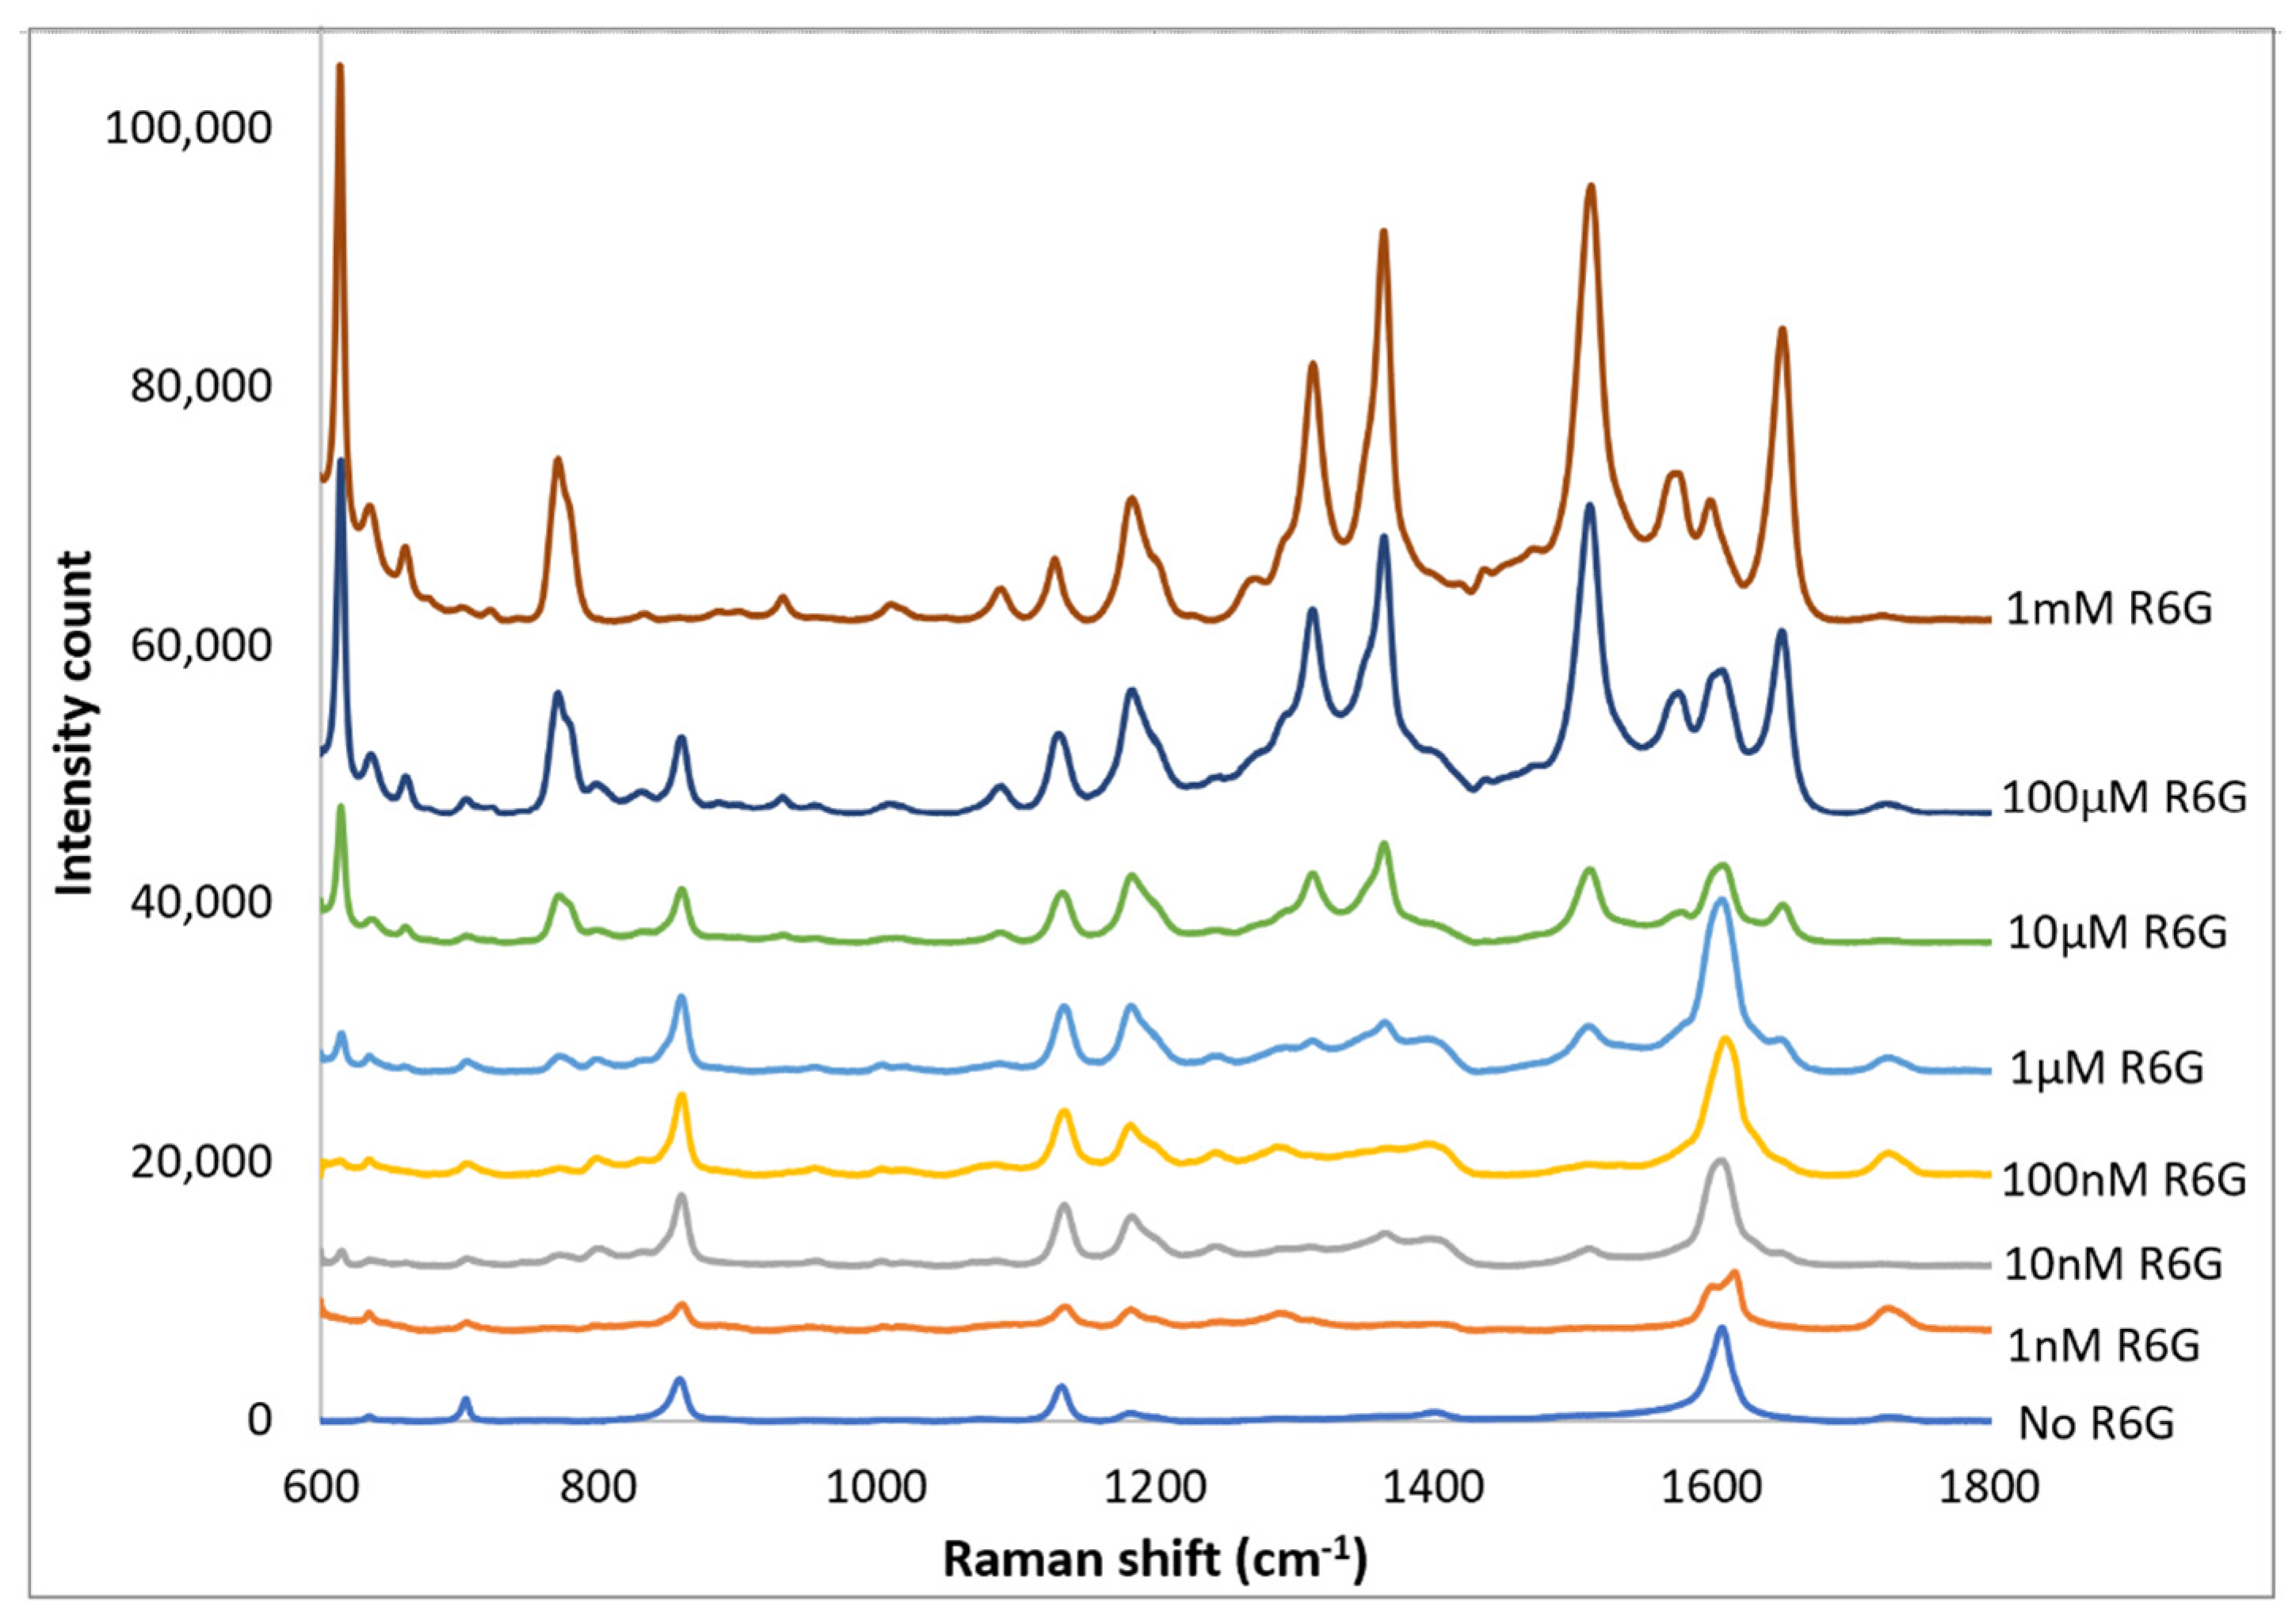
3.1. PETE-1 Substrate
3.2. Epoxy Substrate
4. Discussion
5. Conclusions
Author Contributions
Funding
Institutional Review Board Statement
Informed Consent Statement
Acknowledgments
Conflicts of Interest
References
- Eberhardt, K.; Stiebing, C.; Matthäus, C.; Schmitt, M.; Popp, J. Advantages and limitations of Raman spectroscopy for molecular diagnostics: An update. Expert Rev. Mol. Diagn. 2015, 15, 773–787. [Google Scholar] [CrossRef] [PubMed]
- Vbaková, H. A powerful tool for material identification: Raman spectroscopy. Int. J. Math. Model. Methods Appl. Sci. 2011, 5, 1205–1212. [Google Scholar]
- Kneipp, K.; Kneipp, H.; Itzkan, I.; Dasari, R.R.; Feld, M.S. Ultrasensitive Chemical Analysis by Raman Spectroscopy. Chem. Rev. 1999, 99, 2957–2976. [Google Scholar] [CrossRef] [PubMed]
- Zhao, J.; Zeng, H.; Kalia, S.; Lui, H. Using Raman Spectroscopy to Detect and Diagnose Skin Cancer In Vivo. Dermatol. Clin. 2017, 35, 495–504. [Google Scholar] [CrossRef]
- Taketani, A.; Hariyani, R.; Ishigaki, M.; Andriana, B.B.; Sato, H. Raman endoscopy for the in situ investigation of advancing colorectal tumors in live model mice. Analyst 2013, 138, 4183–4190. [Google Scholar] [CrossRef]
- De Abajo, F.J.G. Colloquium: Light scattering by particle and hole arrays. Rev. Mod. Phys. 2007, 79, 1267–1290. [Google Scholar] [CrossRef] [Green Version]
- Moskovits, M. Surface-enhanced spectroscopy. Rev. Mod. Phys. 1985, 57, 783–826. [Google Scholar] [CrossRef]
- Murphy, C.J.; Gole, A.M.; Stone, J.W.; Sisco, P.N.; Alkilany, A.M.; Goldsmith, E.C.; Baxter, S.C. Gold Nanoparticles in Biology: Beyond Toxicity to Cellular Imaging. Acc. Chem. Res. 2008, 41, 1721–1730. [Google Scholar] [CrossRef]
- Sharma, B.; Cardinal, M.F.; Kleinman, S.L.; Greeneltch, N.G.; Frontiera, R.R.; Blaber, M.G.; Schatz, G.C.; Van Duyne, R.P. High-performance SERS substrates: Advances and challenges. MRS Bull. 2013, 38, 615–624. [Google Scholar] [CrossRef] [Green Version]
- Plaickner, J.; Speiser, E.; Chandola, S.; Esser, N.; Singh, D.K. Adsorption of toluene-3,4-dithiol on silver islands investigated by surface-enhanced Raman spectroscopy. J. Raman Spectrosc. 2020, 51, 788–794. [Google Scholar] [CrossRef]
- Kaushik, V.; Kagdada, H.L.; Singh, D.K.; Pathak, S. Enhancement of SERS effect in Graphene-Silver hybrids. Appl. Surf. Sci. 2022, 574, 151724. [Google Scholar] [CrossRef]
- Singh, D.; Ganbold, E.-O.; Cho, E.-M.; Cho, K.-H.; Kim, D.; Choo, J.; Kim, S.; Lee, C.M.; Yang, S.I.; Joo, S.-W. Detection of the mycotoxin citrinin using silver substrates and Raman spectroscopy. J. Hazard. Mater. 2014, 265, 89–95. [Google Scholar] [CrossRef] [PubMed]
- Stiles, P.L.; Dieringer, J.A.; Shah, N.C.; Van Duyne, R.P. Surface-enhanced Raman spectroscopy. Annu. Rev. Anal. Chem. 2008, 1, 601–626. [Google Scholar] [CrossRef] [PubMed] [Green Version]
- Wei, H.; Xu, H. Hot spots in different metal nanostructures for plasmon-enhanced Raman spectroscopy. Nanoscale 2013, 5, 10794–10805. [Google Scholar] [CrossRef]
- Zhang, Y.-J.; Chen, S.; Radjenovic, P.; Bodappa, N.; Zhang, H.; Yang, Z.-L.; Tian, Z.-Q.; Li, J.-F. Probing the Location of 3D Hot Spots in Gold Nanoparticle Films Using Surface-Enhanced Raman Spectroscopy. Anal. Chem. 2019, 91, 5316–5322. [Google Scholar] [CrossRef]
- Snitka, V.; Batiuskaite, D.; Bruzaite, I.; Lafont, U.; Butenko, Y.; Semprimoschnig, C. Surface-enhanced Raman scattering sensors for biomedical and molecular detection applications in space. CEAS Space J. 2021, 13, 509–520. [Google Scholar] [CrossRef]
- Pan, J.; Shao, X.; Zhu, Y.; Dong, B.; Wang, Y.; Kang, X.; Chen, N.; Chen, Z.; Liu, S.; Xue, W. Surface-enhanced Raman spectroscopy before radical prostatectomy predicts biochemical recurrence better than CAPRA-S. Int. J. Nanomed. 2019, 14, 431–440. [Google Scholar] [CrossRef] [Green Version]
- Motz, J.T.; Hunter, M.; Galindo, L.H.; Gardecki, J.A.; Kramer, J.R.; Dasari, R.R.; Feld, M.S. Optical Fiber Probe for Biomedical Raman Spectroscopy. Appl. Opt. 2004, 43, 542–554. [Google Scholar] [CrossRef]
- Shi, C.; Zhang, Y.; Gu, C.; Chen, B.; Seballos, L.; Olson, T.; Zhang, J.Z. Molecular Fiber Sensors Based on Surface Enhanced Raman Scattering (SERS). J. Nanosci. Nanotechnol. 2009, 9, 2234–2246. [Google Scholar] [CrossRef]
- Dhakal, S.; Chao, K.; Huang, Q.; Kim, M.; Schmidt, W.; Qin, J.; Broadhurst, C.L. A Simple Surface-Enhanced Raman Spectroscopic Method for on-Site Screening of Tetracycline Residue in Whole Milk. Sensors 2018, 18, 424. [Google Scholar] [CrossRef] [Green Version]
- Zavaleta, C.L.; Smith, B.R.; Walton, I.; Doering, W.; Davis, G.; Shojaei, B.; Natan, M.J.; Gambhir, S.S. Multiplexed imaging of surface enhanced Raman scattering nanotags in living mice using noninvasive Raman spectroscopy. Proc. Natl. Acad. Sci. USA 2009, 106, 13511–13516. [Google Scholar] [CrossRef] [PubMed] [Green Version]
- Peng, F.; Setyawati, M.I.; Tee, J.K.; Ding, X.; Wang, J.; Nga, M.E.; Ho, H.K.; Leong, D.T. Nanoparticles promote in vivo breast cancer cell intravasation and extravasation by inducing endothelial leakiness. Nat. Nanotechnol. 2019, 14, 279–286. [Google Scholar] [CrossRef] [PubMed]
- Basu, S.; Hou, H.; Biswas, D.; Lopez, M.; Feldman, M.; Daniels-Race, T.; Mathis, J.M. Single fiber surface enhanced Raman scattering probe. J. Vac. Sci. Technol. B Nanotechnol. Microelectron. Mater. Process. Meas. Phenom. 2017, 35, 06GF01. [Google Scholar] [CrossRef]
- Abu Hatab, N.A.; Oran, J.M.; Sepaniak, M.J. Surface-Enhanced Raman Spectroscopy Substrates Created via Electron Beam Lithography and Nanotransfer Printing. ACS Nano 2008, 2, 377–385. [Google Scholar] [CrossRef] [PubMed]
- Langer, J.; de Aberasturi, D.J.; Aizpurua, J.; Alvarez-Puebla, R.A.; Auguié, B.; Baumberg, J.J.; Bazan, G.C.; Bell, S.E.J.; Boisen, A.; Brolo, , A.G.; et al. Present and Future of Surface-Enhanced Raman Scattering. ACS Nano 2020, 14, 28–117. [Google Scholar] [CrossRef] [Green Version]
- Boca, C.S.; Farcau, C.; Astilean, S. The study of Raman enhancement efficiency as function of nanoparticle size and shape. Nucl. Instrum. Methods Phys. Res. Sect. B Beam Interact. Mater. Atoms. 2009, 267, 406–410. [Google Scholar] [CrossRef]
- Hong, S.; Li, X. Optimal Size of Gold Nanoparticles for Surface-Enhanced Raman Spectroscopy under Different Conditions. J. Nanomater. 2013, 2013, 40. [Google Scholar] [CrossRef]
- Seney, C.S.; Gutzman, B.M.; Goddard, R.H. Correlation of Size and Surface-Enhanced Raman Scattering Activity of Optical and Spectroscopic Properties for Silver Nanoparticles. J. Phys. Chem. C 2008, 113, 74–80. [Google Scholar] [CrossRef]
- Stamplecoskie, K.G.; Scaiano, J.C.; Tiwari, V.S.; Anis, H. Optimal Size of Silver Nanoparticles for Surface-Enhanced Raman Spectroscopy. J. Phys. Chem. C 2011, 115, 1403–1409. [Google Scholar] [CrossRef]
- Metallic Ink, UTDAg10H, UTDots. Available online: https://utdots.com/products (accessed on 21 October 2021).
- Polyethylene Terephthalate, Widely Available for Transparent Containers and Embossed with the PETE-1 Logo. Available online: https://en.wikipedia.org/wiki/Polyethylene_terephthalate (accessed on 3 April 2022).
- M-3 Imperial IV Ultra Clean 100 Microprocessor Oven, Lab-Line Instruments, Inc.: Merlrose Park, IL, USA.
- Silly Putty. Available online: https://shop.crayola.com/brands/silly-putty (accessed on 21 October 2021).
- HFT Epoxy-Quick Setting, Harbor Freight Tools. USA. Available online: https://www.harborfreight.com/quick-setting-epoxy-68386.html (accessed on 21 October 2021).
- Philibert, B.; Feldman, M. Use of cell phone type cameras to enhance focusing and magnification in optical microscopes. Rev. Sci. Instrum. 2019, 90, 046102. [Google Scholar] [CrossRef]
- Basu, S.; Maulik, S.; Hou, H.-C.; Daniels-Race, T.; Feldman, M. Surface enhanced Raman spectroscopic substrate utilizing gold nanoparticles on carbon nanotubes. J. Appl. Phys. 2017, 122, 175107. [Google Scholar] [CrossRef]
- Hildebrandt, P.; Stockburger, M. Surface-enhanced resonance Raman spectroscopy of Rhodamine 6G adsorbed on colloidal silver. J. Phys. Chem. 1984, 88, 5935–5944. [Google Scholar] [CrossRef]
- Lu, Y.; Liu, G.L.; Lee, L.P. High-Density Silver Nanoparticle Film with Temperature-Controllable Interparticle Spacing for a Tunable Surface Enhanced Raman Scattering Substrate. Nano Lett. 2004, 5, 5–9. [Google Scholar] [CrossRef] [PubMed]
- Zhong, F.; Wu, Z.; Guo, J.; Jia, D. Porous Silicon Photonic Crystals Coated with Ag Nanoparticles as Efficient Substrates for Detecting Trace Explosives Using SERS. Nanomaterials 2018, 8, 872. [Google Scholar] [CrossRef] [Green Version]
- Wu, W.; Liu, L.; Dai, Z.; Liu, J.; Yang, S.; Zhou, L.; Xiao, X.; Jiang, C.; Roy, V.A. Low-Cost, Disposable, Flexible and Highly Reproducible Screen Printed SERS Substrates for the Detection of Various Chemicals. Sci. Rep. 2015, 5, srep10208. [Google Scholar] [CrossRef] [PubMed]
- Stuart, D.A.; Yuen, J.M.; Shah, N.; Lyandres, O.; Yonzon, C.R.; Glucksberg, M.R.; Walsh, J.T.; Van Duyne, R.P. In Vivo Glucose Measurement by Surface-Enhanced Raman Spectroscopy. Anal. Chem. 2006, 78, 7211–7215. [Google Scholar] [CrossRef] [PubMed]
- Tian, F.; Conde, J.; Bao, C.; Chen, Y.; Curtin, J.; Cui, D. Gold nanostars for efficient in vitro and in vivo real-time SERS detection and drug delivery via plasmonic-tunable Raman/FTIR imaging. Biomaterials 2016, 106, 87–97. [Google Scholar] [CrossRef] [Green Version]
- Sharma, B.; Bugga, P.; Madison, L.R.; Henry, A.-I.; Blaber, M.G.; Greeneltch, N.G.; Chiang, N.; Mrksich, M.; Schatz, G.C.; Van Duyne, R.P. Bisboronic Acids for Selective, Physiologically Relevant Direct Glucose Sensing with Surface-Enhanced Raman Spectroscopy. J. Am. Chem. Soc. 2016, 138, 13952–13959. [Google Scholar] [CrossRef]
- Eom, G.; Kim, H.; Hwang, A.; Son, H.Y.; Choi, Y.; Moon, J.; Kim, D.; Lee, M.; Lim, E.-K.; Jeong, J.; et al. Nanogap-Rich Au Nanowire SERS Sensor for Ultrasensitive Telomerase Activity Detection: Application to Gastric and Breast Cancer Tissues Diagnosis. Adv. Funct. Mater. 2017, 27, 1701832. [Google Scholar] [CrossRef]
- Feng, J.; Chen, L.; Xia, Y.; Xing, J.; Li, Z.; Qian, Q.; Wang, Y.; Wu, A.; Zeng, L.; Zhou, Y. Bioconjugation of Gold Nanobipyramids for SERS Detection and Targeted Photothermal Therapy in Breast Cancer. ACS Biomater. Sci. Eng. 2017, 3, 608–618. [Google Scholar] [CrossRef]
- Ju, J.; Hsieh, C.-M.; Tian, Y.; Kang, J.; Chia, R.N.; Chang, H.; Bai, Y.; Xu, C.; Wang, X.; Liu, Q. Surface Enhanced Raman Spectroscopy Based Biosensor with a Microneedle Array for Minimally Invasive In Vivo Glucose Measurements. ACS Sens. 2020, 5, 1777–1785. [Google Scholar] [CrossRef]
- Laing, S.; Jamieson, L.E.; Faulds, K.; Graham, D. Surface-enhanced Raman spectroscopy for in vivo biosensing. Nat. Rev. Chem. 2017, 1, 60. [Google Scholar] [CrossRef]
- Chamuah, N.; Hazarika, A.; Hatiboruah, D.; Nath, P. SERS on paper: An extremely low cost technique to measure Raman signal. J. Phys. D Appl. Phys. 2017, 50, 485601. [Google Scholar] [CrossRef]
- Wang, T.; Zhou, J.; Wang, Y. Simple, Low-Cost Fabrication of Highly Uniform and Reproducible SERS Substrates Composed of Ag–Pt Nanoparticles. Nanomaterials 2018, 8, 331. [Google Scholar] [CrossRef] [PubMed] [Green Version]


| SERS Substrate | Fabrication | Reference |
|---|---|---|
| Silver (Ag) film on nanosphere surfaces | Nanosphere lithography: Drop-coating nanospheres on copper substrates and depositing 200-nm thick Ag film on the nanospheres, used in vitro | [41] |
| Gold nanostars | Chemical synthesis: Seed mediated route using buffer, injected in vivo into the tissue | [42] |
| Gold film over nanospheres | Nanosphere lithography: Silica microsphere are self-assembled on silicon wafer, followed by evaporation of gold layer (200 nm thick), used in vitro | [43] |
| Gold nanowires with nanogaps | Gold nanowire made by vapor transport method on sapphire substrate, followed by sputtering of gold; combined with the specimen in vitro | [44] |
| Gold nano-biopyramids | Chemical synthesis: seed-mediated method, injected into the specimen in vivo | [45] |
| Gold nanoparticles | Self-assembled from 20 nm thick sputtered gold film on aluminum foil, used in vitro | [23] |
| Silver nanoparticles on polymer microneedle array | Chemical synthesis to grow silver nanoparticles on micro-molded polymethyl methacrylate needles, used in vivo without a remote probe | [46] |
| Silver nanoparticles on imprinted PET | Dispersion and self-assembly of silver nanoparticles on imprinted plastic surface, to be transferred to a rugged probe for in vivo sampling of large specimen | This work |
| SERS Substrate | EF | Detection Limit | Cost | Reference |
|---|---|---|---|---|
| Paper-based Ag NPs | ~107 | 10−9 M | <$0.08 per cm2 | [48] |
| Ag-Pt NPs on Ge wafer | 9.1 × 10⁶ | - | - | [49] |
| Screen-printed Ag NPs on PET | - | 10−10 M | - | [40] |
| Drop casted Ag NPs on imprinted PET | 1.6 × 10⁴ | 10−9 M | <$0.01 per cm2 | This work |
Publisher’s Note: MDPI stays neutral with regard to jurisdictional claims in published maps and institutional affiliations. |
© 2022 by the authors. Licensee MDPI, Basel, Switzerland. This article is an open access article distributed under the terms and conditions of the Creative Commons Attribution (CC BY) license (https://creativecommons.org/licenses/by/4.0/).
Share and Cite
Adewumi, B.; Feldman, M.; Biswas, D.; Cao, D.; Jiang, L.; Korivi, N. Low-Cost Surface Enhanced Raman Scattering for Bio-Probes. Solids 2022, 3, 188-202. https://doi.org/10.3390/solids3020013
Adewumi B, Feldman M, Biswas D, Cao D, Jiang L, Korivi N. Low-Cost Surface Enhanced Raman Scattering for Bio-Probes. Solids. 2022; 3(2):188-202. https://doi.org/10.3390/solids3020013
Chicago/Turabian StyleAdewumi, Blessing, Martin Feldman, Debsmita Biswas, Dongmei Cao, Li Jiang, and Naga Korivi. 2022. "Low-Cost Surface Enhanced Raman Scattering for Bio-Probes" Solids 3, no. 2: 188-202. https://doi.org/10.3390/solids3020013
APA StyleAdewumi, B., Feldman, M., Biswas, D., Cao, D., Jiang, L., & Korivi, N. (2022). Low-Cost Surface Enhanced Raman Scattering for Bio-Probes. Solids, 3(2), 188-202. https://doi.org/10.3390/solids3020013