
Effects of Strontium Content on the Microstructure and Ionic Conductivity of Samarium-Doped Ceria

Abstract
:
1. Introduction
2. Experimental
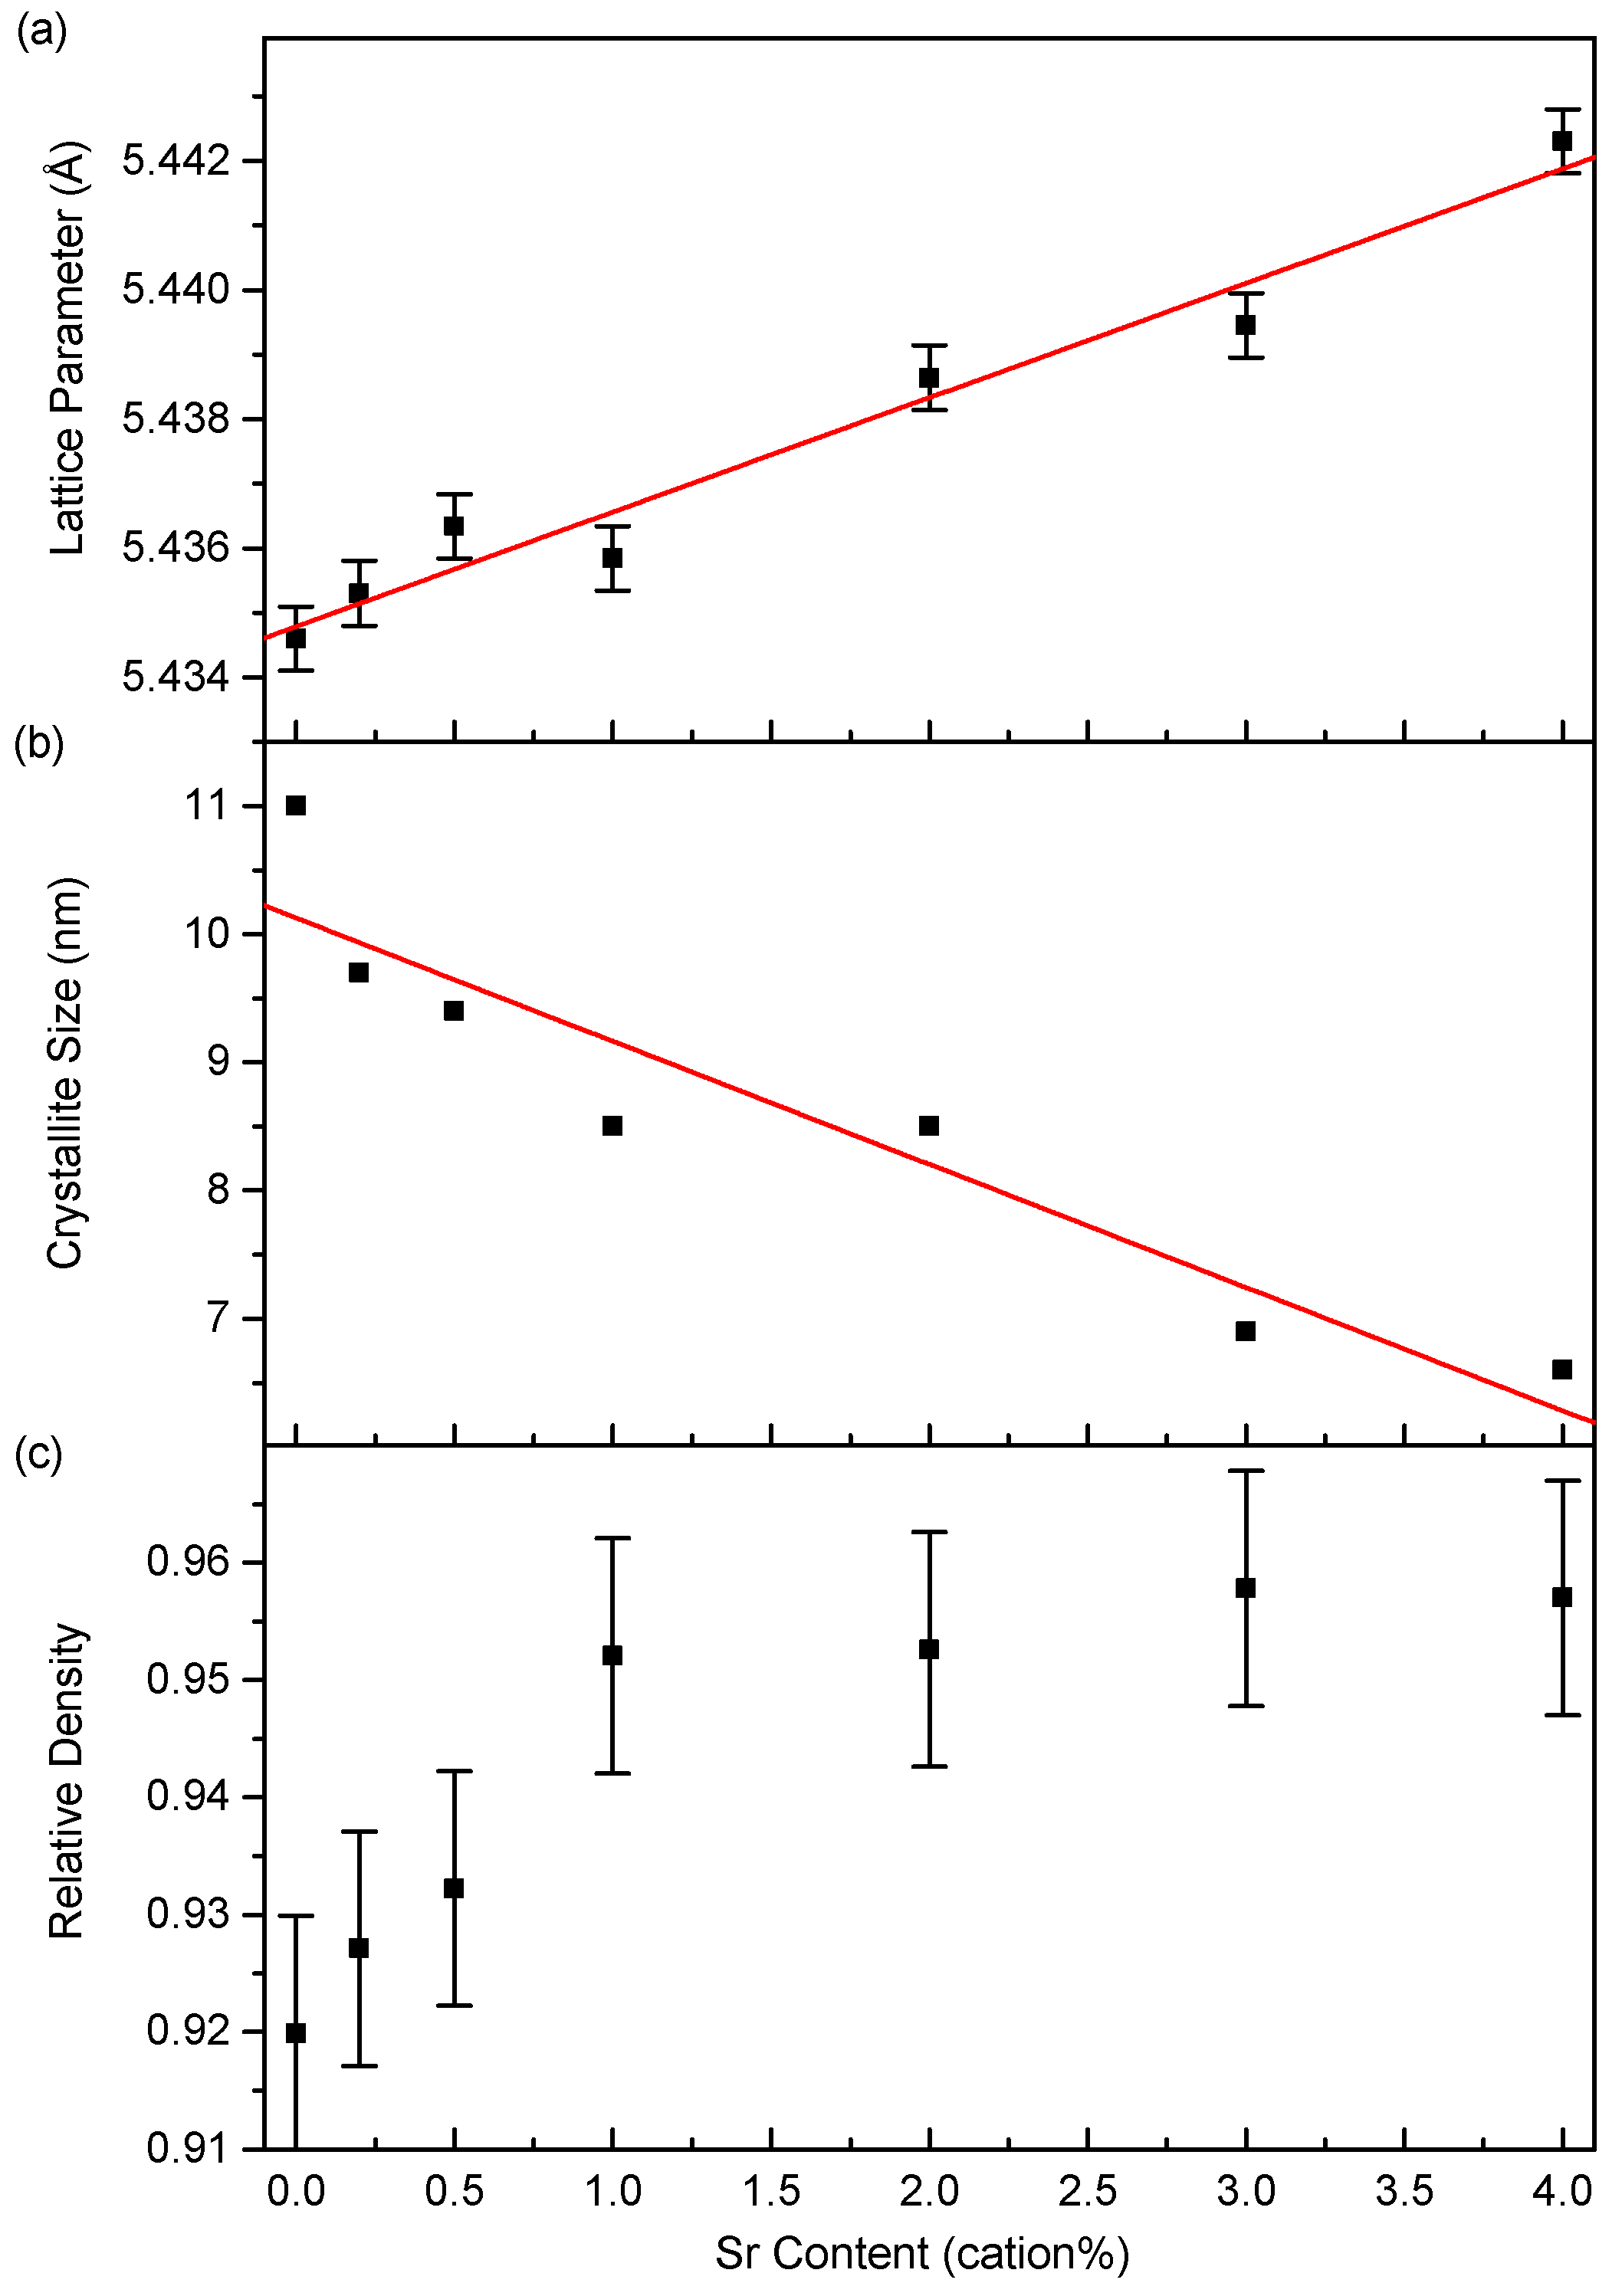
3. Results
3.1. Synthesis
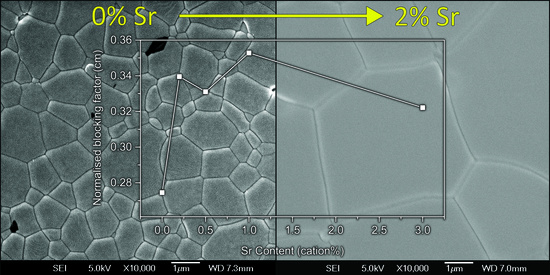
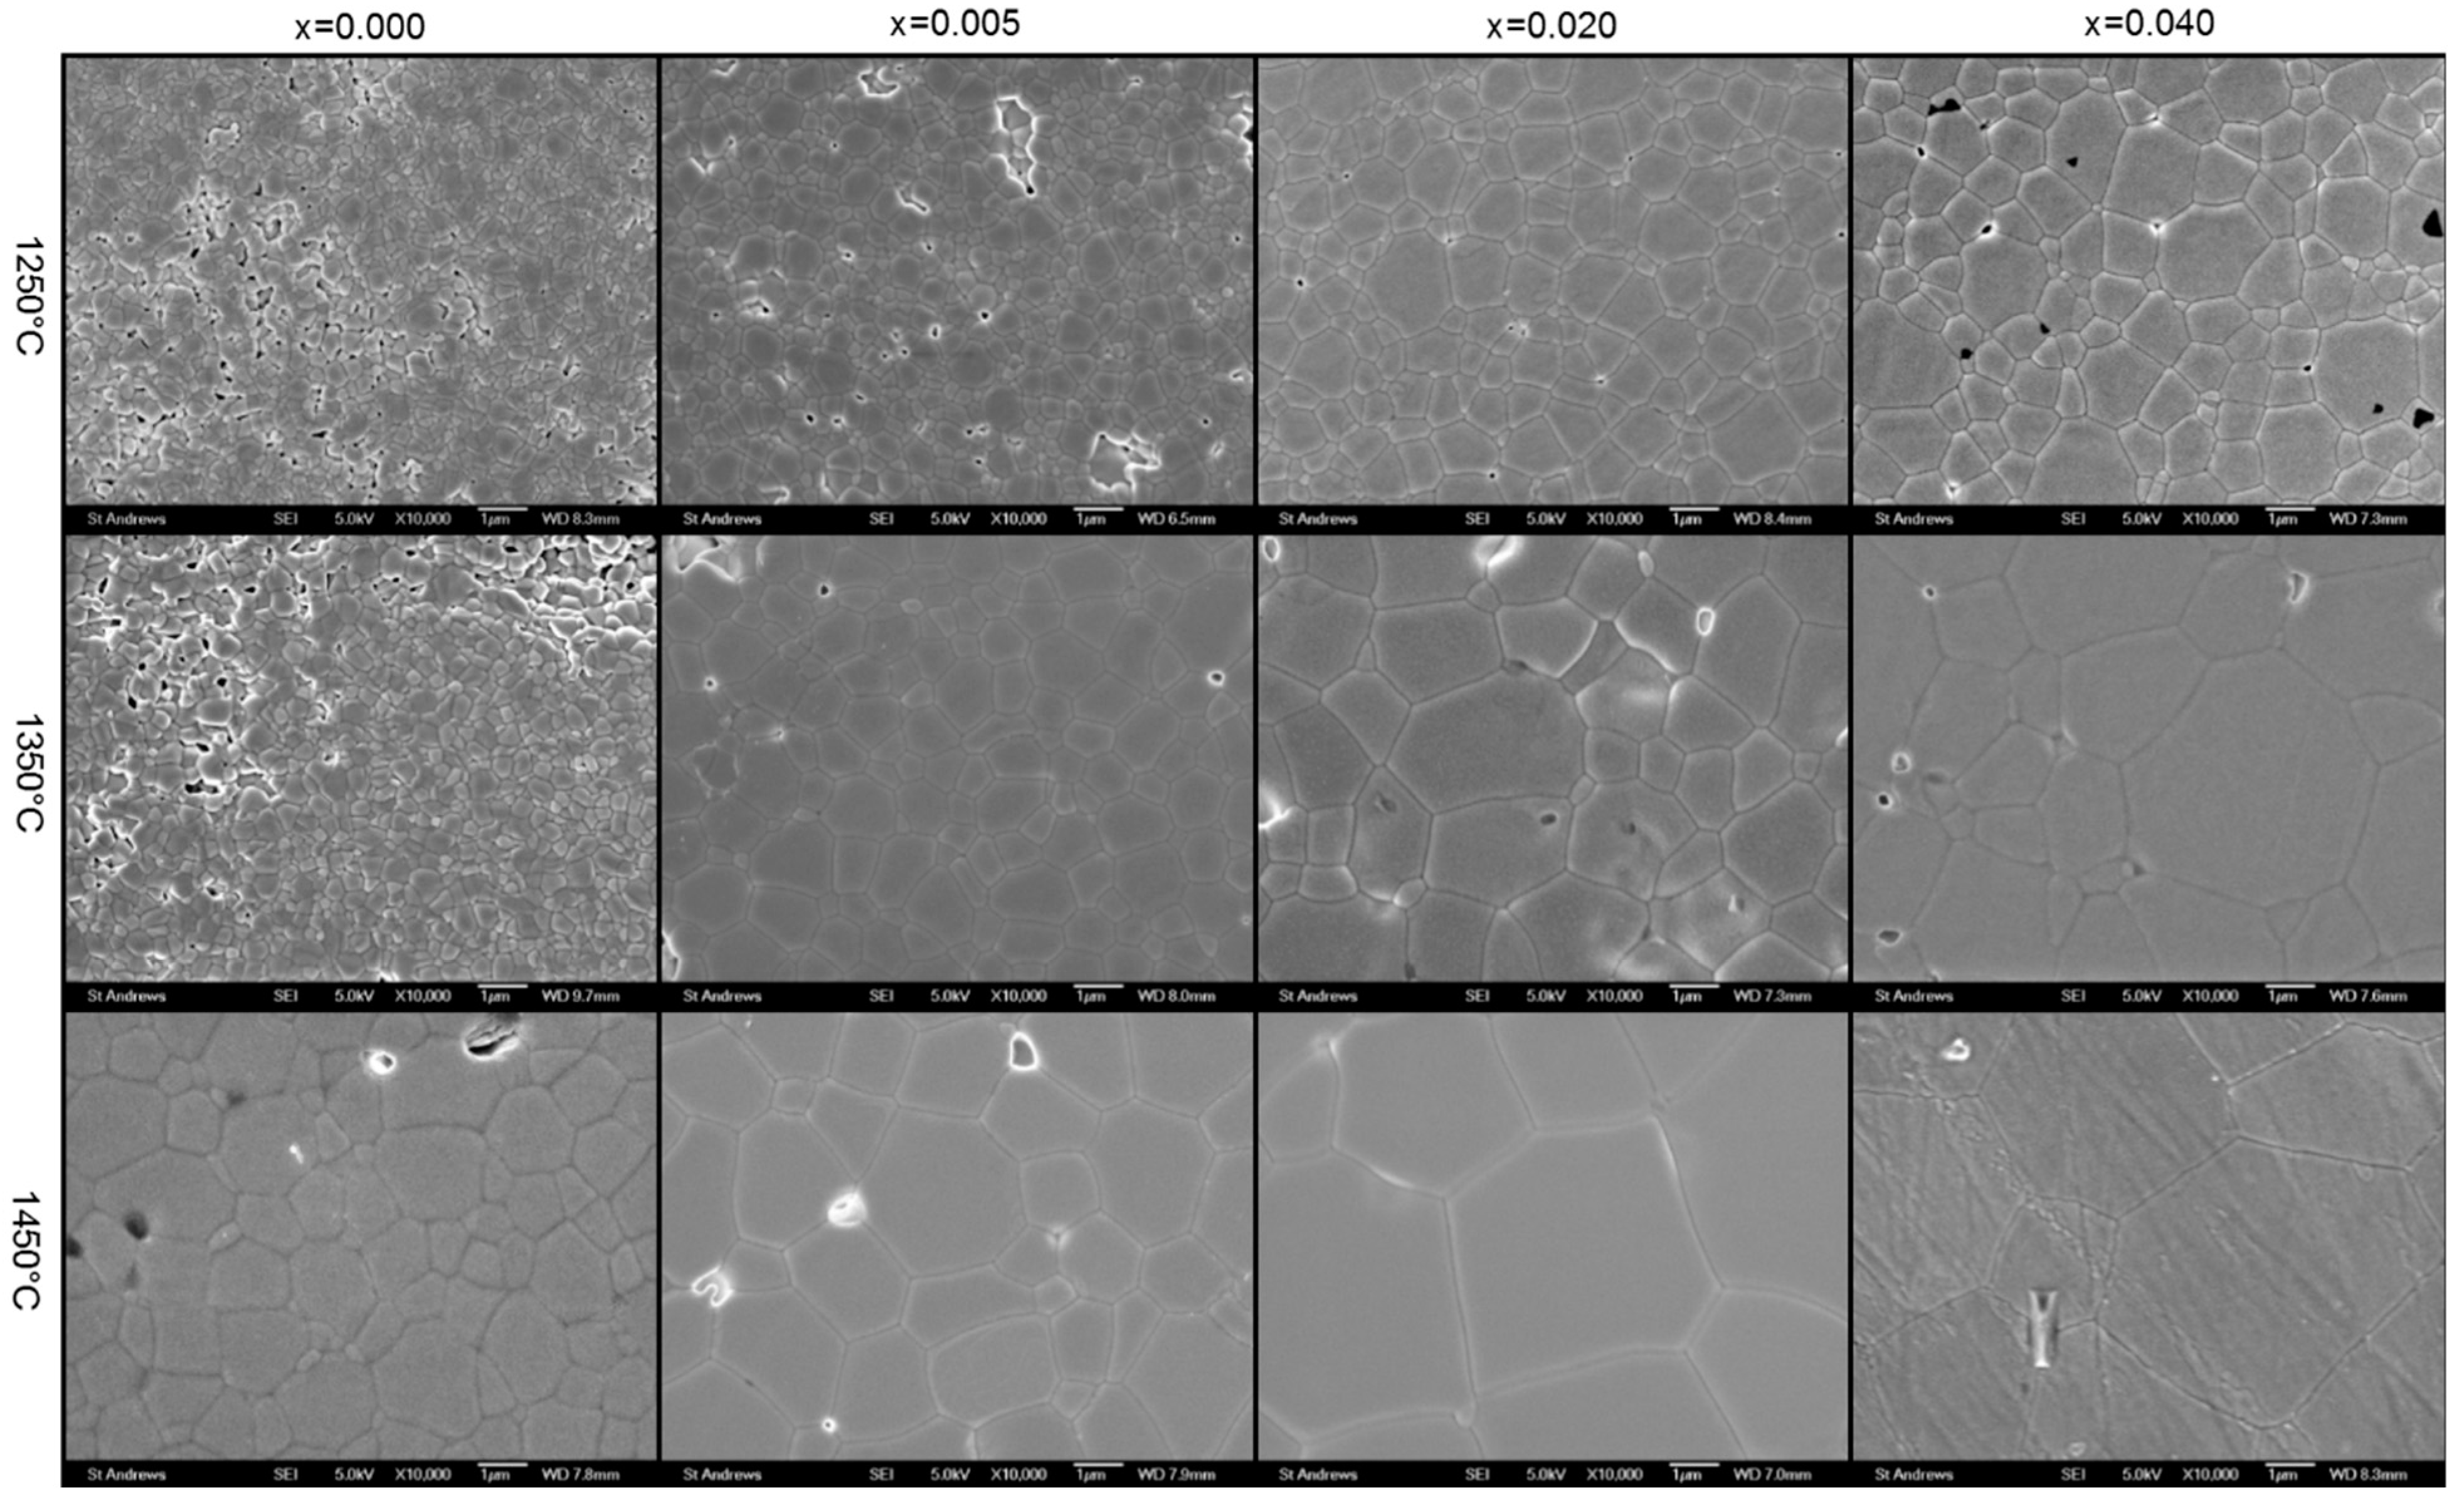
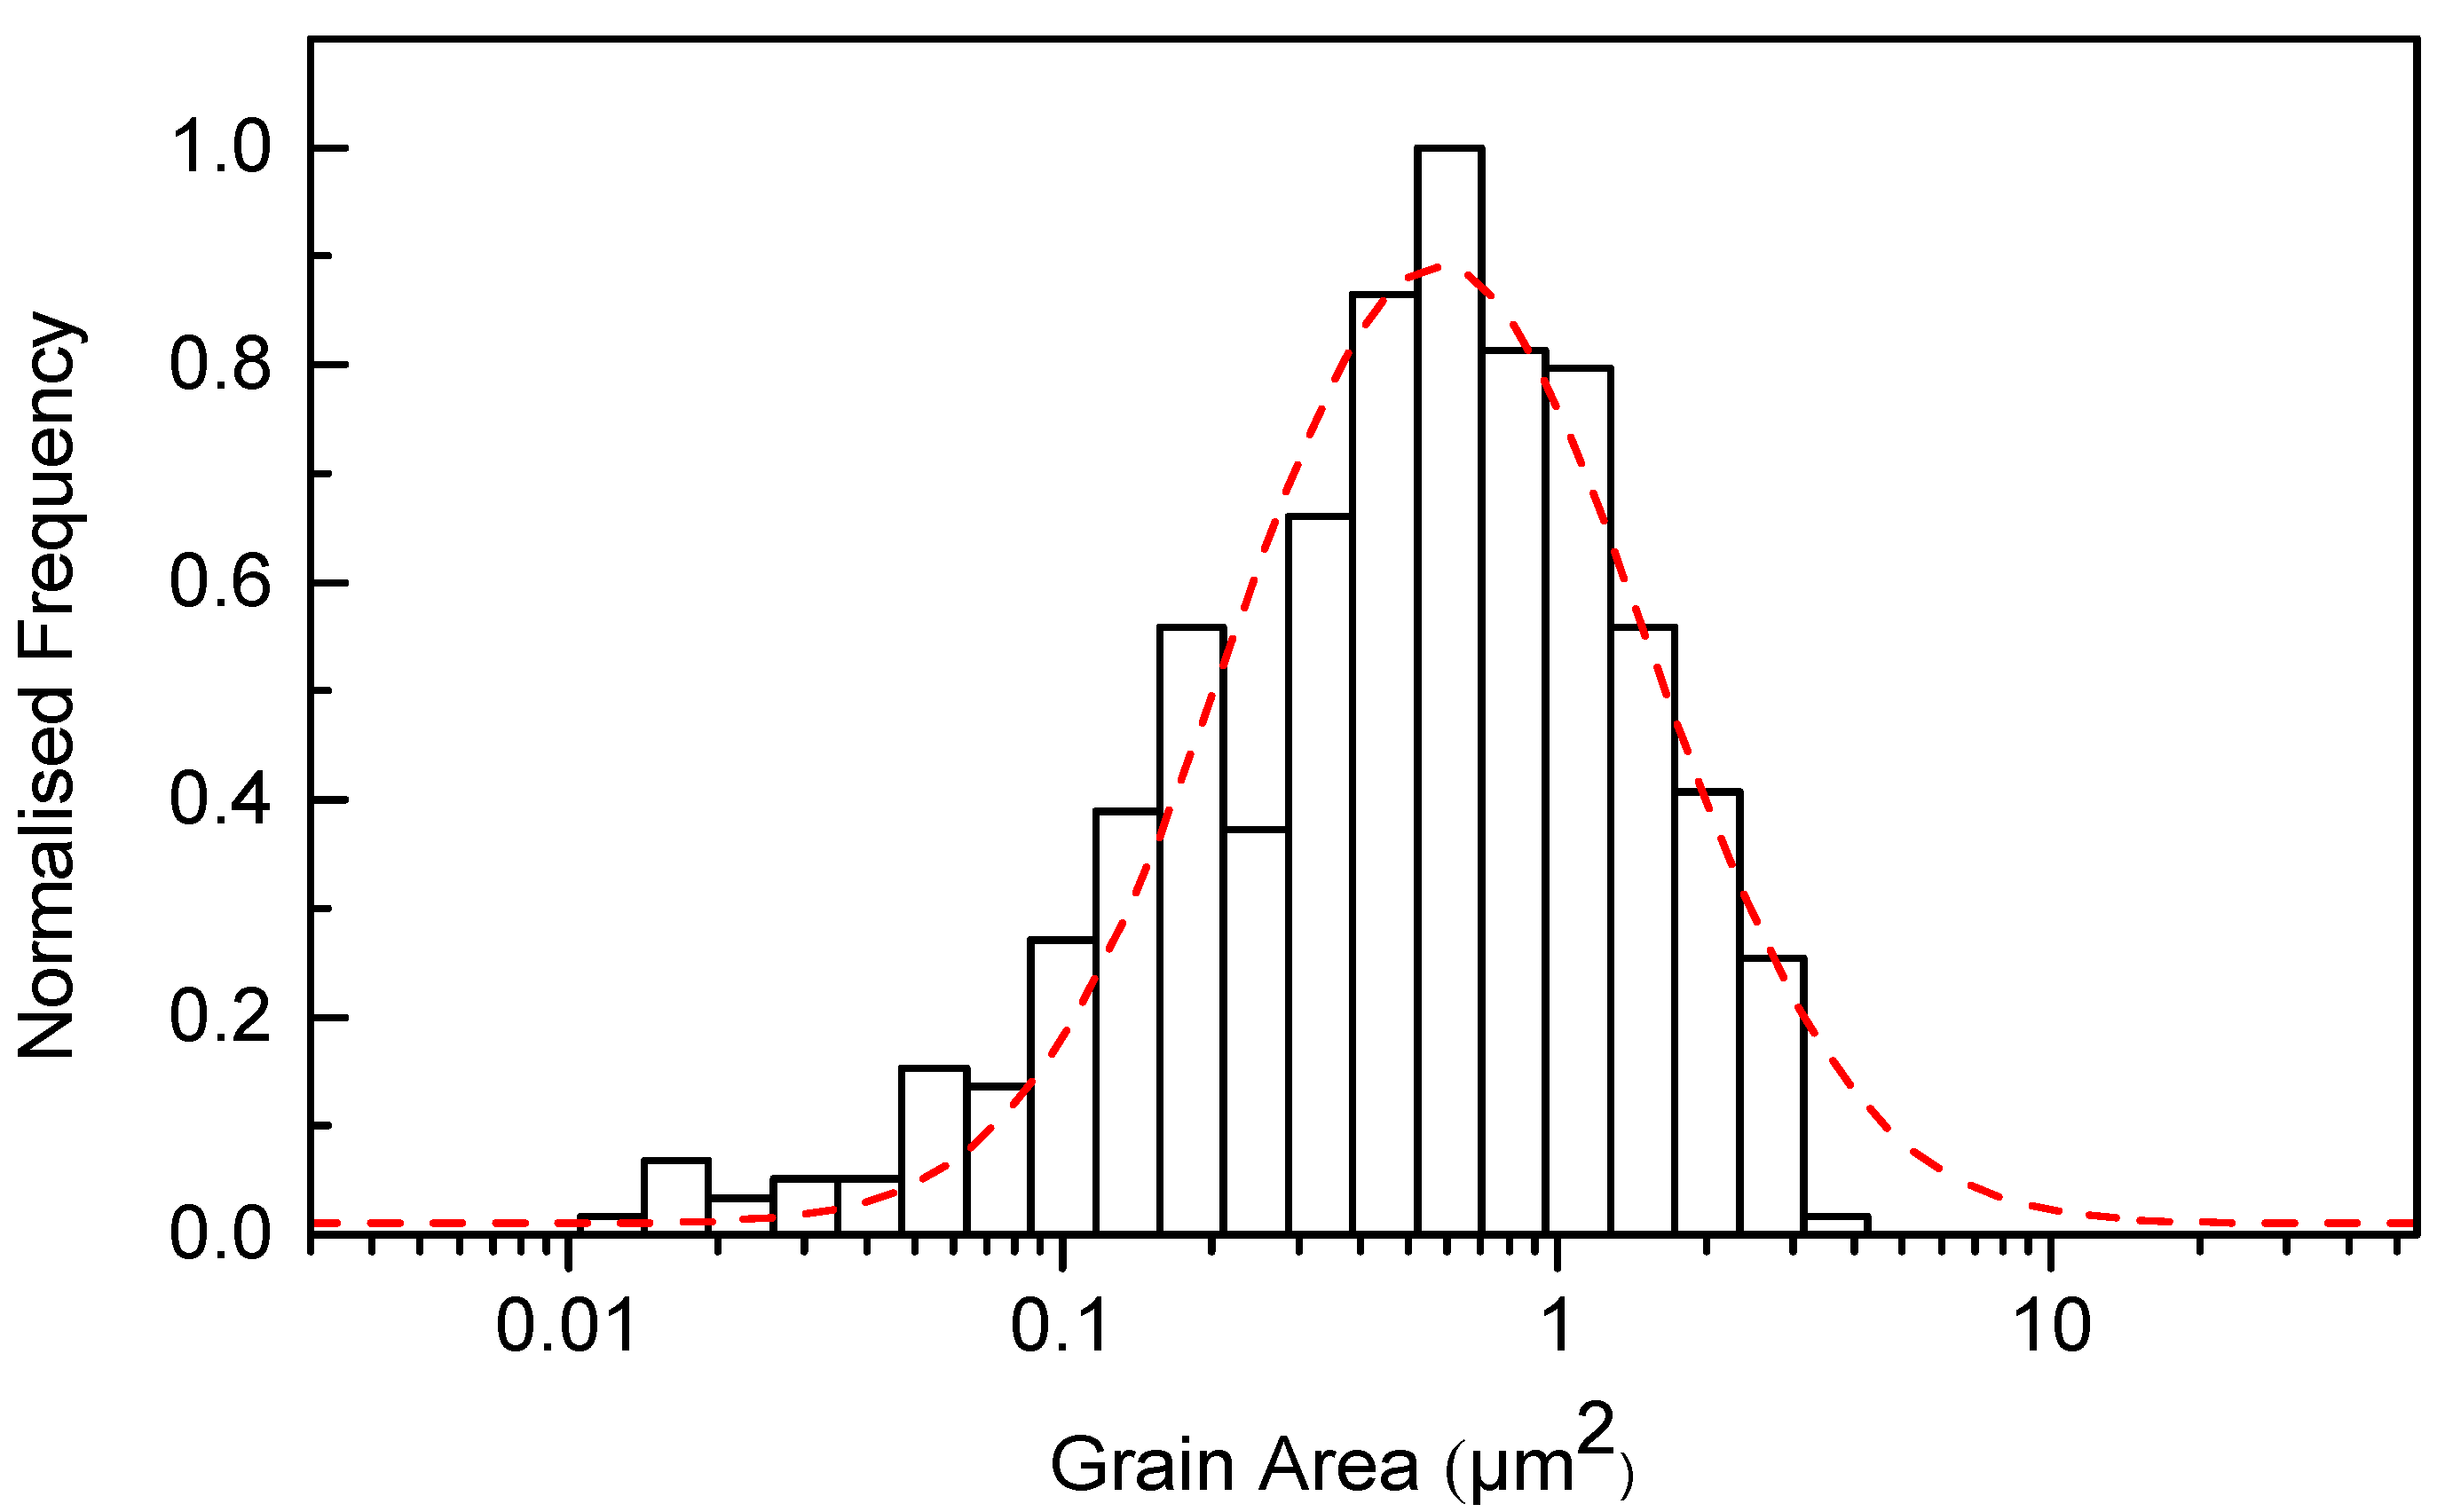
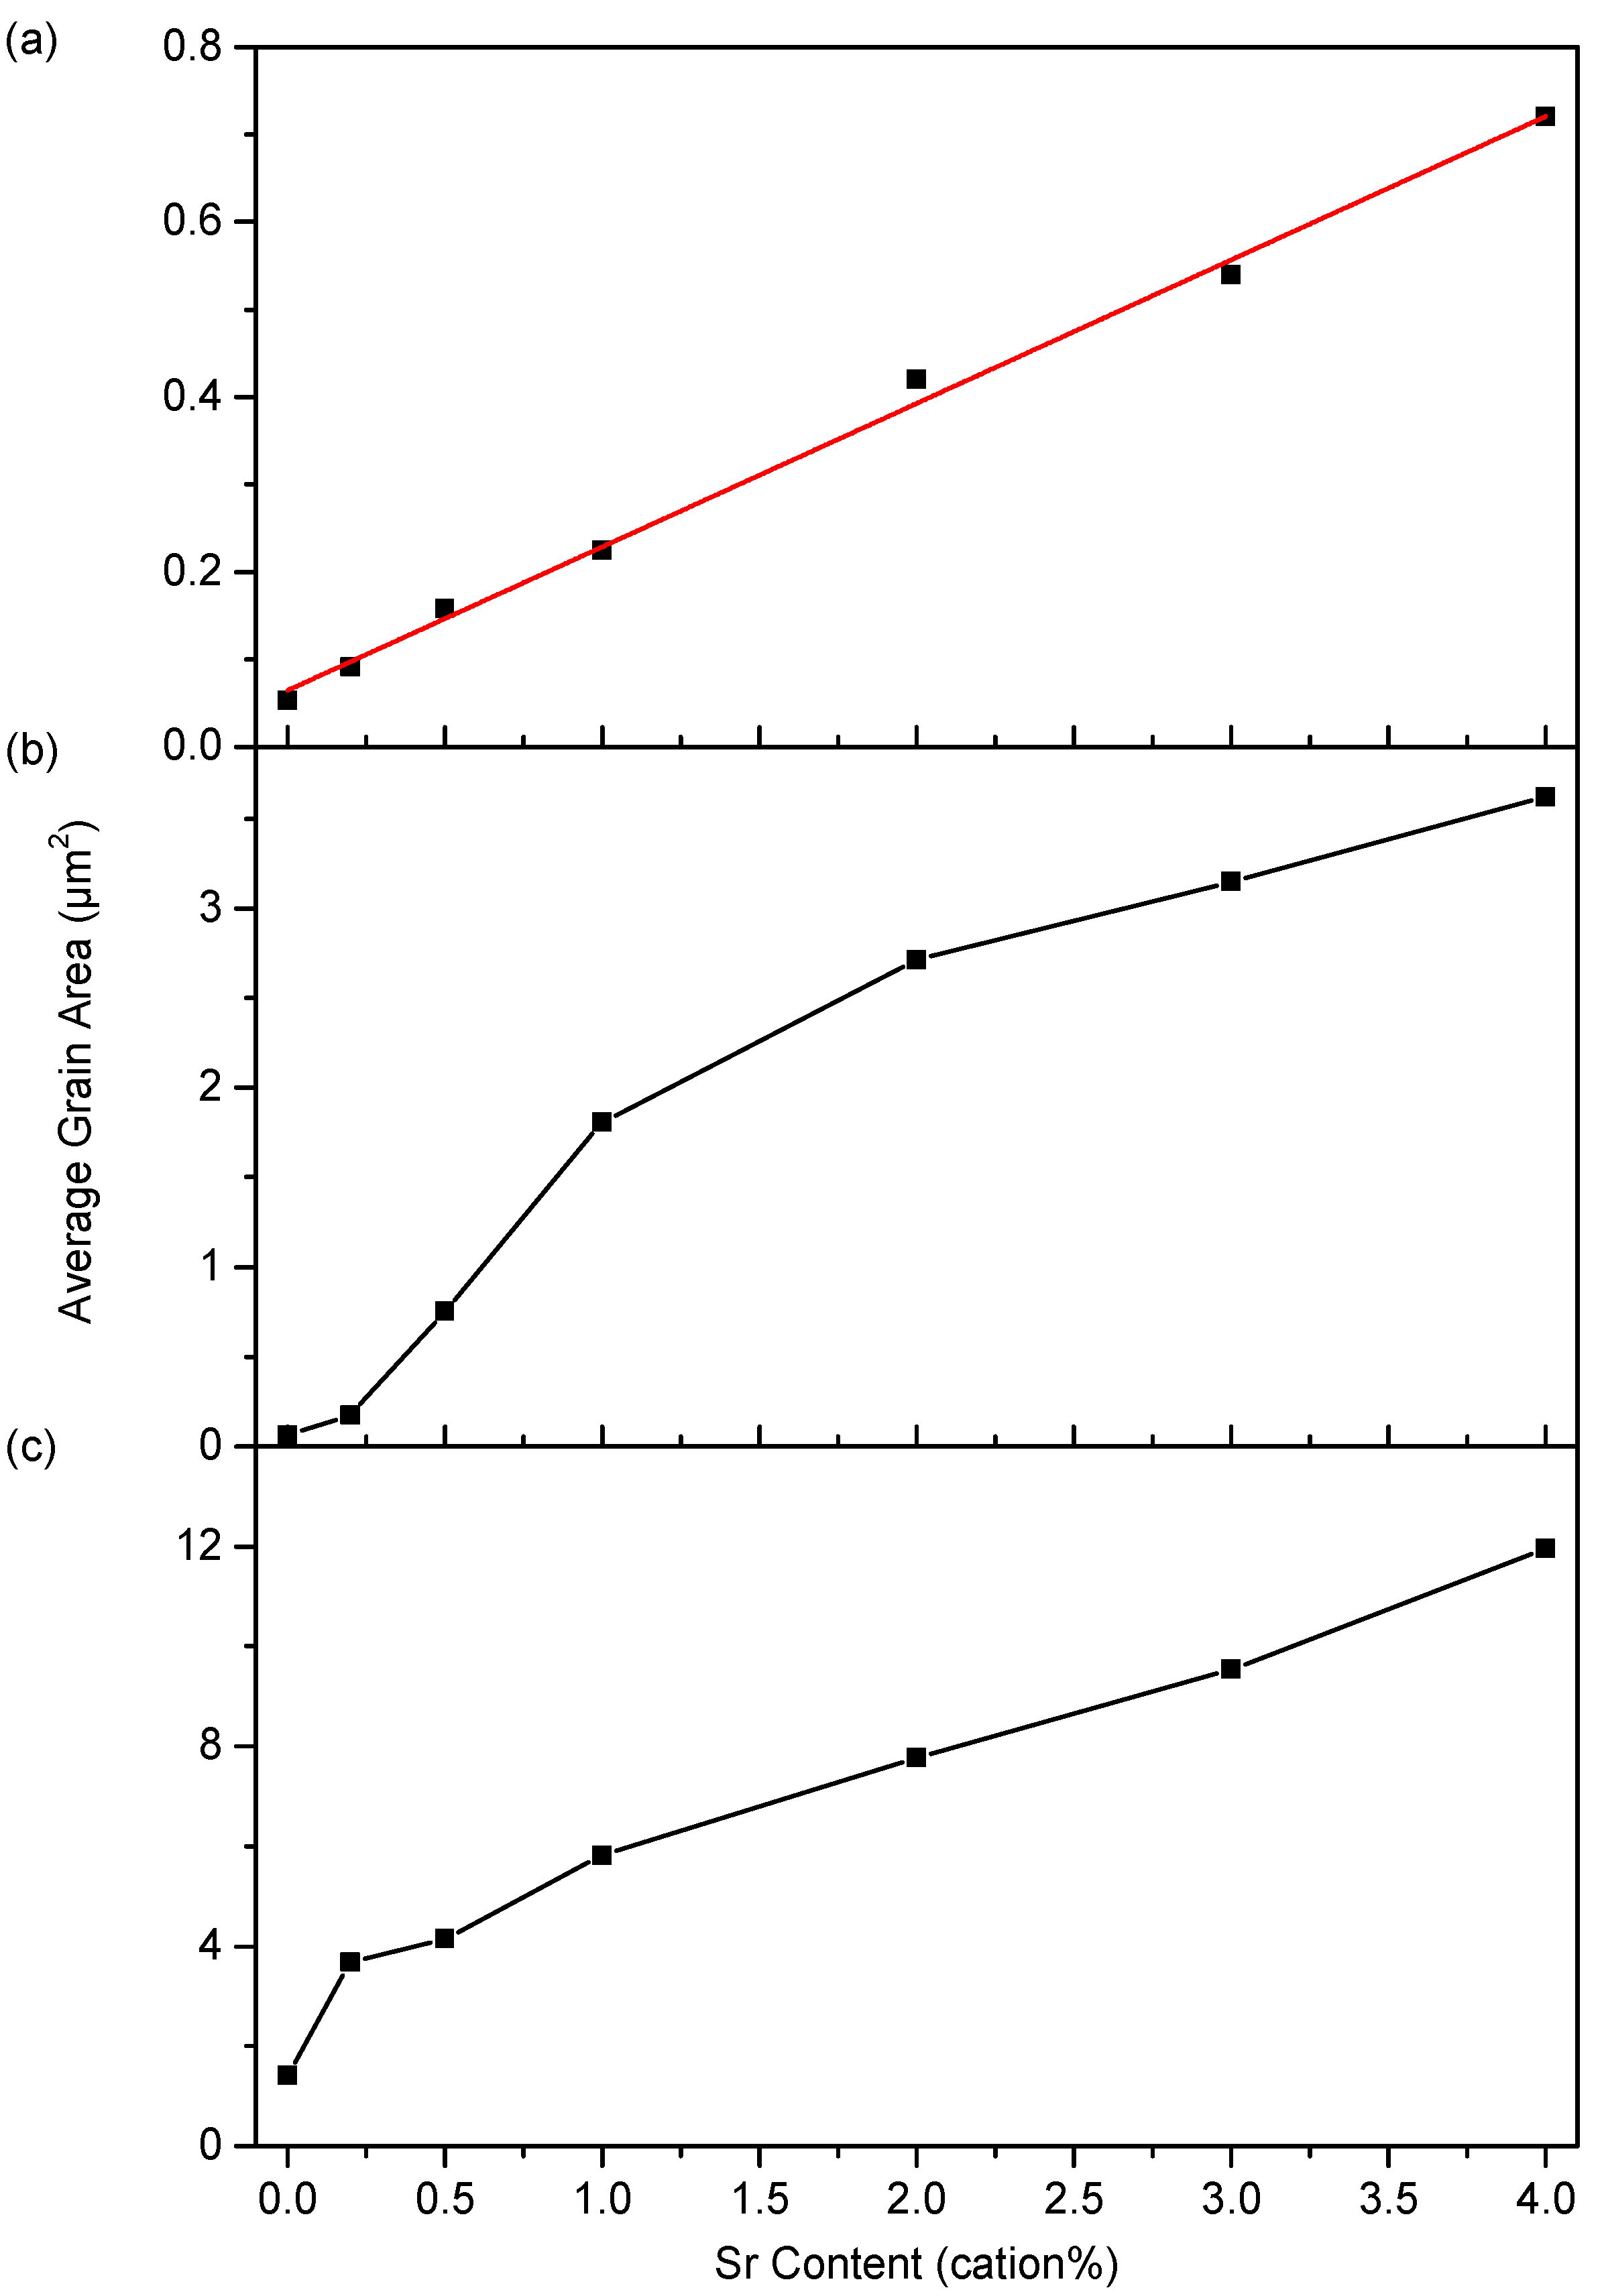
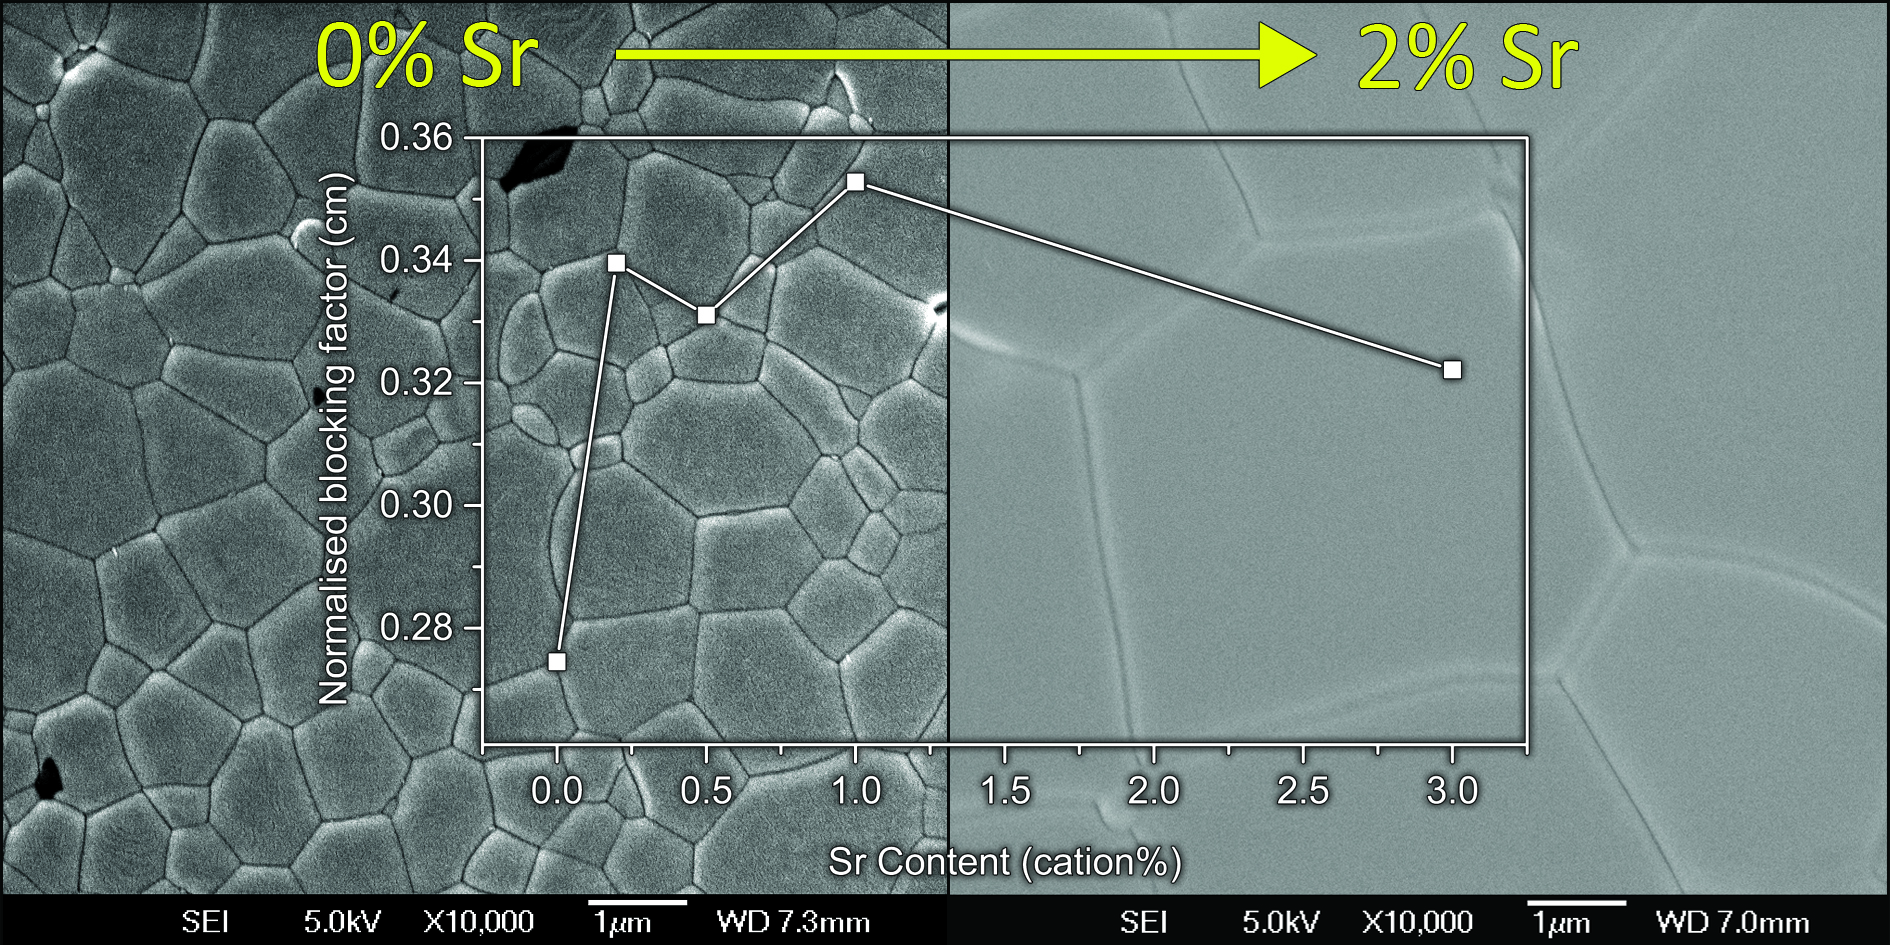
3.2. Microstructure
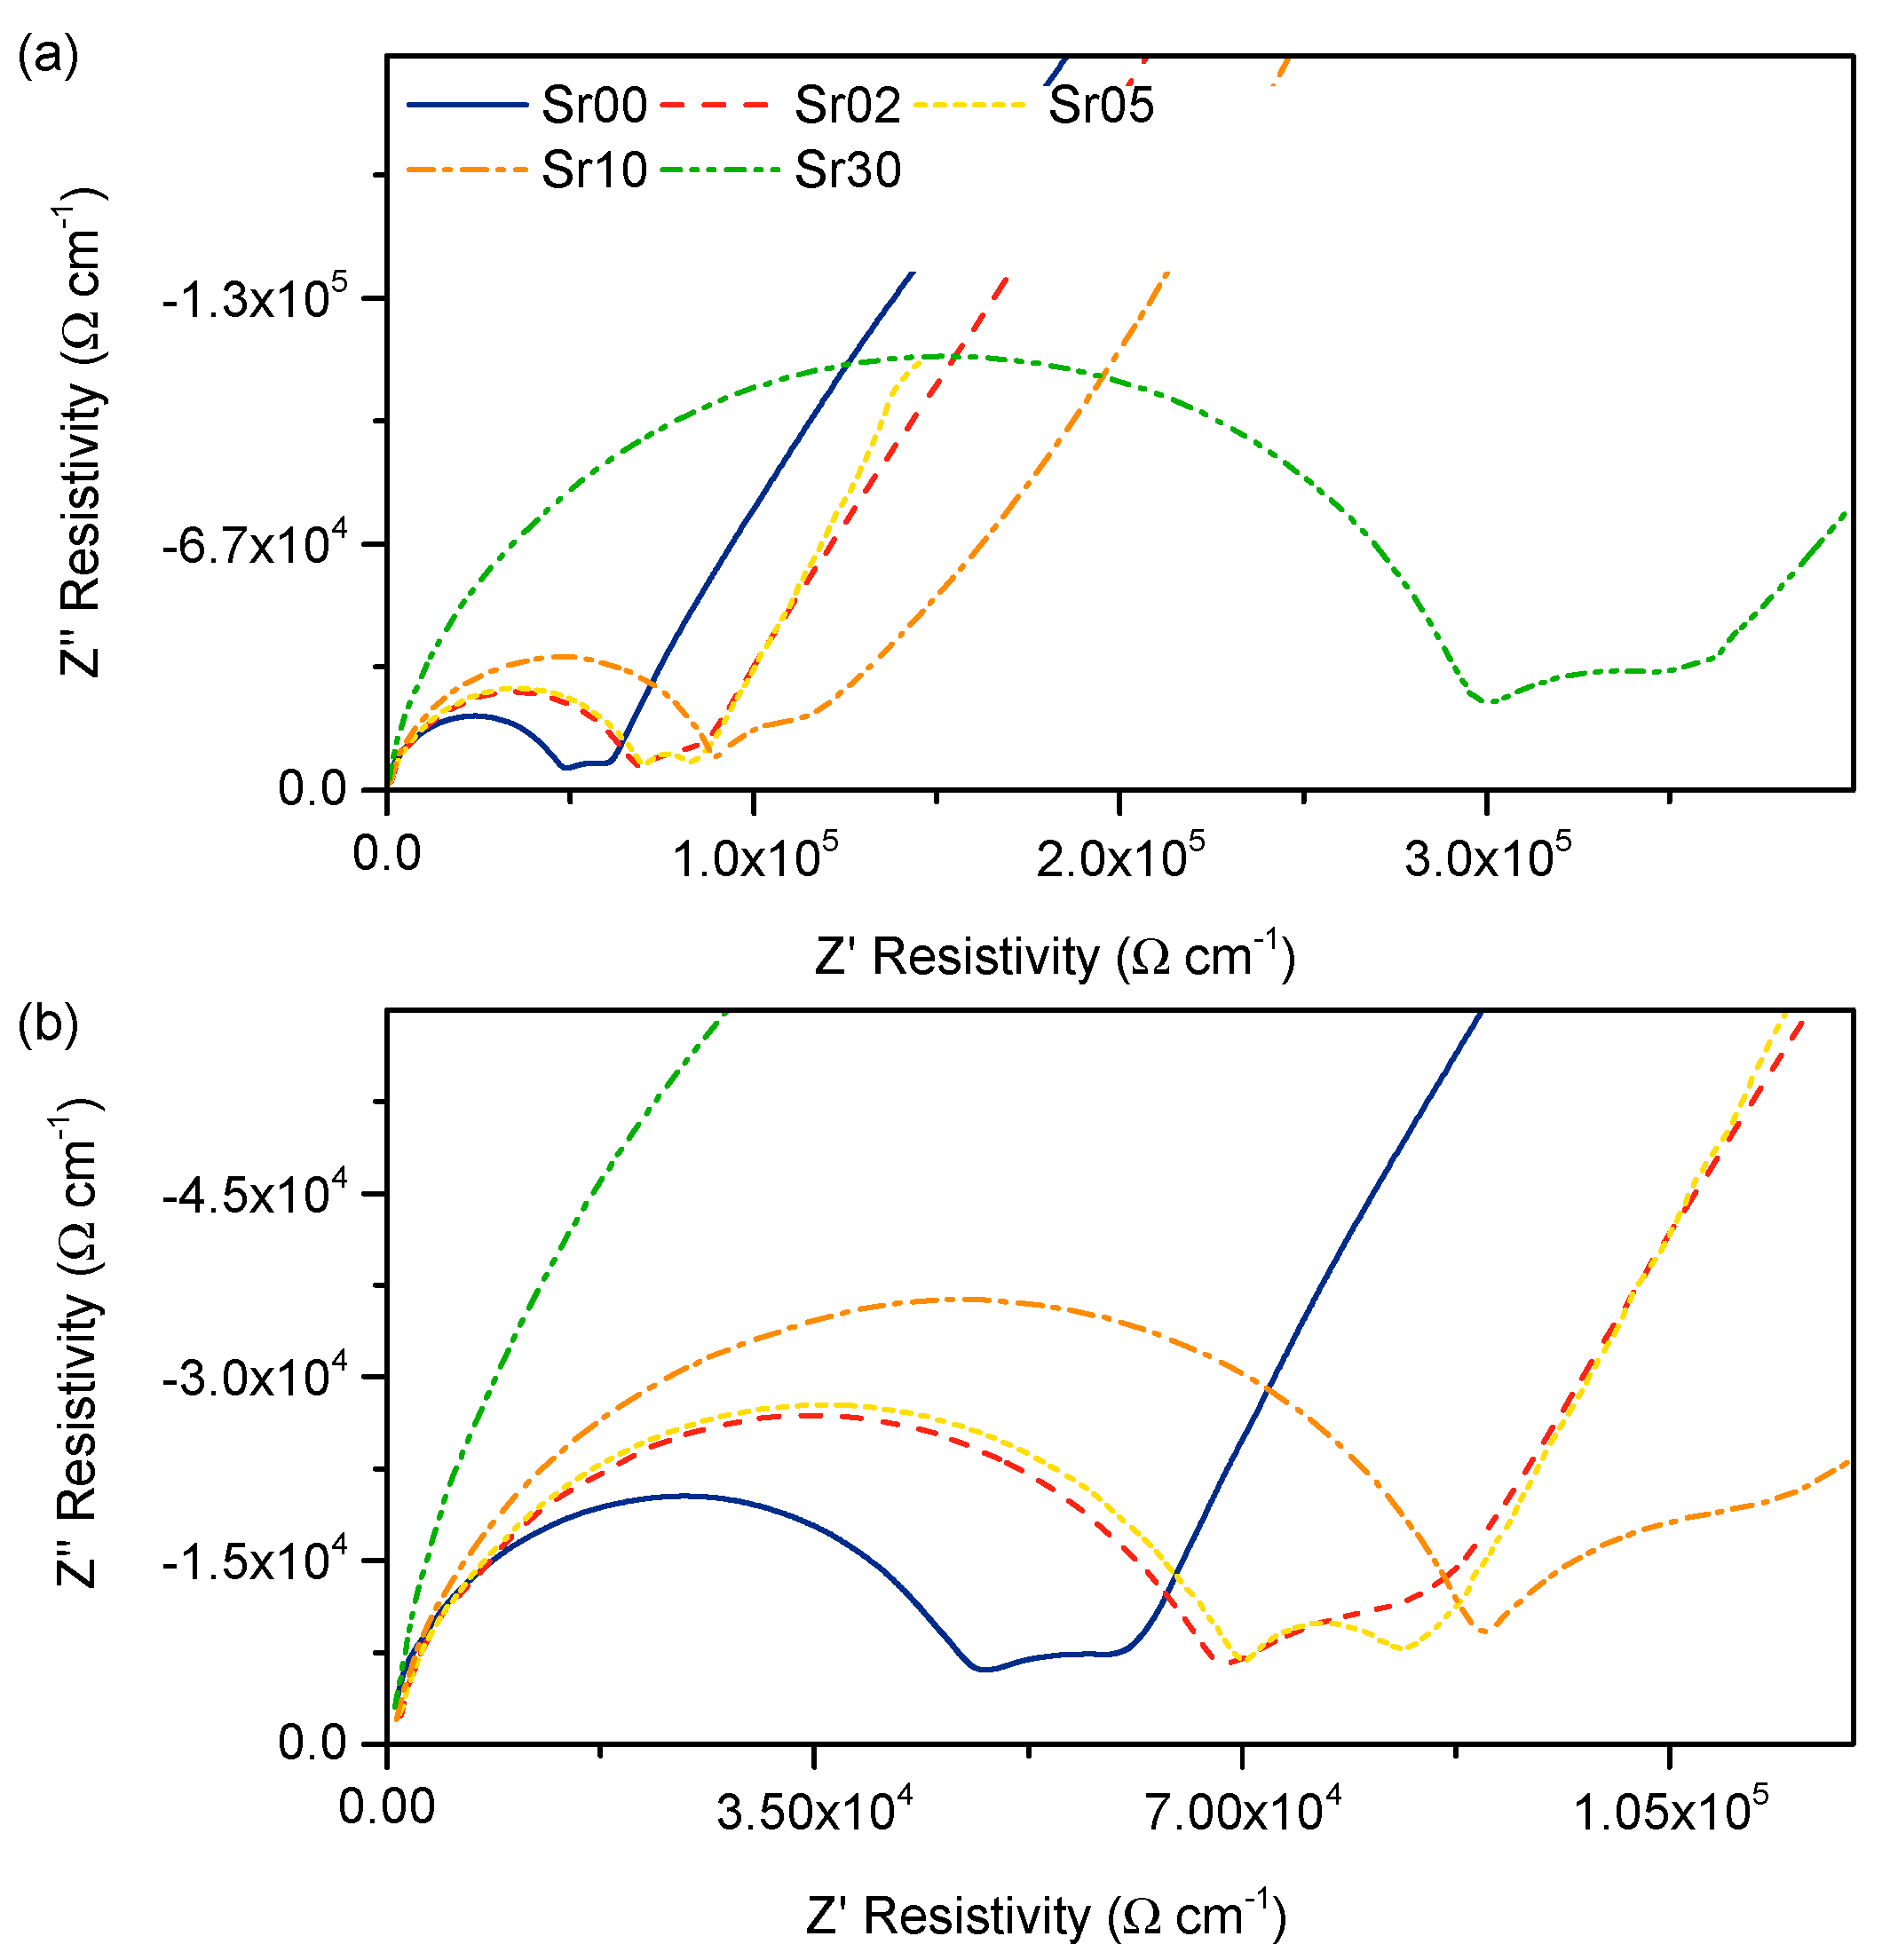
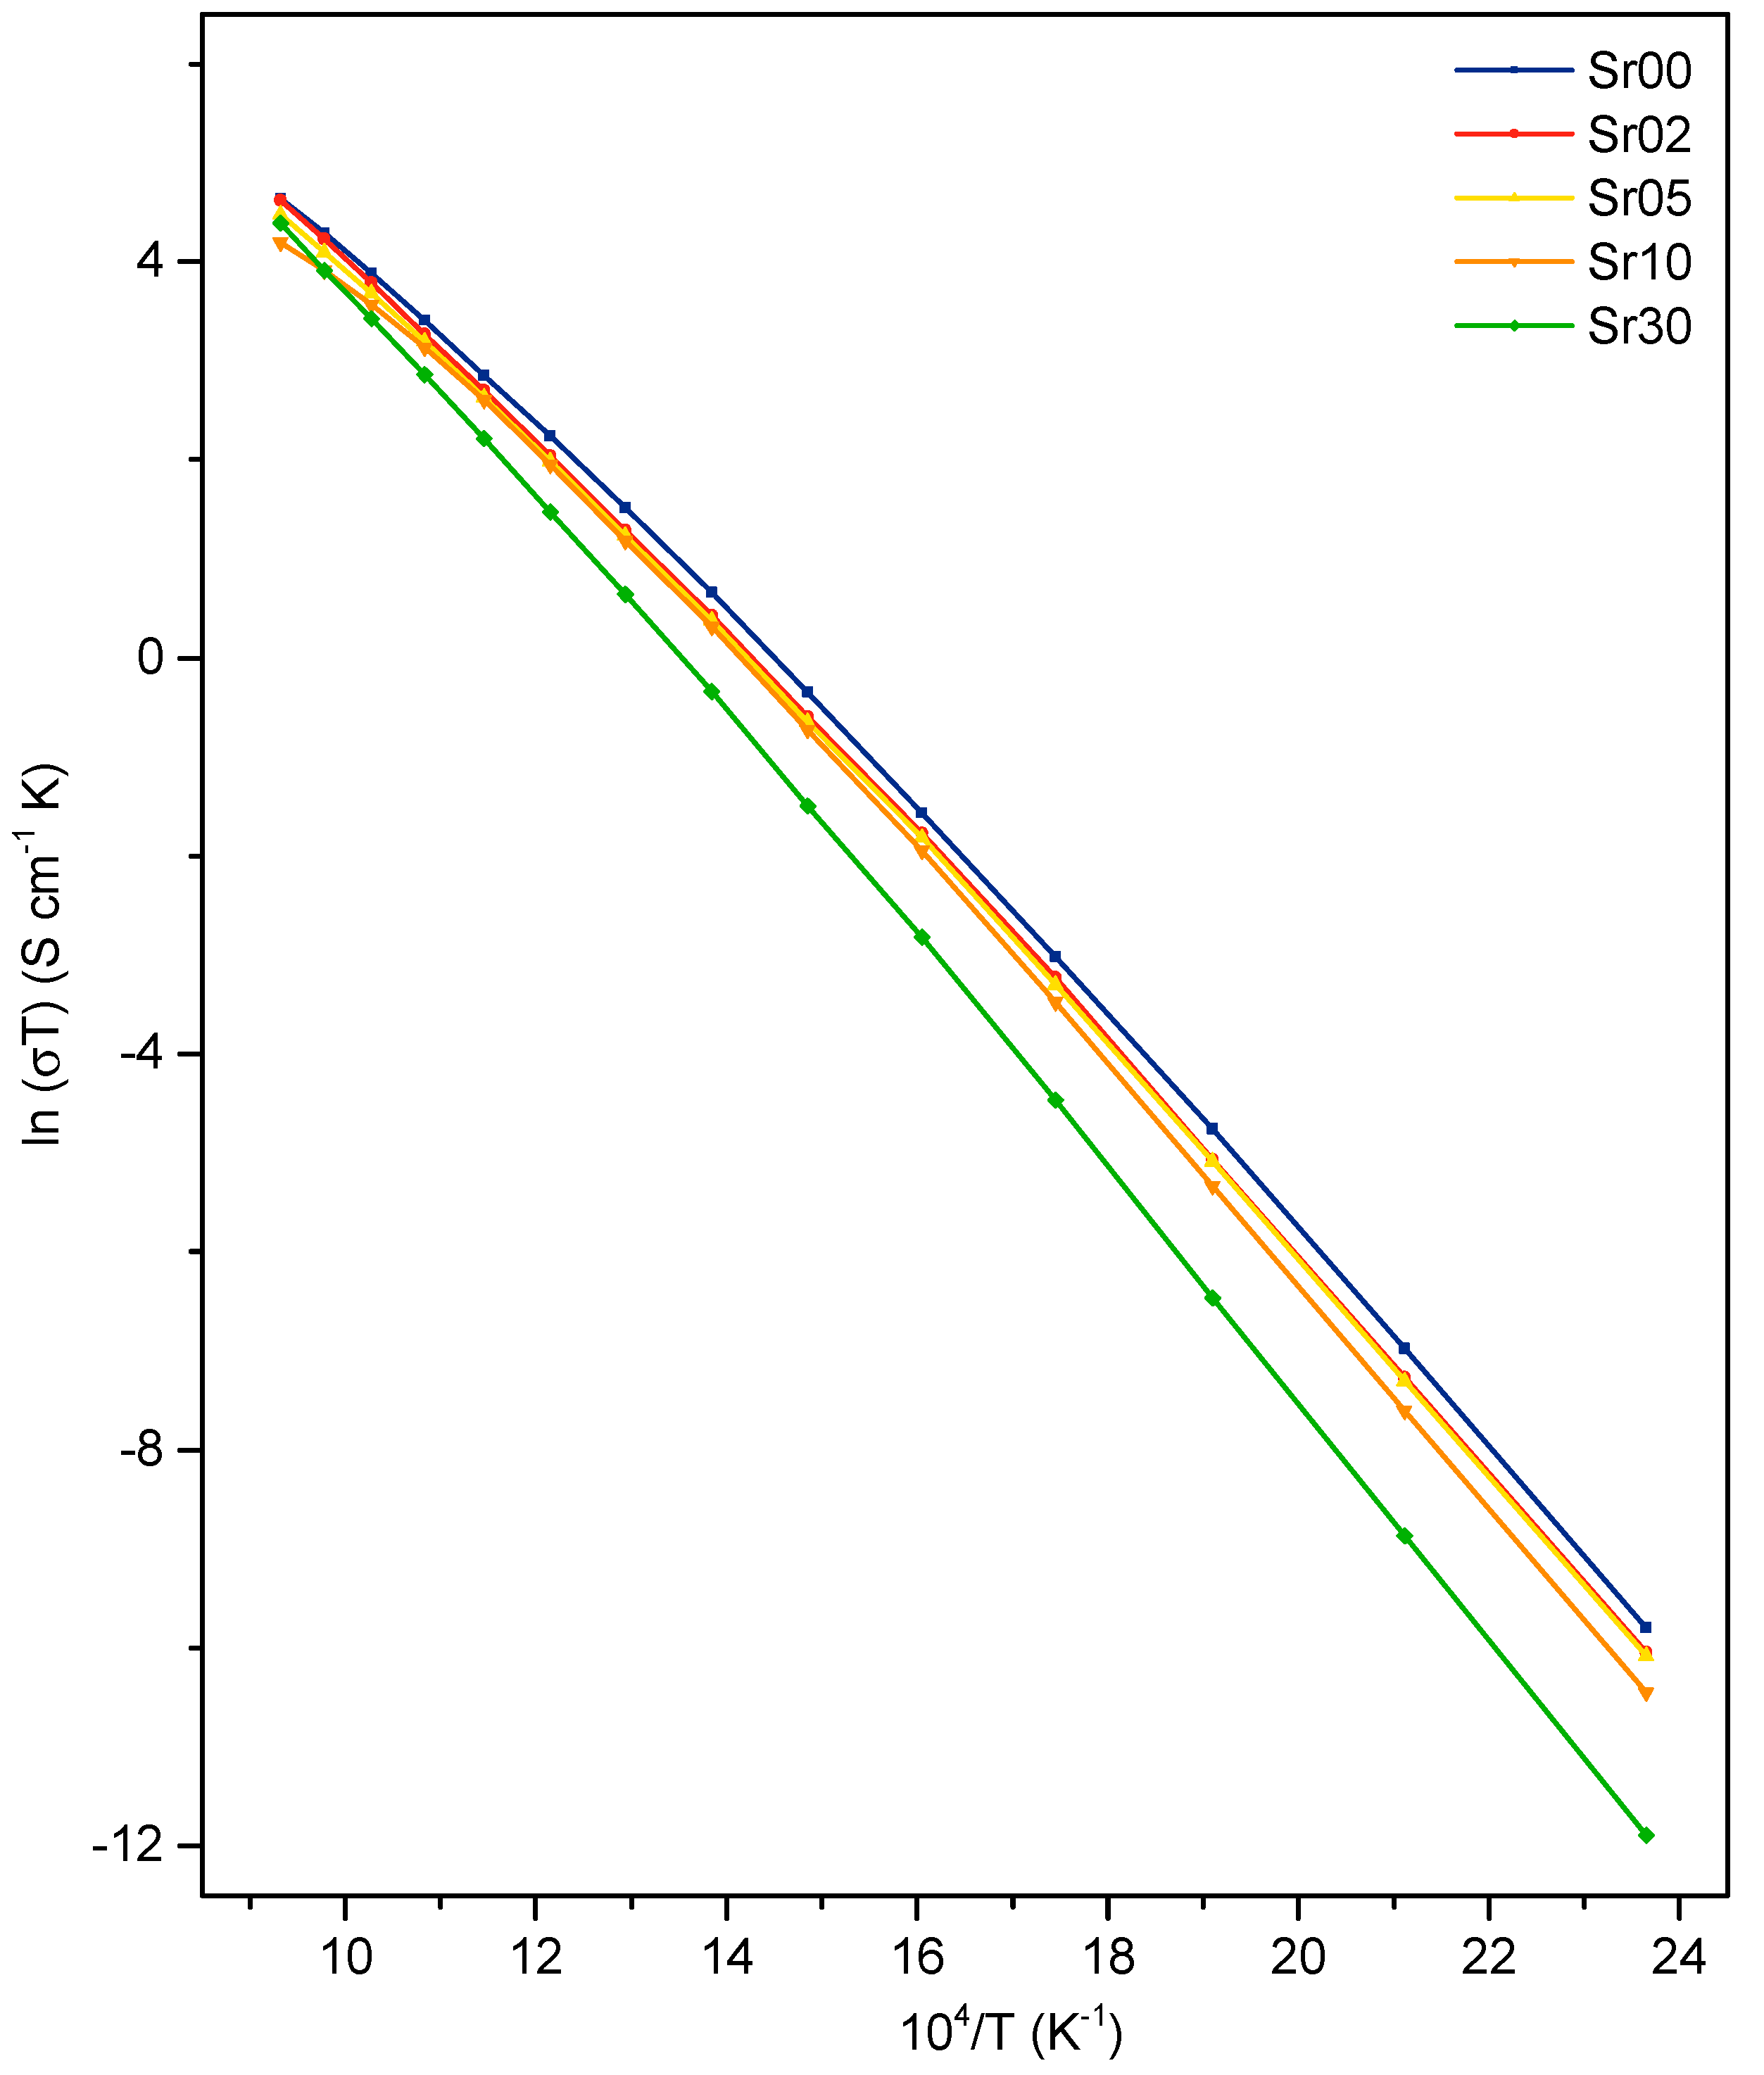
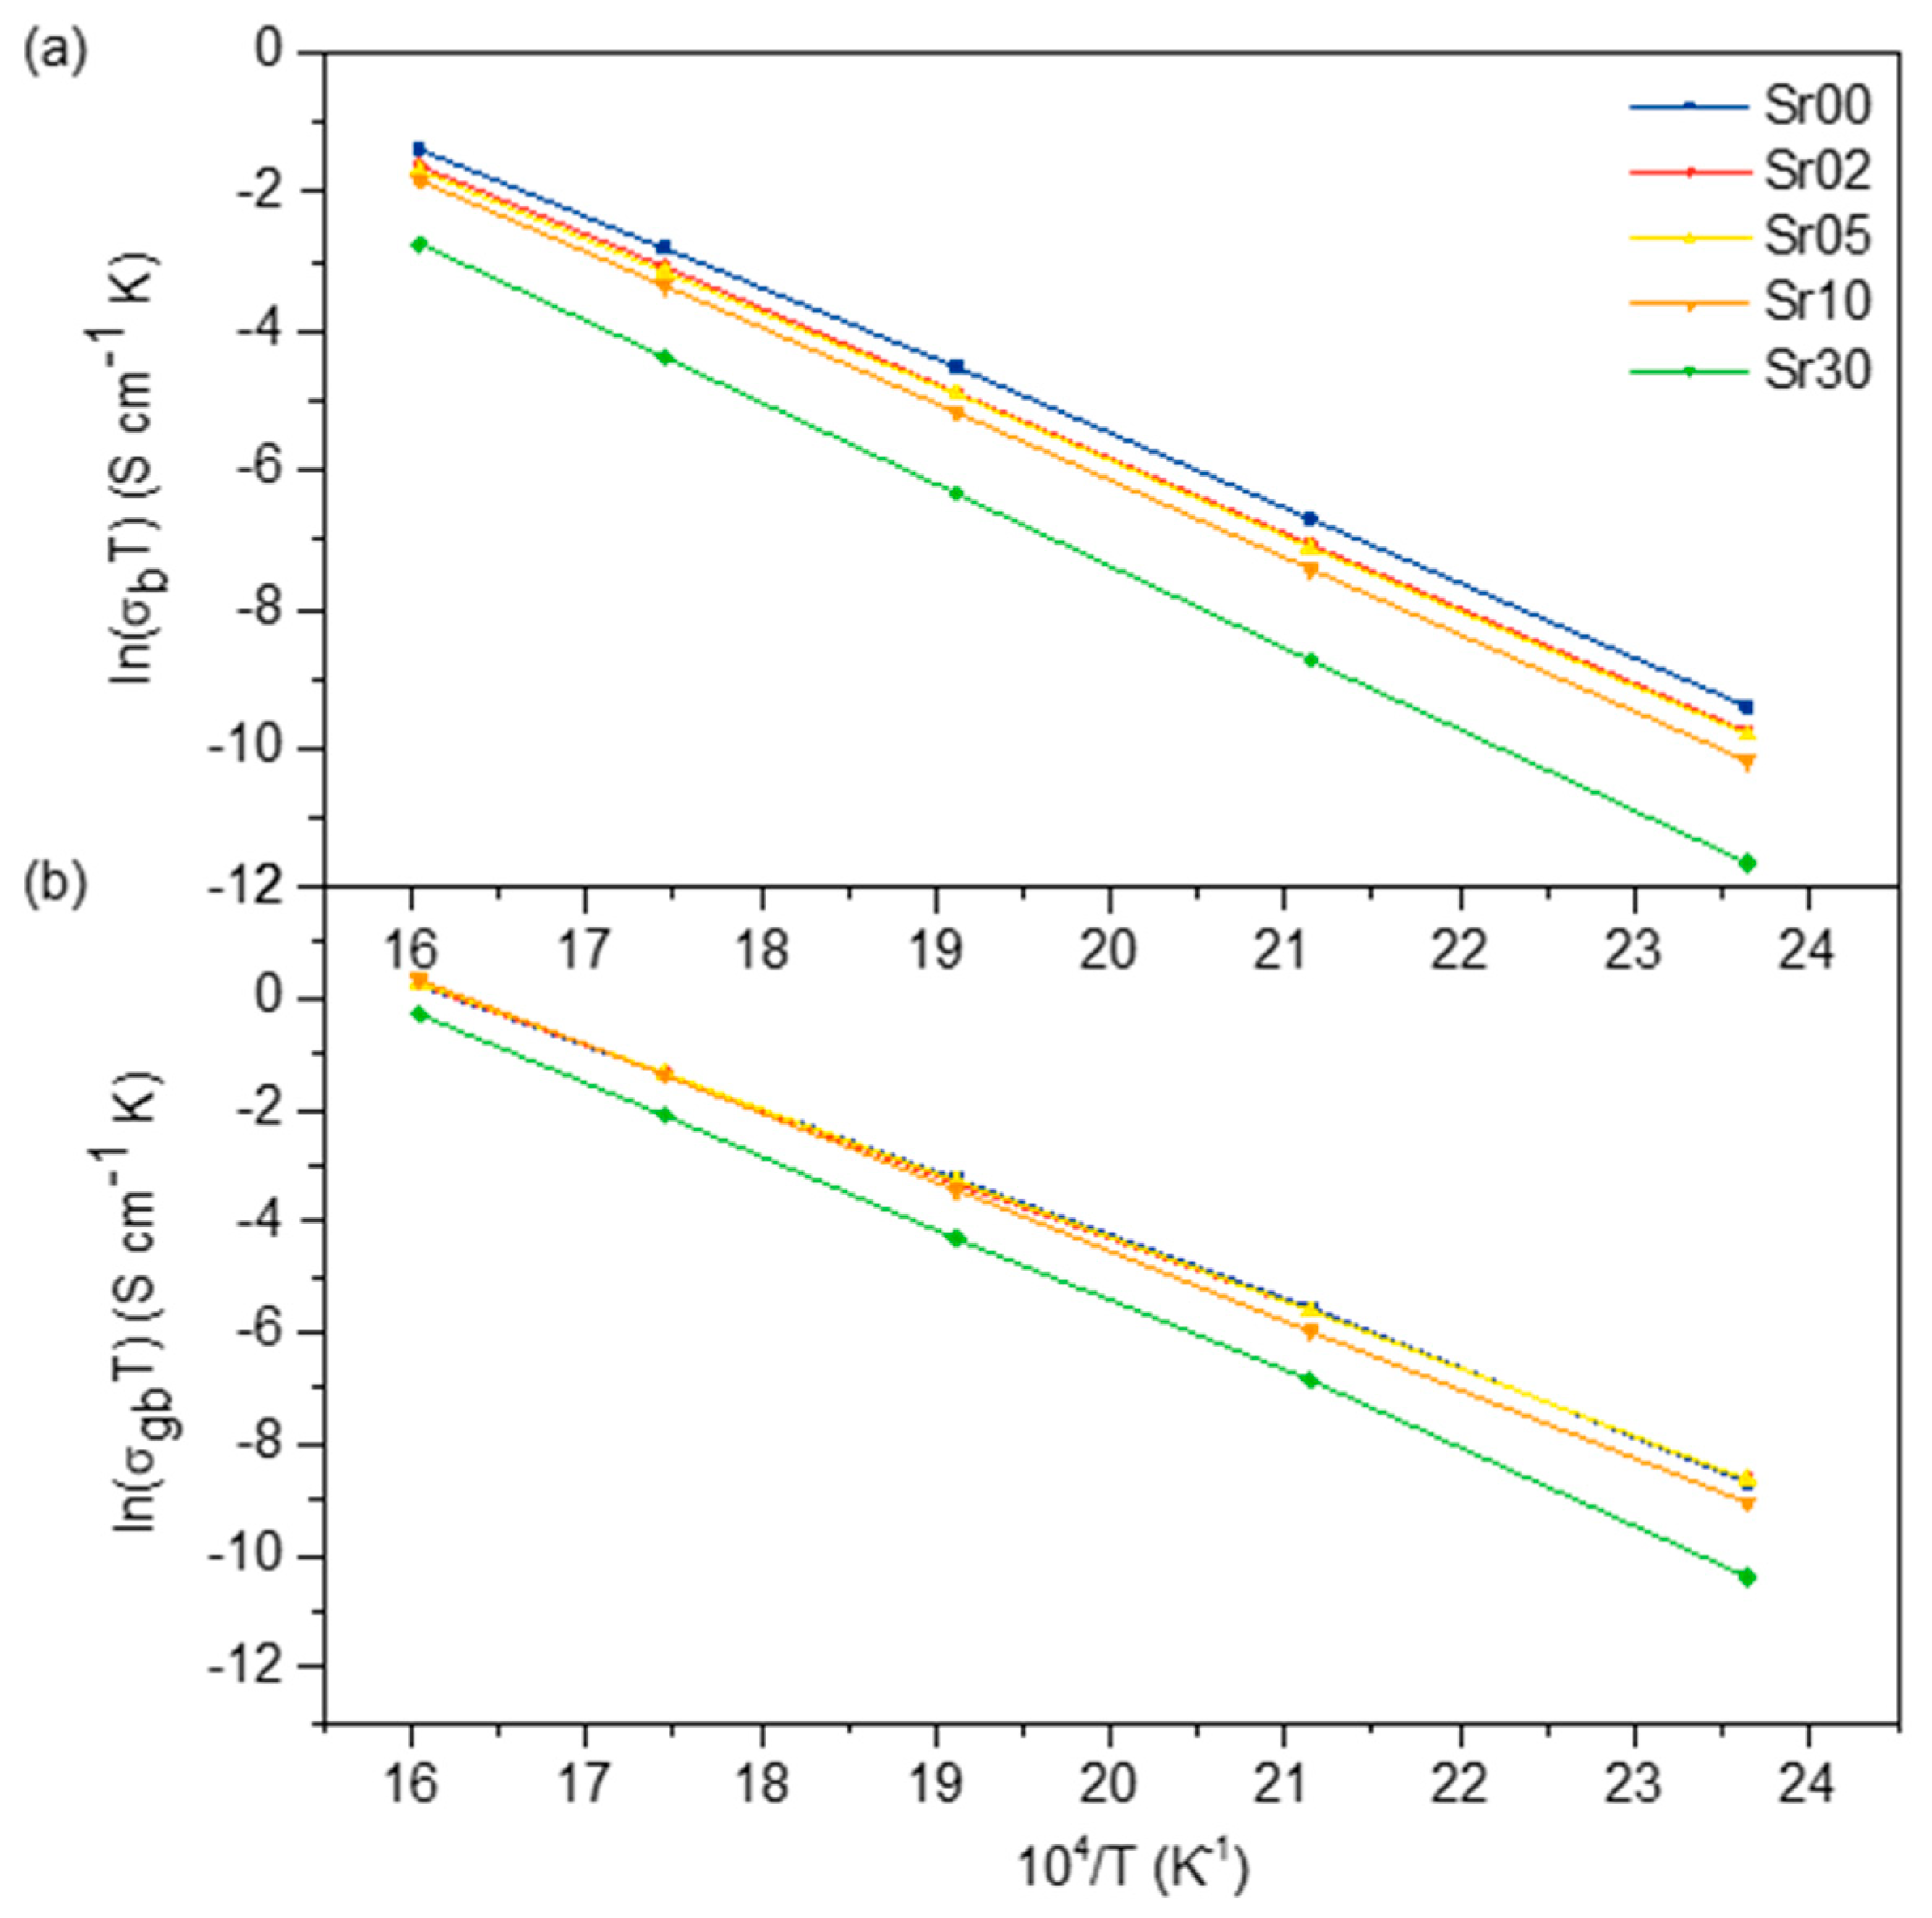
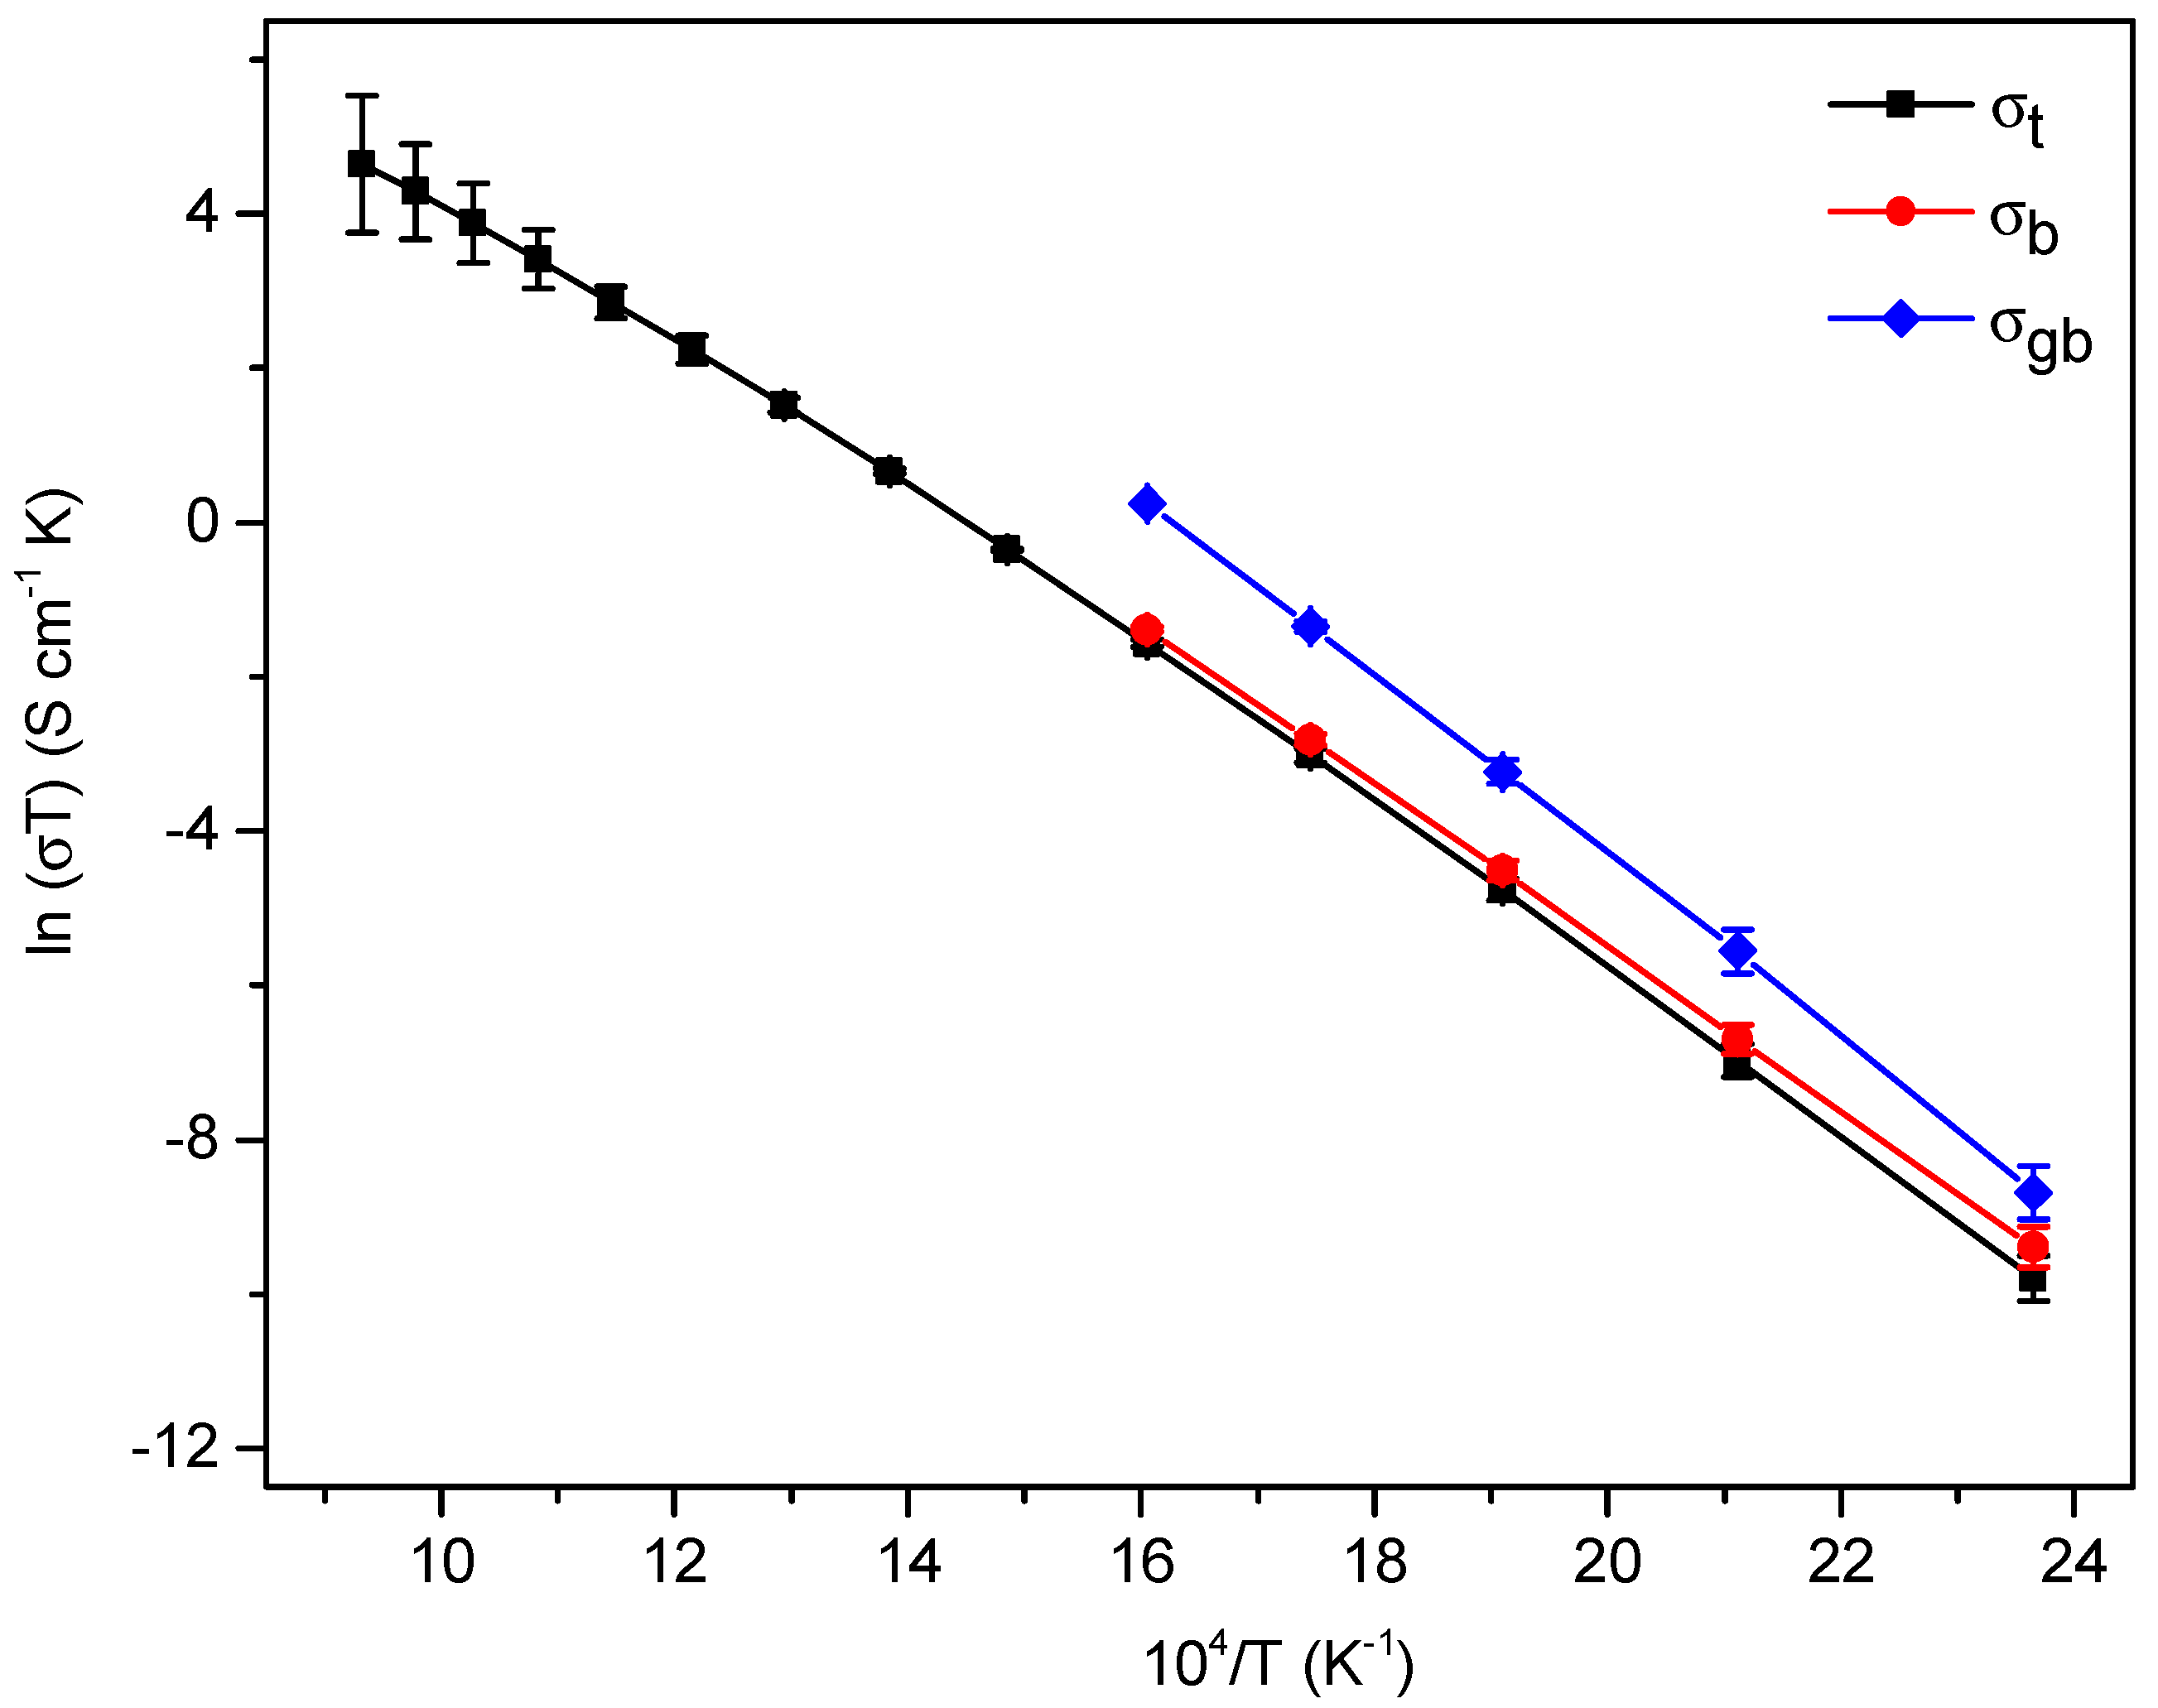
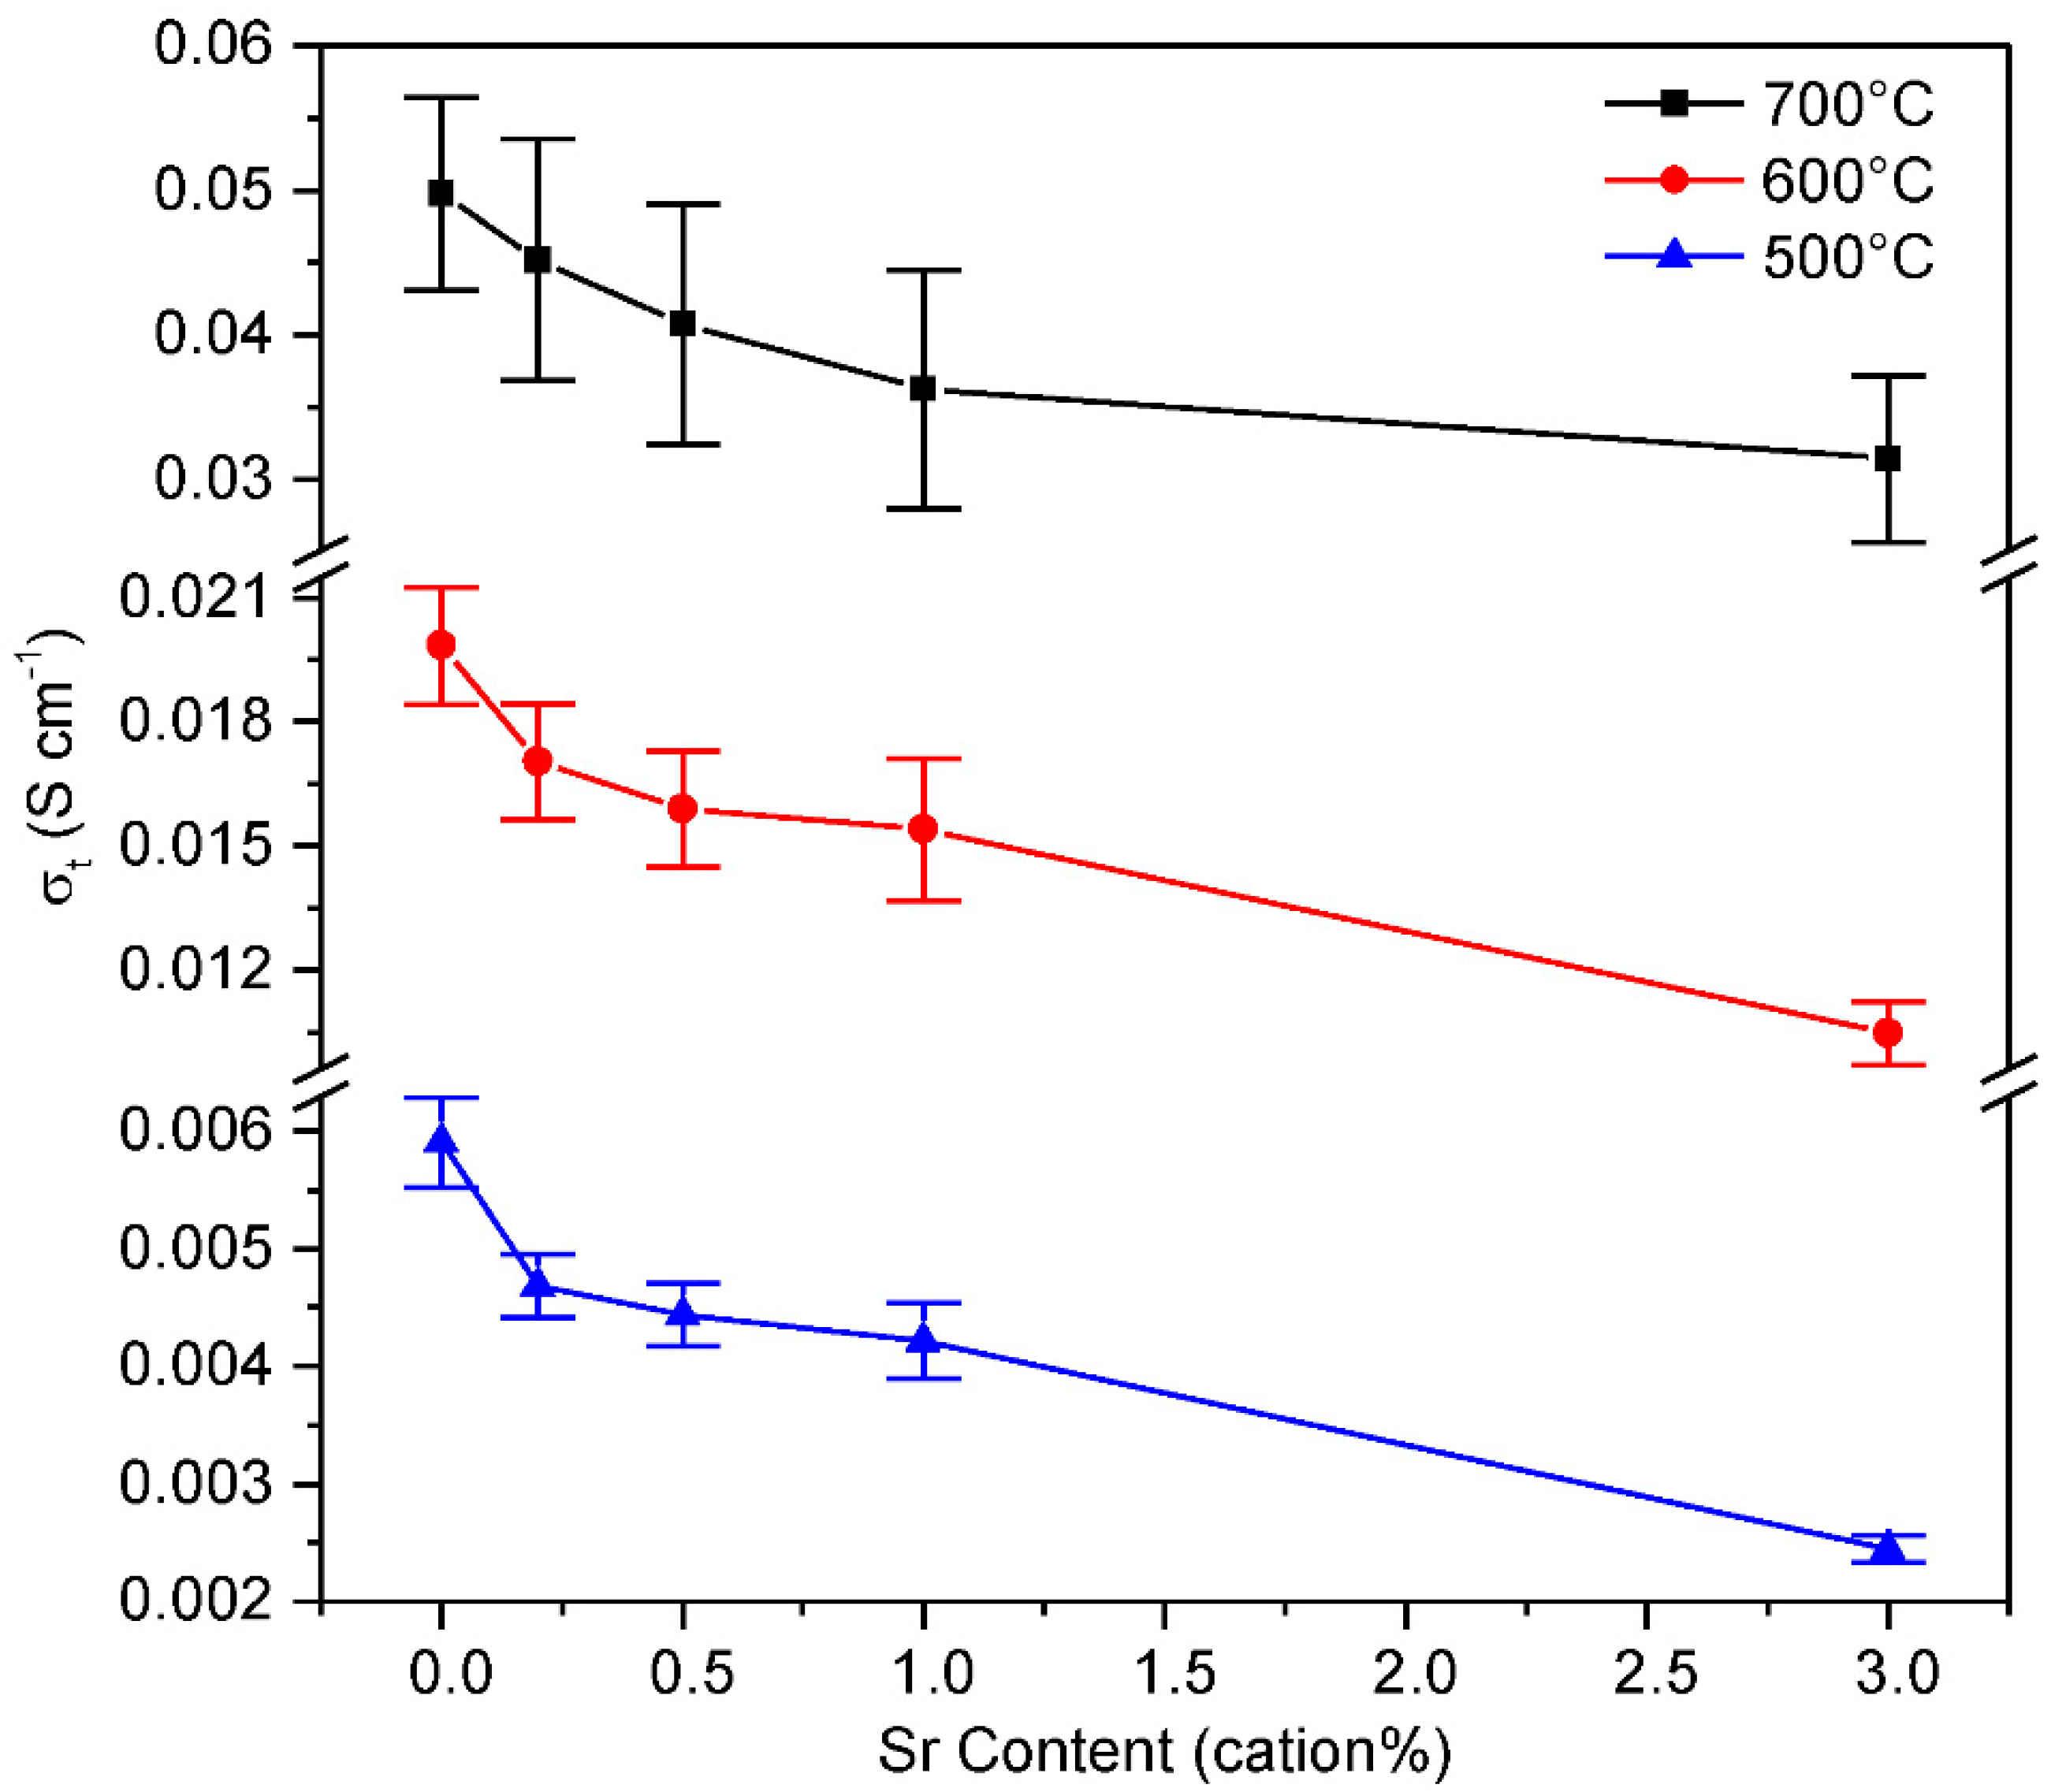
3.3. Electrical Properties
4. Discussion
4.1. Synthesis
4.2. Microstructure
4.3. Conductivity
5. Conclusions
Author Contributions
Funding
Data Availability Statement
Acknowledgments
Conflicts of Interest
References
- Minh, N.M.; Takahashi, T. Science and Technology of Ceramic Fuel Cells, 1st ed.; Elsevier: New York, NY, USA, 1995; pp. 1–14. [Google Scholar]
- Sharifzadeh, M. (Ed.) Design and Operation of Solid Oxide Fuel Cells: The Systems Engineering Vision; Elsevier: New York, NY, USA, 2019. [Google Scholar]
- Fergus, J.W.; Hui, R.; Li, X.; Wilkinson, D.P.; Zhang, J. (Eds.) Solid Oxide Fuel Cells: Materials Properties and Performance; CRC Press: Boca Raton, FL, USA, 2019. [Google Scholar]
- Huang, K.; Goodenough, J.B. Solid Oxide Fuel Cell Technology: Principles, Performance and Operations; Elsevier: New York, NY, USA, 2009. [Google Scholar]
- Wachsman, E.D.; Lee, K.T. Lowering the Temperature of Solid Oxide Fuel Cells. Science 2011, 334, 935–939. [Google Scholar] [CrossRef]
- Jacobson, A.J. Materials for Solid Oxide Fuel Cells. Chem. Mater. 2010, 22, 660–674. [Google Scholar] [CrossRef]
- Leah, R.; Bone, A.; Lankin, M.; Selcuk, A.; Pierce, R.; Rees, L.; Corcoran, D.; Muhl, P.; Dehaney-Steven, Z.; Brackenbury, C.; et al. Low-Cost, REDOX-Stable, Low-Temperature SOFC Developed by Ceres Power for Multiple Applications: Latest Development Update. ECS Trans. 2013, 57, 461–470. [Google Scholar] [CrossRef]
- Coles-Aldridge, A.V.; Baker, R.T. Ionic conductivity in multiply substituted ceria-based electrolytes. Solid State Ion. 2018, 316, 9–19. [Google Scholar] [CrossRef] [Green Version]
- Coles-Aldridge, A.V.; Baker, R.T. Oxygen ion conductivity in ceria-based electrolytes co-doped with samarium and gadolinium. Solid State Ion. 2020, 347, 115255. [Google Scholar] [CrossRef]
- Lane, J.; Neff, J.; Christie, G. Mitigation of the deleterious effect of silicon species on the conductivity of ceria electrolytes. Solid State Ion. 2006, 177, 1911–1915. [Google Scholar] [CrossRef]
- Yeh, T.-H.; Chou, C.-C. Ionic conductivity investigation in samarium and strontium co-doped ceria system. Phys. Scr. 2007, T129, 303–307. [Google Scholar] [CrossRef]
- Kim, D.K.; Cho, P.S.; Lee, J.-H.; Kim, D.-Y.; Park, H.-M.; Auchterlonie, G.; Drennan, J. Mitigation of highly resistive grain-boundary phase in gadolinia-doped ceria by the addition of SrO. Electrochem. Solid-State Lett. 2007, 10, 91–95. [Google Scholar] [CrossRef]
- Cioateră, N.; Pârvulescu, V.; Rolle, A.; Vannier, R.N. Effect of strontium addition on europium-doped ceria properties. Solid State Ion. 2009, 180, 681–687. [Google Scholar] [CrossRef]
- Ramesh, S.; Reddy, C.V. Properties of Al2O3–Sm2O3–CeO2 electrolyte. Acta Phys. Pol. A 2009, 115, 909–913. [Google Scholar] [CrossRef]
- Zheng, Y.; He, S.; Ge, L.; Zhou, M.; Chen, H.; Guo, L. Effect of Sr on Sm-doped ceria electrolyte. Int. J. Hydrog. Energy 2011, 36, 5128–5135. [Google Scholar] [CrossRef]
- Buchi Suresh, M.; Johnson, R. The effect of strontium doping on densification and electrical properties of Ce0.8Gd0.2O2−δ electrolyte for IT-SOFC application. Ionics 2012, 18, 291–297. [Google Scholar]
- Ramesh, S.; Raju, K.C.J.; Reddy, C.V. Synthesis and Characterization of Co-Doped Ceria Ceramics by Sol-Gel Method. Trans. Indian Ceram. Soc. 2011, 70, 143–147. [Google Scholar] [CrossRef]
- Júnior, J.M.S.; Malta, L.F.B.; Garrido, F.M.S.; Ogasawara, T.; Medeiros, M.E. Raman and Rietveld structural characterization of sintered alkaline earth doped ceria. Mater. Chem. Phys. 2012, 135, 957–964. [Google Scholar] [CrossRef]
- Gao, Z.; Liu, X.; Bergman, B.; Zhao, Z. Enhanced ionic conductivity of Ce0.8Sm0.2O2−δ by Sr addition. J. Power Sources 2012, 208, 225–231. [Google Scholar] [CrossRef]
- Horovistiz, A.L.; Muccillo, E.N.S. Microstructural and electrical characterizations of chemically prepared Ce0.8Gd0.2−x(Ag, Sr)xO1.9 (0 ≤ x ≤ 0.02). Solid State Ion. 2012, 225, 428–431. [Google Scholar] [CrossRef]
- Jaiswal, N.; Kumar, D.; Upadhyay, S.; Parkash, O. Effect of Mg and Sr co-doping on the electrical properties of ceria-based electrolyte materials for intermediate temperature solid oxide fuel cells. J. Alloy. Compd. 2013, 577, 456–462. [Google Scholar] [CrossRef]
- Jaiswal, N.; Upadhyay, S.; Kumar, D.; Parkash, O. Sm3+ and Sr2+ co-doped ceria prepared by citrate–nitrate auto-combustion method. Int. J. Hydrog. Energy 2014, 39, 543–551. [Google Scholar] [CrossRef]
- Kashyap, D.; Patro, P.K.; Lenka, R.K.; Mahata, T.; Sinha, P.K. Effects of Gd and Sr co-doping in CeO2 for electrolyte application in solid oxide fuel cell (SOFC). Ceram. Int. 2014, 40, 11869–11875. [Google Scholar] [CrossRef]
- Yamamura, H.; Katoh, E.; Ichikawa, M.; Kakinuma, K.; Mori, T.; Haneda, H. Multiple doping effect on the electrical conductivity in the (Ce1−x−yLaxMy)O2−δ (M = Ca, Sr) system. Electrochem 2000, 68, 455–459. [Google Scholar] [CrossRef] [Green Version]
- Kosinski, M.R.; Baker, R.T. Preparation and property–performance relationships in samarium-doped ceria nanopowders for solid oxide fuel cell electrolytes. J. Power Sources 2011, 196, 2498–2512. [Google Scholar] [CrossRef]
- Inaba, H.; Tagawa, H. Ceria-based solid electrolytes. Solid State Ion. 1996, 83, 1–16. [Google Scholar] [CrossRef]
- Kilner, J. Fast oxygen transport in acceptor doped oxides. Solid State Ion. 2000, 129, 13–23. [Google Scholar] [CrossRef]
- Chen, P.-L.; Chen, I. Role of defect interaction in boundary mobility and cation diffusivity of CeOz. J. Am. Ceram. Soc. 1994, 77, 2289–2297. [Google Scholar] [CrossRef]
- Li, Z.-P.; Mori, T.; Zou, J. Drennan, Defects clustering and ordering in di- and trivalently doped ceria. J. Mater. Res. Bull. 2013, 48, 807–812. [Google Scholar] [CrossRef]
- Ye, F.; Ou, D.R.; Mori, T. Microstructural evolution in a CeO2-Gd2O3 system. Microsc. Microanal. 2012, 18, 162–170. [Google Scholar] [CrossRef] [PubMed]
- Steele, B.C.H. Appraisal of Ce1−yGdyO2−y/2 electrolytes for IT-SOFC operation at 500 °C. Solid State Ion. 2000, 129, 95–110. [Google Scholar] [CrossRef]
- Rahaman, M.N. Sintering of Ceramics, 1st ed.; CRC Press: Boca Raton, FL, USA, 2008; pp. 105–172. [Google Scholar]
- Irvine, J.T.S.; Sinclair, D.C.; West, A.R. Electroceramics: Characterization by Impedance Spectroscopy. Adv. Mater. 1990, 2, 132–138. [Google Scholar] [CrossRef]
- Faber, J.; Geoffroy, C.; Roux, A.; Sylvestre, A.; Abelard, P. A Systematic investigation of the dc electrical conductivity of rare-earth doped ceria. Appl. Phys. A Solids Surfaces 1989, 49, 225–232. [Google Scholar] [CrossRef]
- Balazs, G.; Glass, R. ac impedance studies of rare earth oxide doped ceria. Solid State Ion. 1995, 76, 155–162. [Google Scholar] [CrossRef]
- Yahiro, H.; Eguchi, K.; Arai, H. Electrical properties and reducibilities of ceria-rare earth oxide systems and their application to solid oxide fuel cell. Solid State Ion. 1989, 36, 71–75. [Google Scholar] [CrossRef]
- Huang, W.; Shuk, P.; Greenblatt, M. Properties of sol-gel prepared Ce1−xSmxO2−x2 solid electrolytes. Solid State Ion. 1997, 100, 23–27. [Google Scholar] [CrossRef]
- Fu, Y.-P.; Wen, S.-B.; Lu, C.-H. Preparation and Characterization of Samaria-Doped Ceria Electrolyte Materials for Solid Oxide Fuel Cells. J. Am. Ceram. Soc. 2008, 91, 127–131. [Google Scholar] [CrossRef]
- Yahiro, H.; Eguchi, Y.; Eguchi, K.; Arai, H. Oxygen ion conductivity of the ceria-samarium oxide system with fluorite structure. J. Appl. Electrochem. 1988, 18, 527–531. [Google Scholar] [CrossRef]
- Yoshida, H.; Deguchi, H.; Miura, K.; Horiuchi, M.; Inagaki, T. Investigation of the relationship between the ionic conductivity and the local structures of singly and doubly doped ceria compounds using EXAFS measurement. Solid State Ion. 2001, 140, 191–199. [Google Scholar] [CrossRef]
- Burbano, M.; Nadin, S.; Marrocchelli, D.; Salanne, M.; Watson, G.W. Ceria co-doping: Synergistic or average effect? Phys. Chem. Chem. Phys. 2014, 16, 8320–8331. [Google Scholar] [CrossRef] [Green Version]
- Omar, S.; Wachsman, E.; Nino, J. A co-doping approach towards enhanced ionic conductivity in fluorite-based electrolytes. Solid State Ion. 2006, 177, 3199–3203. [Google Scholar] [CrossRef]


| Sample | Ce (Cation%) | Sm (Cation%) | Sr (Cation%) | Gd (Cation%) | Total Minor Lanthanides (Cation%) |
|---|---|---|---|---|---|
| Sr00 | 79.1 ± 1.3 | 20.3 ± 0.4 | - | 0.47 ± 0.02 | 0.14 |
| Sr02 | 78.9 ± 1.3 | 20.4 ± 0.3 | 0.2 ± 0.07 | 0.46 ± 0.003 | 0.13 |
| Sr20 | 77.5 ± 2.5 | 20.0 ± 0.6 | 1.9 ± 0.06 | 0.45 ± 0.02 | 0.13 |
| Sr40 | 75.4 ± 0.9 | 20.2 ± 0.4 | 3.8 ± 0.06 | 0.44 ± 0.006 | 0.13 |
Publisher’s Note: MDPI stays neutral with regard to jurisdictional claims in published maps and institutional affiliations. |
© 2021 by the authors. Licensee MDPI, Basel, Switzerland. This article is an open access article distributed under the terms and conditions of the Creative Commons Attribution (CC BY) license (https://creativecommons.org/licenses/by/4.0/).
Share and Cite
Sherwood, T.; Baker, R.T. Effects of Strontium Content on the Microstructure and Ionic Conductivity of Samarium-Doped Ceria. Solids 2021, 2, 293-313. https://doi.org/10.3390/solids2030019
Sherwood T, Baker RT. Effects of Strontium Content on the Microstructure and Ionic Conductivity of Samarium-Doped Ceria. Solids. 2021; 2(3):293-313. https://doi.org/10.3390/solids2030019
Chicago/Turabian StyleSherwood, Toby, and Richard T. Baker. 2021. "Effects of Strontium Content on the Microstructure and Ionic Conductivity of Samarium-Doped Ceria" Solids 2, no. 3: 293-313. https://doi.org/10.3390/solids2030019
APA StyleSherwood, T., & Baker, R. T. (2021). Effects of Strontium Content on the Microstructure and Ionic Conductivity of Samarium-Doped Ceria. Solids, 2(3), 293-313. https://doi.org/10.3390/solids2030019