Article

Effects of Strontium Content on the Microstructure and Ionic Conductivity of Samarium-Doped Ceria

School of Chemistry, University of St Andrews, North Haugh St Andrews, Fife, Scotland KY16 9ST, UK
*
Author to whom correspondence should be addressed.
Solids 2021, 2(3), 293-313; https://doi.org/10.3390/solids2030019
Submission received: 4 June 2021 / Revised: 4 August 2021 / Accepted: 5 August 2021 / Published: 10 August 2021

Abstract

:
Due to its high oxygen ion conductivity at elevated temperatures, samarium-doped ceria (SDC) is a very promising material for application in solid state electrochemical devices and especially in the electrolytes of solid oxide fuel cells. Several prior studies have reported a further improvement in the ionic conductivity of SDC on doping with small amounts of strontium. It is suggested that strontium acts as a sintering aid—improving the microstructure of SDC—and as a scavenger of silicon impurities, decreasing its tendency to form resistive phases at grain boundaries. However, because of the range of preparation methods and the resulting differences in microstructure and silicon levels, some inconsistencies exist in the literature. Furthermore, the effect of strontium on the intrinsic (bulk) conductivity of SDC is not often discussed. To address these issues, a systematic, combined microstructural and conductivity study has been performed on a compositional series with a range of strontium contents, Ce0.8−xSm0.2SrxO2−δ (x = 0, 0.002, 0.005, 0.01, 0.02, 0.03, 0.04). A low temperature synthesis affording products with low silicon was employed. Total bulk and grain boundary conductivity data were obtained over a wide temperature range. Increasing strontium content caused a general decrease in total and intrinsic conductivity, but there was an improvement in grain boundary conductivity at the lowest strontium levels. These results were interpreted by reference to the microstructures using, among other parameters, the blocking, and normalised blocking, factors.

Graphical Abstract

1. Introduction

Solid oxide fuel cells (SOFC) are of great interest because of their ability to efficiently and cleanly convert the chemical potential energy of a fuel and oxidant directly into electrical energy and useful heat [1,2,3,4]. There is interest in reducing the operating temperature of SOFCs [5]. At lower temperatures, cheaper metallic interconnects and supports can be used and the rates of undesirable solid state reactions, which degrade performance, are decreased. The electrolyte, which is usually an oxygen ion conductor, is an important component of the SOFC and largely determines the operating characteristics of the fuel cell. Early SOFC were mostly based on yttria-stabilised zirconia (YSZ) electrolytes and operate at 800–1000 °C [6]. A reduction in operating temperature to below 600 °C is desirable in order to realise the benefits outlined above. Lanthanide-doped ceria-based electrolytes display high ionic conductivities at these temperatures and have been used successfully in the manufacture of SOFCS [7,8]. Gadolinium and samarium are the most common dopants used in ceria electrolytes, as they give rise to some of the highest conductivities, an order of magnitude higher than for YSZ at 600 °C [6,9]. Despite the success of these materials, clearly there is still an advantage in developing materials with even higher conductivity to either reduce operating temperatures or increase power output. As the limits of conductivity in ceria doped with a single species are approached, there is interest in whether doping with multiple species can result in higher conductivities.
A number of papers have been published since 2007 looking at the effects of co-doping with strontium in lanthanide-doped ceria [10,11,12,13,14,15,16,17,18,19,20,21,22,23]. Doping strategies include substituting strontium for the co-dopant only, substituting strontium for cerium only, substituting strontium for equal molar fractions of the co-dopant and cerium and substituting half as much strontium as the mole fraction of cation removed. The choice of strategy affects the variation in oxygen vacancy concentration, [VO], and average cation radius.
Initial studies by Lane et al. [10] and Kim et al. [12] considered strontium co-doping as a method to reduce the deleterious effects of silicon impurities on the conductivity of gadolinium doped ceria [10,12]. Silicon is a common and ubiquitous element and often occurs as an impurity in many of the simple oxides and nitrates—of mineral origin—employed as starting materials for the preparation of SOFC electrolyte materials. In addition to this, silicon can be incorporated during milling and grinding of precursor solids with Si-containing media, and from treatments, especially at high temperature, in glass and ceramic containers. Co-doping with just a few cation percent of strontium was shown to be extremely effective, nearly eliminating the effects of silicon impurities. This effect was said by Lane et al. to be caused by the incorporation of silicon into a second phase, which was suggested to form at grain boundary triple points, leaving most of the boundary silicon-free, and therefore able to conduct freely [10]. However, Kim et al. suggested that it was unclear if this was definitely the mechanism [12]. These authors also noted an improvement in sinterability when strontium was added, and this has since been confirmed by almost all sintering studies on strontium co-doping. Subsequently, a number of studies have looked more specifically at the effects of strontium co-doping on conductivity. All studies showed an increase in total conductivity for at least one sample with strontium co-doping compared to a singly doped sample [10,11,12,13,14,15,16,17,19,20,22]. More generally, however, if co-doping is to be shown to be beneficial to conductivity, then it needs to result in materials with conductivities higher than those of the best singly doped materials. Only one of the strontium co-doped materials in the literature shows total conductivity comparable with the best singly doped materials [22]. Comparing the most conductive strontium co-doped sample to the singly doped sample in each study shows that in most cases, the increase in total conductivity was as a result of an increase in the grain boundary conductivity only. Only one study showed a significant increase in the intrinsic, bulk conductivity of the most conductive sample [22], whilst two showed slight increases [17,20], and the remainder either showed it to be unchanged or decreased [10,12,13,16,20], or did not report bulk conductivities [11,14]. It is generally agreed that the improved grain boundary conductivity observed in all the studies can be explained by the role of strontium as a silicon scavenger and sintering aid. Additional explanations for increased conductivity are however suggested by some studies. Yeh et al. state that doping increases the radius of oxygen vacancies and so widens the oxygen-conducting channels [11], whilst Gao et al. [19] attribute increased conductivity to a combination of increased oxygen vacancy concentration and a suppression of ordering of vacancies due to changes in the configurational entropy reported by Yamamura et al. [24]. Jaiswal et al. [22] also cite the ordering effect.
The current study is designed to address the inconsistencies in the published conductivity values for Sr co-doped materials. The differences in conductivity are thought to be due to variation in preparation methods causing differences in the microstructure and impurity levels—especially between studies—which makes it difficult to determine which parameters control ionic conductivity. Therefore, a combined microstructural and conductivity study has been carried out, in order to clarify the relationships between chemical composition, microstructure and ionic conductivity. To reduce the potential influence of impurities and of variations in starting powder microstructure on the conductivity results, the ceramic precursor powders were synthesised by the citrate–nitrate method described by Kosinski and Baker [25]. This method yields very pure powders with fine and reproducible microstructure. In order to make a good comparison with existing studies the most commonly used doping strategy of replacing Ce for Sr was used giving the compositional series Ce0.8−xSm0.2SrxO2−δ. The range of Sr concentrations was chosen to include particularly low concentrations of Sr, x = 0.002 and x = 0.005 as most previous studies which looked at co-doping with a range of strontium concentrations showed the largest increase in total conductivity for the sample doped with the lowest fraction of strontium [11,13,14,17,19,20,22]. The lowest dopant concentrations studied previously were 1 cation% [10,13,16,20]. It was decided to investigate strontium doping levels below this value in order to see whether there was an advantage to doping in this range.

2. Experimental

Mixed oxide powders of Ce0.8−xSm0.2SrxO2−δ with x = 0 (Sr00), 0.002 (Sr02), 0.005 (Sr05), 0.01 (Sr10), 0.02 (Sr20), 0.03 (Sr30) and 0.04 (Sr40) were synthesised by a citrate–nitrate complexation method. Sm(NO3)3•6H2O (Alfa Aesar, Haverhill, MA, USA, 99.9%), Ce(NO3)3•6H2O (Alfa Aesar, 99.5%) and Sr(NO3)2 (Alfa Aesar, 99.97%) were dissolved separately in distilled water to form 0.1M solutions in the volumes required to obtain the final product stoichiometry. These solutions were stirred separately before combining and stirring further. A 0.2 M citric acid solution was made using anhydrous citric acid (Alfa Aesar, 99.5%) and added to the metal nitrate solution at a ratio of two moles of citric acid per mole of total metal ions. The resulting mixture was stirred for 12 h. The mixture was heated in an oil bath to 80 °C and stirred until all the water had evaporated and a dry yellow foam had formed. The foam was calcined in air in a muffle furnace at 250 °C for 2 h then at 500 °C for 2 h. Heating and cooling rates were 2.5 °C min−1 and 5.0 °C min−1, respectively. A yellow powder was obtained. The powder was milled at 400 rpm for 1 h in a planetary ball mill. A 45 mL nylon grinding bowl with 10 mm zirconia grinding balls in a 1:10 powder to ball mass ratio was used.
X-ray Diffraction (XRD) analysis of the powder products was performed using a PANalytical Empyrean diffractometer (voltage: 45 kV; current: 40 mA). The XRD patterns were recorded from 10° to 100° in 0.017°steps over a 1 h period. A monochromated X-ray source emitting pure Kα1 radiation was used. Rietveld refinement of the patterns was performed to confirm the structure and obtain the lattice parameters using HighScore Plus software from PANalytical. In addition, the Scherrer equation was used to calculate the average crystallite size.
Chemical analysis was performed by inductively coupled plasma mass spectrometry (ICP-MS) using an Agilent 7500ce. To prepare the material for ICP-MS analysis, samples of powder were dissolved in concentrated nitric acid by boiling for 24 h under reflux. Quantitative ICP-MS analysis of the concentrations of Ce, Sm, Sr, Si and Gd were performed. A full, less accurate, scan of all elements was also performed to check for unknown impurities. XRF chemical analysis was also performed using a SPECTRO XEPOS spectrometer, looking specifically at the concentration of Si.
The final microstructure of pellets sintered under different conditions was studied by SEM. Milled powders with all eight strontium contents from 0 to 4 cation% were pressed into 10 mm cylindrical pellets at 200 MPa and sintered in a tube furnace in static air at 1250 °C, 1350 °C or 1450 °C for 4 h. Samples were heated at 2 °C min−1 and cooled at 4 °C min−1. The resulting pellets were polished to a mirror finish and thermally etched by heating for 1 min at a temperature 50 °C below the temperature at which they were sintered, using the same ramp rates. The samples were coated with gold using a Quorum Technologies Q150R sputter coater, and SEM images were obtained using a JEOL JSM-6700F SEM equipped with a field emission gun. For each sample, ImageJ software was used to measure the areas of at least 300 grains from SEM images of several different regions. Average grain areas and grain area distributions were obtained from these data.
For electrical measurements, impedance spectroscopy was performed on sintered pellets of five compositions, Sr00, Sr02, Sr05, Sr10 and Sr30. The pellets were made by pressing 4 g of powder at 200 MPa in a 25 mm die. These were sintered at 1450 °C for 4 h and polished, both as described above. Pt electrodes of 12 mm diameter were deposited onto each face of the sintered pellets by screen-printing Pt ink (Engelhardt) and firing at 1000 °C. Pt wires (Alfa-Aesar, 99.9%) were attached to the electrodes. Samples were placed in a quartz reactor within a tube furnace and a flow of dried synthetic air (50 mL min−1) was established. Impedance spectra were obtained at temperatures from 150 to 800 °C at 50 °C intervals using a Solartron 1260 frequency response analyser. The amplitude of the applied AC voltage was 100 mV and the frequency was swept from 10 MHz to 0.1 Hz. The spectra were fitted using the ZView software from Scribner Associates and values for the total, bulk and grain boundary conductivities were obtained.
The densities of pellets pressed and sintered at 1450 °C for 4 h as described above were determined from their mass and dimensions.

3. Results

3.1. Synthesis

The elemental concentrations of the main cations, determined by ICP-MS, for selected samples are shown in Table 1. The concentrations of Sm and Sr are within the nominal values; however, Ce is around 0.5 cation% lower than expected. A small fraction of minor lanthanide elements was detected in all samples.
Rietveld refinements of the XRD data showed all compositions had a single phase fluorite Fm-3m crystal structure and the lattice parameter, a, was found to increase linearly with increasing strontium content, as shown in Figure 1a. The average crystallite size of the powders was also estimated from the extent of peak broadening in the XRD patterns using the Scherrer equation. Figure 1b shows that the values were in the range 6.5–11 nm and decreased with increasing strontium content in a roughly linear relationship. The densities of the pellets sintered at 1450 °C for 4 h were compared to the theoretical densities obtained from the XRD refinements to give the relative densities, which are plotted in Figure 1c. Relative density was found to increase with strontium content up to Sr10, after which it levelled off at 95–96%.

3.2. Microstructure

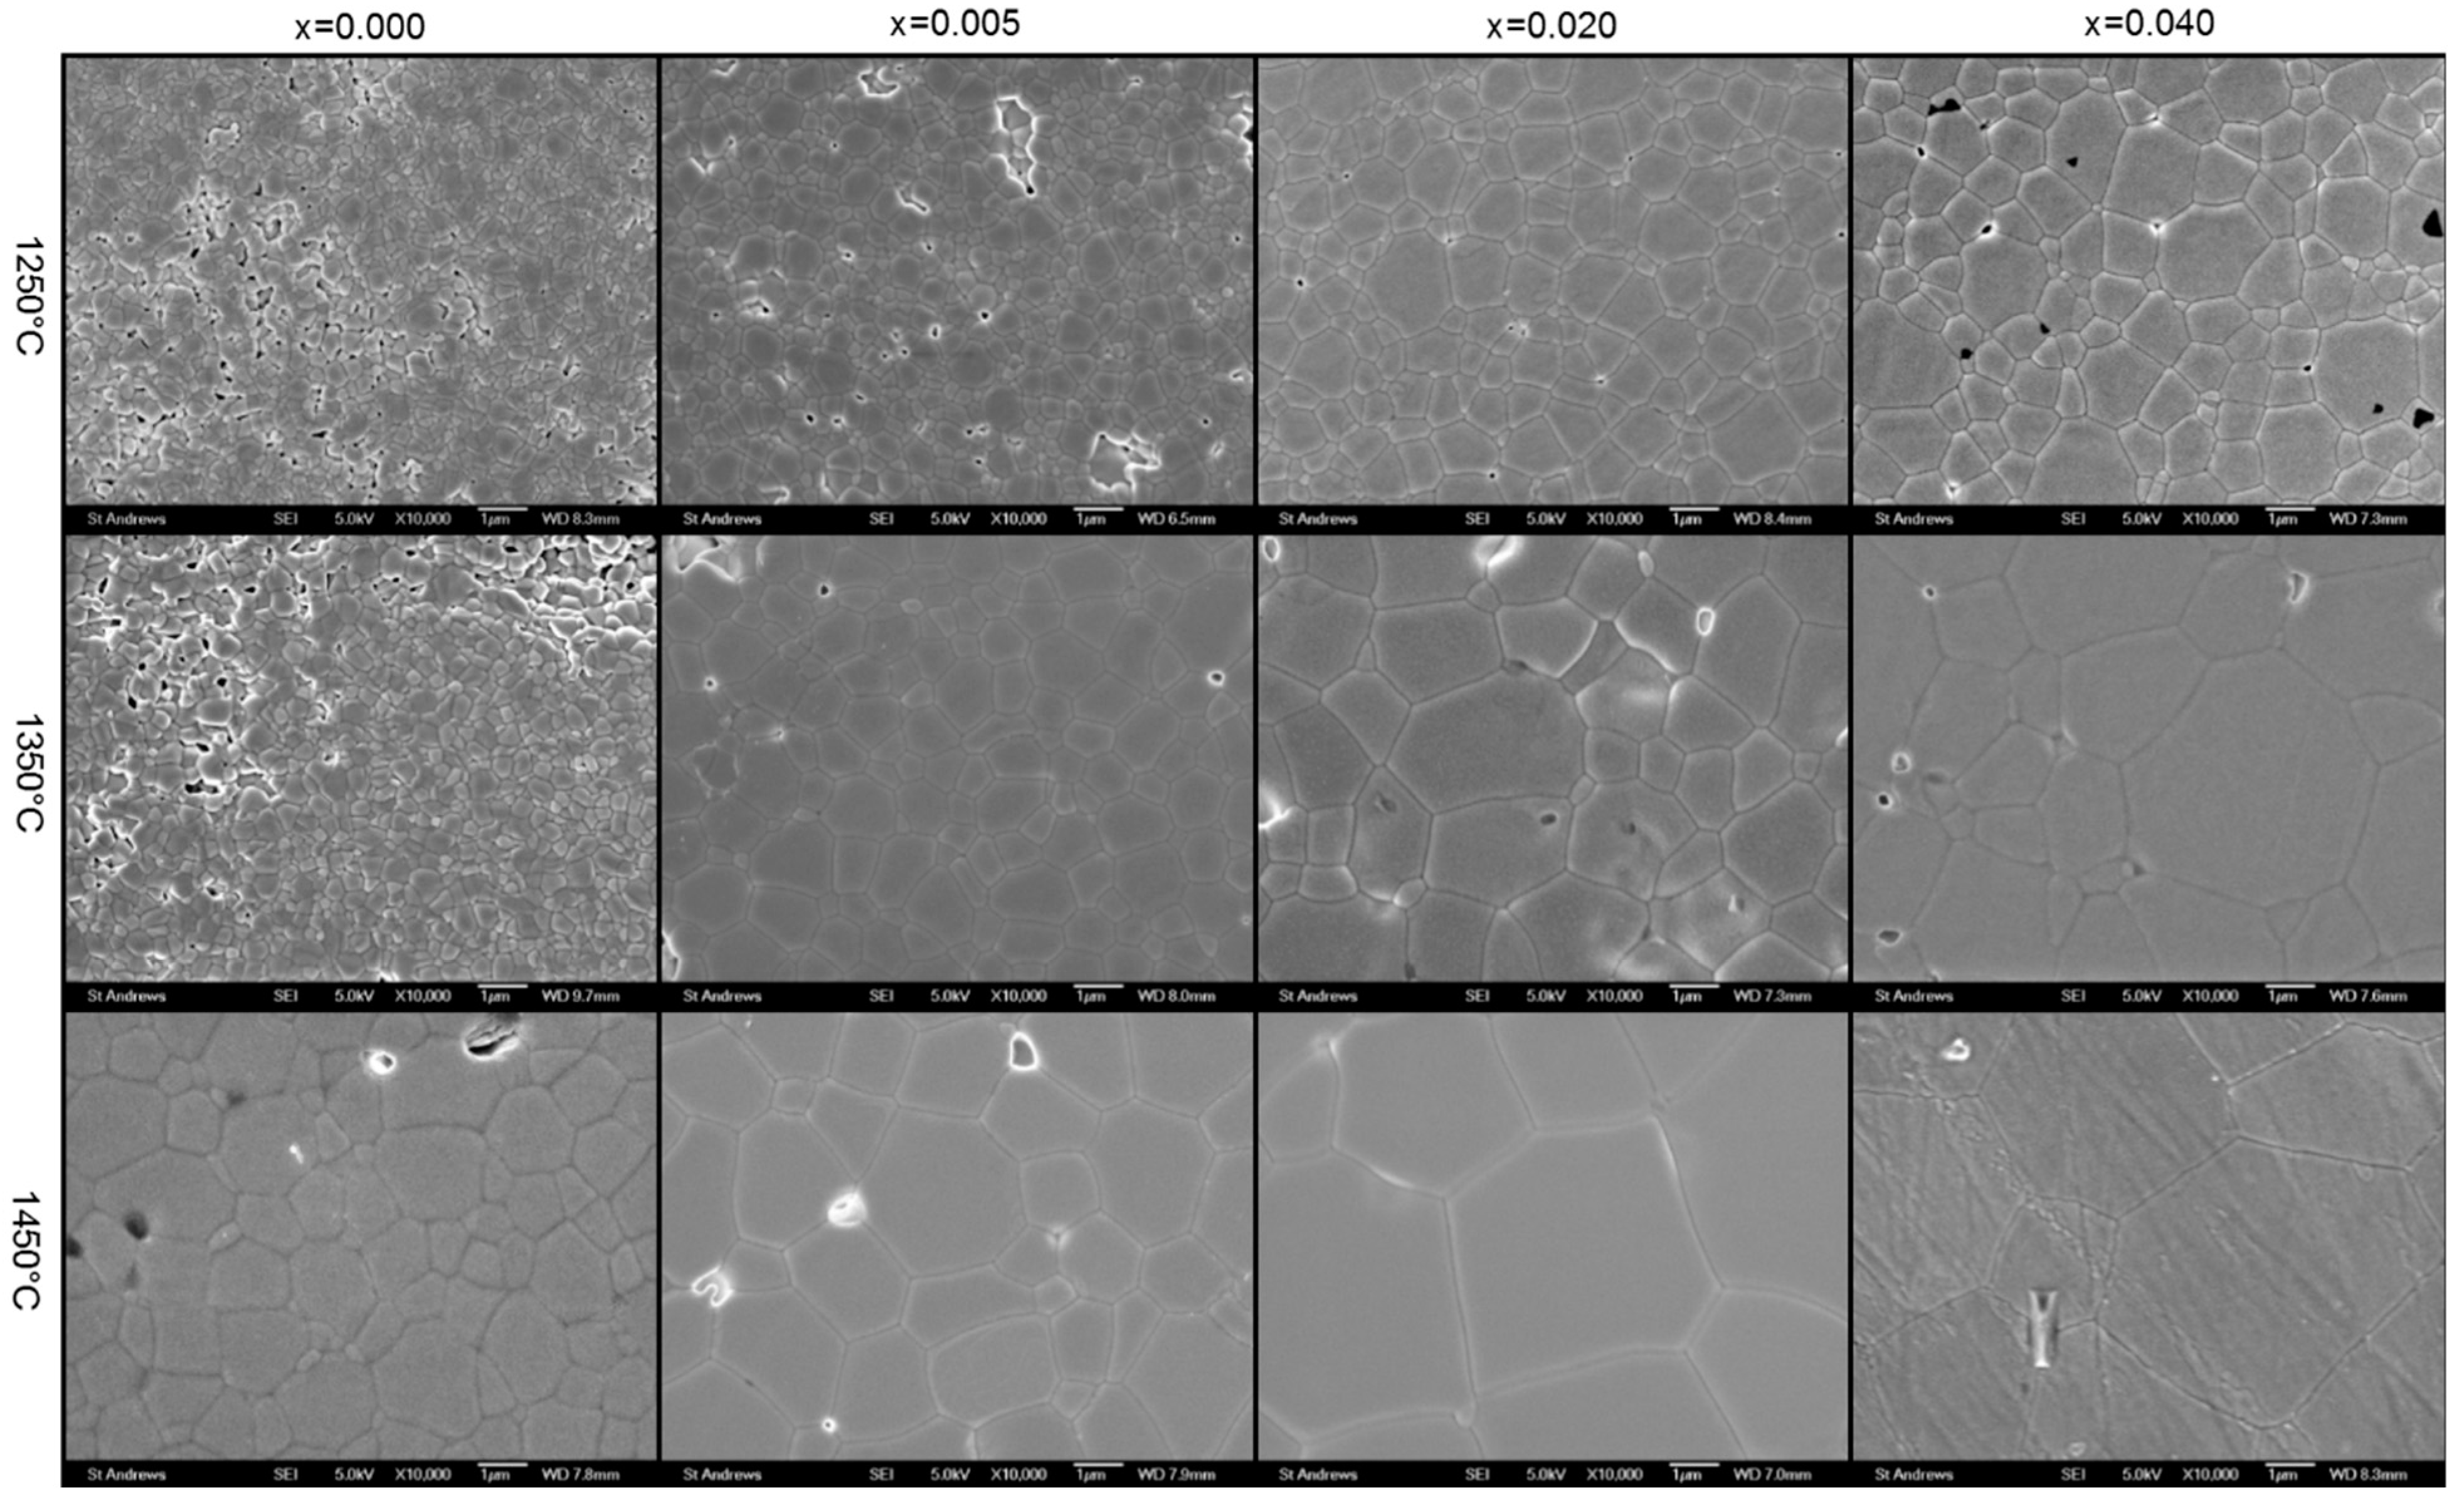
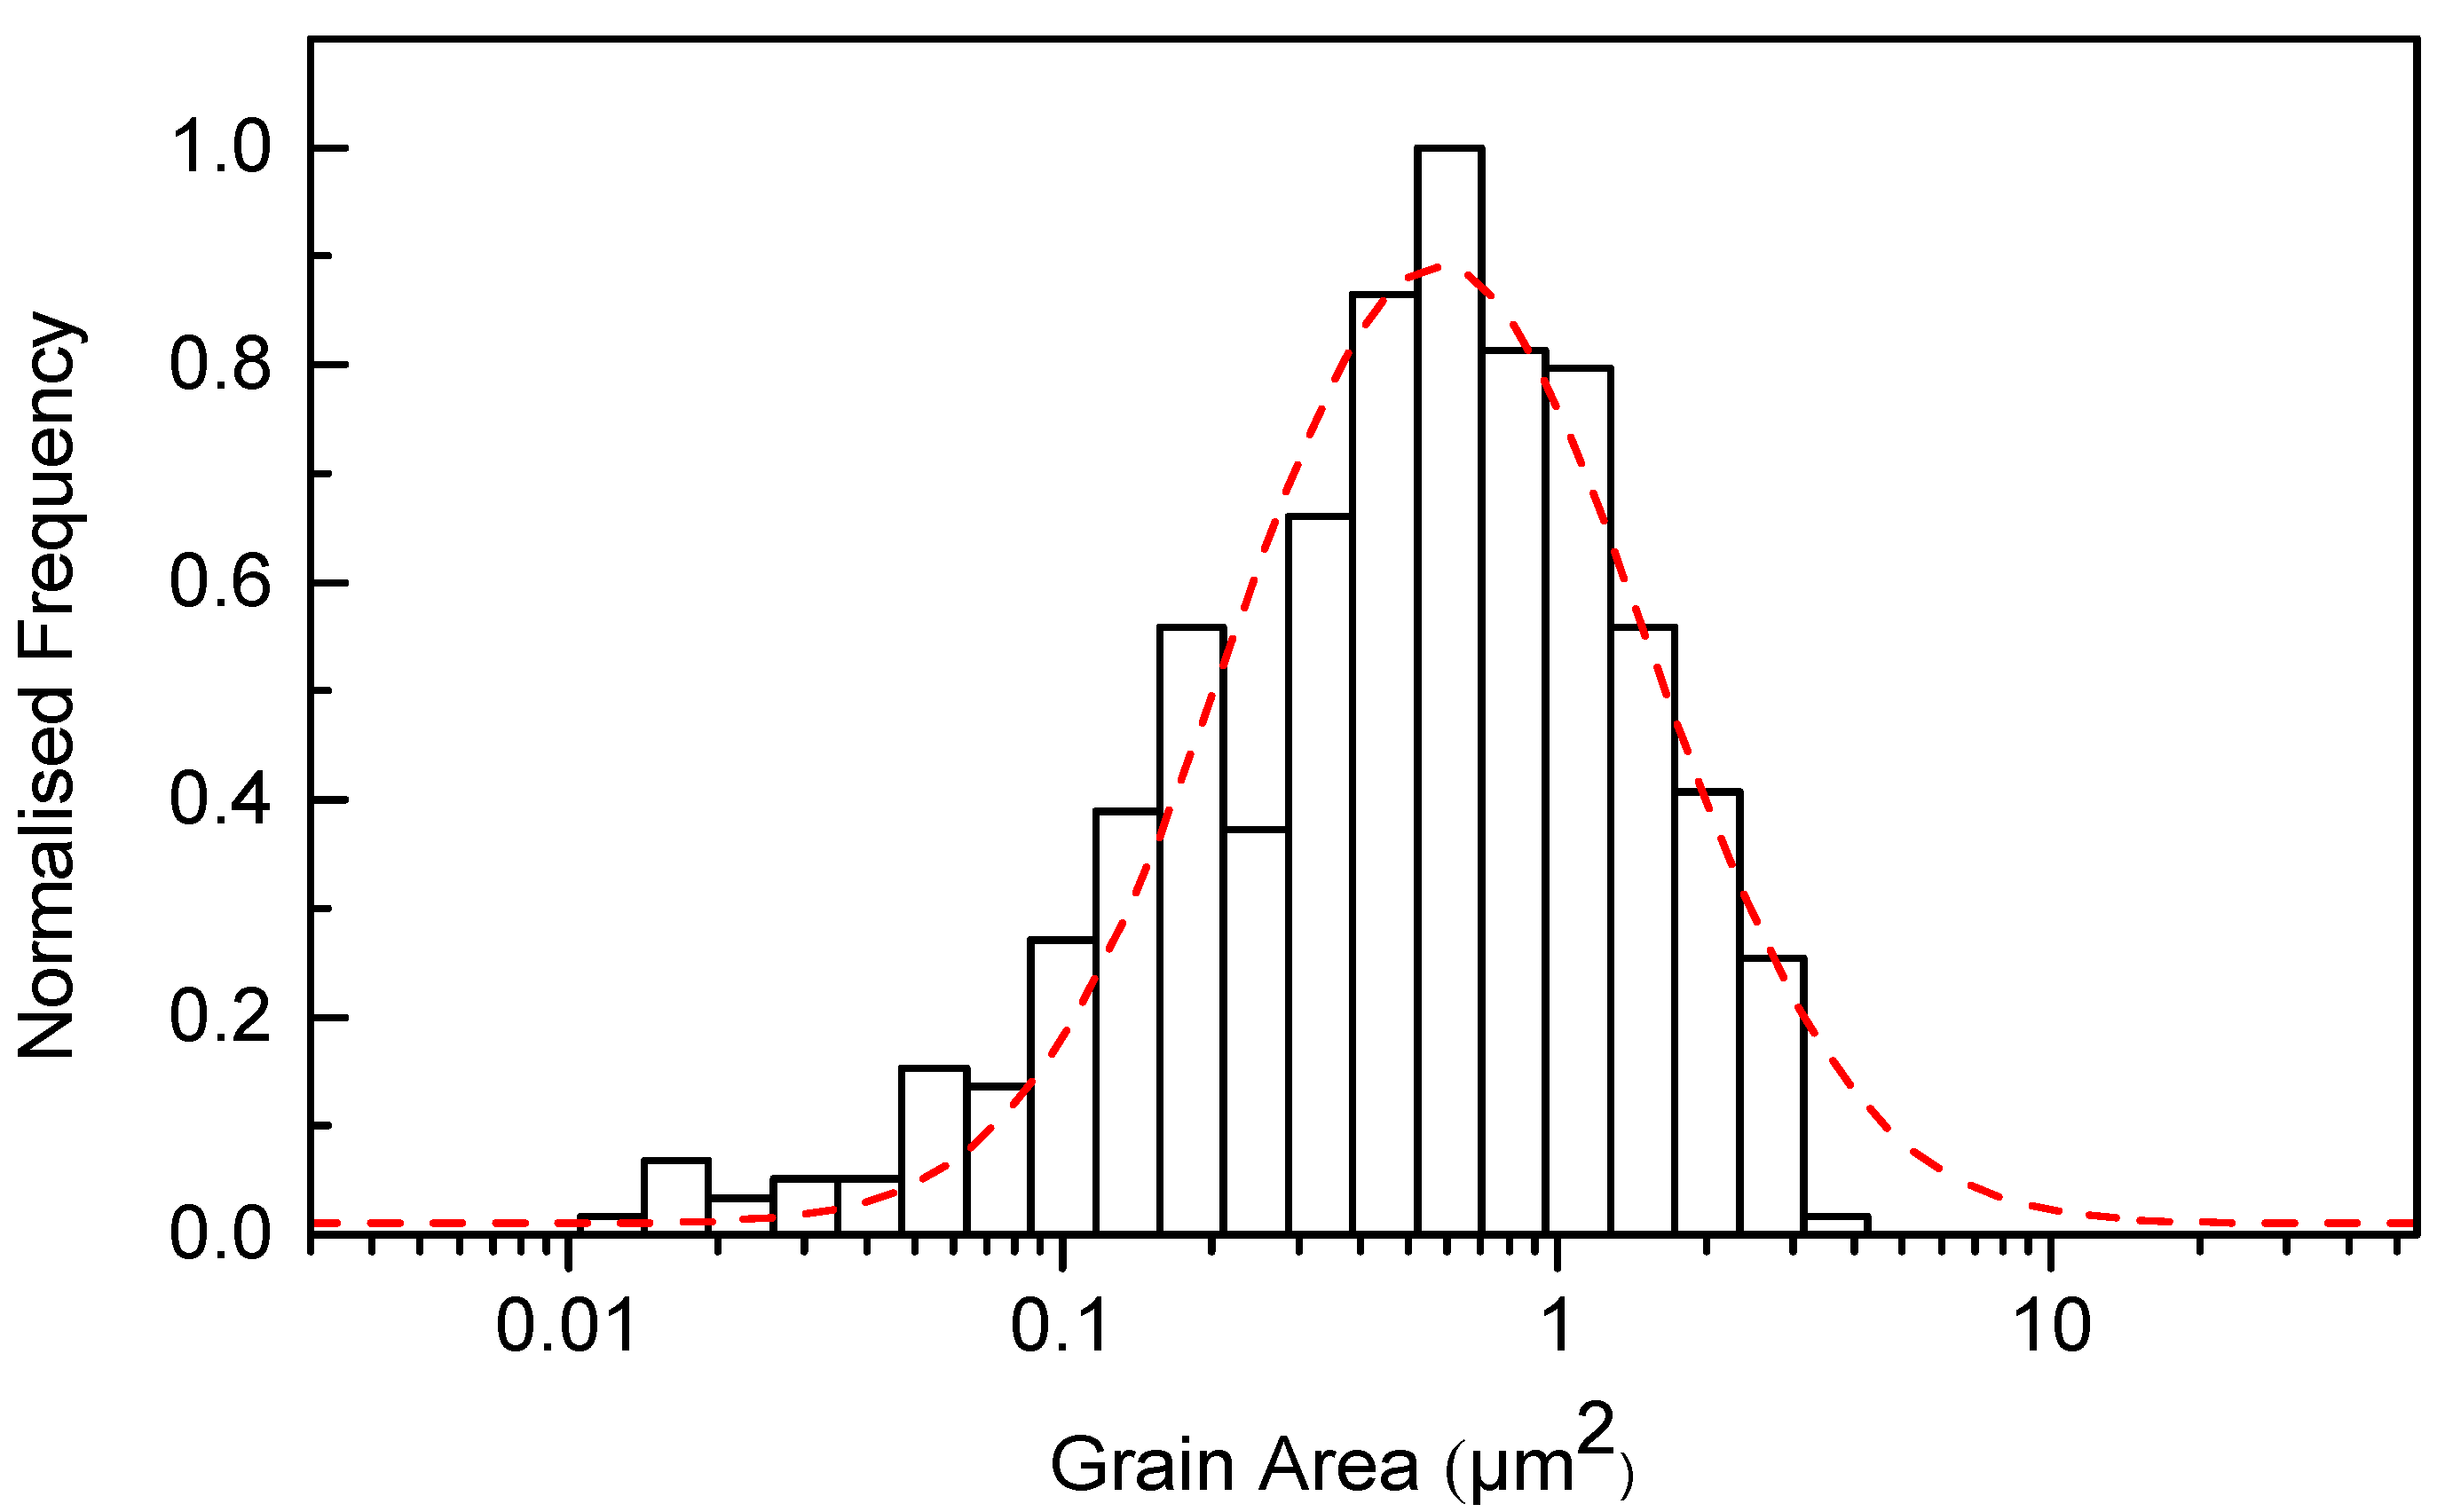
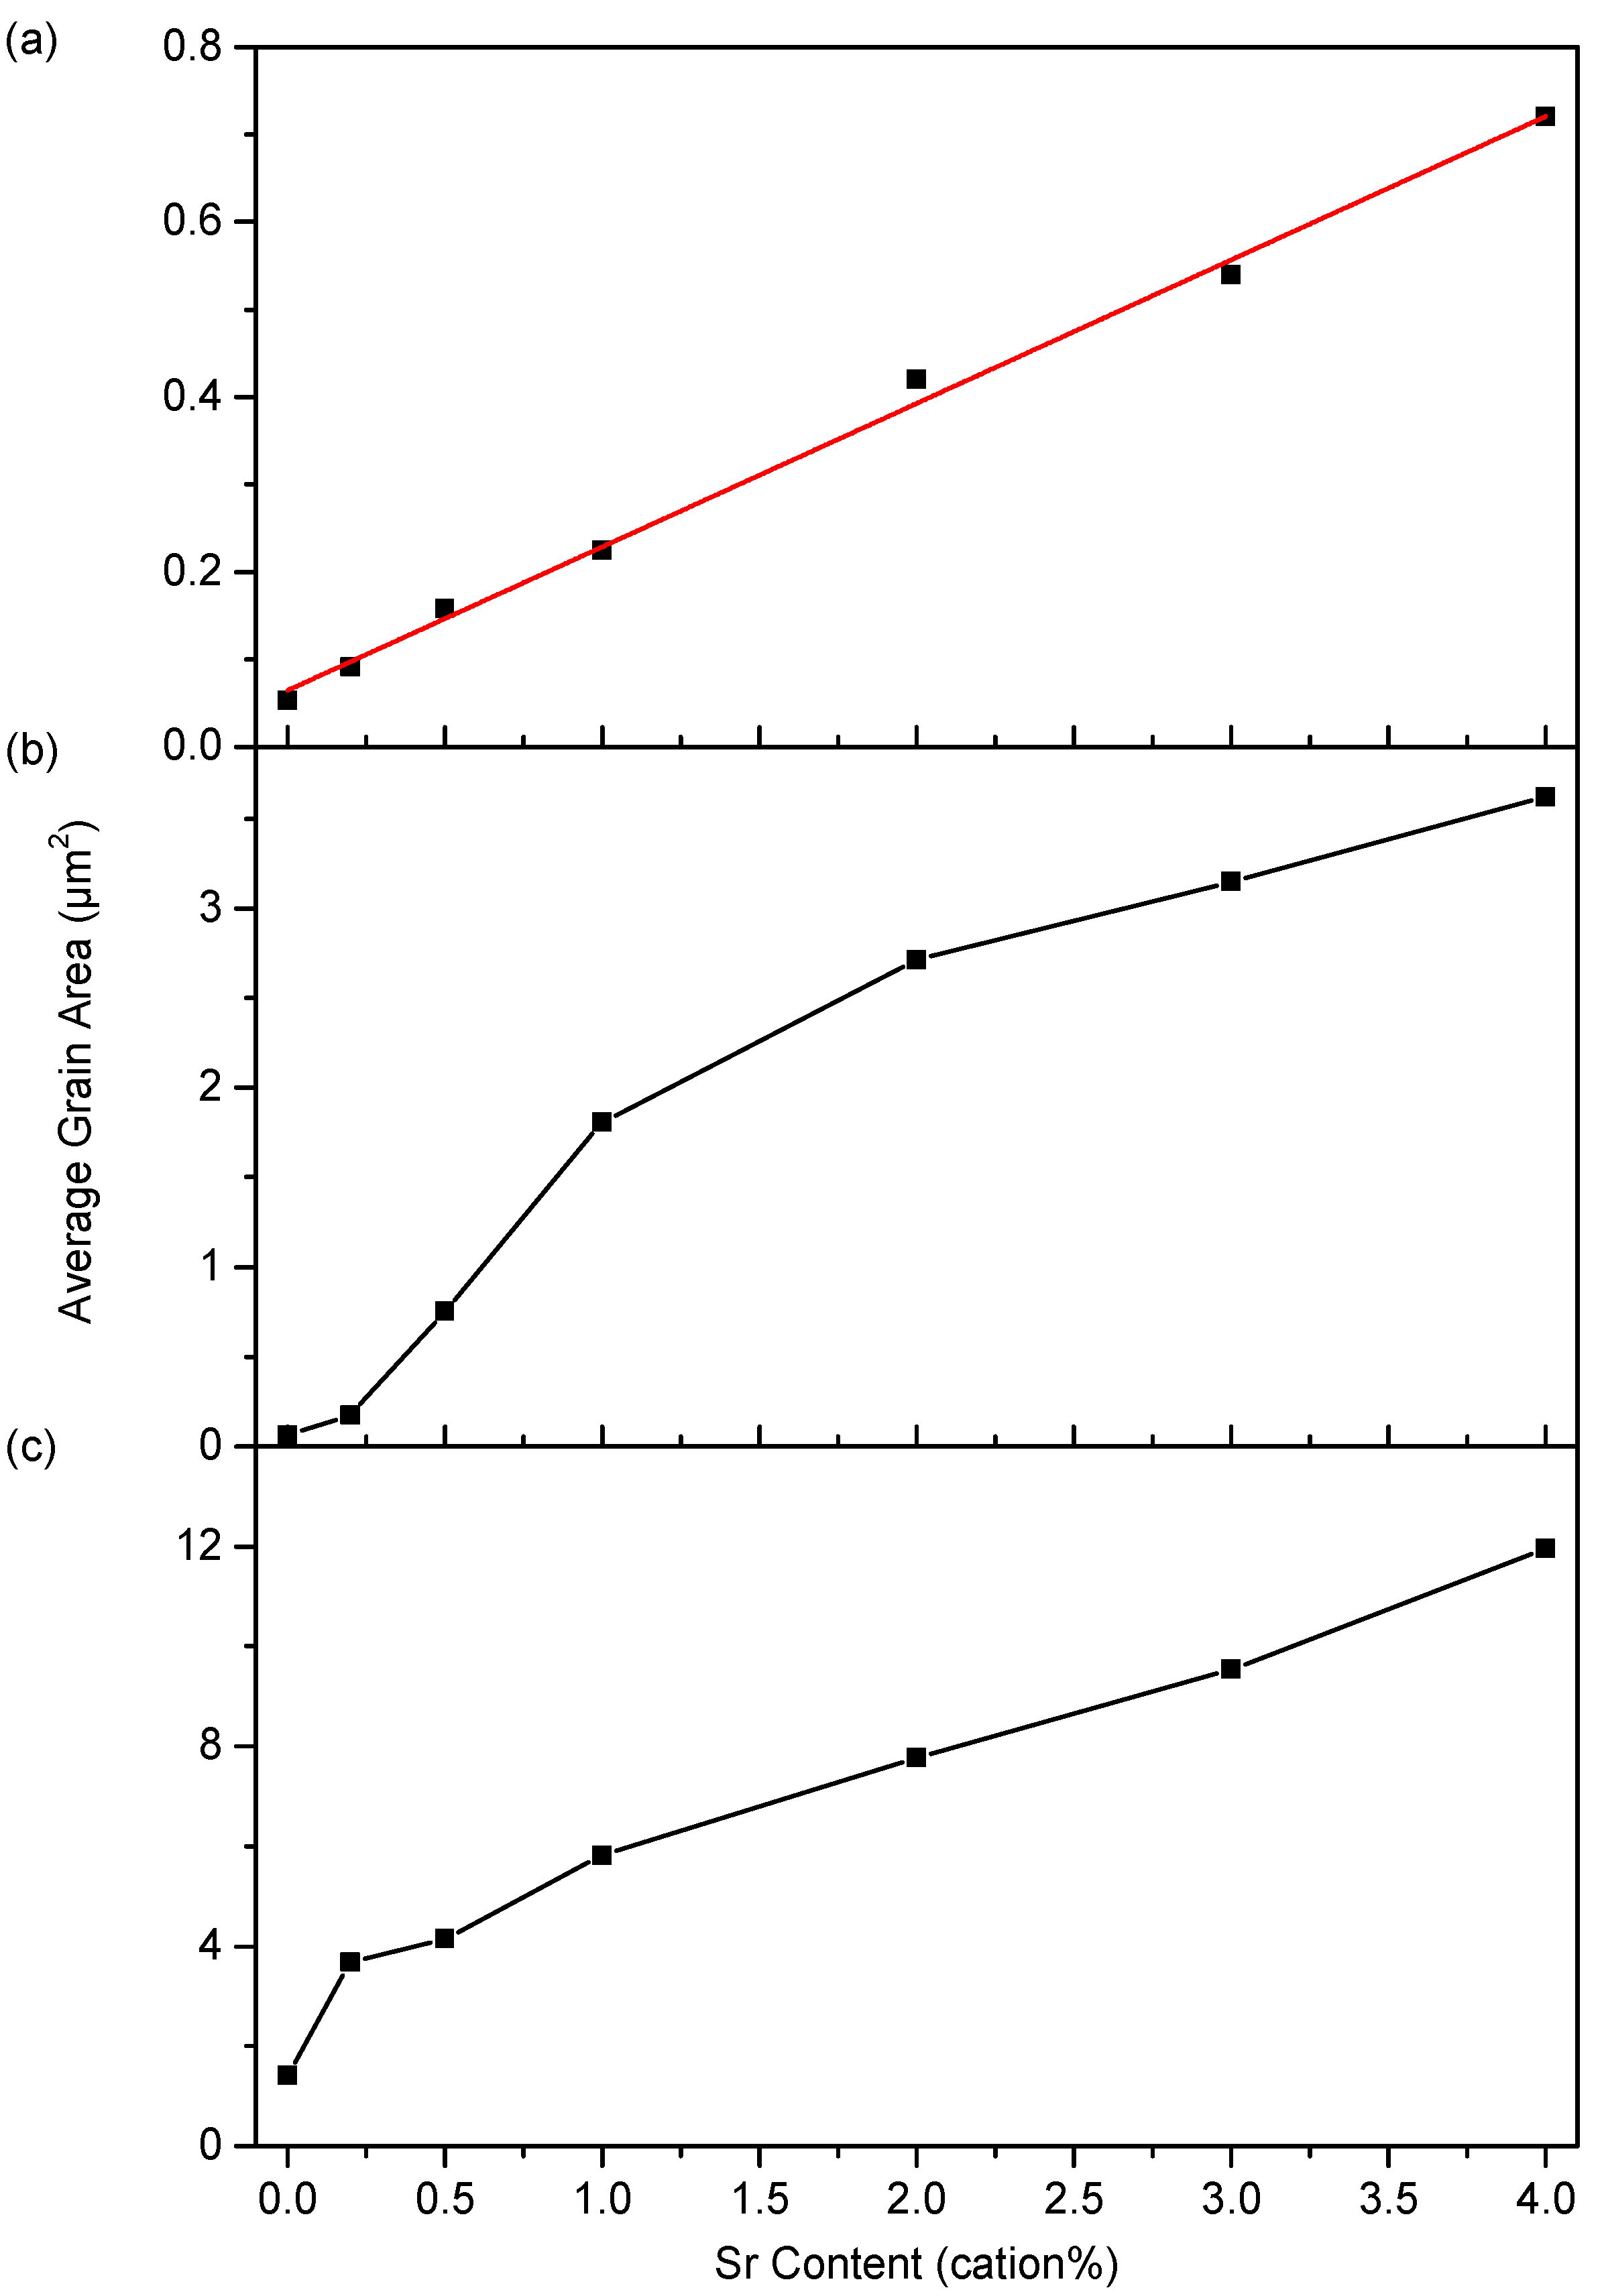
A set of SEM images taken at the same magnification are presented Figure 2 to show the evolution of microstructure as a function of Sr content and sintering temperature. These show that porosity decreases, and grain size increases, with increasing sintering temperature and with increasing strontium content. The grain size distribution was found to be log-normal in all samples. A histogram of the distribution for Sr05 sintered at 1350 °C for 4 h, which is typical of the samples studied, is shown in Figure 3. Figure 4 shows the average grain area as a function of strontium content for all three sintering temperatures. The average grain size for Sr40 was 14, 56 and 8 times greater than for Sr00 for sintering temperatures of 1250 °C, 1350 °C and 1450 °C, respectively. The relationship between grain area and strontium content is linear for the sintering temperature of 1250 °C and partly linear for 1450 °C. However, for 1350 °C there is a sharp increase in grain area between Sr02 and Sr10 giving rise to an S-shaped relationship.

3.3. Electrical Properties

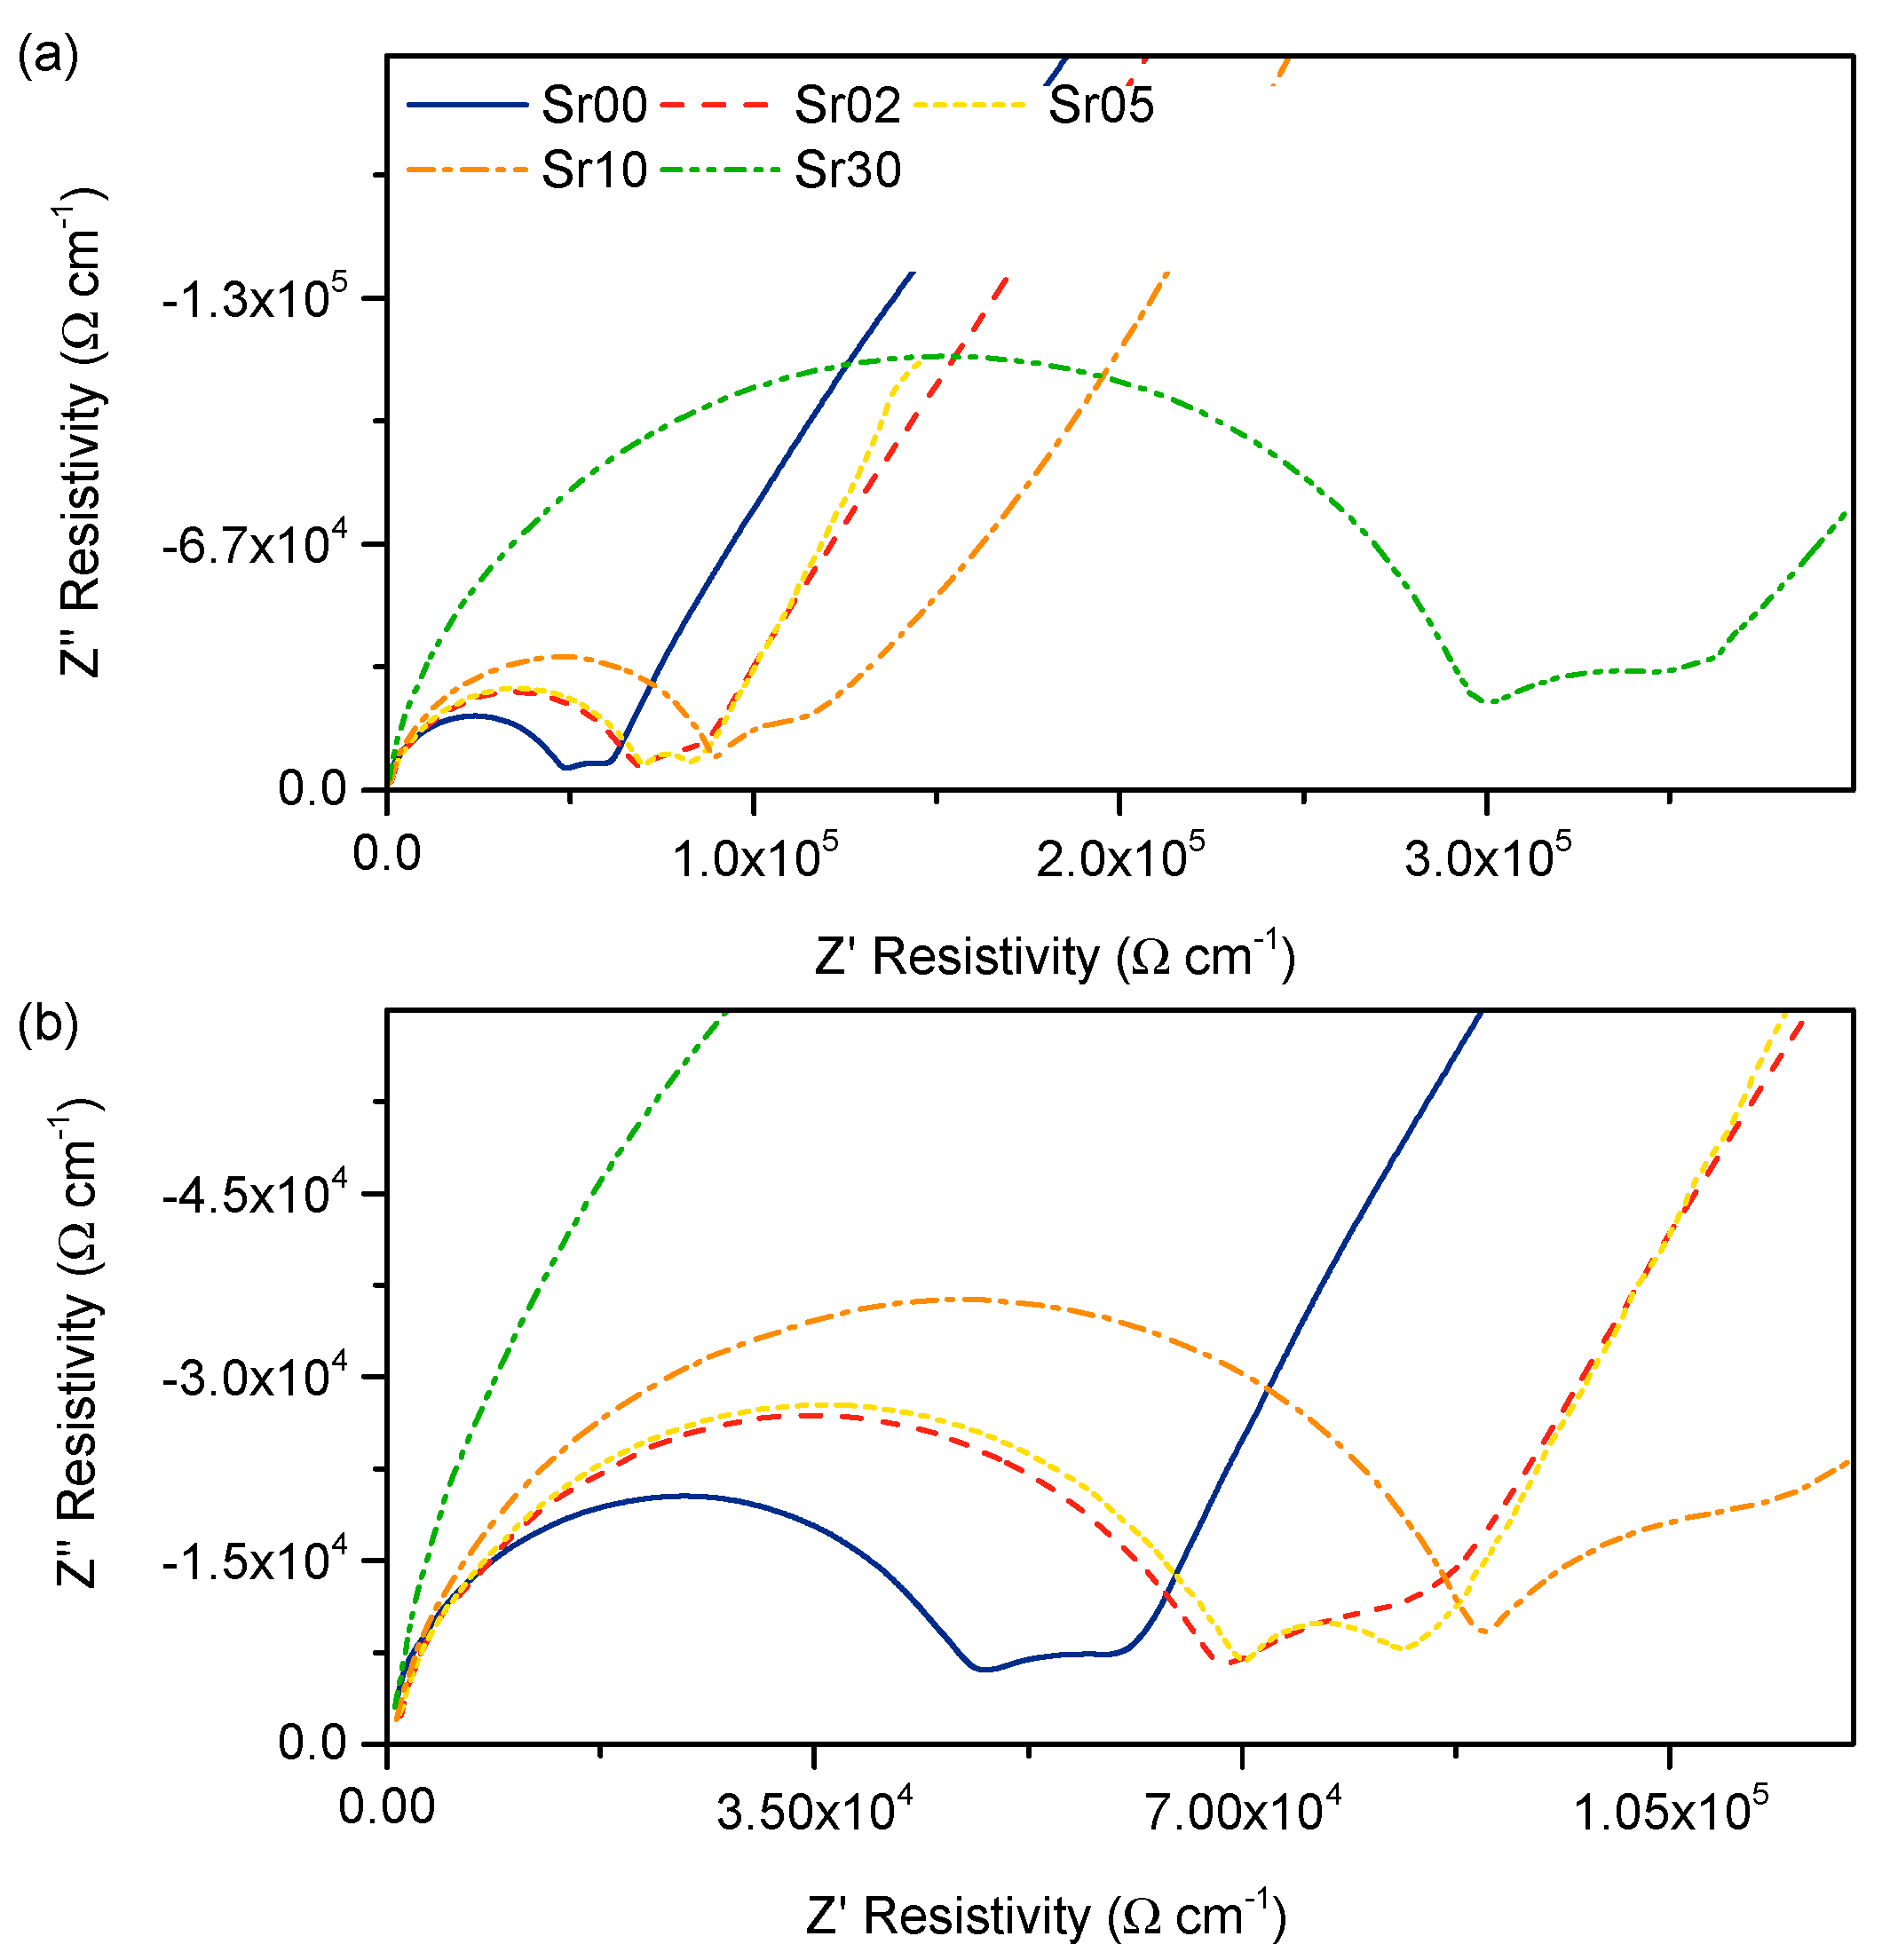
The impedance spectra were fitted in order to obtain values for the total conductivity (σt), and the contribution of the bulk (σb) and grain boundary (σgb) processes to the total conductivity of the samples Sr00, Sr02, Sr05, Sr10 and Sr30 sintered at 1450 °C for 4h. In the atmosphere of dry synthetic air and at the measurement temperatures used here, it is known that samarium-doped ceria samples are essentially pure oxygen ion conductors, and therefore that σt, σb, and σgb relate to the oxygen ion conductivity of the samples [26]. Figure 5 shows a Nyquist plot of the impedance spectra obtained at 250 °C for all samples. The larger, higher frequency arc is attributed to bulk processes and the smaller, lower frequency arc to processes taking place at the grain boundaries. The spectra were fitted by modelling the bulk and grain boundary processes as two sub-circuits in series, each consisting of a resistor and constant phase element in parallel. Due to inductance effects, the bulk and grain boundary resistances can only both be reliably determined at measurement temperatures of 350 °C or below. At higher temperatures, therefore, the total resistance was determined from the intercept of the impedance plot with the x-axis.
Conductivity is empirically found to vary with temperature according to the exponential relationship,
σ = σ o T e E a k T
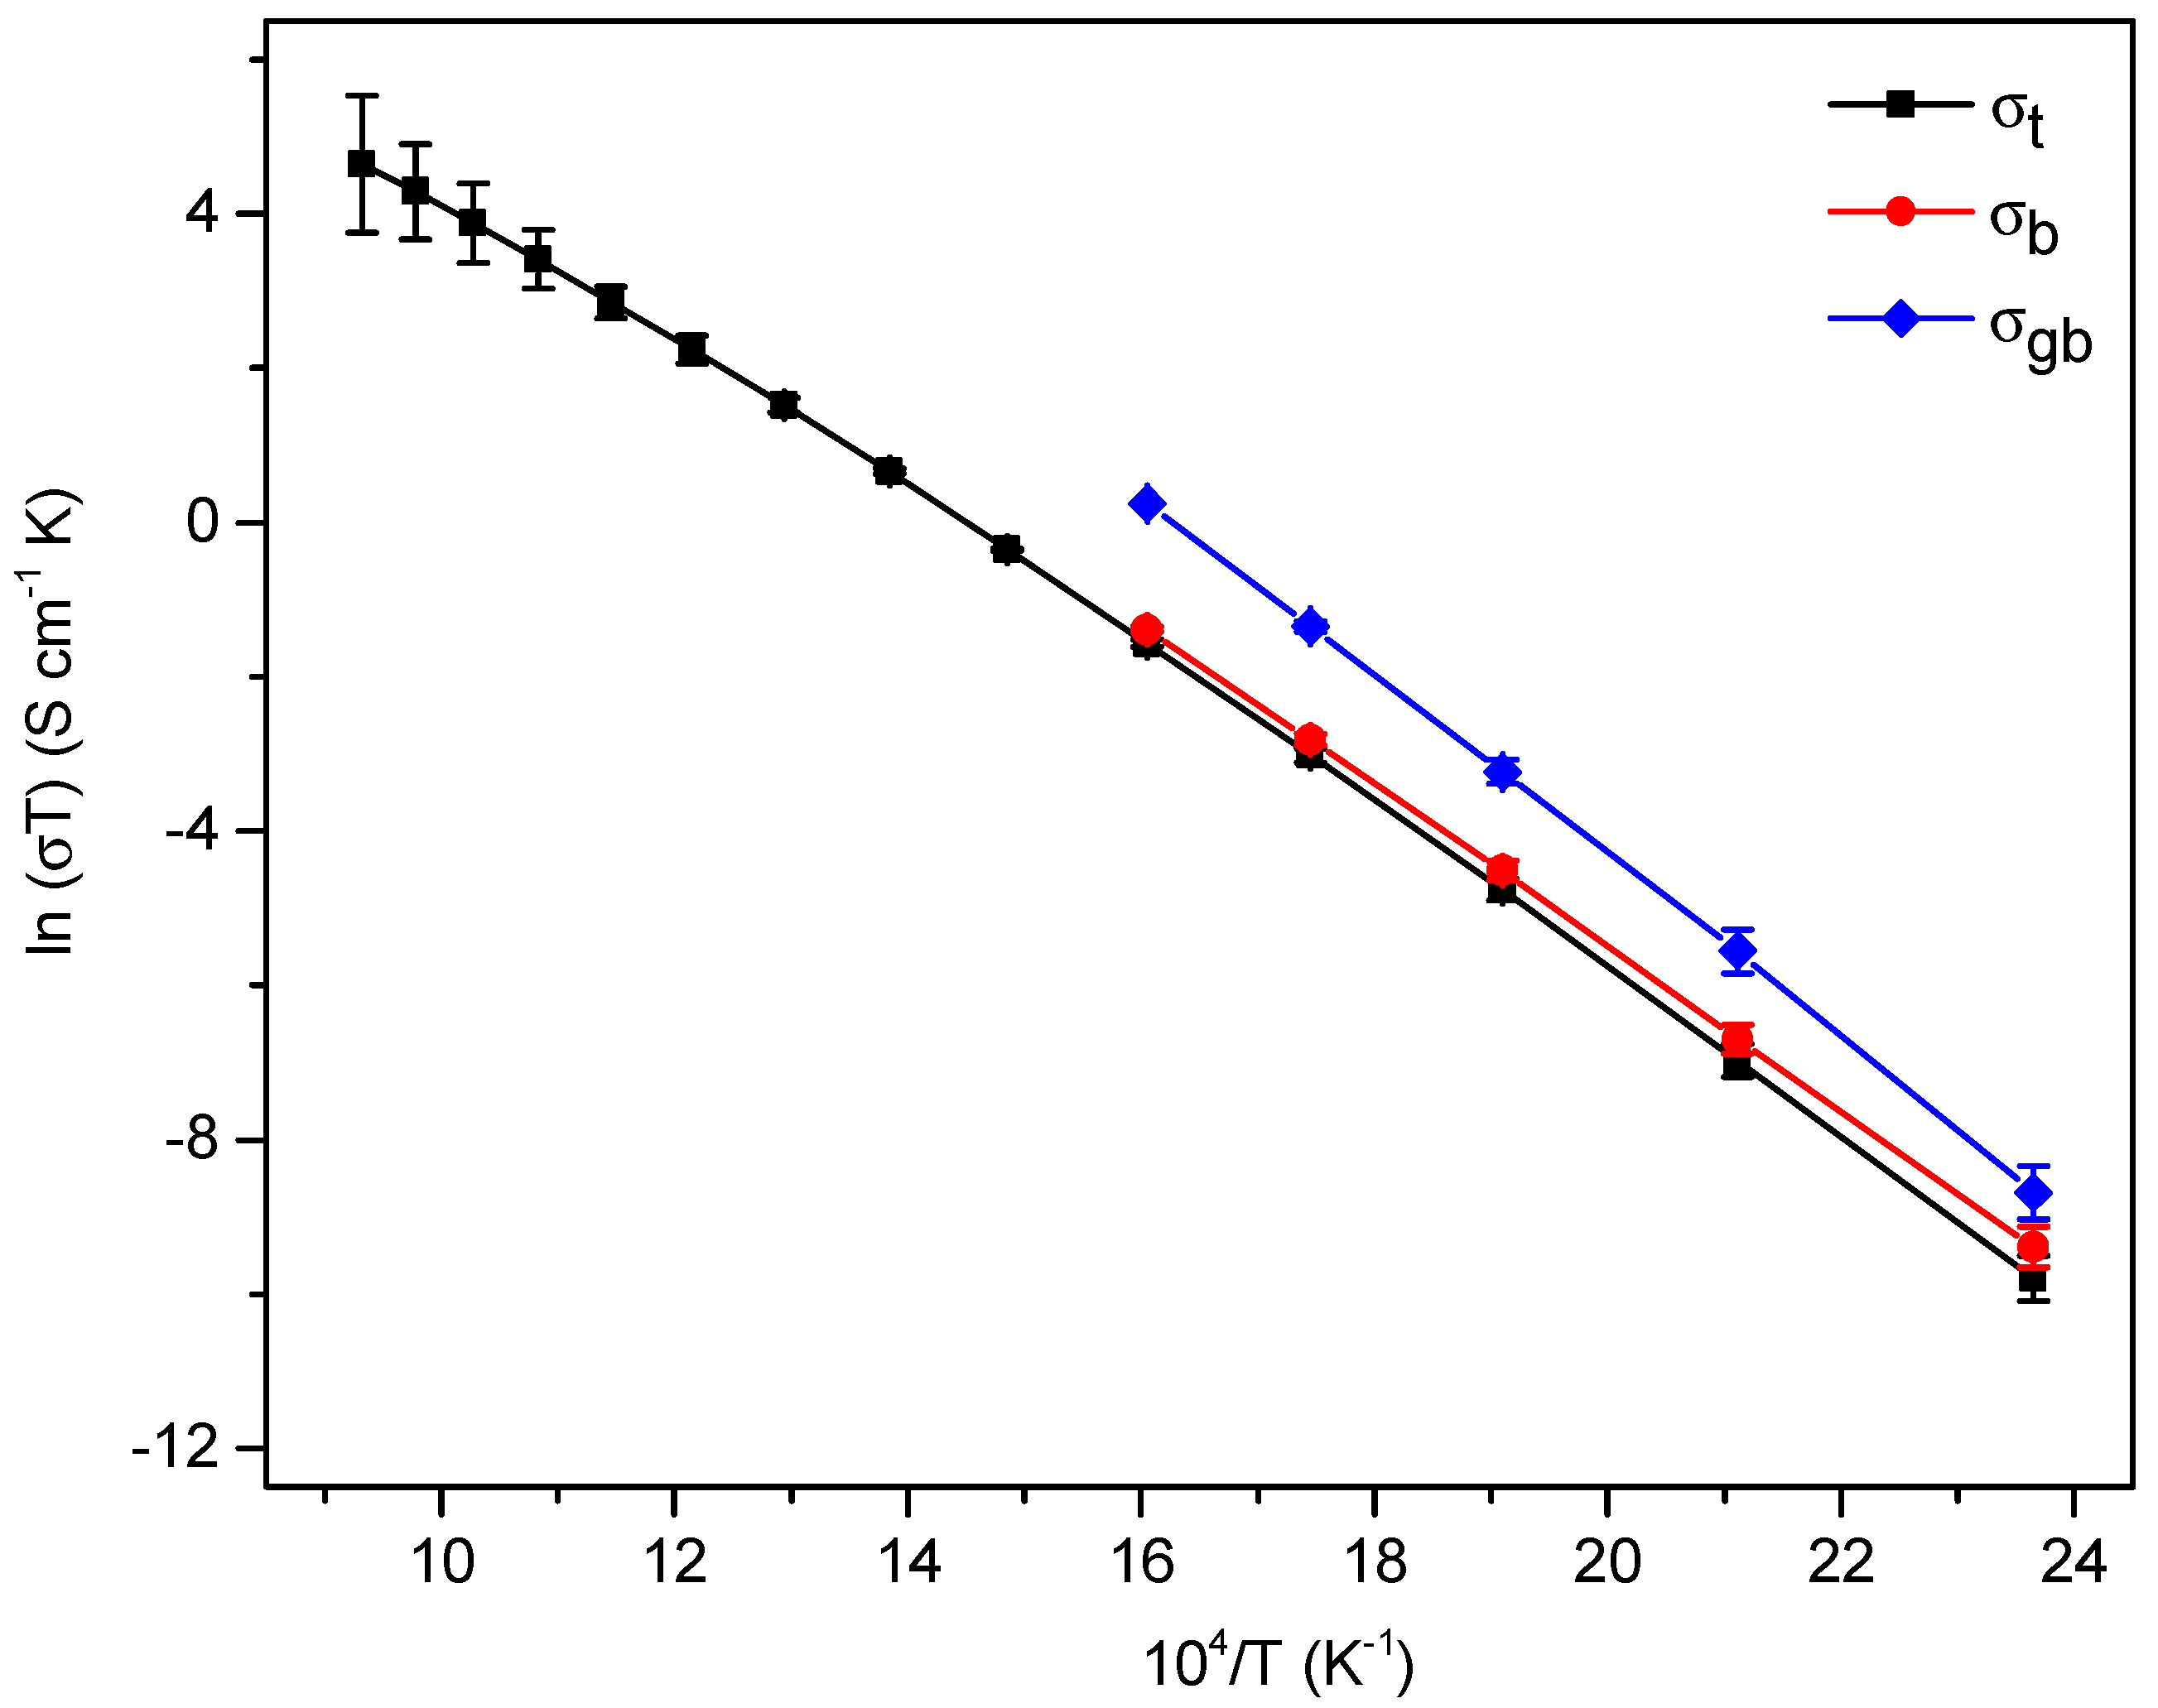
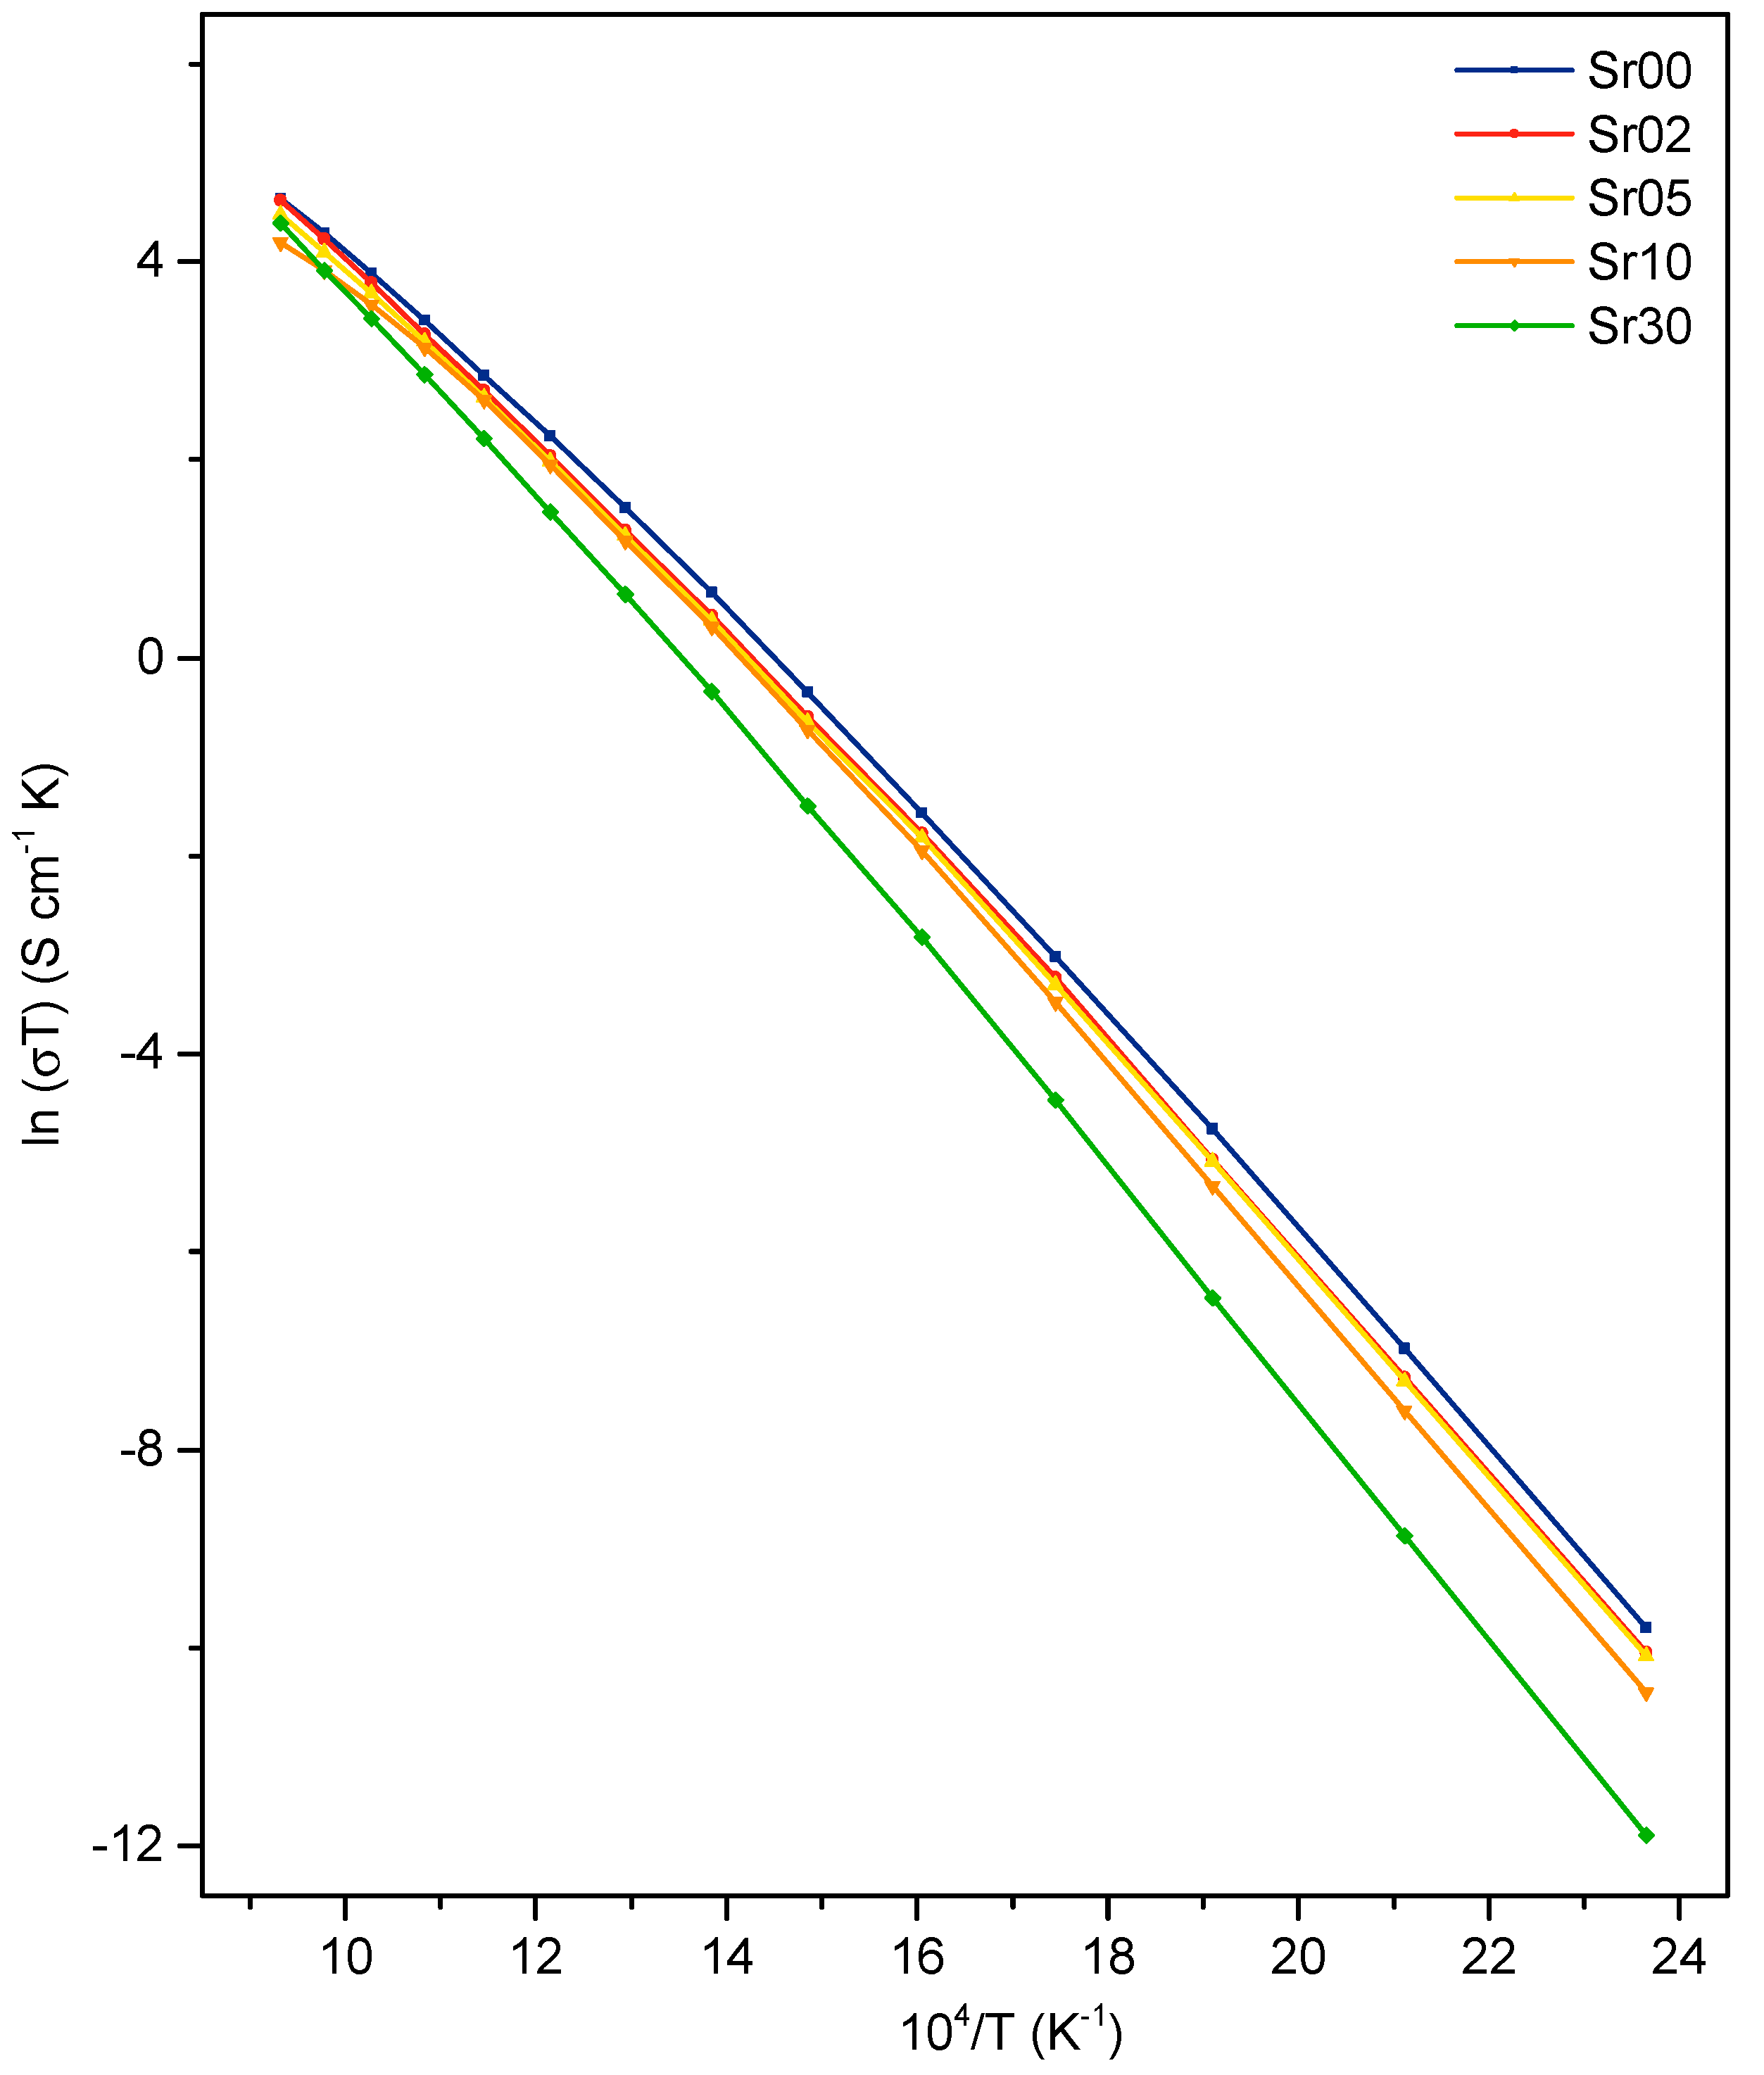
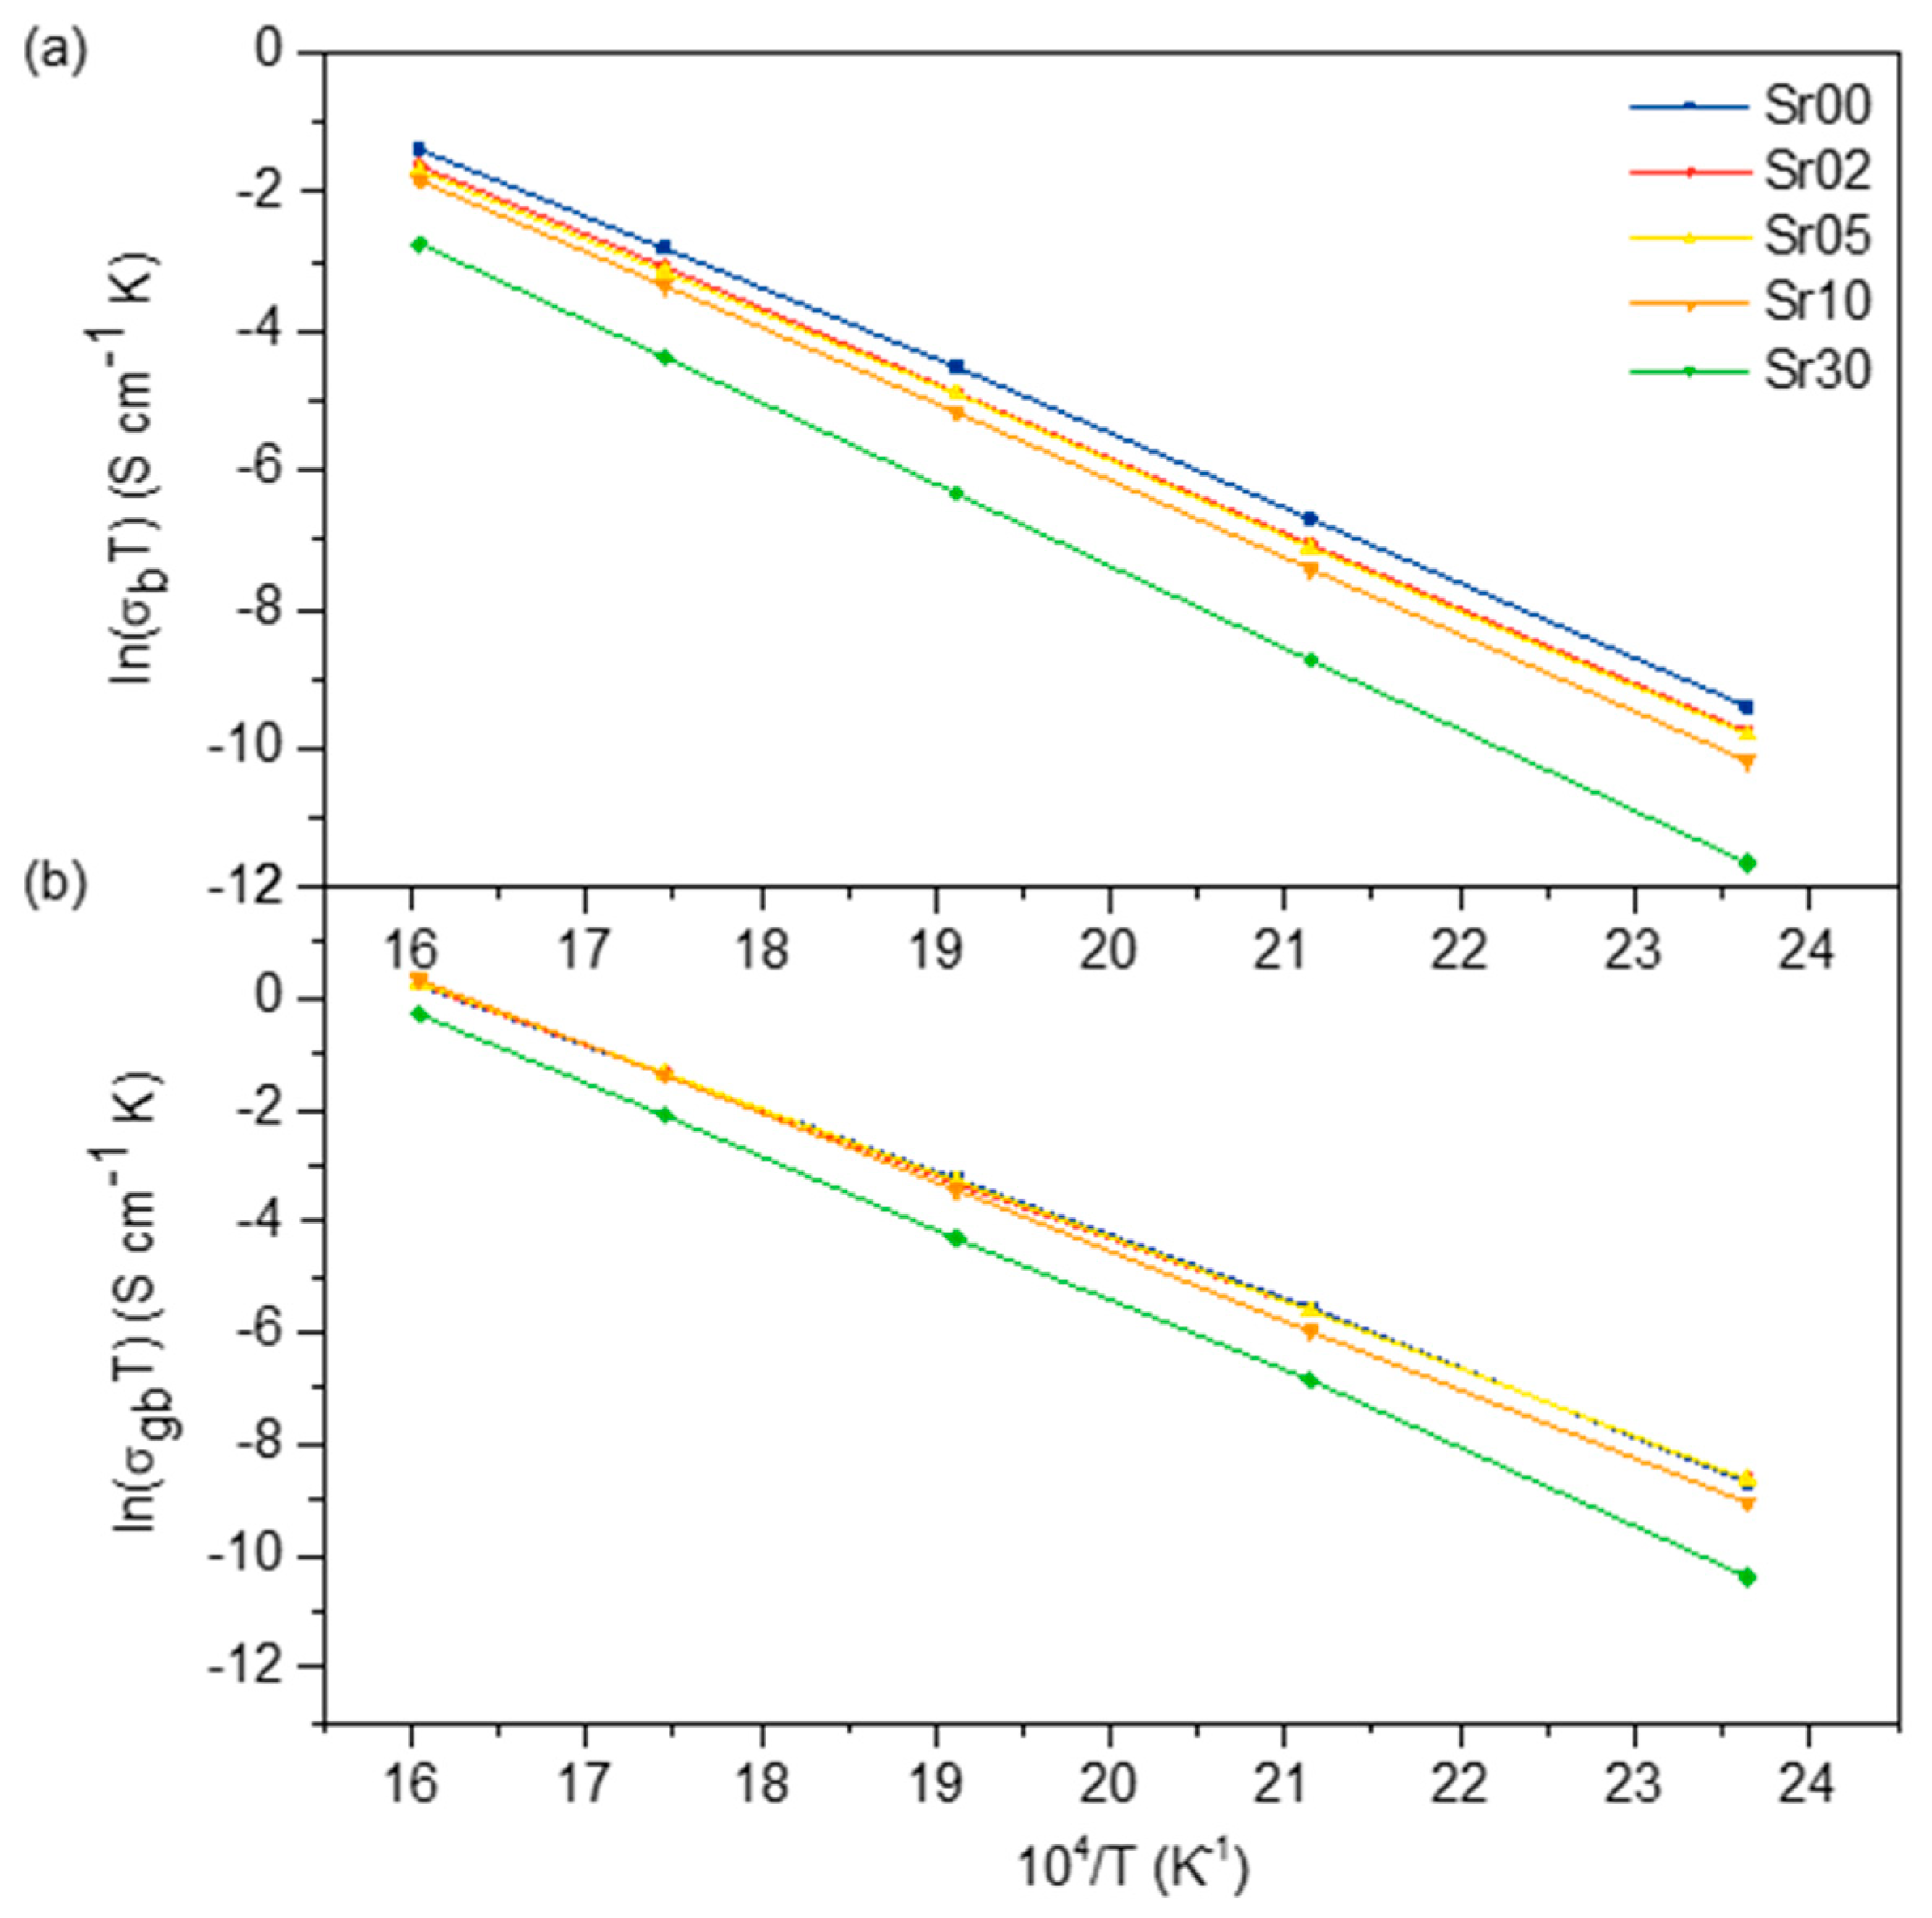
where σ is the conductivity, T is the sample temperature, k is the Boltzmann constant, σ0 is a pre-exponential constant and Ea is the activation energy for conductivity. The total activation energy, Ea, is usually considered to be composed of an activation energy for oxygen ion migration, Em, and an activation energy for the dissociation of defect associates, Eass [27]. Figure 6 shows Arrhenius plots of the total, bulk and grain boundary conductivities for Sr00. For total conductivity, the relationship is linear, obeying Equation (1), at lower temperatures, but deviates at higher temperatures. Figure 7 and Figure 8 show that this behaviour was observed for all samples.
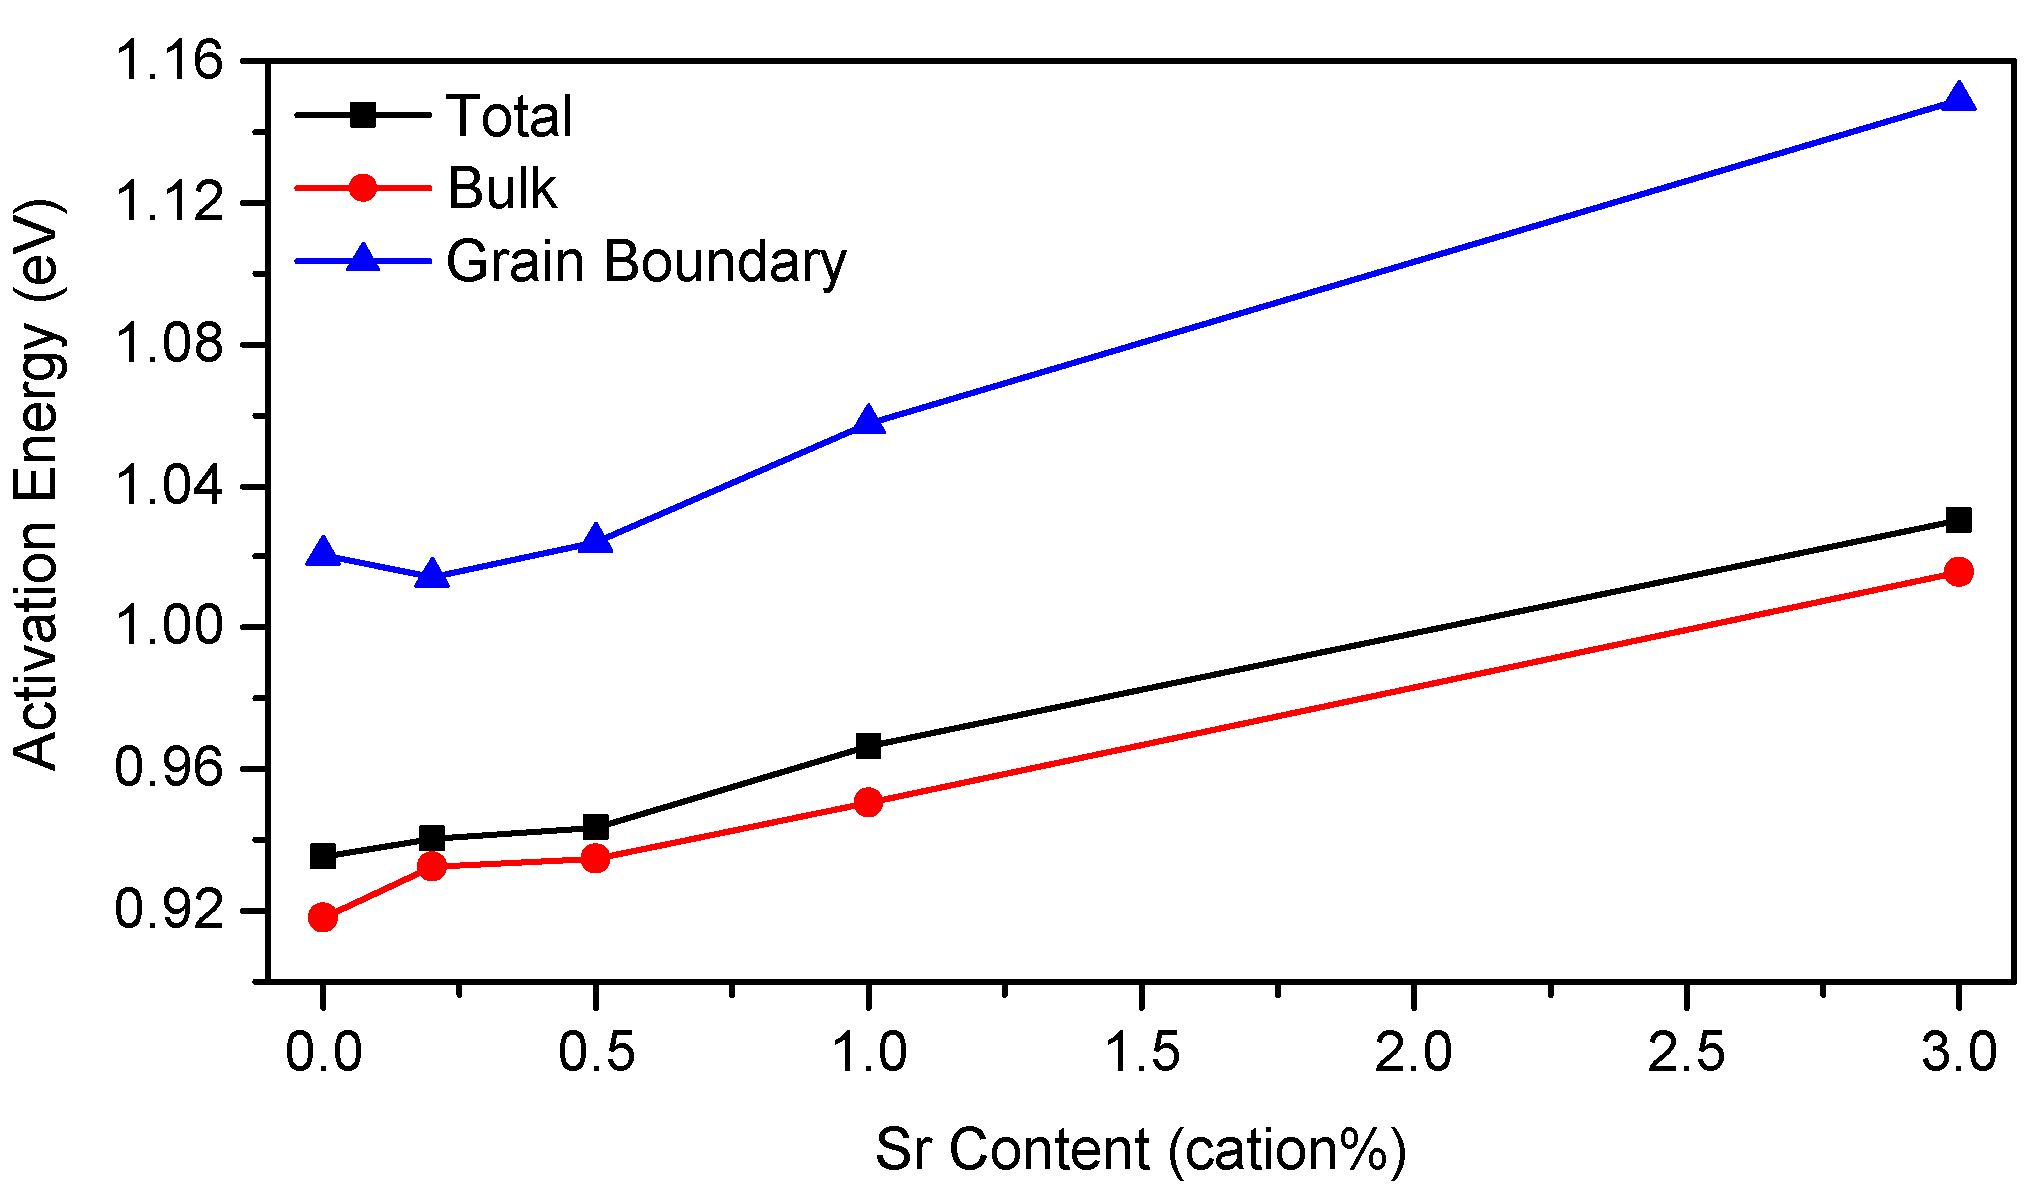
From Equation (1), it is clear that Ea can be calculated from the slope of an Arrhenius plot of conductivity. It is also possible to obtain values for Eass and Em by assuming that no defect associates exist at high temperatures (having been thermally dissociated) so that the slope at higher temperatures is determined solely by Em. Eass can then be calculated as Eass = EaEm, using the slope of the lower temperature section of the plot to find Ea. In the present work, however, the gradient at high temperatures was too variable to reliably calculate Em and Eass. Nevertheless, values for Ea were calculated for the total, bulk and grain boundary conductivity using the temperature range 150–350 °C. Figure 9 shows the variation of Ea with strontium content. It shows that the grain boundary Ea is higher than the bulk Ea and that there is a general increase in all three activation energies with increasing strontium content. Activation energy for total conductivity increased from 0.94 eV to 1.03 eV from Sr00 to Sr30. There is an interesting variation, however, in the grain boundary Ea which passes through a minimum at a strontium content of 0.2 cation%.
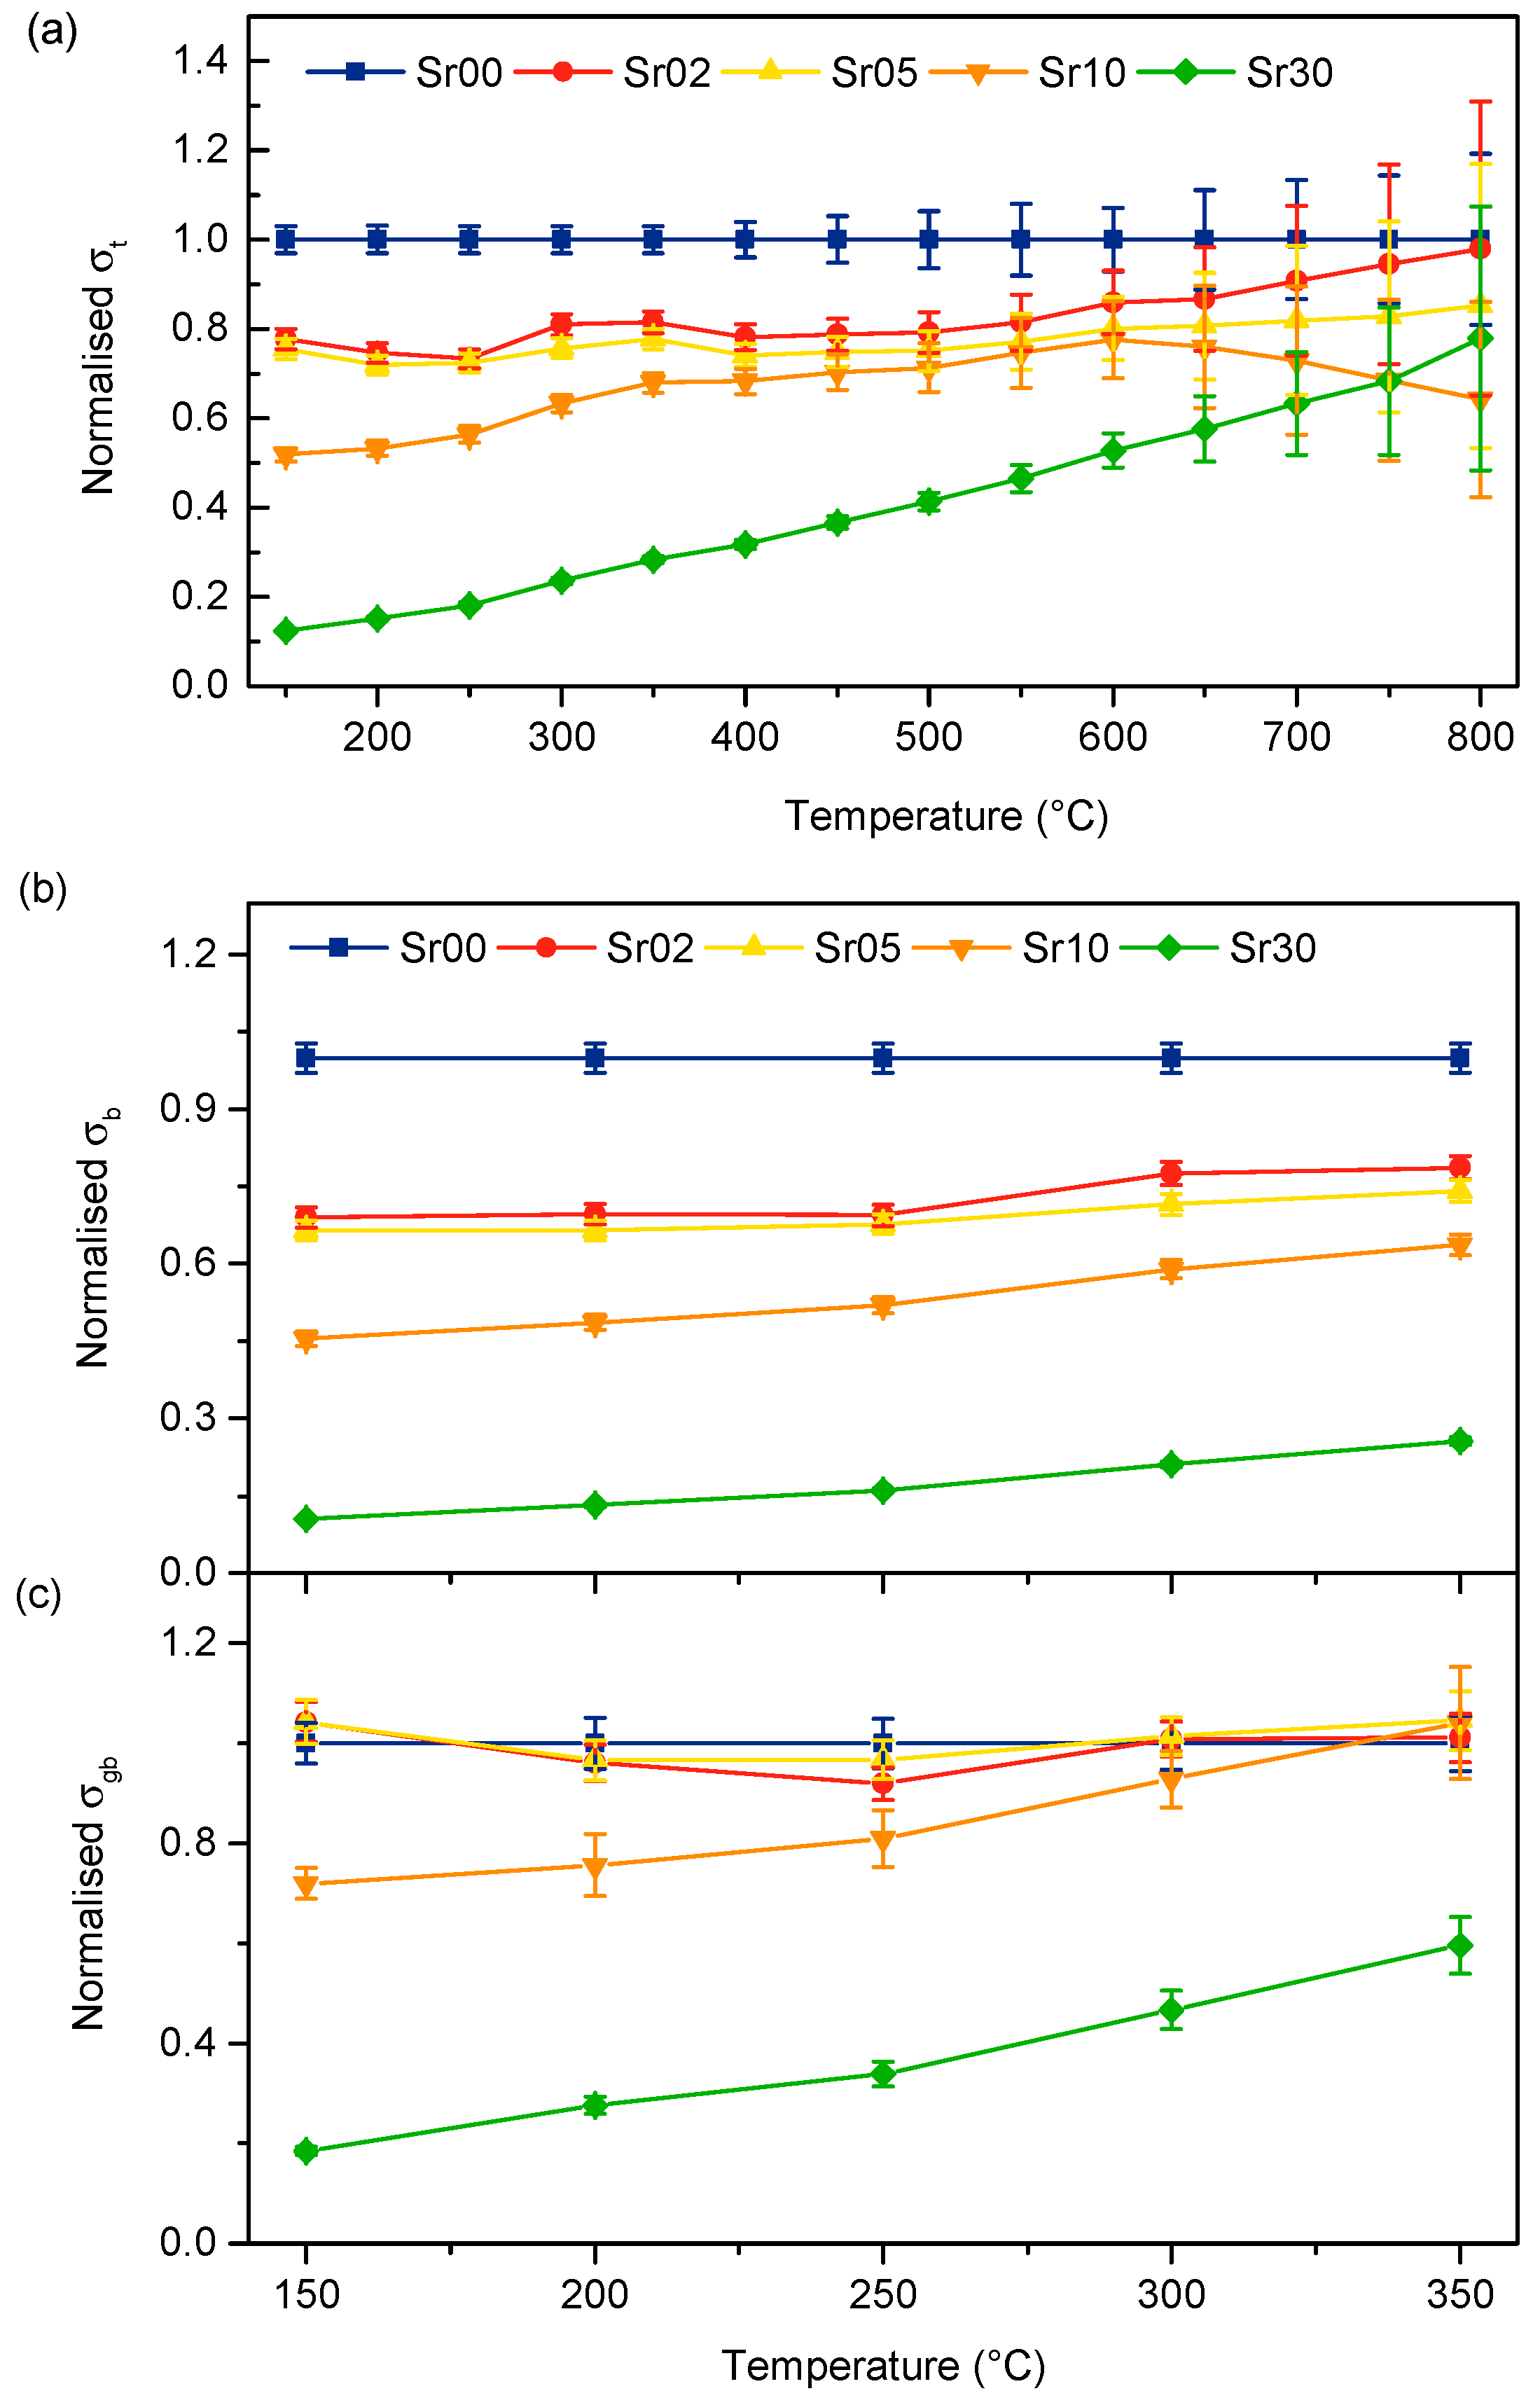
In order to compare conductivity data for all samples over the whole temperature range, it is convenient to normalise the conductivities with respect to those of the undoped sample (Sr00). The normalised conductivity is the conductivity of the sample at each temperature divided by that of Sr00 at the same temperature. Figure 10 shows the normalised total, bulk and grain boundary conductivities for all samples. From Figure 10a, it is clear that Sr00 is the most conductive sample at temperatures above 600 °C; however, the magnitude of the error in the conductivity exceeds the magnitude of the difference between the samples. It is also apparent that the rate of increase in total conductivity with temperature increases with increasing strontium content (as can also be deduced from the values for Eas in Figure 9). Therefore, the biggest change in normalised conductivity is for Sr30, in which it increased from 0.1 to 0.8 times that of Sr00 from 150 °C to 800 °C. Figure 10b,c show the normalised bulk and grain boundary conductivities up to 350 °C. The trends for normalised bulk conductivity are similar to those for normalised total conductivity (though not as pronounced due to the smaller temperature range). The behaviour for grain boundary conductivity is slightly different, however. Sr02 and Sr05 show similar conductivity to Sr00 across the temperature range whilst Sr10 and Sr30 increase substantially over the relatively small 200 °C temperature range.
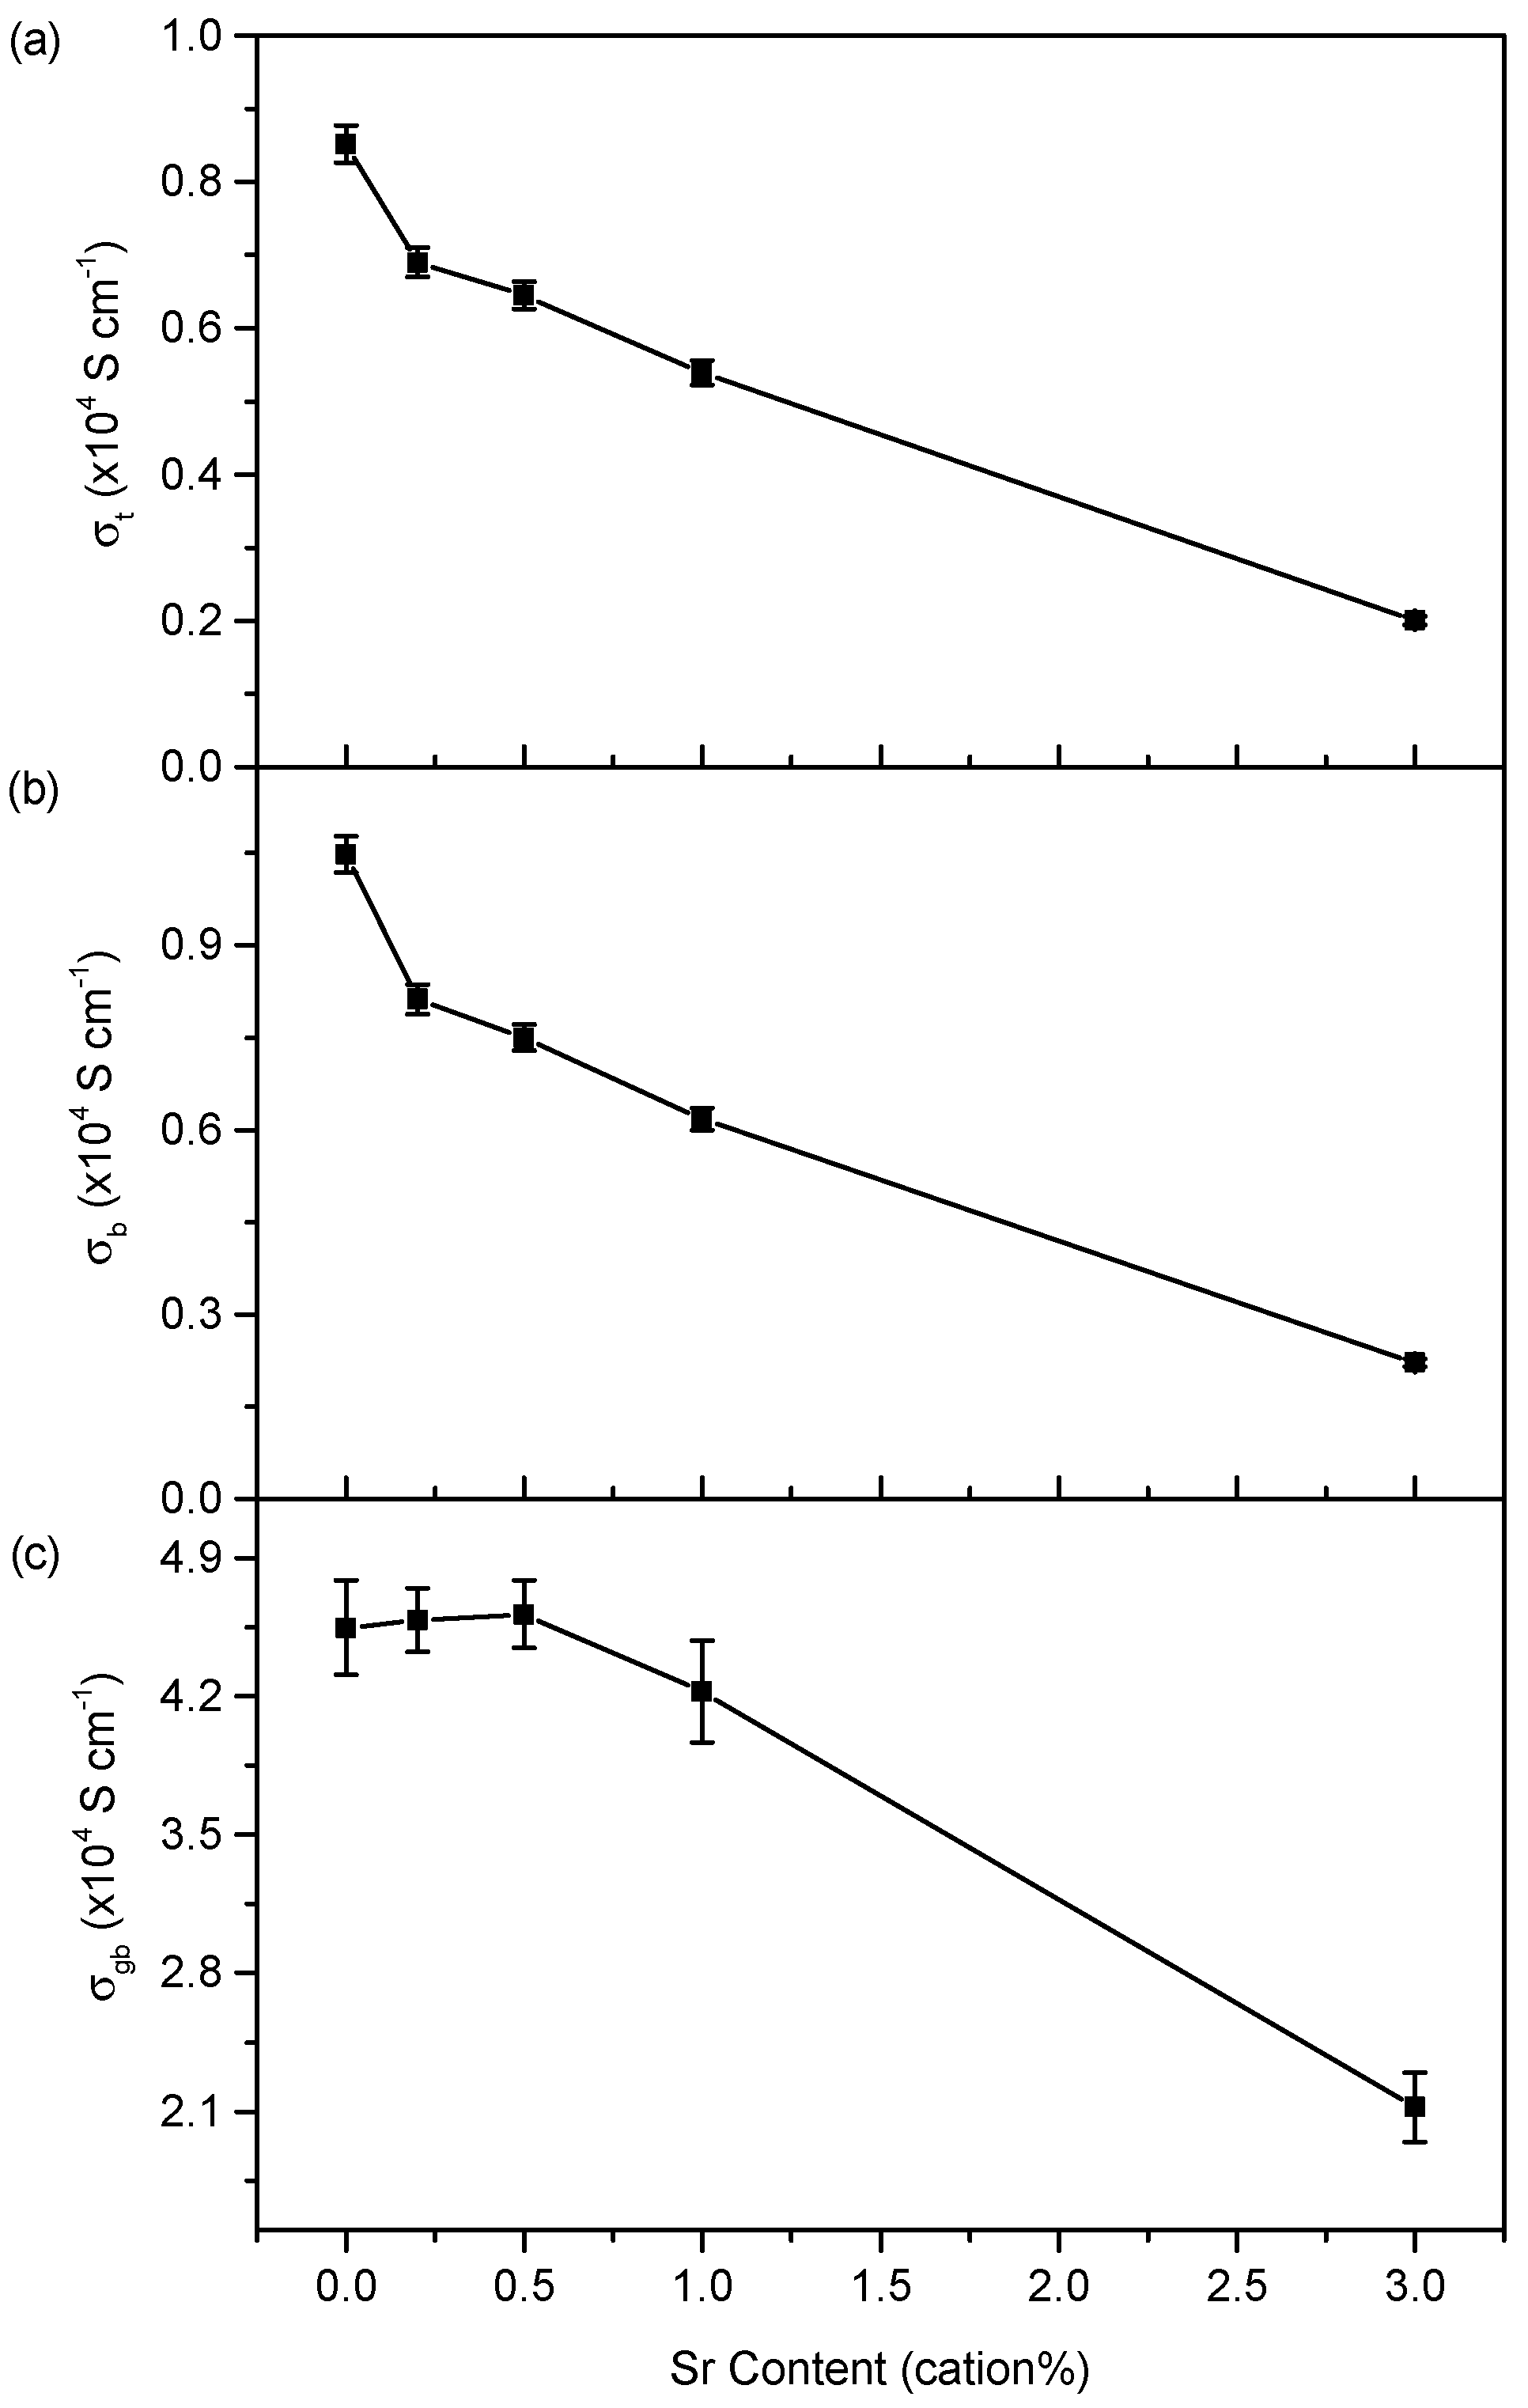
In order to see the trend in conductivity with strontium content more clearly, Figure 11 shows the variation in the total, bulk and grain boundary conductivity at a single temperature, 300 °C. Here, the absolute values of conductivity can be compared as the range is not so large. A clear trend can be seen, which is similar for the total and bulk, and slightly different for the grain boundary conductivity. Both the total and bulk conductivity show a roughly linear decrease in conductivity with increasing strontium content from Sr02 to Sr30, with a larger decrease from the undoped sample, Sr00, to the first doped sample, Sr02. The total decreases in the total and bulk conductivity across the full range are very similar at 76% and 79%, respectively. The grain boundary conductivity shows a different trend. There is a slight increase from Sr00 to Sr005 followed by a linear decrease to Sr30. The increase in grain boundary conductivity from Sr00 to the maximum at Sr005 is 8% while the decrease from Sr00 to Sr30 was 54%.
It is useful to examine the relative contributions to the total conductivity of the bulk and grain boundary components. For example, the 24% decrease in the total conductivity of Sr05 compared to Sr00 at 300 °C results from an 28% decrease in bulk conductivity and a 2% increase in grain boundary conductivity, whilst the 76% decrease for Sr30 results from a 79% decrease in the bulk and a 53% decrease in the grain boundary conductivity. It is a general trend that the relative contribution of the grain boundary to the total conductivity increases with increasing strontium content. This relationship between the total conductivity and the bulk and grain boundary components of conductivity is best described by the blocking factor, BF, which is defined as the resistance due to the grain boundaries, Rgb, divided by that due to the bulk, Rb, as shown in Equation (2).
B F = R g b R b
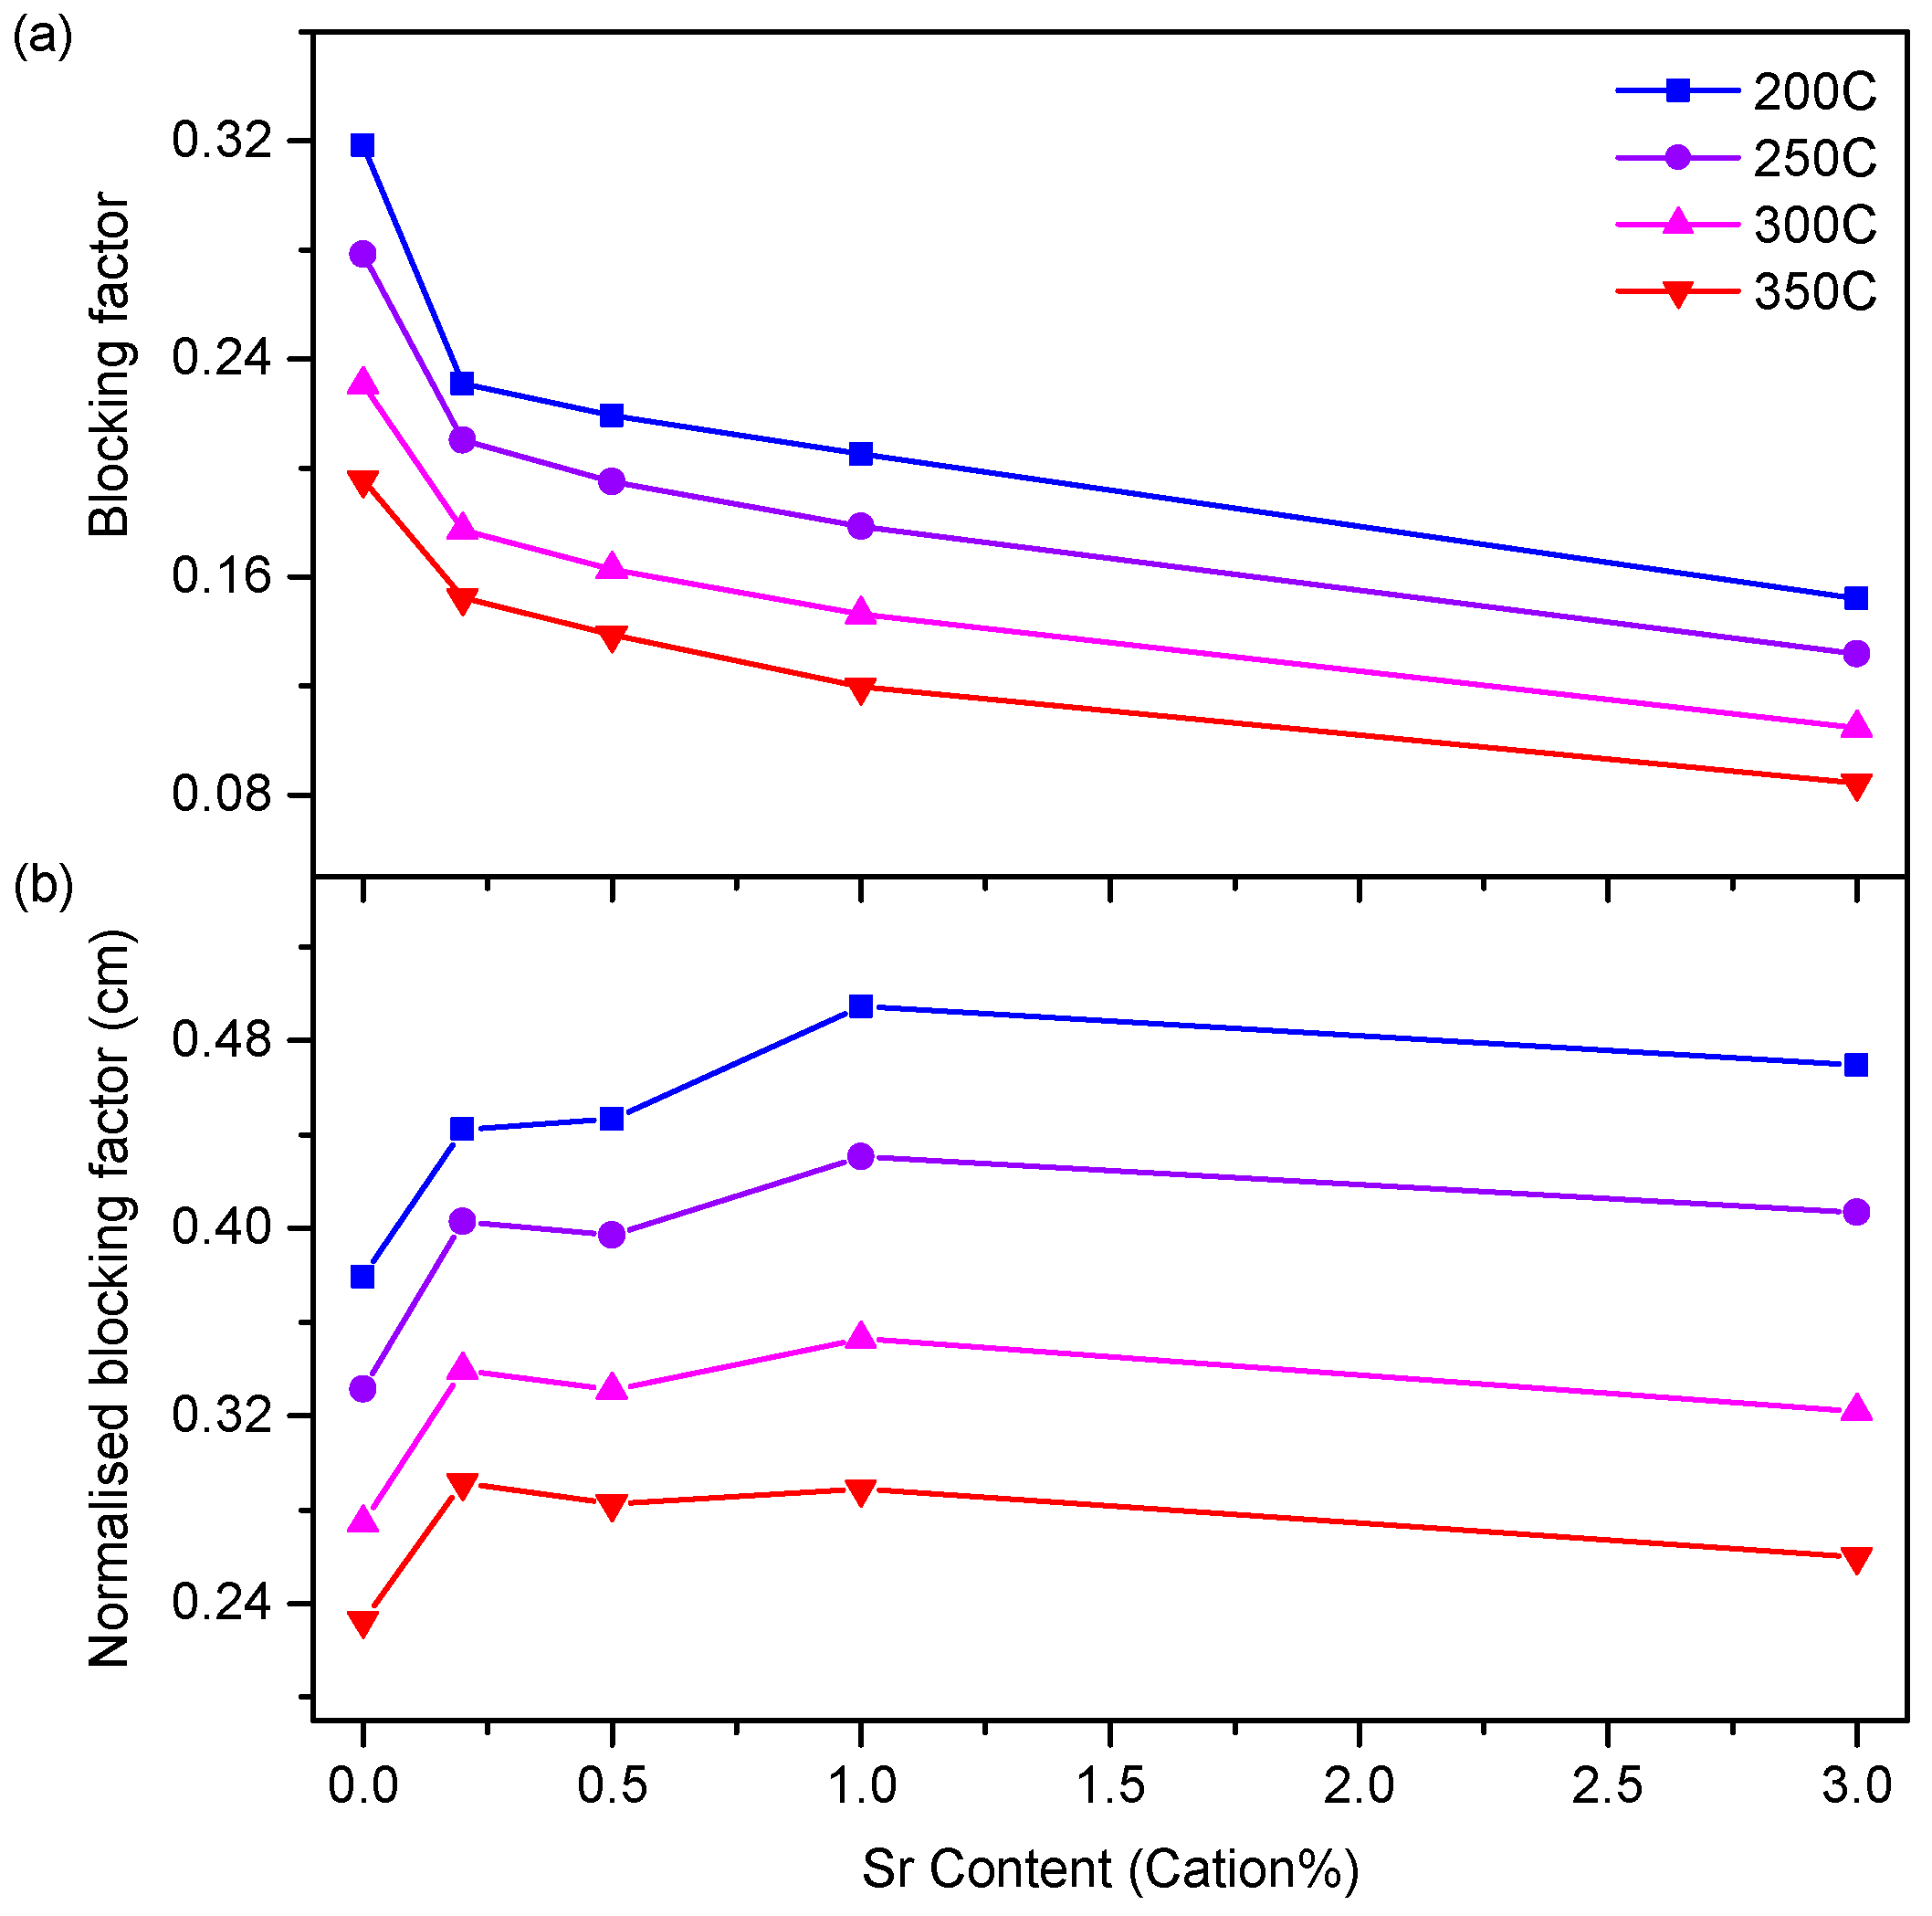
Figure 12a shows a plot of the blocking factor against strontium content. At all measured temperatures it shows a large decrease in the blocking factor between the undoped sample (Sr00) and the doped samples (Sr02–Sr30), then a linear decrease with increasing strontium content. The size of the initial drop decreases with increasing temperature and the slope of the decrease from Sr02 to Sr30 is similar for all temperatures. (The data for 150 °C are not included here because, at such a low temperature, the low frequency intercept of the grain boundary arc was not included in the corresponding Nyquist spectra, and so the fit was not considered good enough to allow calculation of reliable BF values).
It is possible to semi-quantitatively describe the effect of grain size on the blocking factor. This allows the factors affecting grain boundary conductivity to be examined in more detail. Assuming that the magnitude of the blocking factor is directly proportional to the number of grain boundaries per unit length in the sample, it is possible to get a value for BF normalised for grain size, NBF. As the number of grain boundaries per unit length, ρgb, is inversely proportional to grain diameter then ρgb is related to grain area, GA, as shown in Equation (3).
ρ g b   1 G A
It is then possible to define the normalised blocking factor as the blocking factor divided by ρgb as shown in Equation (4).
N B F = B F ρ g b
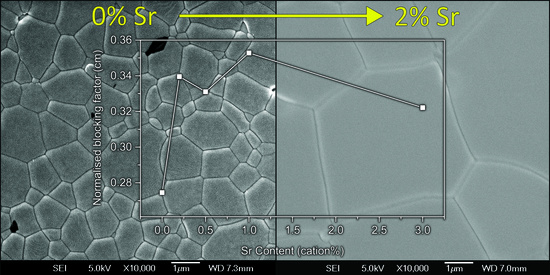
Values for the normalised blocking factor are plotted in Figure 12b. As with the blocking factor, there is a step between the undoped material (Sr00) and the doped materials (Sr02–pSr03) followed by a linear trend. However, the step is now reduced in size and the linear region is almost flat.
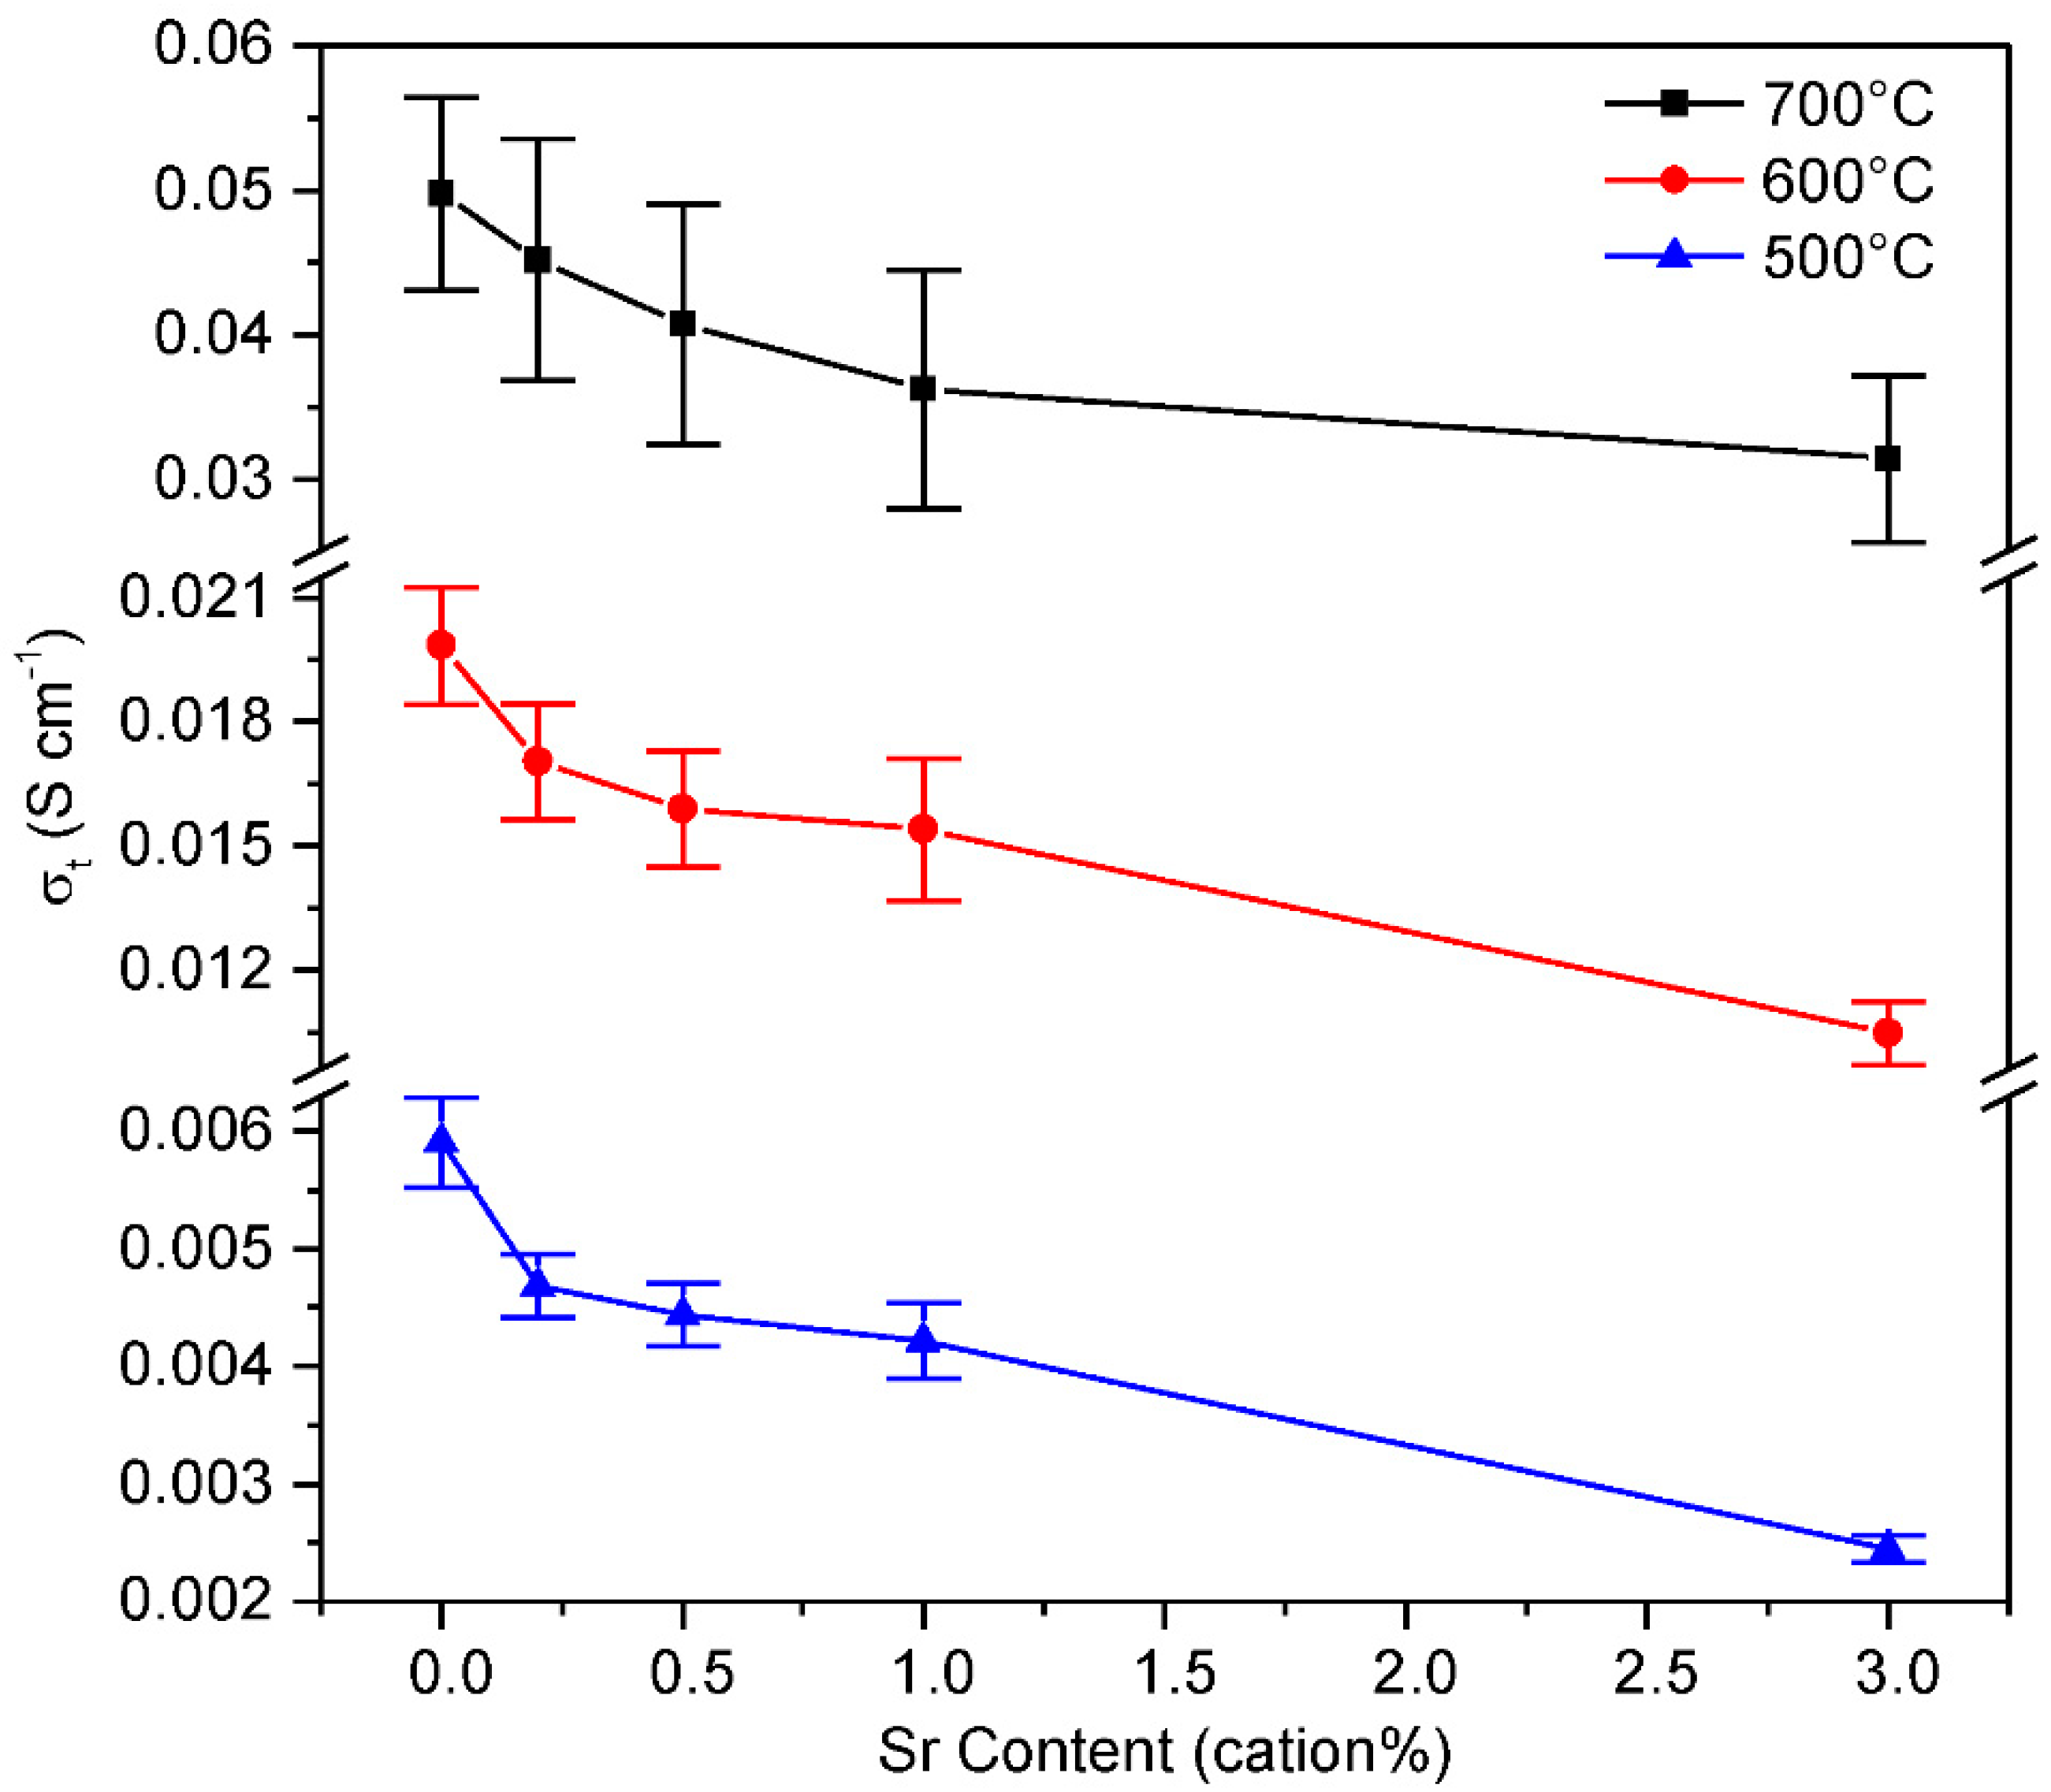
Finally, to evaluate these materials as candidates for SOFC electrolytes, the total conductivity at realistic operating temperatures should be considered. Figure 13 shows the variation of total conductivity with strontium content at 500 °C, 600 °C and 700 °C. The trends are similar to those at 250 °C, shown in Figure 11, with a linear decrease in conductivity with strontium content. It is apparent from the plot that the relative decrease in conductivity with increasing strontium content is reduced as temperature increases. The decreases from Sr00 to Sr30 at 500 °C, 600 °C and 700 °C were 47%, 37% and 22%, respectively.

4. Discussion

4.1. Synthesis

The composition of the synthesised powders was checked by ICP-MS analysis. Table 1 shows that the concentrations of Sm and Sr are within the nominal values; however, that of Ce is lower than expected. The decreased Ce concentration is approximately equal to the concentration of the Gd impurity. This suggests that Gd was introduced as an impurity in the cerium nitrate. The concentration of impurities found in the powders are within the specified purities of the metal nitrates used in the synthesis: 99.5% for the cerium nitrate hexahydrate and 99.9% for the samarium nitrate hexahydrate. Impurities like the minor lanthanide impurities are likely to be present in most doped ceria electrolytes, as reagents of 99.9% purity are among the most commonly used. The concentration of the Gd impurity, however, is high enough that it may have a small, but significant, effect on the material properties. A commonly used reagent is 99.5% cerium nitrate hexahydrate [5,6,7]; however, it is not known if the Gd impurity is present in such materials, as elemental analysis is not usually carried out. There is no appreciable systematic difference between materials synthesised with 99.5% or 99.9% pure reagents in the literature, though differences would likely be obscured by other larger differences between the materials.
Examination of previous studies on strontium doping indicated that strontium should be fully soluble in Ce0.8Sm0.2O2−δ at the synthesised levels of doping. The linear variation in XRD lattice parameter and retention of a single phase Fm-3m crystal structure confirmed this. The values for the crystallite size were in the range expected from previous work using the same synthesis method [25]. The decrease in the crystallite size of the powder with increasing strontium content is, however, in contrast to the increases in density and grain size in the final sintered materials. The crystallite size of the powder is determined by the conditions of the sol-gel synthesis and subsequent calcination. There are two other reports of the relationship between strontium doping and crystallite size of co-doped ceria. These studies looked at the Ce0.8+x Sm0.2−2xSrxO2−δ [22] (x = 0–0.06) and Ce0.9Mg0.1−xSrxO1.9 [21] (x = 0–0.06). Both showed slight variation in crystallite size, but no overall trend, suggesting that there was no direct relationship to the strontium content. These two systems vary from the one in this study, however, in that their oxygen vacancy concentrations were kept constant as strontium content was changed. In addition, it has also been observed previously that crystallite size decreased from 11 nm to 8 nm when the samarium content of Ce1−xSmxO2−δ was increased from x = 0.1 to x = 0.3 in materials made under the same conditions as used in the present study, and that crystallite size was strongly affected by the calcination conditions [25]. In this system oxygen vacancy concentration did increase. There is a possible mechanism by which an increase in oxygen vacancy concentration could cause a drop in cation diffusivity, inhibiting crystallite growth during calcination. Chen et al. [28] proposed that the rate-limiting diffusion step in aliovalently doped ceria is interstitial cation diffusion through oxygen vacancies and that this process can be hindered by the association of vacancies with other species. It is also known that as the concentration of dopants and vacancies increases, there is a greater tendency for these associates to form [29,30]. It follows that the parallel increase in vacancy and Sr concentration in the Ce0.8−xSm0.2SrxO2−δ materials studied here could reduce cation diffusion, and therefore slow crystallite growth at the intermediate temperatures used for their synthesis and calcination. It should be noted that this effect does not contradict the observed improvements in sintering and grain growth with increasing Sr content, since associated defects are thought to be mostly absent by 1000 °C [31].
The increase in the final density of the sample with increasing strontium content is a clear sign of an improved rate of sintering. As was mentioned in the Introduction, almost all studies on strontium co-doping showed that sinterability was improved with strontium addition. The exception is a study on Ce0.8+x Sm0.2−2xSrxO2−δ by Jaiswal et al. [22], which does not show a clear trend, but does suggest a decrease. The observation of a plateau in density at strontium doping levels of more than 1 mol% is in agreement with Zheng et al., who also found improvements in density were negligible above this level of strontium in Ce0.8Sm0.2O2−δ [15]. Only two previous studies give a mechanism for the improvement in sintering. Zheng et al. [15] suggest that viscous flow could be occurring during sintering, though they do not provide any details, whilst Lane et al. [10] point out the possibility of liquid phase sintering by the formation of a strontia-silica phase which is liquid at sintering temperatures. Neither mechanism is proven, however. Sintering is ultimately governed by diffusion, so improvements must result from an enhancement in diffusion. Possible mechanisms for diffusion enhancement are discussed in relation to grain growth in the next section.

4.2. Microstructure

Like the improvements in sintering, the increase in grain size with strontium content was expected. Other work on the relationship between grain size and strontium doping has not studied as many compositions and sintering temperatures, however. The log-normal distribution of grain size, shown in Figure 3, indicated that grain growth was normal in all samples [32]. The trends in grain size with strontium content and sintering temperature give a detailed description of the progression of grain size. These trends, in particular the step in grain size when sintering at 1350 °C, can be explained by features of the sintering process. There are two distinct stages of sintering: densification and pore elimination; and grain growth. Until pores are eliminated from the material, they pin grain boundaries, greatly slowing grain growth. The samples sintered at 1350 °C show this transition. Below 0.5% doping grain growth is in the slow, densification and pore elimination stage, but above 1% doping samples are in the fast grain growth stage. The two differing rates of grain growth are why a 56 fold difference in grain area is seen between high and low strontium samples sintered at 1350 °C. By contrast, samples sintered at 1250 °C appear all to be in the slow grain growth regime and samples sintered at 1450 °C to all be in the fast grain growth regime, and therefore each shows a linear relationship between grain area and strontium content. It might be expected that samples sintered at 1450 °C would not show a completely linear increase with strontium content as there could still be a change in growth regime, but at lower strontium content than was seen at 1350 °C. In fact, it can be seen in Figure 4c that the grain size is indeed depressed somewhat at the lowest strontium content.
As with the sintering improvements, faster grain growth is a result of improved diffusion. It is likely that the mechanism for this improvement is the same for sintering and grain growth. Let us consider first the suggestions of Lane et al. and Zheng et al., that liquid phase sintering or viscous flow occurs. It might be expected that if strontium introduces a new, faster diffusion mechanism that a step change in grain size would occur between the doped samples and the undoped sample. This is the case, but only for the sample sintered at 1450 °C, and may just be due to the grain growth effects discussed previously. Therefore, while it is possible that liquid phase sintering or viscous flow is the mechanism by which diffusion is improved, it is not possible to make a conclusion based on the present results. In order to determine the mechanism, it would probably be necessary to perform a more detailed study of grain growth variation with sintering time, which would allow the calculation of the activation energy and sintering exponent.

4.3. Conductivity

The samples for conductivity measurements were sintered at 1450 °C for 4 h. This sintering regime was used as it is close to the regime found to give maximum conductivity for Ce0.8Sm0.2O2−δ powders synthesised by the same method [25]. Therefore, the undoped sample is treated as the standard material against which the new materials should be compared. None of the strontium doped compositions showed a significant improvement in conductivity compared to the undoped sample at any measurement temperature, though the relative differences in total conductivity did change with temperature.
Whilst the trends and relative values of the results are clear, in order to establish if the results are significant, it is necessary to look at the absolute values of conductivity and compare them to the literature. First, Ce0.8Sm0.2O2−δ will be considered in order to establish the validity of the reference sample. The total conductivity of the Ce0.8Sm0.2O2−δ sample at 600 °C was 0.020 ± 0.001 S cm−1, whilst that of a sample synthesised by Kosinski et al. [25] using the same method, though sintered at 1450 °C for 6 h, had a similar total conductivity of 0.018 S cm−1 at 600 °C. The similarity of the values confirms that the sample is a reliable standard. For a broader comparison, the total conductivity at 600 °C of the Ce0.8Sm0.2O2−δ sample in other studies on strontium doping varies from 0.0031 S cm−1 (Gao et al.) [19] to 0.013 S cm−1 (Jaiswal et al.) [22], respectively, 85% and 35% less conductive than the same sample in this study. This wide range of conductivities for materials which are nominally the same is mostly due to variation in the grain boundary conductivity. While this comparison of Ce0.8Sm0.2O2−δ samples is useful to compare the baseline, the most useful comparison, in terms of absolute values of conductivity, is between the conductivity of the most conductive sample in this and other studies on strontium doping. For total conductivity at 600 °C, the conductivity of Ce0.8Sm0.2O2−δ in this study (0.020 S cm−1) compares favourably to the highest total conductivities in other studies which include, 0.008 S cm−1 (Ce0.8(Sm0.7Sr0.3)0.2)O2−δ), [19] 0.007 S cm−1 (Ce0.78Sm0.2Sr0.02O1.88), [11] 0.013 S cm−1 (Ce0.79Gd0.2Sr0.01O1.9−δ), [16] and 0.027 S cm−1 (Ce0.82Sm0.16Sr0.02O1.90) [22]. The latter sample, produced by Jaiswal et al. [22] is, in fact, the only sample in any strontium doping study to show higher conductivity than the pure Ce0.8Sm0.2O2−δ in this study. It should be noted that the value reported by these authors is significantly higher than any published previously for any aliovalently doped ceria. Therefore, further work to confirm such a significant effect in the case of strontium-doping with constant oxygen vacancy concentration would be desirable. The implication of this comparison of conductivity values of the most conductive samples is that strontium co-doping may not be an effective strategy to increase the conductivity of aliovalently doped ceria materials past that of the best existing materials.
In order to gain an understanding of the causes of the changes in total conductivity the bulk and grain boundary conductivity components must be considered. Generally, the bulk conductivity depends mostly on the intrinsic conductivity of the material, while the grain boundary conductivity depends on the microstructure and grain boundary composition as well as the intrinsic conductivity [33]. As can be seen in Figure 11, changes in total conductivity are the result of corresponding changes in both the bulk and grain boundary components of conductivity. By examining each component in turn, the changes in total conductivity can be explained.
The grain boundary conductivity will be considered first to explain microstructural and processing effects, then the remaining intrinsic effects will be considered. It is generally found that the intrinsic conductivity of the grain boundary is directly linked to that of the bulk, if microstructural and impurity effects are discounted. Therefore, it is useful to consider the blocking factor, as this quantifies the magnitude of the grain boundary resistance, Rgb, relative to the bulk resistance, Rb (Equation (2)). Figure 12a shows that the blocking factor decreases with increasing strontium content. This means that the effects of strontium doping on impurities at the grain boundary or on the microstructure must be beneficial. Figure 12a also shows, however, that the decrease is not linear and that the trend changes with temperature. There is a step change in blocking factor between the doped and the undoped samples, the magnitude of which decreases with increasing temperature. The fact that the size of this step changes with temperature implies that it is due to at least one factor other than grain size, which is invariant with temperature, and these factors will be considered after the effect of grain size is quantified. It is clear, from the results of the grain size study, that doping with strontium does lead to increased grain size and therefore will have the effect of decreasing the blocking factor. Figure 4c shows the variation of grain size with strontium content for samples sintered under the same conditions as the impedance samples. There is a notable symmetry between the shape of this curve and that of the blocking factor in Figure 11a; a jump between Sr00 and Sr02 followed by a linear section as strontium content is increased further. This suggests that the blocking factor may be strongly determined by grain size. To examine this possibility, the normalised blocking factor, plotted in Figure 12b, takes into account the expected effect of grain size on blocking factor. It appears that the normalised blocking factor also displays a step followed by a linear region. If the changes in blocking factor were due only to the changes in grain size then one would expect the normalised blocking factor to be constant for a given temperature. From Figure 12b, it appears that this may essentially be the case from 0.20 cation% upwards, although there is still some variation. Between 0 and 0.20 cation%, however, there is still a change in normalised blocking factor. This analysis of the blocking factor and the normalised blocking factor together indicate that increased grain size is responsible for the decrease in blocking factor from 0.20 to 3 cation% strontium doping. As the decrease from 0 to 0.20% is not fully accounted for by grain size, however, it must be due to a change in the structure or local composition of the grain boundary. It is likely that this is related to silicon impurities. As discussed in the Introduction, it has been reported that only a few cation% of strontium doping is sufficient to mitigate the effects of hundreds of ppm of silicon impurity [10,12]. XRF analysis shows the level of silicon in the samples of the current study to be less than 10ppm. It is therefore probable that 0.20 cation% addition of strontium is sufficient to fully mitigate the effects of silicon impurities in these samples and that further additions will not have any further effect in this regard. This would result in the variation of the normalised blocking factor with strontium content that we observe. In summary, there are improvements in the blocking factor with increasing strontium content due to silicon scavenging and increased grain size. Now, considering this analysis of the blocking factor the trends in grain boundary conductivity can be explained. The observed grain boundary conductivity at 300 °C, shown in Figure 11c, shows a slight increase up to 0.5 cation% strontium followed by a decrease. This trend results from the combination of positive local effects on the grain boundary, described by the blocking factor, and the underlying decrease in intrinsic bulk conductivity, which can be seen in Figure 11b. In addition, the trend in the activation energy associated with grain boundary processes in Figure 9 shows a minimum at 0.20 cation% strontium. It is probable that this too is linked to the scavenging of silicon by strontium, so reducing the overall energy barrier to conduction of the grain boundaries.
The bulk component of the conductivity will now be examined. As previously explained, once microstructural factors are accounted for, the intrinsic conductivity of the bulk is the main factor in determining the overall trend in total conductivity. The changes in bulk conductivity with strontium content will be discussed with reference to the oxygen vacancy concentration, average dopant ionic radius and the valency of the dopants. Oxygen vacancies play a crucial role by enabling oxygen mobility. However, if the vacancy concentration is too high the vacancies tend to cluster and become trapped leading to a decrease in ionic conductivity. As a result, in aliovalently doped ceria, a vacancy concentration of 0.05–0.1 is found to be optimal, depending on the identity of the dopants and the measurement temperature. Dopant ionic radius is also considered to have an optimal value and this is often thought of in terms of minimisation of the elastic strain in the lattice which occurs due to the mismatch between the radius of the dopant cation and that of the host lattice. Finally, dopant valency is observed to strongly affect conductivity with trivalent dopants, resulting in consistently higher conductivities than for divalent dopants. It can be seen from Figure 8a that increasing strontium doping decreased the bulk conductivity at all temperatures for which the components of conductivity could be resolved. It is well established that the oxygen vacancy concentration and average dopant radius are the two main variables which must be optimised to maximise conductivity in aliovalently doped ceria [34,35,36]. As Ce0.8Sm0.2O2−δ is known to be near optimal in these respects at intermediate temperatures, changes in these two variables may have a negative impact on conductivity. Assuming ideal behaviour, as the strontium content in the samples increased up to the maximum of 3 cation% the molar oxygen vacancy concentration would increase from 0.10 to 0.13 and the average dopant radius would increase from 1.079 to 1.100 Å. Generally, variations in conductivity of doped ceria with vacancy concentration and dopant ionic radius follow distinct trends which allow a comparison to be made with the samples in this study. These trends are studied by varying the dopant concentration or dopant species, respectively. A comparison between the magnitude of the changes in conductivity in this study with selected others should reveal the likely reasons for the decrease in bulk conductivity with increasing strontium content.
Considering first the effect of vacancy concentration, a comparison can be made with purely samarium doped ceria. The effect of an increase from 20 mole% to 25 and 30 mole% samarium—i.e., a 25 or 50% increase in oxygen vacancy concentration-on total conductivity—has been reported [25,37,38,39]. All of these studies found a decrease in total conductivity at intermediate temperatures when molar oxygen vacancy concentration was increased beyond 0.1. Kosinski et al. [25] provide directly comparable conductivity values for the bulk component of conductivity for oxygen vacancy concentrations of 0.1 (Ce0.8Sm0.2O2−δ) and 0.15 (Ce0.7Sm0.3O2−δ) at 300 °C. Interpolating linearly between the bulk conductivity of the two samples at 300 °C gives an approximate value of 50% for the expected decrease in bulk conductivity for an increase in vacancy concentration from 0.10 to 0.13. Therefore, by comparison with the 76% decrease in bulk conductivity observed on going from Sr00 to Sr30 at 300 °C, it seems likely that the majority of the decrease in bulk conductivity observed in the present study is a result of the increase in oxygen vacancy concentration.
Now the effect of the variation in average dopant radius will be examined. It is increasingly considered to be the case that the change in bulk conductivity with varying average dopant radius for co-doped materials follows a similar trend to singly doped materials [40,41,42]. The average dopant radius of 1.10 Å, for Sr30, is intermediate between those of Sm, 1.079 Å, and Nd, 1.109 Å. Salih et al. found the bulk conductivity of Ce0.8Nd0.2O2−δ at 300 °C to be 7.2 × 10⁻⁵ S cm−1. Interpolating between that value and the bulk conductivity of Ce0.8Sm0.2O2−δ at 300 °C from the present study, 9.5 × 10⁻⁵ S cm−1, implies a decrease in conductivity of 17% due to decreased average ionic radius on going from Sr00 to Sr30.
A final change which occurs with strontium doping, which has not yet been addressed, is the divalency of the Sr2+ cations compared to the trivalency of Sm3+. It has been noted that the attraction of a strontium cation, which has an effective charge of 2−, for an oxygen ion vacancy, which has an effective charge of 2+, is likely to be stronger than that of a samarium cation, which has an effective charge of only −1 [15,19]. In addition to this, a computational study showed that the binding energy of divalent dopant clusters is higher than for trivalent clusters [29]. The implication of this increased attraction is that divalent doping would lead to fewer free vacancies and therefore lower ionic conductivity. It is the case that divalently doped ceria generally shows lower ionic conductivity than trivalently doped [26]. Therefore, it would be expected that this may be responsible for a small part of the decreased bulk conductivity observed in these samples.
In summary, the observed decreases in conductivity are most likely to be due to a combination of increased oxygen vacancy concentration, increased average dopant ionic radius and the presence of more strongly charged strontium cations. The oxygen vacancy concentration is responsible for the majority of the decrease, with a large minority due to the ionic radius and a minor amount due to the more strongly charged cations.

5. Conclusions

A low temperature chemical method was successfully employed to prepare the compositional series Ce0.8−xSm0.2SrxO2−δ with x = 0 to 0.04. By XRD, these products were found to be phase-pure mixed oxides with the fluorite structure and to obey Vegard’s law. Silicon impurity levels were found to be below 10 ppm by XRF, and this was attributed to the synthesis method used. The materials consisted of fine powders whose crystallite sizes were between 6.5 and 11 nm and decreased with increasing strontium content. On pressing the pellets and firing at 1450 °C for 4 h, increasing strontium content caused relative density to increase to a plateau above 1 cation% and gave rise to a dramatic, almost linear increase in grain size. Grain size data for each composition fitted well to log normal distributions.
In impedance measurements, the grain boundary arcs were much smaller than the bulk arcs in all impedance spectra. Bulk (or intrinsic) conductivity decreased monotonically with increasing strontium content and total conductivity followed the same trend. The grain boundary conductivity, however, passed through a maximum at low strontium content, at around 0.20 cation mole%, before falling steadily as strontium content increased further. It is interesting that the activation energies for total and bulk conductivity increased roughly linearly with increasing strontium content whereas, for grain boundary conductivity, the activation energy passed through a minimum—also at around 0.20 cation mole%—before rising as strontium content increased above this value.
Total conductivity of the undoped material at realistic operating temperatures for intermediate temperature SOFCs (~600 °C) compared very favourably with values reported in the literature for doped cerias. Sr00 had the highest total conductivity at all measurement temperatures except at the highest, 800 °C, at which Sr02 had a similar value.
To consider the trends in the grain boundary and bulk in more detail, first the blocking factor, the ratio of grain boundary to bulk resistance, was plotted against strontium content. The blocking factor showed a gentle decrease with increasing strontium content from 0.50 cation% upwards, but exhibited a sharp drop on passing from the undoped sample to the 0.20 cation mole% sample. This step feature was reduced in size, but persisted, when blocking factor was normalised to remove the effect of increasing grain size with increasing strontium content. This step—which coincides with both the maximum in grain boundary conductivity and the minimum in the activation energy of grain boundary conductivity—was attributed to the improvement of grain conductivity caused by the scavenging of silicon impurities by this small addition of strontium. Since silicon levels were low in these materials, a small amount of dopant was expected to be sufficient to fully mitigate the effects of silicon impurities. It is expected, therefore, that in more heavily Si-contaminated samples, higher degrees of Sr doping would be beneficial.
By separating the contributions first of bulk and grain boundary, and then of the effect of grain size, to the ionic conductivity of these samples, it has been possible to elucidate the individual effects of strontium doping.

Author Contributions

Conceptualization, R.T.B. and T.S.; methodology, R.T.B. and T.S.; formal analysis, T.S. and R.T.B.; investigation, TS; resources, R.T.B.; data curation, T.S.; writing—original draft preparation, T.S.; writing—review and editing, R.T.B. and T.S.; supervision, R.T.B.; project administration, R.T.B.; funding acquisition, R.T.B. All authors have read and agreed to the published version of the manuscript.

Funding

This research received no external funding. The APC was waived by the publishers.

Data Availability Statement

The dataset supporting this research is available at: http://www.st-andrews.ac.uk/profile/rtb5 (accessed on 9 August 2021).

Acknowledgments

We thank the School of Chemistry, University of St Andrews for a studentship for T.S. Electron microscopy was carried out at the Electron Microscopy Facility, University of St Andrews.

Conflicts of Interest

There are no conflict of interest.

References

  1. Minh, N.M.; Takahashi, T. Science and Technology of Ceramic Fuel Cells, 1st ed.; Elsevier: New York, NY, USA, 1995; pp. 1–14. [Google Scholar]
  2. Sharifzadeh, M. (Ed.) Design and Operation of Solid Oxide Fuel Cells: The Systems Engineering Vision; Elsevier: New York, NY, USA, 2019. [Google Scholar]
  3. Fergus, J.W.; Hui, R.; Li, X.; Wilkinson, D.P.; Zhang, J. (Eds.) Solid Oxide Fuel Cells: Materials Properties and Performance; CRC Press: Boca Raton, FL, USA, 2019. [Google Scholar]
  4. Huang, K.; Goodenough, J.B. Solid Oxide Fuel Cell Technology: Principles, Performance and Operations; Elsevier: New York, NY, USA, 2009. [Google Scholar]
  5. Wachsman, E.D.; Lee, K.T. Lowering the Temperature of Solid Oxide Fuel Cells. Science 2011, 334, 935–939. [Google Scholar] [CrossRef]
  6. Jacobson, A.J. Materials for Solid Oxide Fuel Cells. Chem. Mater. 2010, 22, 660–674. [Google Scholar] [CrossRef]
  7. Leah, R.; Bone, A.; Lankin, M.; Selcuk, A.; Pierce, R.; Rees, L.; Corcoran, D.; Muhl, P.; Dehaney-Steven, Z.; Brackenbury, C.; et al. Low-Cost, REDOX-Stable, Low-Temperature SOFC Developed by Ceres Power for Multiple Applications: Latest Development Update. ECS Trans. 2013, 57, 461–470. [Google Scholar] [CrossRef]
  8. Coles-Aldridge, A.V.; Baker, R.T. Ionic conductivity in multiply substituted ceria-based electrolytes. Solid State Ion. 2018, 316, 9–19. [Google Scholar] [CrossRef] [Green Version]
  9. Coles-Aldridge, A.V.; Baker, R.T. Oxygen ion conductivity in ceria-based electrolytes co-doped with samarium and gadolinium. Solid State Ion. 2020, 347, 115255. [Google Scholar] [CrossRef]
  10. Lane, J.; Neff, J.; Christie, G. Mitigation of the deleterious effect of silicon species on the conductivity of ceria electrolytes. Solid State Ion. 2006, 177, 1911–1915. [Google Scholar] [CrossRef]
  11. Yeh, T.-H.; Chou, C.-C. Ionic conductivity investigation in samarium and strontium co-doped ceria system. Phys. Scr. 2007, T129, 303–307. [Google Scholar] [CrossRef]
  12. Kim, D.K.; Cho, P.S.; Lee, J.-H.; Kim, D.-Y.; Park, H.-M.; Auchterlonie, G.; Drennan, J. Mitigation of highly resistive grain-boundary phase in gadolinia-doped ceria by the addition of SrO. Electrochem. Solid-State Lett. 2007, 10, 91–95. [Google Scholar] [CrossRef]
  13. Cioateră, N.; Pârvulescu, V.; Rolle, A.; Vannier, R.N. Effect of strontium addition on europium-doped ceria properties. Solid State Ion. 2009, 180, 681–687. [Google Scholar] [CrossRef]
  14. Ramesh, S.; Reddy, C.V. Properties of Al2O3–Sm2O3–CeO2 electrolyte. Acta Phys. Pol. A 2009, 115, 909–913. [Google Scholar] [CrossRef]
  15. Zheng, Y.; He, S.; Ge, L.; Zhou, M.; Chen, H.; Guo, L. Effect of Sr on Sm-doped ceria electrolyte. Int. J. Hydrog. Energy 2011, 36, 5128–5135. [Google Scholar] [CrossRef]
  16. Buchi Suresh, M.; Johnson, R. The effect of strontium doping on densification and electrical properties of Ce0.8Gd0.2O2−δ electrolyte for IT-SOFC application. Ionics 2012, 18, 291–297. [Google Scholar]
  17. Ramesh, S.; Raju, K.C.J.; Reddy, C.V. Synthesis and Characterization of Co-Doped Ceria Ceramics by Sol-Gel Method. Trans. Indian Ceram. Soc. 2011, 70, 143–147. [Google Scholar] [CrossRef]
  18. Júnior, J.M.S.; Malta, L.F.B.; Garrido, F.M.S.; Ogasawara, T.; Medeiros, M.E. Raman and Rietveld structural characterization of sintered alkaline earth doped ceria. Mater. Chem. Phys. 2012, 135, 957–964. [Google Scholar] [CrossRef]
  19. Gao, Z.; Liu, X.; Bergman, B.; Zhao, Z. Enhanced ionic conductivity of Ce0.8Sm0.2O2−δ by Sr addition. J. Power Sources 2012, 208, 225–231. [Google Scholar] [CrossRef]
  20. Horovistiz, A.L.; Muccillo, E.N.S. Microstructural and electrical characterizations of chemically prepared Ce0.8Gd0.2−x(Ag, Sr)xO1.9 (0 ≤ x ≤ 0.02). Solid State Ion. 2012, 225, 428–431. [Google Scholar] [CrossRef]
  21. Jaiswal, N.; Kumar, D.; Upadhyay, S.; Parkash, O. Effect of Mg and Sr co-doping on the electrical properties of ceria-based electrolyte materials for intermediate temperature solid oxide fuel cells. J. Alloy. Compd. 2013, 577, 456–462. [Google Scholar] [CrossRef]
  22. Jaiswal, N.; Upadhyay, S.; Kumar, D.; Parkash, O. Sm3+ and Sr2+ co-doped ceria prepared by citrate–nitrate auto-combustion method. Int. J. Hydrog. Energy 2014, 39, 543–551. [Google Scholar] [CrossRef]
  23. Kashyap, D.; Patro, P.K.; Lenka, R.K.; Mahata, T.; Sinha, P.K. Effects of Gd and Sr co-doping in CeO2 for electrolyte application in solid oxide fuel cell (SOFC). Ceram. Int. 2014, 40, 11869–11875. [Google Scholar] [CrossRef]
  24. Yamamura, H.; Katoh, E.; Ichikawa, M.; Kakinuma, K.; Mori, T.; Haneda, H. Multiple doping effect on the electrical conductivity in the (Ce1−xyLaxMy)O2−δ (M = Ca, Sr) system. Electrochem 2000, 68, 455–459. [Google Scholar] [CrossRef] [Green Version]
  25. Kosinski, M.R.; Baker, R.T. Preparation and property–performance relationships in samarium-doped ceria nanopowders for solid oxide fuel cell electrolytes. J. Power Sources 2011, 196, 2498–2512. [Google Scholar] [CrossRef]
  26. Inaba, H.; Tagawa, H. Ceria-based solid electrolytes. Solid State Ion. 1996, 83, 1–16. [Google Scholar] [CrossRef]
  27. Kilner, J. Fast oxygen transport in acceptor doped oxides. Solid State Ion. 2000, 129, 13–23. [Google Scholar] [CrossRef]
  28. Chen, P.-L.; Chen, I. Role of defect interaction in boundary mobility and cation diffusivity of CeOz. J. Am. Ceram. Soc. 1994, 77, 2289–2297. [Google Scholar] [CrossRef]
  29. Li, Z.-P.; Mori, T.; Zou, J. Drennan, Defects clustering and ordering in di- and trivalently doped ceria. J. Mater. Res. Bull. 2013, 48, 807–812. [Google Scholar] [CrossRef]
  30. Ye, F.; Ou, D.R.; Mori, T. Microstructural evolution in a CeO2-Gd2O3 system. Microsc. Microanal. 2012, 18, 162–170. [Google Scholar] [CrossRef] [PubMed]
  31. Steele, B.C.H. Appraisal of Ce1−yGdyO2−y/2 electrolytes for IT-SOFC operation at 500 °C. Solid State Ion. 2000, 129, 95–110. [Google Scholar] [CrossRef]
  32. Rahaman, M.N. Sintering of Ceramics, 1st ed.; CRC Press: Boca Raton, FL, USA, 2008; pp. 105–172. [Google Scholar]
  33. Irvine, J.T.S.; Sinclair, D.C.; West, A.R. Electroceramics: Characterization by Impedance Spectroscopy. Adv. Mater. 1990, 2, 132–138. [Google Scholar] [CrossRef]
  34. Faber, J.; Geoffroy, C.; Roux, A.; Sylvestre, A.; Abelard, P. A Systematic investigation of the dc electrical conductivity of rare-earth doped ceria. Appl. Phys. A Solids Surfaces 1989, 49, 225–232. [Google Scholar] [CrossRef]
  35. Balazs, G.; Glass, R. ac impedance studies of rare earth oxide doped ceria. Solid State Ion. 1995, 76, 155–162. [Google Scholar] [CrossRef]
  36. Yahiro, H.; Eguchi, K.; Arai, H. Electrical properties and reducibilities of ceria-rare earth oxide systems and their application to solid oxide fuel cell. Solid State Ion. 1989, 36, 71–75. [Google Scholar] [CrossRef]
  37. Huang, W.; Shuk, P.; Greenblatt, M. Properties of sol-gel prepared Ce1−xSmxO2−x2 solid electrolytes. Solid State Ion. 1997, 100, 23–27. [Google Scholar] [CrossRef]
  38. Fu, Y.-P.; Wen, S.-B.; Lu, C.-H. Preparation and Characterization of Samaria-Doped Ceria Electrolyte Materials for Solid Oxide Fuel Cells. J. Am. Ceram. Soc. 2008, 91, 127–131. [Google Scholar] [CrossRef]
  39. Yahiro, H.; Eguchi, Y.; Eguchi, K.; Arai, H. Oxygen ion conductivity of the ceria-samarium oxide system with fluorite structure. J. Appl. Electrochem. 1988, 18, 527–531. [Google Scholar] [CrossRef]
  40. Yoshida, H.; Deguchi, H.; Miura, K.; Horiuchi, M.; Inagaki, T. Investigation of the relationship between the ionic conductivity and the local structures of singly and doubly doped ceria compounds using EXAFS measurement. Solid State Ion. 2001, 140, 191–199. [Google Scholar] [CrossRef]
  41. Burbano, M.; Nadin, S.; Marrocchelli, D.; Salanne, M.; Watson, G.W. Ceria co-doping: Synergistic or average effect? Phys. Chem. Chem. Phys. 2014, 16, 8320–8331. [Google Scholar] [CrossRef] [Green Version]
  42. Omar, S.; Wachsman, E.; Nino, J. A co-doping approach towards enhanced ionic conductivity in fluorite-based electrolytes. Solid State Ion. 2006, 177, 3199–3203. [Google Scholar] [CrossRef]
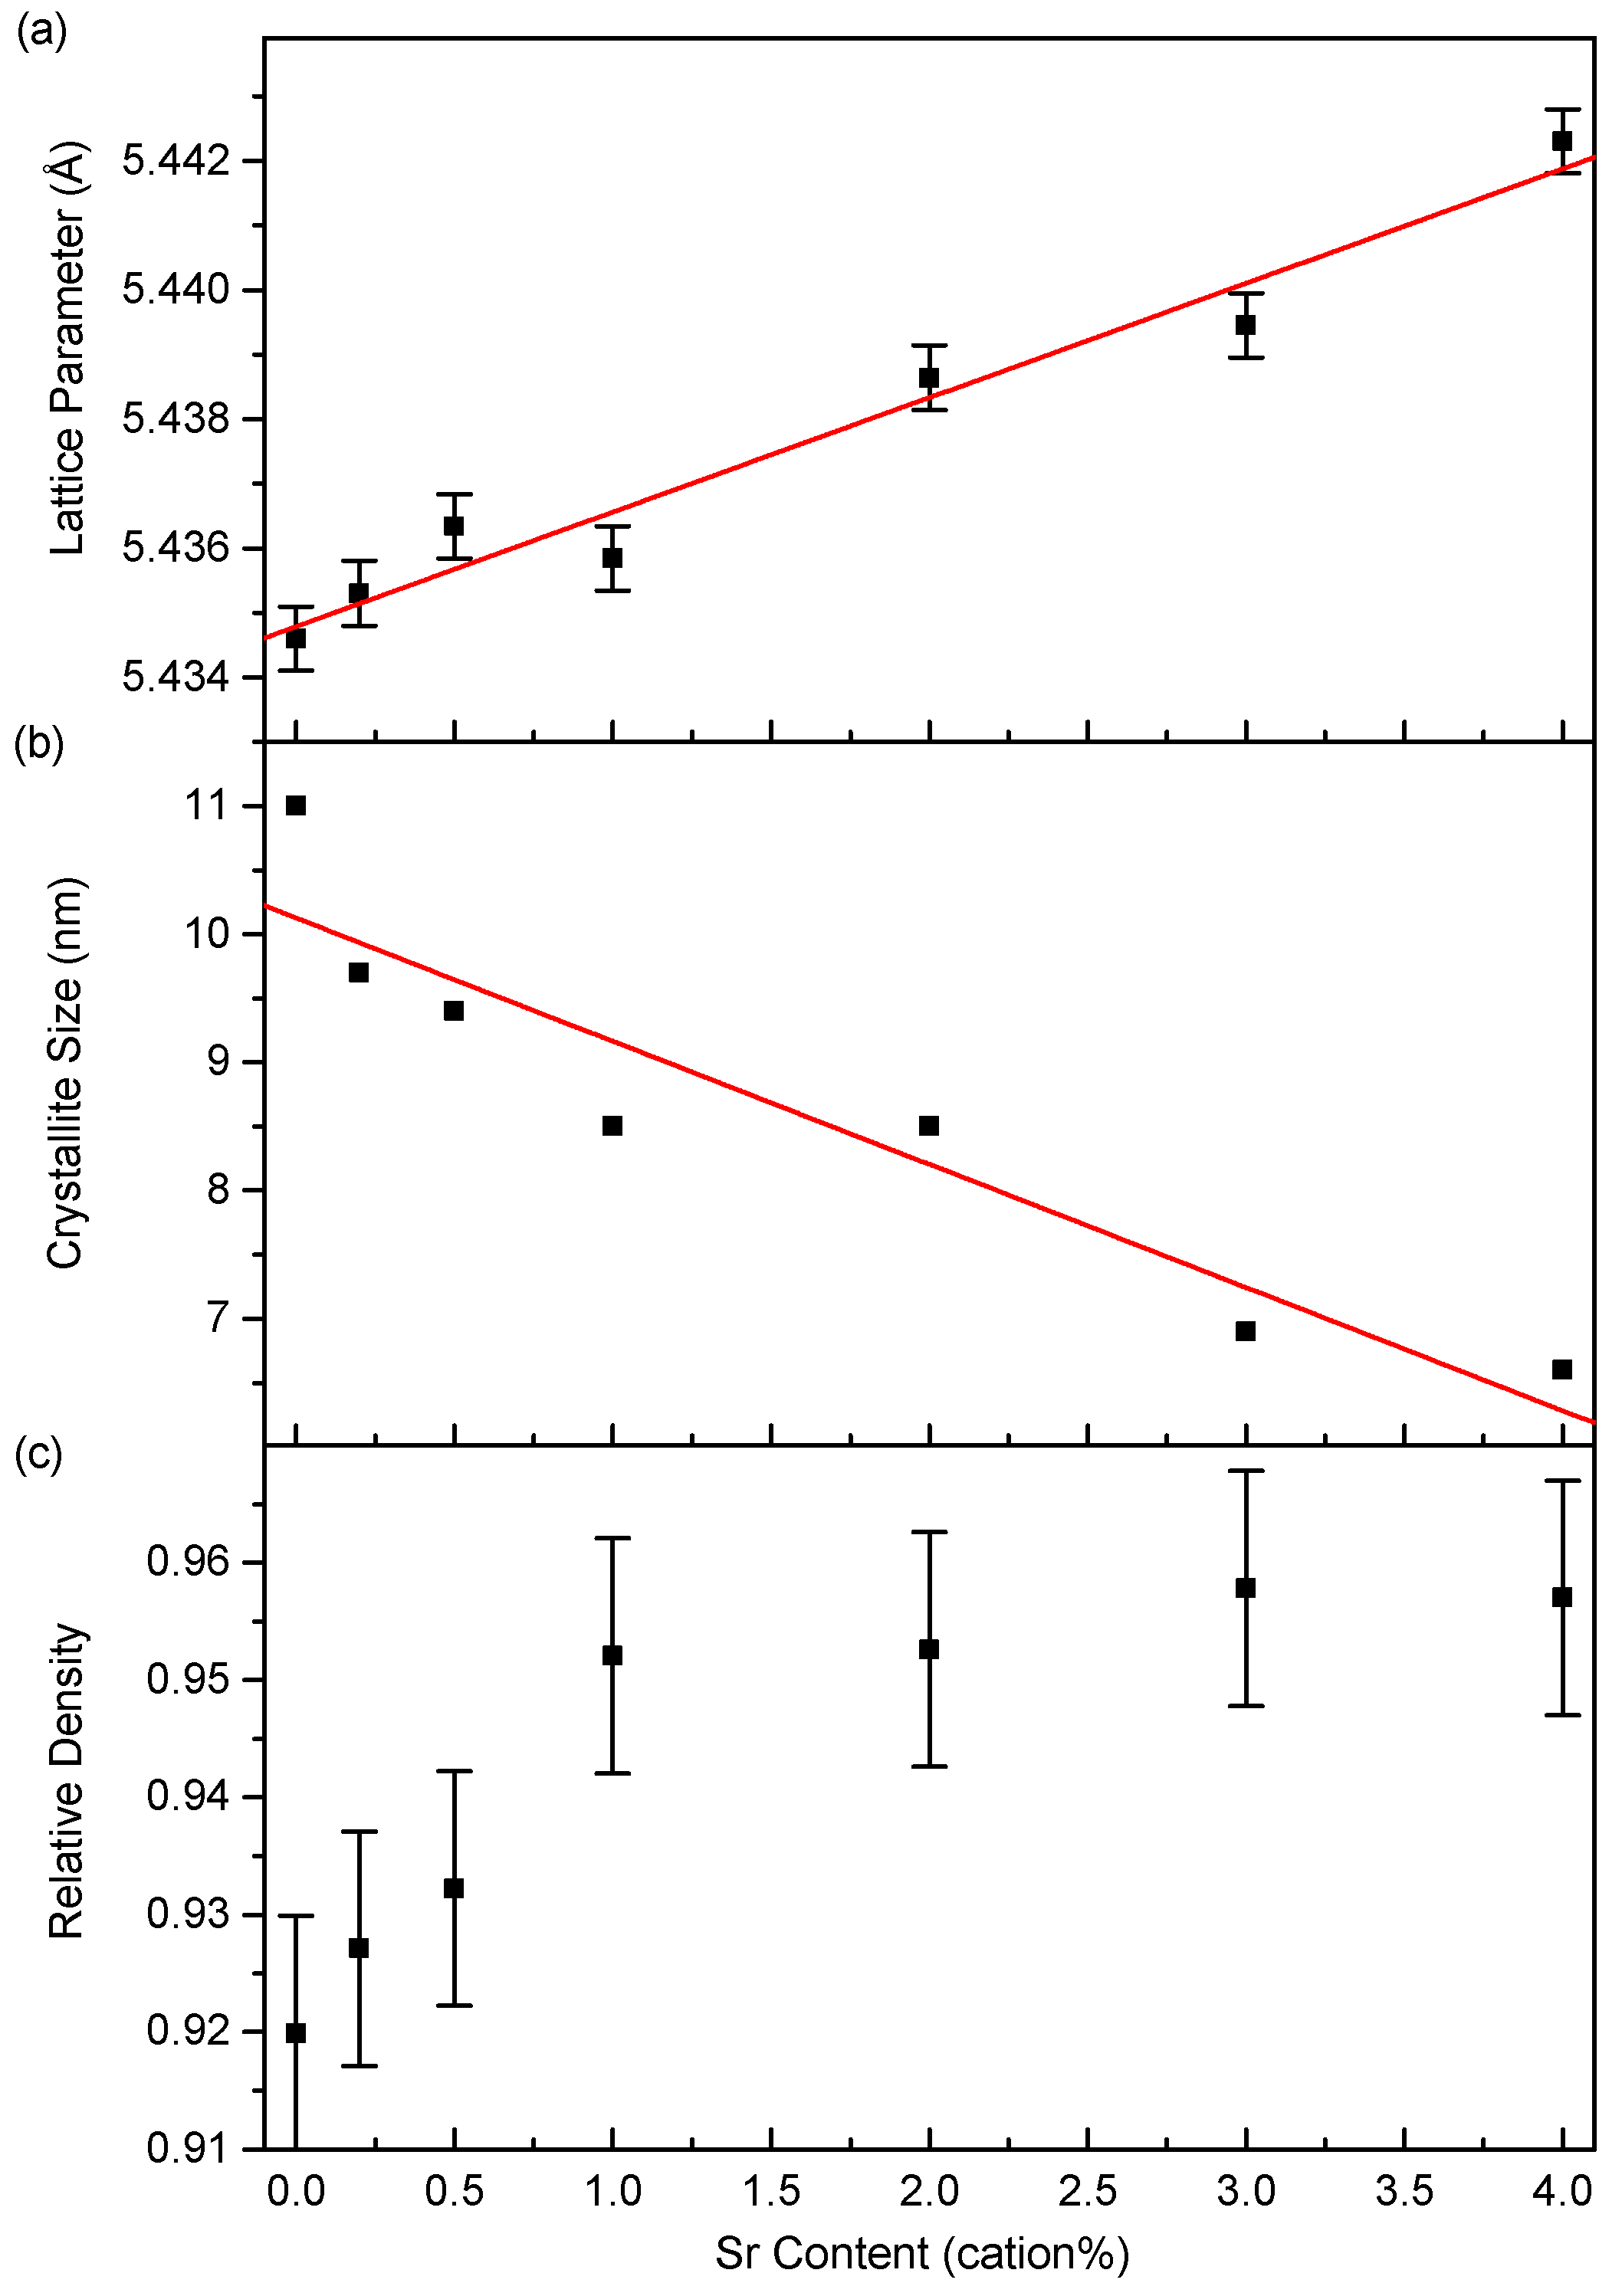
Figure 1. Plots against Sr content (x) of (a) lattice parameter, (b) average crystallite size, as calculated by the Scherrer equation, and (c) relative density of the Ce0.8−xSm0.2SrxO2−δ powders after sintering at 1450 °C for 4 h.
Solids 02 00019 g001
Figure 2. SEM micrographs of sintered and thermally etched samples of Sr00, Sr05, Sr20 and Sr40 (x = 0, 0.005, 0.020, 0.040, respectively, in Ce0.8−xSm0.2SrxO2−δ) sintered at 1250 °C, 1350 °C and 1450 °C for 4 h, as indicated.
Solids 02 00019 g002
Figure 3. Log histogram of normalised frequency against grain area for Sr05 sintered at 1350 °C for 4 h. Red dashed line shows a log normal fit.
Solids 02 00019 g003
Figure 4. Plots of average cross-sectional grain area against Sr content for all Ce0.8−xSm0.2SrxO2−δ samples sintered for 4 h at (a) 1250 °C, (b) 1350 °C and (c) 1450 °C. Plot (a) shows a linear fit of the data, and plots (b,c) show a joining line as a guide to the eye.
Solids 02 00019 g004
Figure 5. Complete Nyquist plot (a) and detail (b) showing impedance spectra for Ce0.8−xSm0.2SrxO2−δ samples indicated measured at 250 °C. Data are plotted as resistivities to normalise for variations in sample dimensions.
Solids 02 00019 g005
Figure 6. Arrhenius plots of total, bulk and grain boundary conductivity for Sr00.
Solids 02 00019 g006
Figure 7. Arrhenius plot of total conductivity of the Ce0.8−xSm0.2SrxO2−δ samples indicated as a function of temperature from 150 °C to 800 °C.
Solids 02 00019 g007
Figure 8. Arrhenius plots of (a) bulk and (b) grain boundary components of conductivity for the samples indicated.
Solids 02 00019 g008
Figure 9. Plots of activation energy as a function of Sr content for total, bulk and grain boundary ionic conductivity of Ce0.8−xSm0.2SrxO2−δ samples.
Solids 02 00019 g009
Figure 10. Normalised (a) total, (b) bulk and (c) grain boundary conductivity for the Ce0.8−xSm0.2SrxO2−δ samples indicated. Conductivity was normalised by dividing by the conductivity of the undoped sample (Sr00) at each temperature.
Solids 02 00019 g010
Figure 11. Plots of the variation of (a) total, (b) bulk and (c) grain boundary conductivities with Sr content for all Ce0.8−xSm0.2SrxO2−δ samples measured at 300 °C.
Solids 02 00019 g011
Figure 12. Plots of (a) blocking factor and (b) normalised blocking factor against strontium content for measurement temperatures from 200 °C to 350 °C.
Solids 02 00019 g012
Figure 13. Plot of total conductivity measured at 500 °C, 600 °C and 700 °C as a function of Sr content for all Ce0.8−xSm0.2SrxO2−δ samples.
Solids 02 00019 g013
Table 1. Concentrations of the main cations and Gd, as determined by ICP-MS for selected samples of Ce0.8−xSm0.2SrxO2−δ.
SampleCe (Cation%)Sm (Cation%)Sr (Cation%)Gd (Cation%)Total Minor Lanthanides (Cation%)
Sr0079.1 ± 1.320.3 ± 0.4-0.47 ± 0.020.14
Sr0278.9 ± 1.320.4 ± 0.30.2 ± 0.070.46 ± 0.0030.13
Sr2077.5 ± 2.520.0 ± 0.61.9 ± 0.060.45 ± 0.020.13
Sr4075.4 ± 0.920.2 ± 0.43.8 ± 0.060.44 ± 0.0060.13
Publisher’s Note: MDPI stays neutral with regard to jurisdictional claims in published maps and institutional affiliations.