3.1. Mineralogy Composition of RCMD
For context, the mineralogy classes used in this study can be broadly associated with different particulate sources in underground coal mines. C particles originate primarily from the coal seam and, at very fine sizes, may also include contributions from diesel engine emissions [
2,
23]. SIL and S particles are largely associated with disturbance of adjacent rock strata during cutting or drilling activities, while HM particles represent less abundant but compositionally distinct mineral phases [
22]. CB particles are most commonly associated with rock-dusting materials applied to mitigate explosion hazards, although in some regions—particularly parts of the MW—carbonate-bearing strata may also contribute CB particles (Jaramillo et al., 2022) [
13]. These associations are not exclusive but provide a useful framework for interpreting regional and temporal differences in RCMD composition.
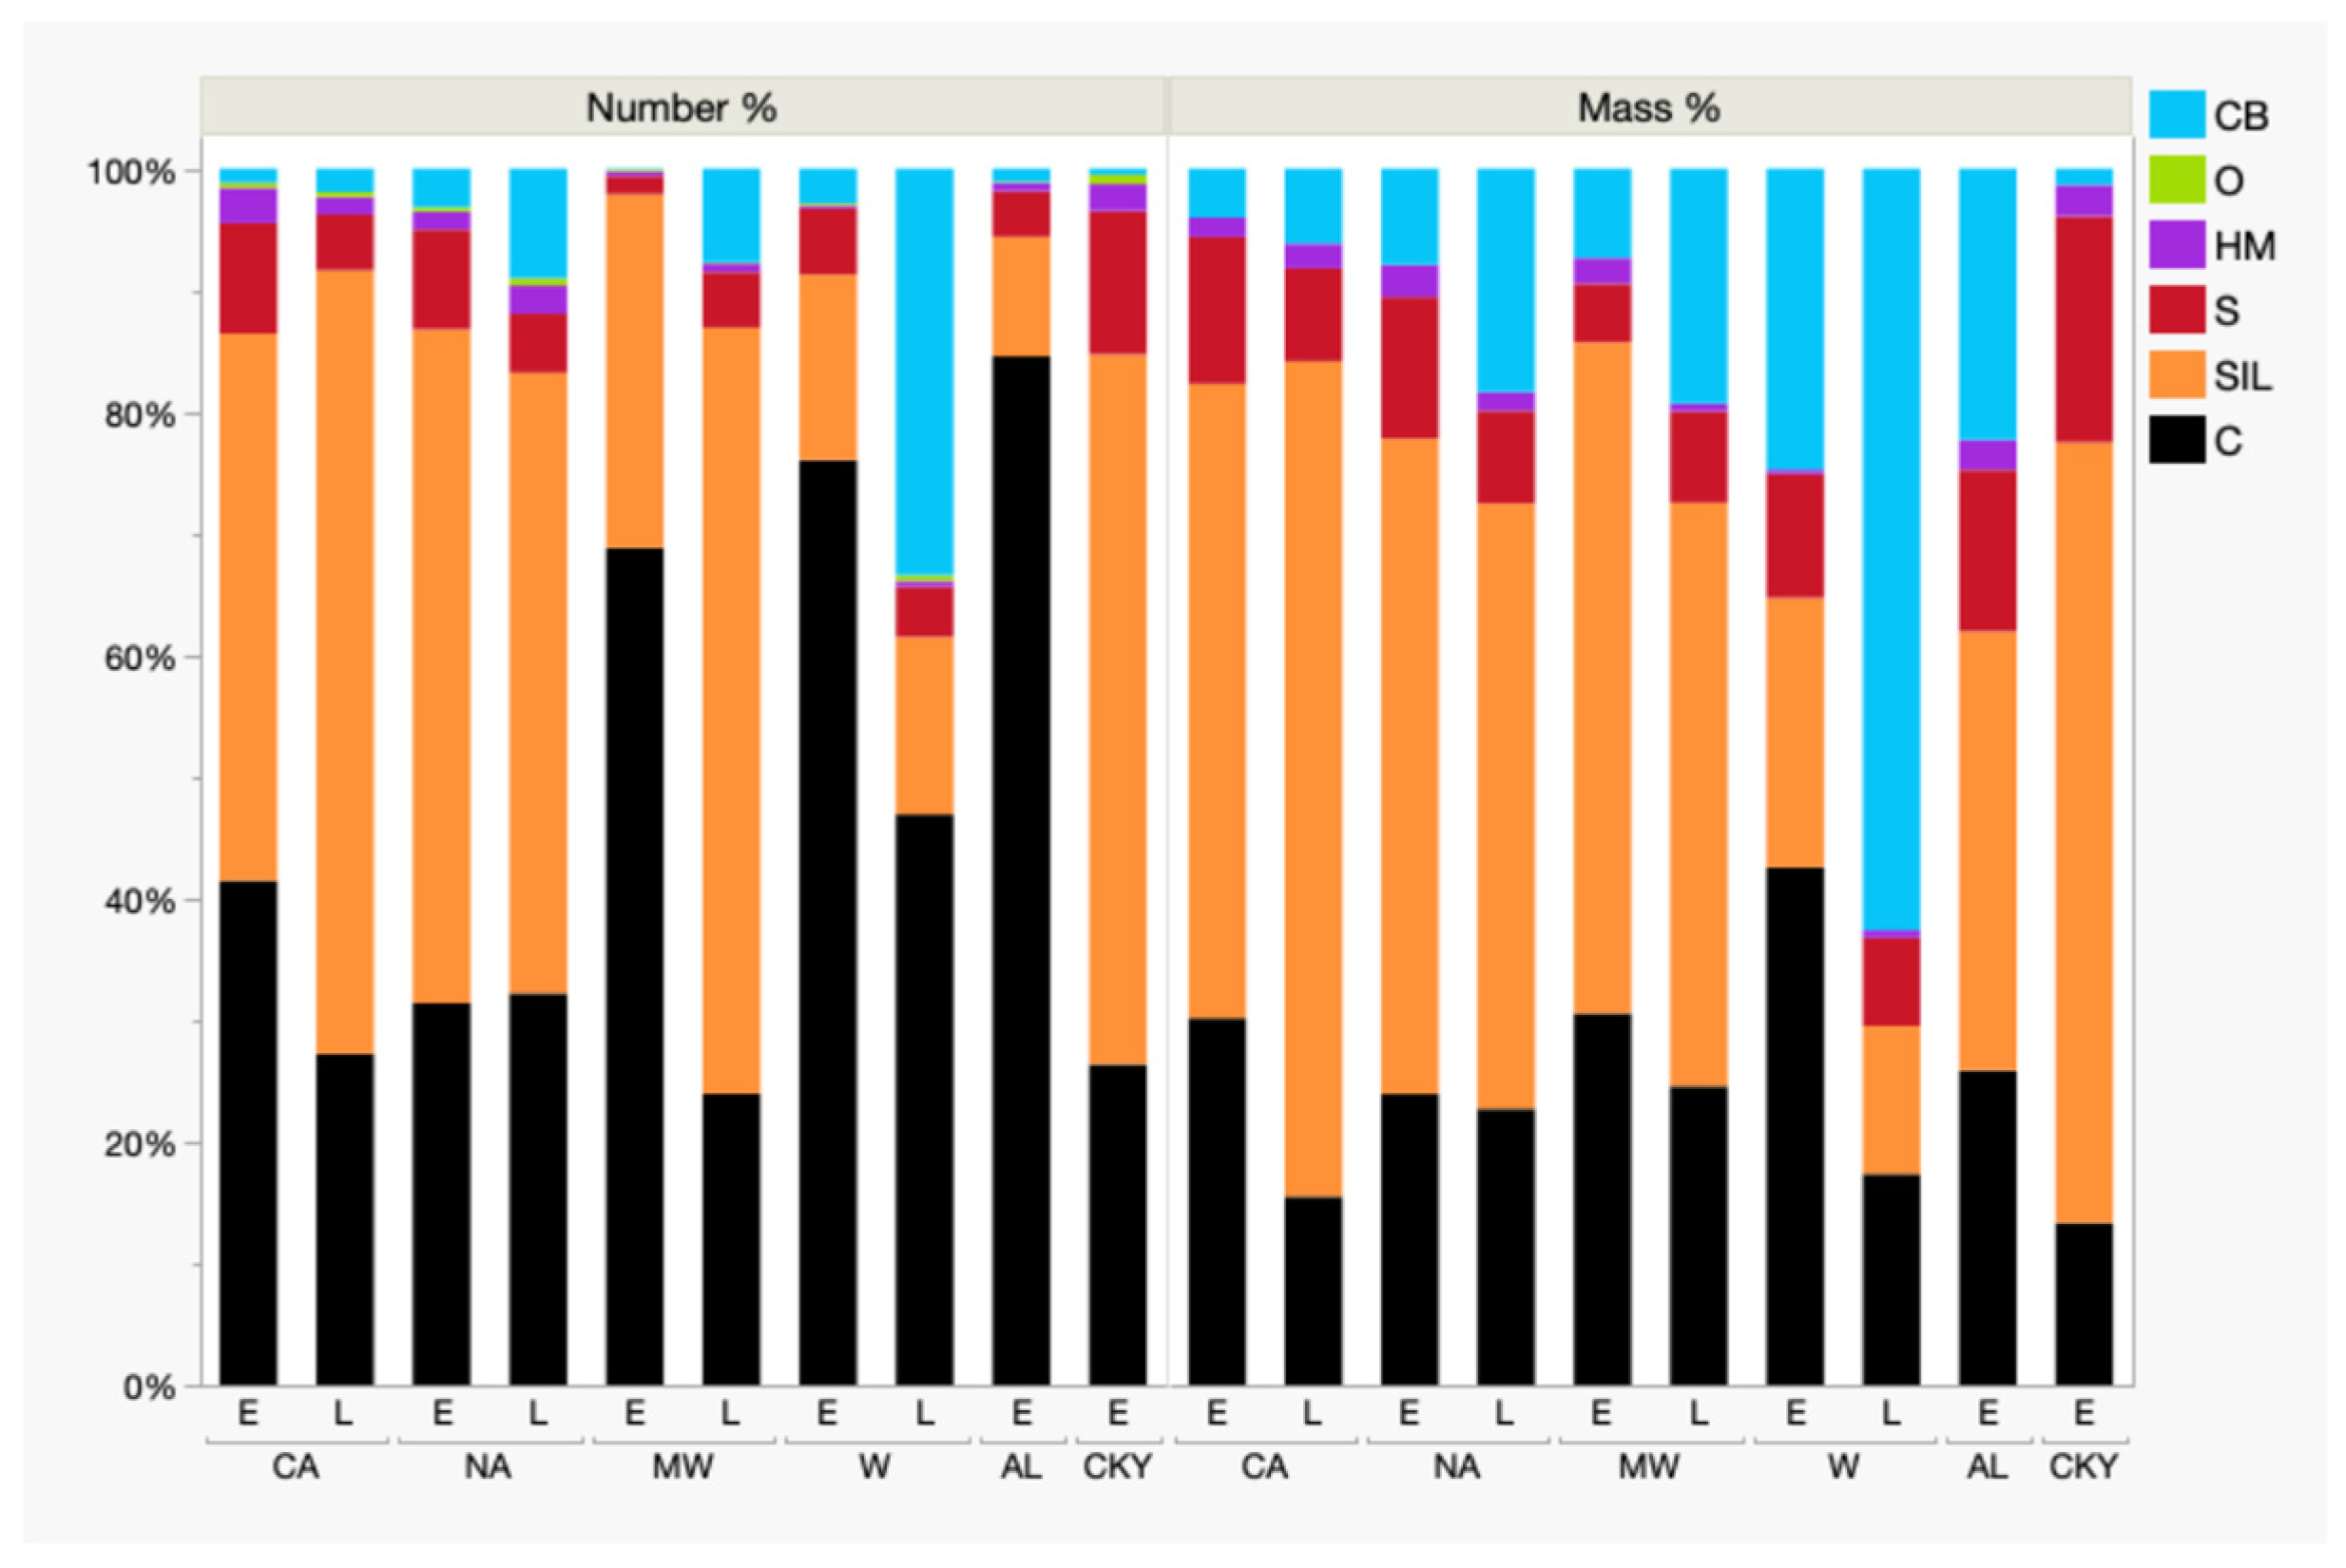
Figure 1 summarizes RCMD mineralogy distributions by geographic region and timeframe, including all mineralogy classes. In the number-based results (
Figure 1, left), RCMD across most regions is dominated by C and SIL particles, with S, CB, HM, and O comprising smaller fractions. However, the relative proportions of these dominant classes vary substantially by region, reflecting differences in geology, mining practices, and dust-control strategies [
2,
12,
13,
20,
22,
24].
In the CA and NA regions, where paired earlier and later samples are available, RCMD exhibits consistently high SIL fractions by number, indicating a strong influence of rock strata-derived dust across both timeframes. In CA, later samples show a clear increase in SIL and a decrease in both C and S, indicating a growing relative contribution of non-quartz silicate material within the rock-strata derived fraction. In NA, C remains relatively stable, while the rock-strata derived fraction shifts from S toward SIL, again indicating a compositional change within rock strata-derived dust rather than a major change in coal-to-rock ratios. Samples from CKY, available only for the earlier timeframe, exhibit mineralogy distributions similar to those observed in CA and NA, with relatively high SIL fractions and lower C, and notably the highest mean S fraction among the regions represented in the earlier dataset.
In contrast, samples from the W region—and from the MW region in the earlier timeframe—exhibit substantially higher C fractions by number and correspondingly lower SIL fractions. These high C fractions appear to be related, at least in part, to diesel particulates, some of which could be visually identified in SEM images (e.g., see
Supplementary Materials). Samples from AL (available only for the earlier timeframe) show mineralogy distributions more similar to those observed in W and earlier MW samples.
The mass-based results (
Figure 1, right) show systematic shifts relative to the number-based distributions. Across all regions, the fraction of C decreases on a mass basis, whereas the fraction of CB increases, reflecting class-specific differences in particle size and density (C being finer and less dense, and CB being coarser and more dense. This number-to-mass reduction in C is most pronounced in the W and AL regions and in the earlier MW samples, which corroborates the apparent influence of very fine diesel particulates in the particle counts. In W and AL, the reduction the C fraction moving from number to mass data is largely offset by an increase in CB, whereas in earlier MW samples it is not; the trend in the MW data is consistent with a greater contribution of particles from carbonate-bearing rock strata rather than applied rock dust products in that region [
13].
Notably, across all four regions with paired datasets (CA, NA, MW, and W),
Figure 1 shows a consistent increase in the CB fraction from the earlier to the later samples, regardless of whether results are presented on a number- or mass-based basis. This pattern is consistent with increased rock dusting intensity following the Sago (2006) and Upper Big Branch (2010) mine disasters and the subsequent strengthening of explosion-control requirements [
2,
3,
16].
Results of the statistical comparisons for mineralogy distributions are presented in
Table 2 and support the general trends observed in
Figure 1 and
Figure 2, including decreases in C and S fractions and increases in SIL and CB fractions in later samples. However, these differences were not consistent across regions, indicating that regional variability may contribute to the observed temporal patterns.
As noted above, CB particles are most commonly associated with rock-dusting products applied to mitigate explosion hazards [
2,
12,
13,
16]. The inclusion of CB can therefore obscure trends related more directly to dust derived from mine geology (i.e., coal seams and adjacent rock strata). To better isolate compositional differences associated with mining and drilling activities,
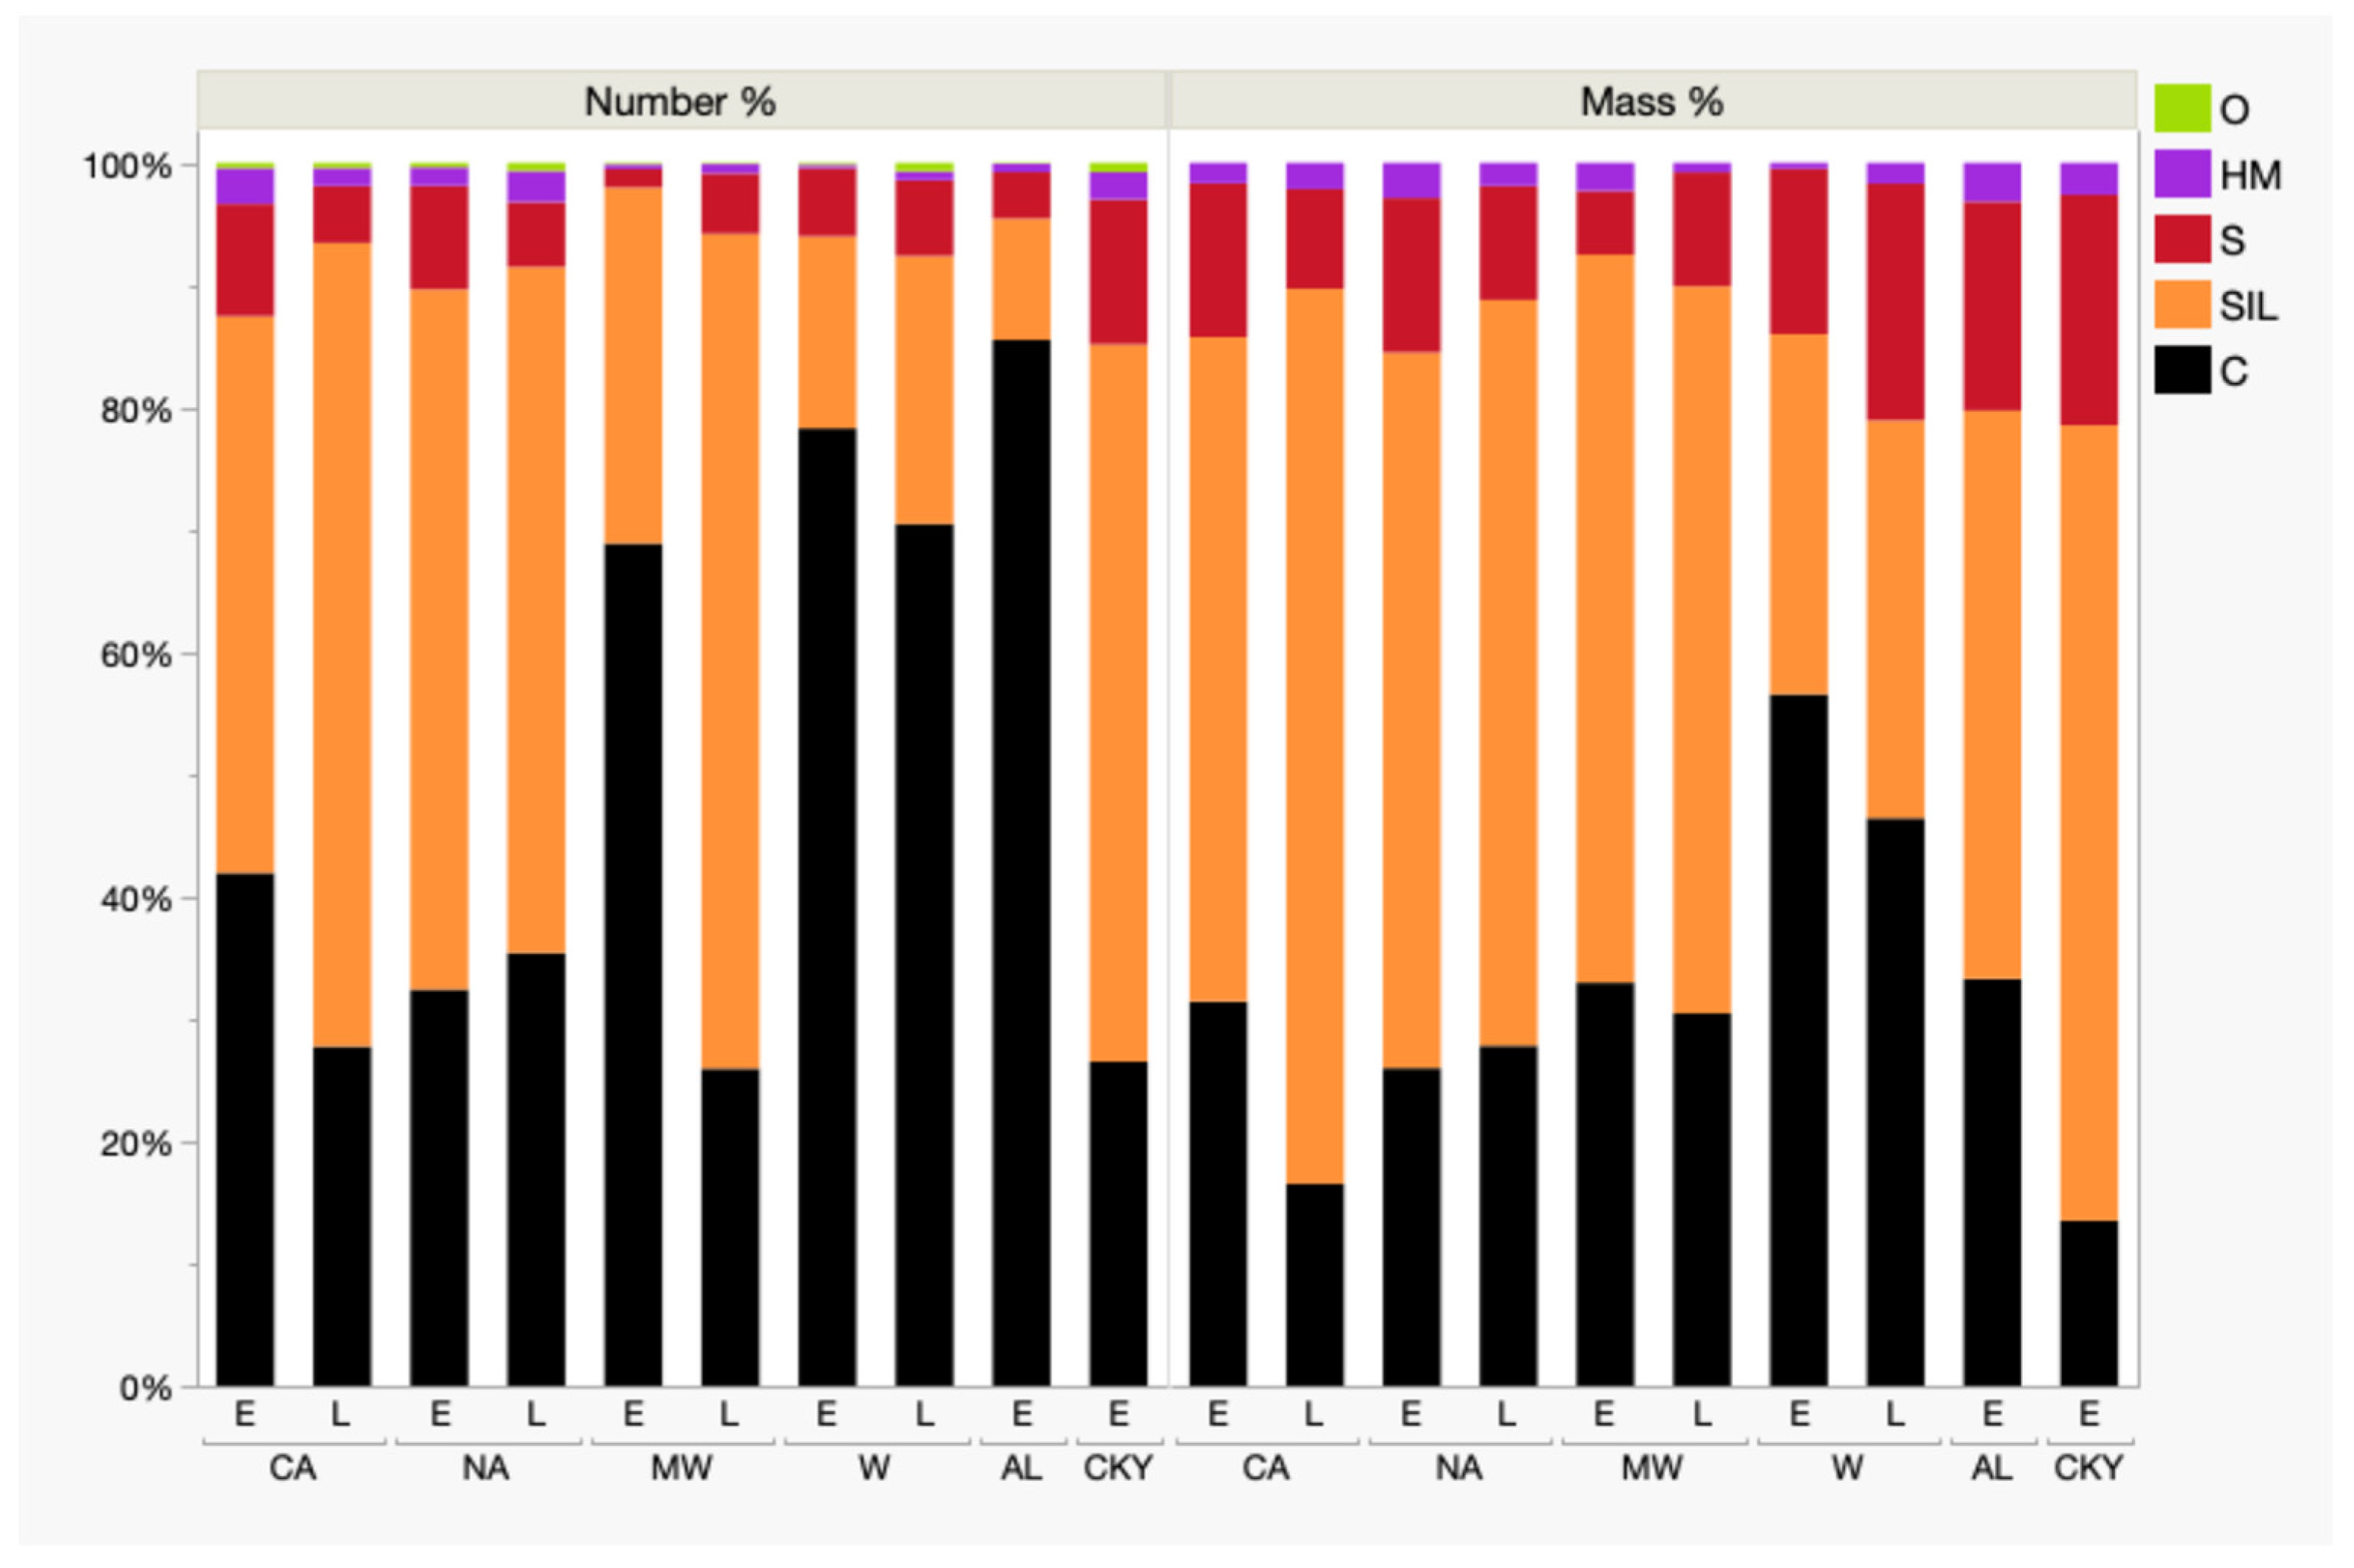
Figure 2 presents mineralogy distributions with CB excluded and the remaining classes renormalized to 100%.
Overall,
Figure 2 confirms the major trends observed in
Figure 1, particularly the increase in rock-strata derived material and the redistribution between S and SIL over time. In the number-based results excluding CB (
Figure 2, left), the shift from S to SIL in both CA and NA becomes more apparent. In CA, the decrease in C relative to total mineral particles (SIL + S + HM) is now clearly evident, indicating a growing influence of rock-strata derived dust in later samples. In NA, C remains relatively stable while the rock-strata derived fraction shifts from S toward SIL, consistent with changes in the composition of dust being generated the rock strata rather than changes in overall coal-to-rock ratios.
In addition to excluding CB, the mass-based results in
Figure 2 (right) minimize the influence of very fine C particles. Comparing trends between the number- and mass-based results again highlights the contribution of diesel particulates to samples from the W and AL regions, and the earlier samples from the MW region. In the W region, the mass-based results indicate a slight increase in the rock-strata derived dust relative to coal-derived dust.
3.2. RCMD Particle Size
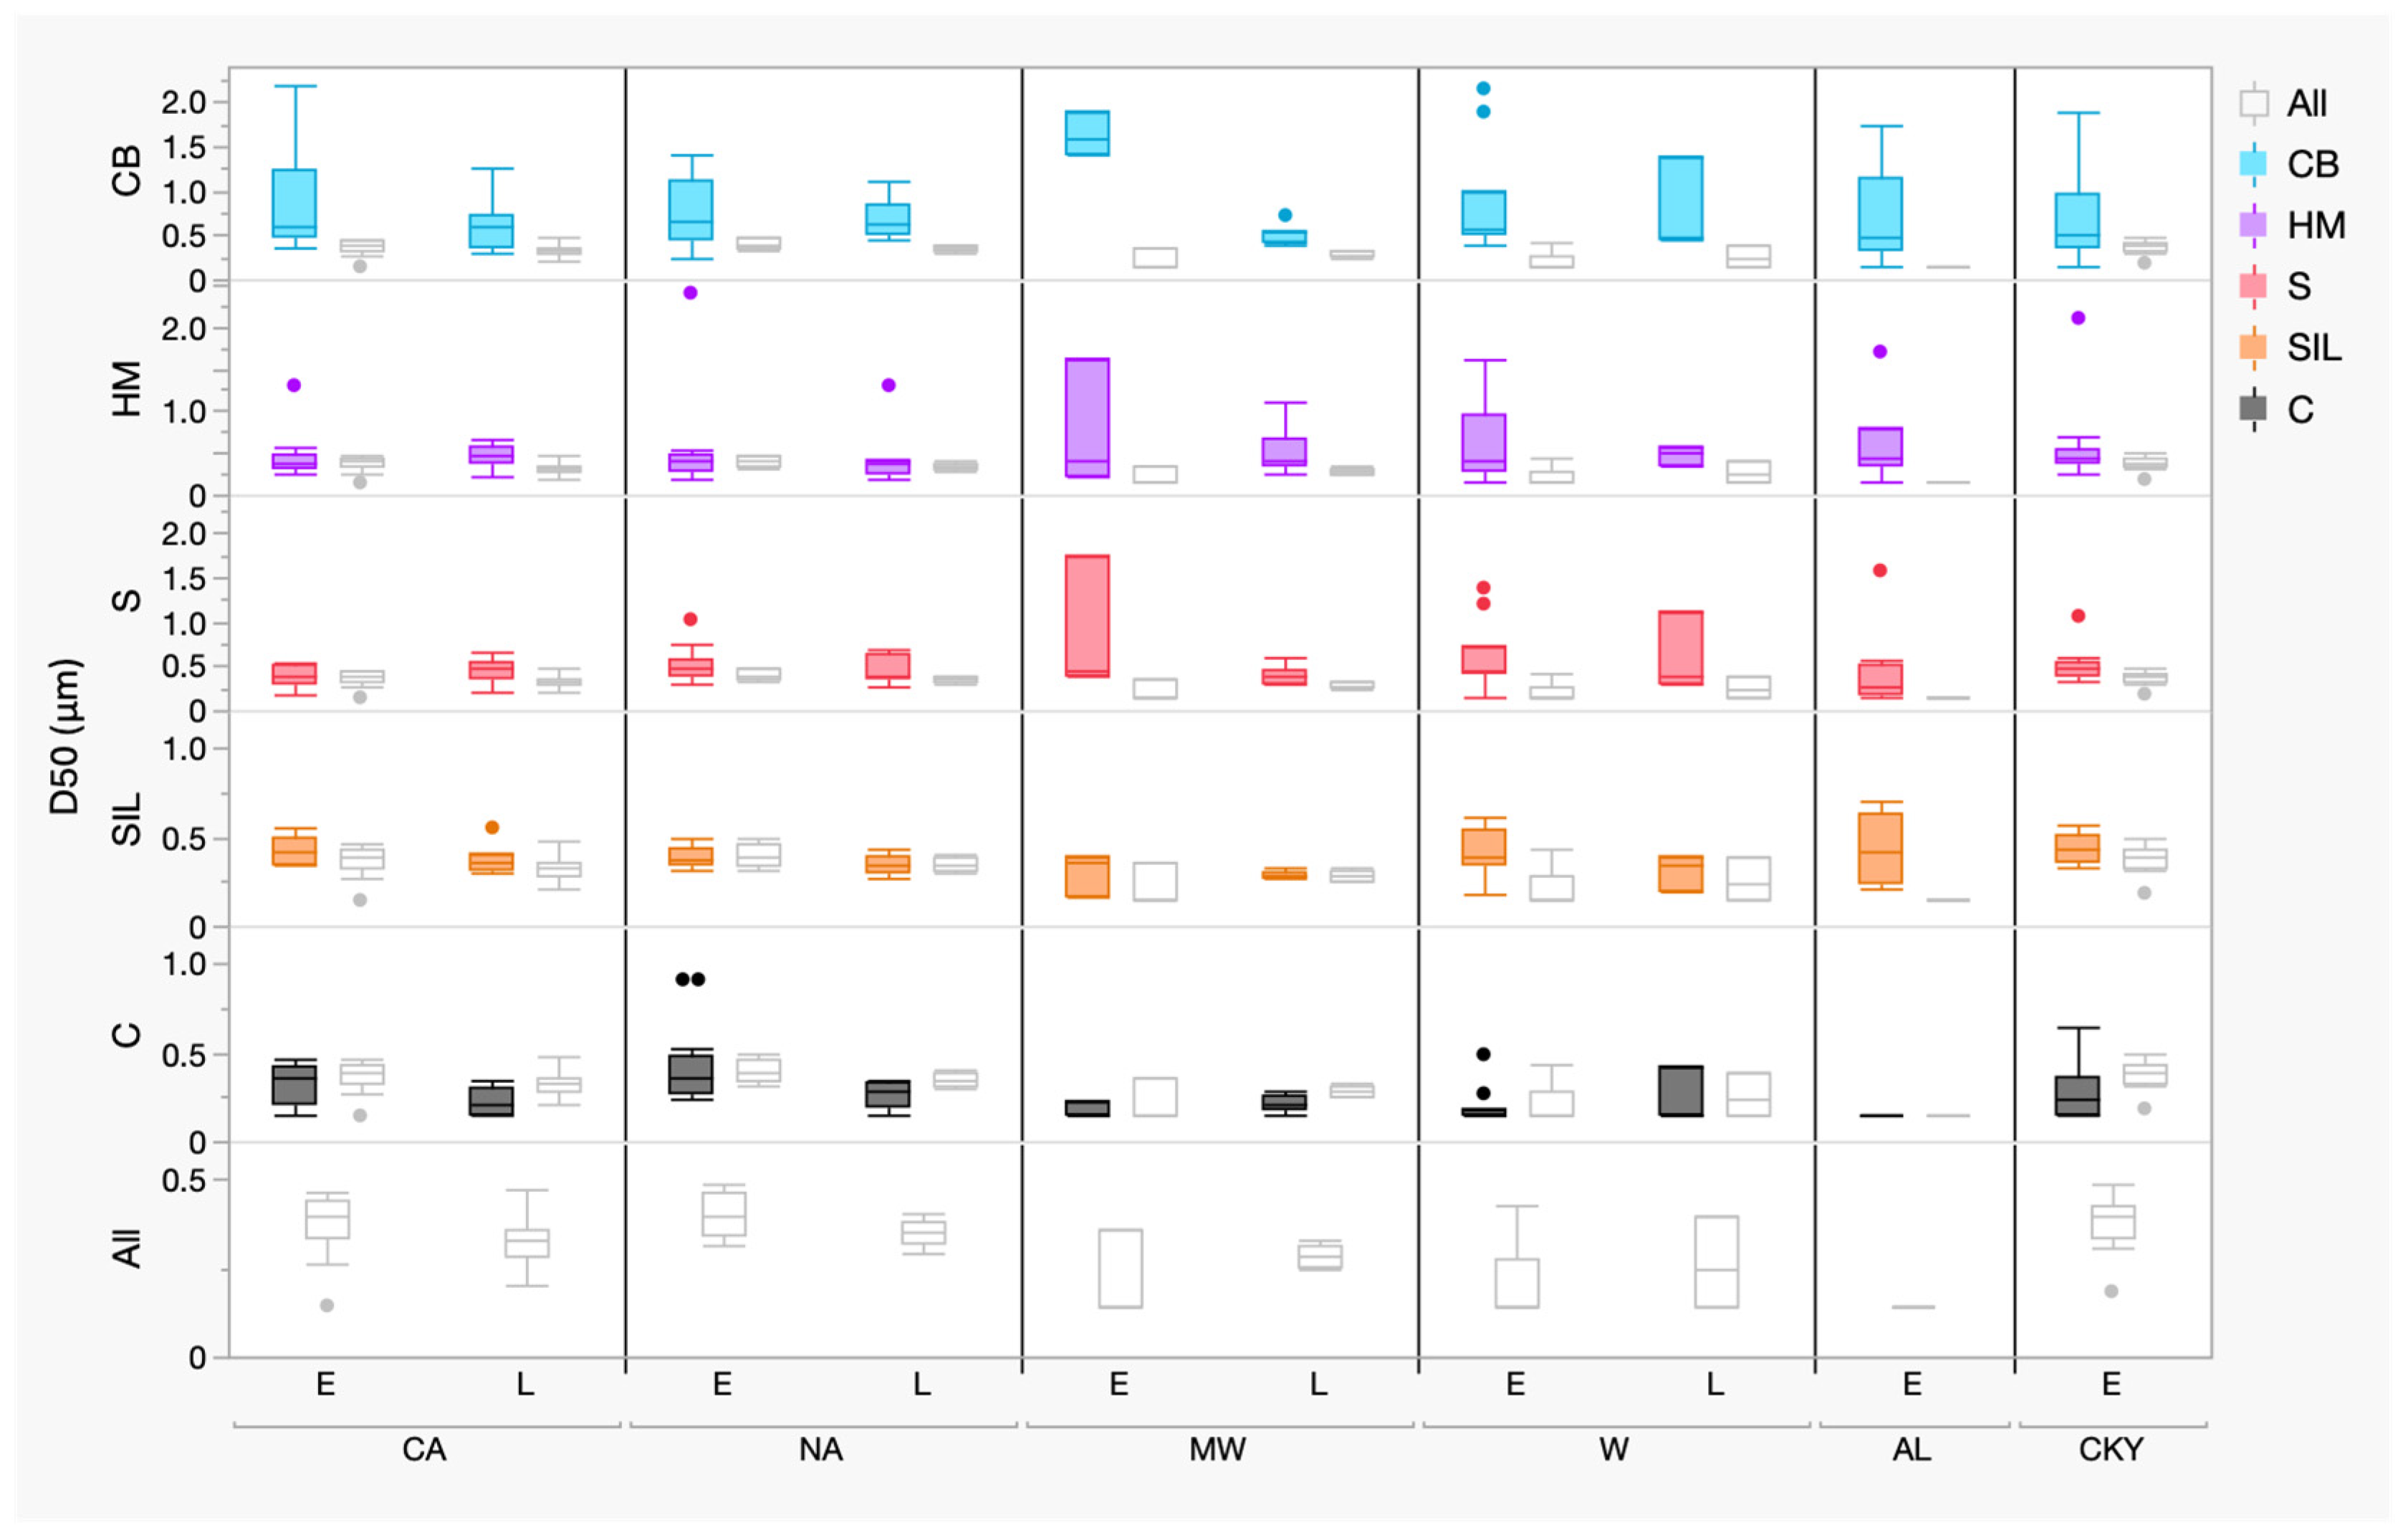
Figure 3 summarizes the distributions of median particle diameters (D50 values) by geographic region and timeframe (Earlier period denoted as E and later period denoted as L). Results are shown separately for individual mineralogy classes (colored box-and-whisker plots), and for each class the corresponding distribution for all particles combined (gray box-and-whisker plots) is shown to provide context for how that class contributes to the overall particle size distribution.
Across all regions and timeframes, systematic differences in particle size are evident among mineralogy classes. C particles consistently exhibit the smallest median diameters, a pattern that likely reflects the influence of very fine particles, including diesel particulates, within this class [
17,
23]. In contrast, CB and HM particles tend to be substantially coarser, while SIL and S particles generally fall between these extremes. These class-specific size differences are consistent with prior observations for a larger set of RCMD samples collected in the later timeframe reported by Sarver et al. (2021) [
22] and help explain some of the contrasting behavior observed between number-based and mass-based mineralogy distributions discussed in
Section 3.1.
When all particles are considered together (gray plots in
Figure 3), the D50 values are strongly influenced by the most numerous fine particles, particularly those in the C class. As a result, the “all particles” size distributions tend to closely track the behavior of carbonaceous particles in most regions. In contrast, the colored box-and-whisker plots highlight how less numerous but coarser particle classes—such as CB and HM—can exert a disproportionate influence on mass-based metrics despite contributing relatively few particles by number [
2].
In the CA region, later samples show a clear decrease in the overall (“All”) D50, driven primarily by decreases in both C and SIL median sizes, while S, HM, and CB exhibit relatively stable or slightly higher D50 values. This pattern indicates that RCMD in later CA samples contains a larger fraction of very fine particles overall, even as some coarser mineral particles remain present. Notably,
Section 3.1 showed that both number- and mass-based mineralogy results in CA indicate a greater influence of rock-strata derived particles (particularly SIL) in later samples. The apparent contradiction between finer SIL medians and higher SIL mass fractions can be explained by the strongly nonlinear relationship between particle size and mass: because mass scales approximately with the cube of particle diameter, a relatively small population of coarse SIL particles can dominate the SIL mass even when the median SIL size shifts downward due to an increased abundance of fine particles.
Figure 3 further shows that the reduction in D50 for C was greater than for SIL, indicating that the increase in very fine particles in CA was more strongly driven by carbonaceous material than by silicates. Taken together, these results are consistent with a broader and more heterogeneous SIL size distribution in later CA samples, rather than a simple shift toward uniformly coarser or finer silicate dust [
2,
25].
In the NA region, median particle sizes for most mineralogy classes change little between earlier and later samples, including for C, SIL, and S, and the overall (“All”) D50 remains relatively stable. Consistent with this,
Figure 1 and
Figure 2 show that both number- and mass-based mineralogy in NA exhibits only modest temporal changes, with a slight increase in C and a corresponding decrease in the relative contribution of rock-strata derived particles. Together, these results indicate that temporal changes in RCMD in this region are driven more by shifts in source contributions than by changes in particle size distributions.
In the MW region, particle size data show that earlier samples had much smaller C median diameters than later samples (
Figure 3), consistent with the strong contrast between number- and mass-based C fractions observed in
Figure 2. Later MW samples, by contrast, show slightly larger C median diameters and more similar C fractions on a number- and mass-basis, indicating a greater contribution from coarser carbonaceous material more consistent with coal dust. These differences between the earlier and later samples are consistent with reduced influence of very fine carbonaceous particles and may reflect changes in diesel equipment and emission controls over the period of study [
2,
3].
In the W region, few differences in particle size distributions for individual mineralogy classes can be observed between earlier and later samples in
Figure 3. While substantial differences are evident in
Figure 2 between number-based and mass-based metrics within each timeframe—reflecting the influence of fine C particles and coarse CB particles—the median sizes of individual classes do not exhibit strong temporal trends, indicating relative stability in dust-generation mechanisms and controls over the period of study.
Results of the statistical comparisons for particle size (D50) are presented in
Table 3. These results are consistent with the trends observed in
Figure 3, indicating differences between earlier and later samples for the C, SIL and CB classes. As discussed above, the magnitude and direction of these differences vary across regions.
Interestingly, in prior work focused exclusively on RCMD samples from the later timeframe, S particles were generally found to be finer than SIL particles. In the present study, SIL particles often exhibit smaller D50 values than S across both timeframes. This difference likely reflects a combination of factors, including differences in regional representation, the inclusion of mixed-carbonaceous particles within the SIL class in the present analysis, and differences in sample preparation (direct-on-filter analysis in the prior work versus recovery and redeposition here), all of which can influence particle dispersion and apparent size distributions [
21].
It is also noted that the recovery and redeposition process may influence particle dispersion and agglomeration to some degree, particularly for archived samples of differing age, although no systematic artifacts were observed in the present analysis.
3.3. Synthesis of Temporal Trends and Implications for Mining Practices
Taken together, the results presented in
Section 3.1 and
Section 3.2 indicate that changes in RCMD characteristics over the study period were generally subtle and region dependent. Most mineralogy classes did not exhibit a uniform temporal trend across all regions examined—on the basis of either RCMD composition or median particle size. Because these comparisons are based on samples collected from broadly comparable dust-generating environments rather than identical sampling locations, the results are best interpreted as reflecting general changes in dust characteristics rather than site-specific trends. Moreover, the study period corresponds to a time during which multiple aspects of underground coal mining evolved, including dust control practices (e.g., water sprays and ventilation), cutting methods, and equipment; however, specific operational changes likely varied at the individual mine level.
The primary exception to regional nuance was the observed consistent increase in CB particles in later samples across all regions with paired datasets. This pattern represents the most coherent temporal signal observed in the study and fits with expanded rock-dusting requirements implemented following the 2006 Sago and 2010 Upper Big Branch mine disasters [
2,
12,
16]. The increase in CB particles observed across regions suggests that enhanced rock-dusting practices have influenced the respirable dust fraction in U.S. underground coal mines. While rock dust products are applied primarily to mine surfaces to mitigate explosion hazards, these results show that carbonate materials can contribute appreciably to RCMD composition—and, in some cases, to its mass concentration. The variability in CB abundance among regions and mines likely reflects differences in rock-dust application methods and intensity, mine layout and ventilation, and local geology, as well as the specific sampling locations represented in this dataset. Nevertheless, the consistent temporal increase across regions points to the broad impact of regulatory and operational changes during the period between the two sample sets. At the same time, it is important to note that carbonate particles are generally considered less hazardous to respiratory health than silica-bearing particles, acting primarily as irritants rather than fibrotic agents [
26,
27].
Interpretation of coal-derived contributions is complicated by the fact that the C class includes both coal dust and diesel particulates, particularly at very fine sizes [
17,
23]. For this reason, mass-based metrics—which are less influenced by very fine diesel particulates—provide a more reliable indicator of coal versus rock contributions. In CA, the mass-based results show a decrease in the C fraction together with a corresponding increase in SIL, indicating that RCMD became more influenced by rock-strata derived material over the period of study. Notably, however, the S fraction declined slightly over time, suggesting a shift within the rock-derived component toward a greater proportion of non-quartz silicate material. This pattern may reflect operational adjustments aimed at limiting silica generation in response to increased awareness of silica exposure risks [
2,
20,
28], although regional differences in geology and mining conditions could also be a factor.
In contrast to CA, both number- and mass-based results in NA indicate a modest increase in the C fraction over time accompanied by relatively stable particle size distributions. This pattern suggests a reduced relative contribution from rock-strata derived dust in later samples, potentially reflecting different operational responses to silica exposure concerns or differences in mining conditions relative to central Appalachia [
20,
29]. The consistency between number-based and mass-based metrics in NA further supports the interpretation that this shift reflects real changes in dust sources rather than size-driven artifacts.
Evidence for changes in diesel-related contributions to RCMD is limited, but the MW region results are consistent with a reduced influence of very fine carbonaceous particles in later samples—which broadly aligns with regulatory and technological efforts over the past two decades to reduce diesel emissions through improved engine standards and cleaner equipment [
2,
3]. Interpretation in other regions remains uncertain because the C class reflects multiple sources, including both coal dust and diesel particulates. It is also important to note that ultrafine particles, including diesel-derived nanoparticles, may contribute disproportionately to respiratory health risks due to their high number concentrations and surface area despite their limited contribution to mass [
2,
18]; however, such particles fall below the lower size threshold of the present analysis and are therefore not captured in this study. In the western region, RCMD composition and particle size characteristics were remarkably similar between the earlier and later samples, suggesting little change in dominant dust sources or controls over the study period. Across all regions, particle size results do not support a consistent shift toward finer respirable dust over the period examined, but instead indicate class-specific and regionally variable changes in particle size distributions.
Finally, this study demonstrates the value of particle-level characterization for understanding RCMD beyond conventional mass-based metrics. By combining mineralogical classification with particle size analysis, this approach provides a more detailed understanding of dust sources and their evolution over time. The use of archived samples further highlights the potential for retrospective analyses to evaluate long-term changes in mining environments and could support future efforts to link evolving dust characteristics with occupational health outcomes. However, it must be emphasized that the present study is not designed to directly assess health outcomes. Given the long latency associated with most dust-related occupational lung diseases [
29], changes in RCMD composition or particle size during the period evaluated here are unlikely to be directly reflected in the current disease burden. Addressing such questions will require access to well-characterized archived RCMD samples from substantially earlier periods, along with comparable analytical methods.