Abstract
To address the severe geological hazards (e.g., high ground stress and rock burst) that threaten safety and efficiency in ultra-deep mining, this study develops a comprehensive microseismic monitoring system tailored for the Sishanling Iron Mine—a typical ultra-large-scale, ultra-deep mine with an extraction depth exceeding 1500 m. The system integrates high-sensitivity sensors, real-time data transmission, and intelligent processing algorithms. A scientifically designed sensor deployment plan achieves full-coverage of key mining areas, while a multi-level data processing framework encompassing signal acquisition, event detection, location inversion, and magnitude calculation enhances result accuracy. Applied in actual operations, the system effectively captures microseismic events with magnitudes from −2.14 to −1.96, achieving optimal planar and spatial positioning errors of 6.75 m and 9.66 m, respectively. It provides real-time early warning for hazards like rock burst, thereby mitigating risks and ensuring operational continuity. This work offers a practical reference for constructing microseismic systems in similar “double super” mines and enriches the theoretical and technical framework for safety monitoring in deep mining.
1. Introduction
With the continuous growth of global demand for mineral resources and the gradual depletion of shallow and easily exploitable resources, mining development is irreversibly moving towards deeper areas [1,2]. Deep mining has become an inevitable trend to ensure the sustainable supply of mineral resources and maintain the long-term development of the mining industry [3,4]. In this context, the development and utilization of “ultra-large-scale, ultra-deep-well” (hereinafter referred to as “double super”) mines are becoming a key direction to ensure national resource security and strategic reserves [5,6]. However, in the process of “double super” mining, the complex geological environment—characterized by high ground stress, severe unloading, high ground temperature, and groundwater coupling—significantly increases the risk of dynamic disasters such as rock burst, roof collapse, and surrounding rock instability [7,8,9]. These disasters not only seriously threaten the safety of mining personnel and equipment but also easily lead to production interruptions, becoming the core bottleneck restricting the safe and efficient mining of “double super” mines.
Microseismic monitoring technology, as a key means of real-time, continuous, and non-contact capture of rock fracture signals, has become a core component of deep mine safety production monitoring systems [10,11]. It achieves spatial positioning, energy assessment, and trend analysis of microseismic events by analyzing the elastic wave information released by rock mass rupture, providing scientific basis for rock mass stability evaluation and disaster warning [12,13]. However, the unique ultra-large mining range, ultra-deep-well operation depth, and extremely complex geomechanical environment of “double super” mines pose unprecedented challenges to traditional microseismic monitoring technology. The specific manifestations are as follows: (1) the monitoring range is extremely wide, which is prone to signal coverage blind spots; (2) when signals propagate in ultra-deep and non-uniform rock masses, they experience severe attenuation, leading to a decrease in the accuracy of event recognition and localization; and (3) strong mining disturbances and complex background noise pose higher requirements for effective signal extraction and signal-to-noise separation [14,15]. Most existing research focuses on the construction of microseismic systems for medium-shallow or small deep mines, and key technologies, such as sensor optimization layout, signal processing under strong interference, and high-precision parameter inversion for the characteristics of “double super” mines, have not yet formed mature and universal solutions [16].
As a benchmark “double super” mining project of Jianlong Group Benxi Longxin Mining Co., Ltd., the Sishanling Iron Mine has a resource reserve of 2.484 billion tons and is currently the largest single iron ore deposit registered in China, as well as the first ultra-large deep-well iron ore in Asia with a mining depth of over 1500 m. The mine adopts advanced technologies such as the large-diameter deep-hole empty field filling method and is committed to building a deep, green, and smart mine that is “domestically leading and internationally first-class”. Its “dual super” attribute not only represent the forefront of the industry but also pose severe risks of deep dynamic disasters [17,18,19]. Therefore, combining the specific geological conditions and mining layout of the Sishanling Iron Mine, the construction of a high-performance microseismic monitoring system that can adapt to its extreme operating environment has urgent practical needs and important scientific value for ensuring safe production at the mine and for providing a technical paradigm for similar “double super” mines [20,21,22].
Based on this, this study takes the Sishanling Iron Mine as the specific engineering background to carry out research on the construction of a microseismic system for “double super” mines. By integrating high-sensitivity sensors [23,24], real-time data transmission modules, and intelligent signal processing algorithms [25,26,27,28], combined with the actual situation of the mine, a scientific sensor deployment plan is designed [29] to establish a multi-level data processing framework [30,31,32] covering signal picking, event detection, positioning inversion [33,34], and earthquake magnitude calculation. Ultimately, through the practical application and effectiveness verification of the system on-site, the goal is to achieve comprehensive coverage of key mining areas and accurate analysis of monitoring data, providing real-time and reliable warning support for geological disasters such as deep rock bursts [35,36,37,38]. This study not only aims to ensure the safe and efficient promotion of deep mining at the Sishanling Iron Mine but also hopes to provide a direct practical reference for the construction of microseismic monitoring systems in similar “double super” mines [39], thereby further enriching the theoretical and technical system of deep mining safety monitoring [40,41].
2. Overview of the Research Area and Analysis of Geological Conditions
2.1. Characteristics of Ore Body Occurrence
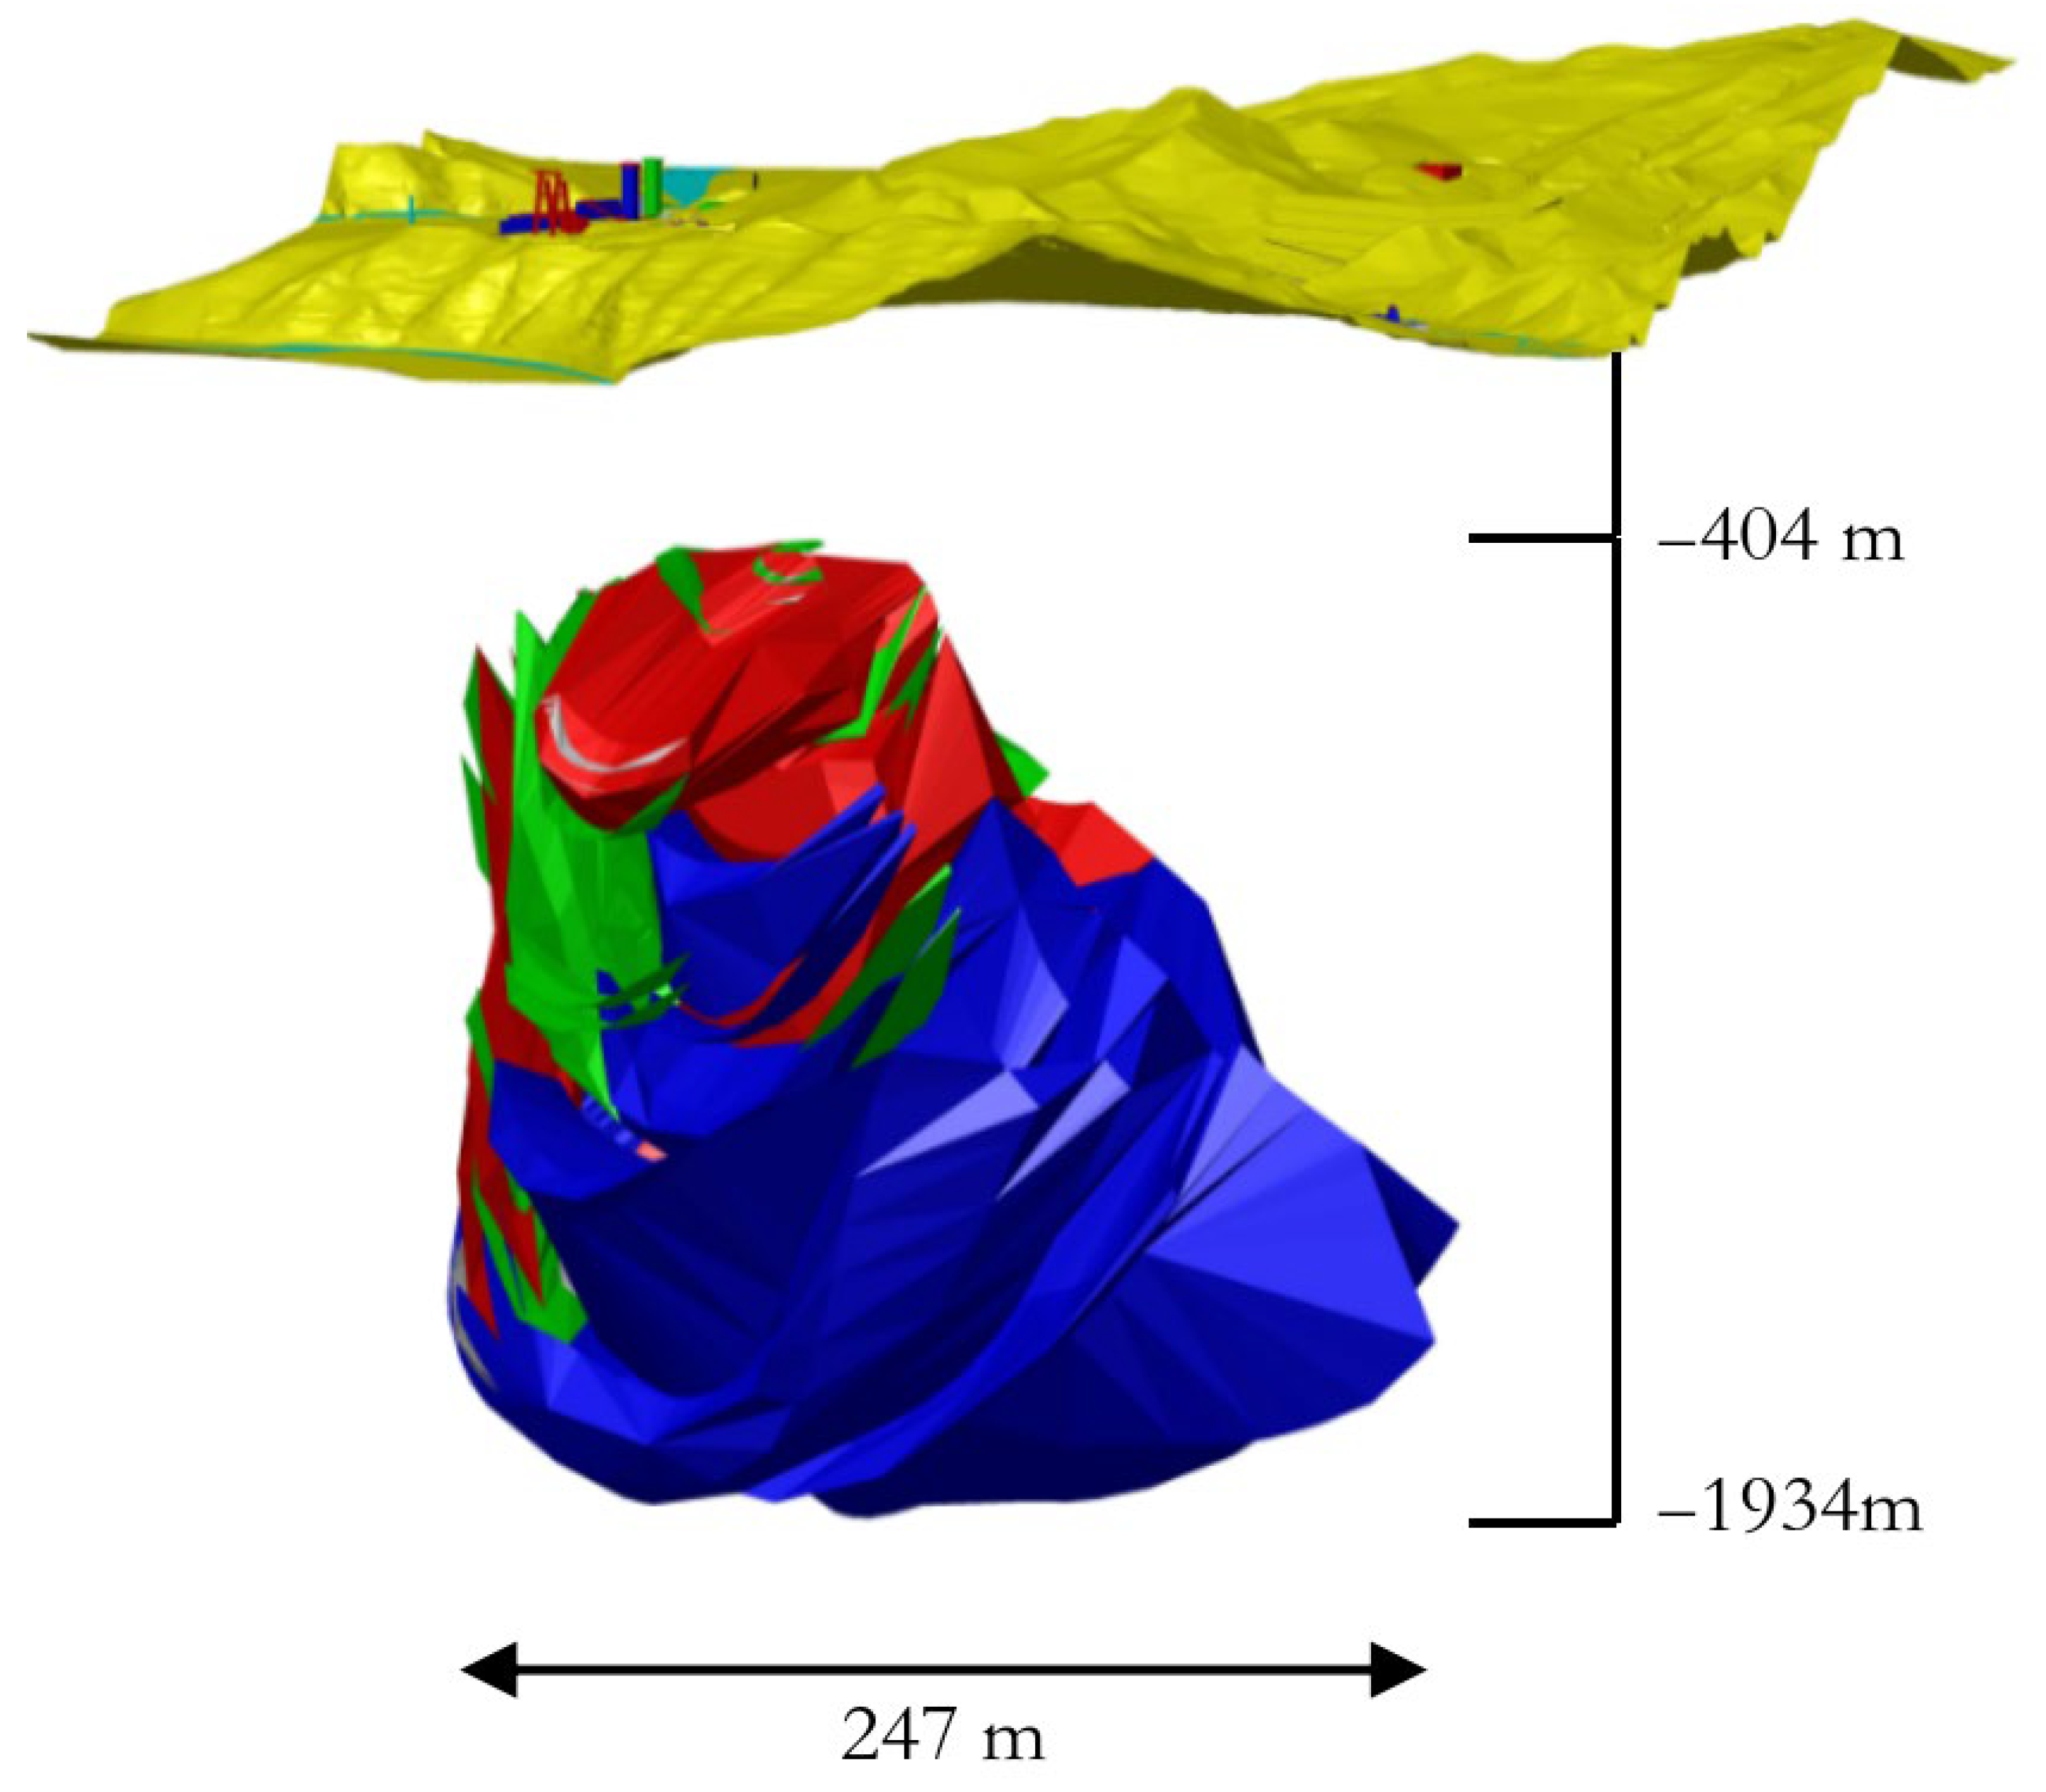
The Sishanling Iron Mine is a concealed blind deposit with a cover thickness of 404 m to 1445 m, a burial depth of 404 m to 1934 m, and an ore bearing elevation of −134 m to −1713 m. The natural ore types are mainly magnetite and hematite, while the industrial type belongs to lean iron ore that needs to be selected. The genesis type of the deposit belongs to the “Anshan-style” sedimentary metamorphic iron deposit. A total of five industrial ore bodies have been delineated in the mining area, numbered from top to bottom as ore bodies I to V. Among them, there are three hematite deposits and two magnetite deposits. No. IV magnetite deposit is the main ore body, accounting for 72.65% of the total resources. This ore body controls an iron ore belt with a length of 1500 m from east to west, an average width of 960 m from north to south, and a maximum vertical depth of 1580 m. The total thickness of the industrial ore body is 789.29 m, and the average thickness of the ore body is 246.84 m. The overall shape of the ore body is an asymmetric syncline, with two ends of the syncline axis raised, and the surrounding space resembling a huge “golden ingot” (see Figure 1). The overall direction of the inclined plane is 110°, with a dip of 200° and an inclination angle of about 70°. The north wing of the syncline has a relatively gentle inclination angle of 200°, with an inclination angle of 10° to 72°. The head of the ore body is buried deep, and the thickness of the ore body is large, mainly in the form of thick layers. The southern wing of the syncline has a relatively steep inclination angle, with a reversal phenomenon occurring at an elevation of −1200 m between lines 1–5. The overall inclination is 20°, with an inclination angle of 11–85°. The head of the ore body is shallowly buried, with a small thickness and many interbedded rocks. The branching and composite phenomenon is obvious, and it is produced in multiple layers. The continuity of the ore body is good, mainly composed of poor magnetite ore body and poor hematite ore body, with a very small amount of iron-rich ore body.
Figure 1.
Occurrence form of the Sishanling Mountain Iron Mine ore body.
The ore bodies occur in magnetite quartzite and hematite quartzite, and due to their deep burial, their roofs are relatively intact and stable. There are no large structural fracture zones in the area; only local fissures are present, manifested as some small structural zones. The exposed strata in the mining area are mainly egg blue mudstone and purple mudstone, as well as quartz sandstone and quartzite of the Kangjia Formation. The dip angle of the stratum is not large, the lithology is relatively simple, the stratum is stable, and overall the engineering geological conditions are good. The RQD values of most rocks are greater than 90%, and the rock cores are mainly columnar and elongated. The rock quality is excellent to extremely good, indicating excellent to extremely good rock quality and a relatively complete to intact rock mass. However, in locally affected sections with developed fractures, the rock core may appear in the form of blocks and fragments. The rock strength is hard rock and the rock is stable.
2.2. Characteristics of Ore Body Mining
The Sishanling Iron Mine employs a panelized large-diameter deep-hole open-pit backfilling method. In this method, the ore body is divided into panels, which serve as the fundamental production units. According to mining production capacity requirements and the production capacity that can be achieved by the ore blocks, three mining areas will be mined simultaneously in the middle section. In the initial production stage, four mining blocks will be mined simultaneously in each mining area. After completion of middle-layer ore extraction, the mining will be carried out in a backward manner towards the mining pillars in the mining area, allowing the number of distributable mining blocks to increase. Based on the distribution of ore body resources in the middle section, the mining sequence in the mining area will be designed to advance from the middle part of the mining area to the mining pillars on both sides of the mining area, and from the middle mining area to the two wings. A single ore block adopts a trench-type bottom mining structure.
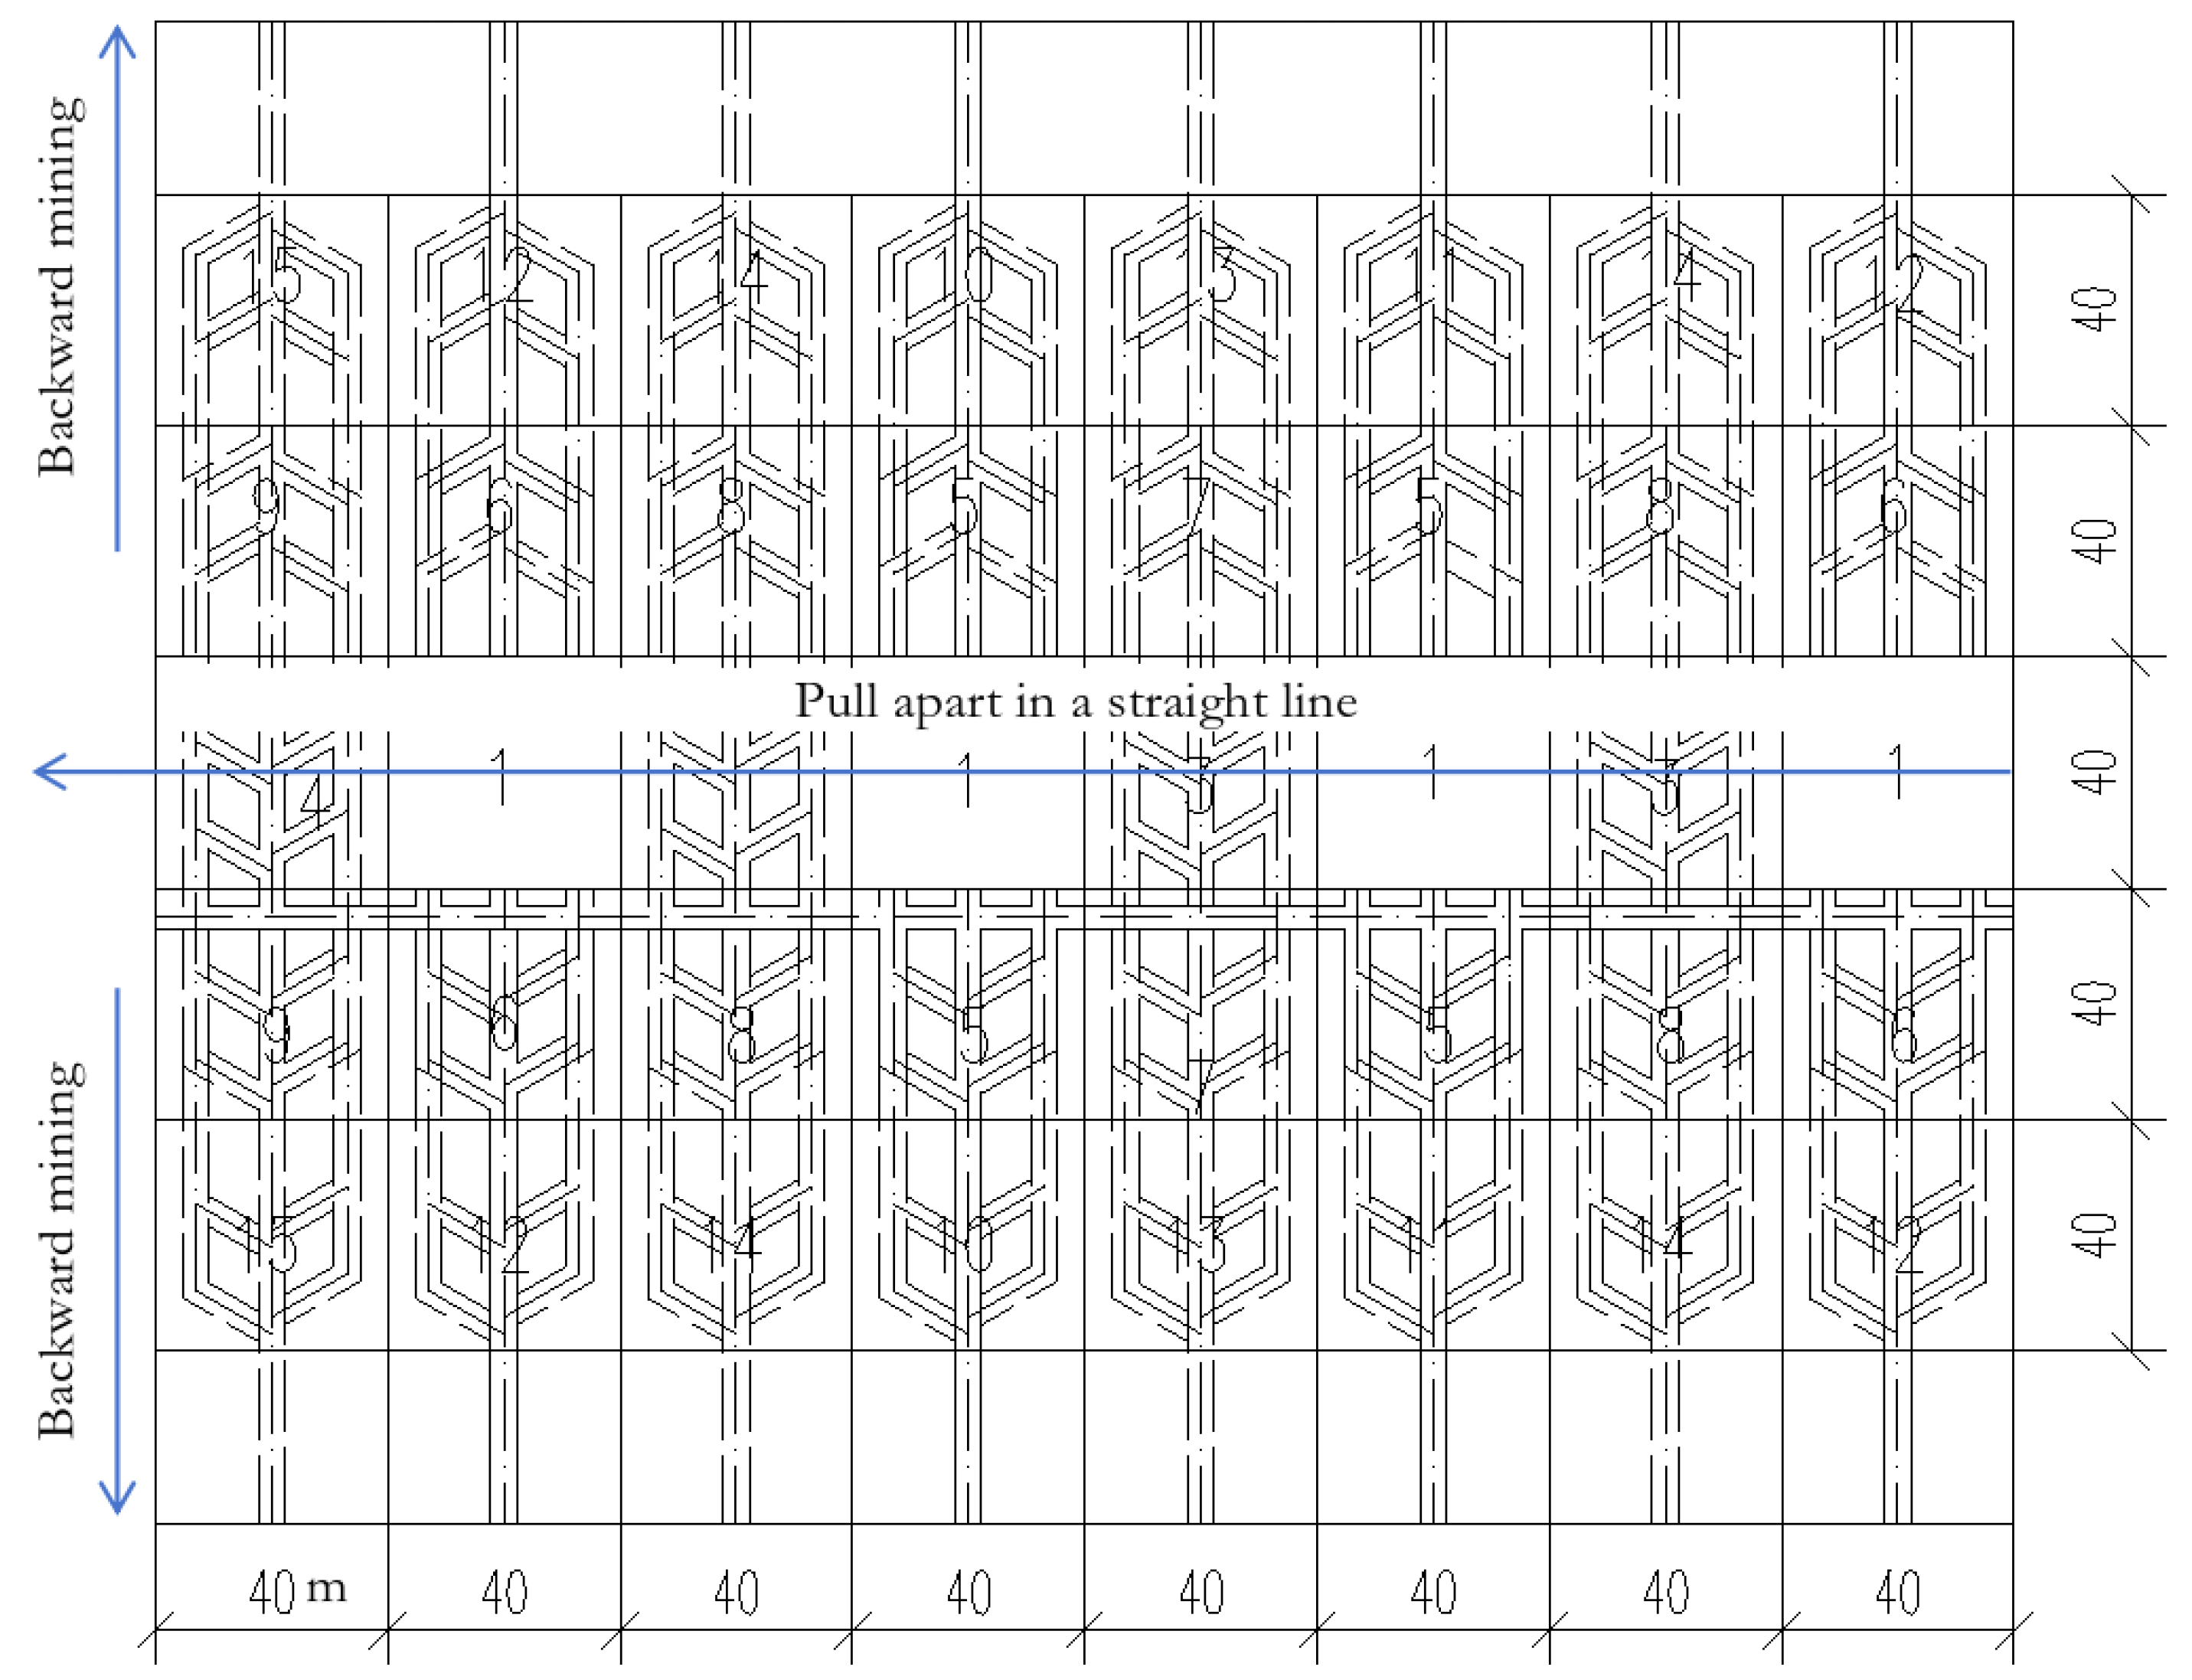
Panel dimensions are 200 m in width and extend along the full thickness of the ore body. Mining areas are arranged in the form of ore blocks, with a size of 40 m × 40 m and a height of 60 m, which is the height of the middle section. The ore block is divided into two-step mining areas according to the surrounding constraints, with the first-step mining area surrounded by ore bodies, while the second-step mining area surrounded by 2–3 filling bodies. In order to ensure that rock drilling, backfilling, and filling operations do not interfere with each other, and to avoid excavating ore or rock drilling tunnels from the filling body, the mining area adopts a spaced layout. During the backfilling process, the first step is performed, followed by filling of the first step and continued interval backfilling on both sides of the first step. When the strength of the filling material in the filled first step reaches the design strength, the adjacent second step is started for backfilling, and subsequent backfilling is carried out after completion of the second step. Following the excavation of rock drilling or ore extraction tunnels within a single stope, corresponding backward operations are adopted. The overall mining sequence within the mining area is to pull apart the middle part of the ore body in a “one” shape and then advance towards the pillars on both sides. A “cross” shape is gradually formed between the upper and lower sections to advance mining. The overall mining sequence within the panel proceeds from the center outward in a retreating manner: initially, 40 m × 40 m stopes are mined in the central area, followed by the retreating extraction of similarly sized stopes on both flanks. The mining sequence of each mining site within its area is shown in Figure 2. From a spatial perspective, mining gradually advances in the form of a “pyramid” or a cross shape, that is, the ore blocks in the middle section of the panel are mined first, and after a certain space is formed in the panel, mining of the upper middle section of the panel starts, while keeping the mining area in the lower middle section larger than that in the upper middle section.
Figure 2.
Mining block extraction sequence diagram.
2.3. Typical Ground Pressure Characteristics of Ore Bodies
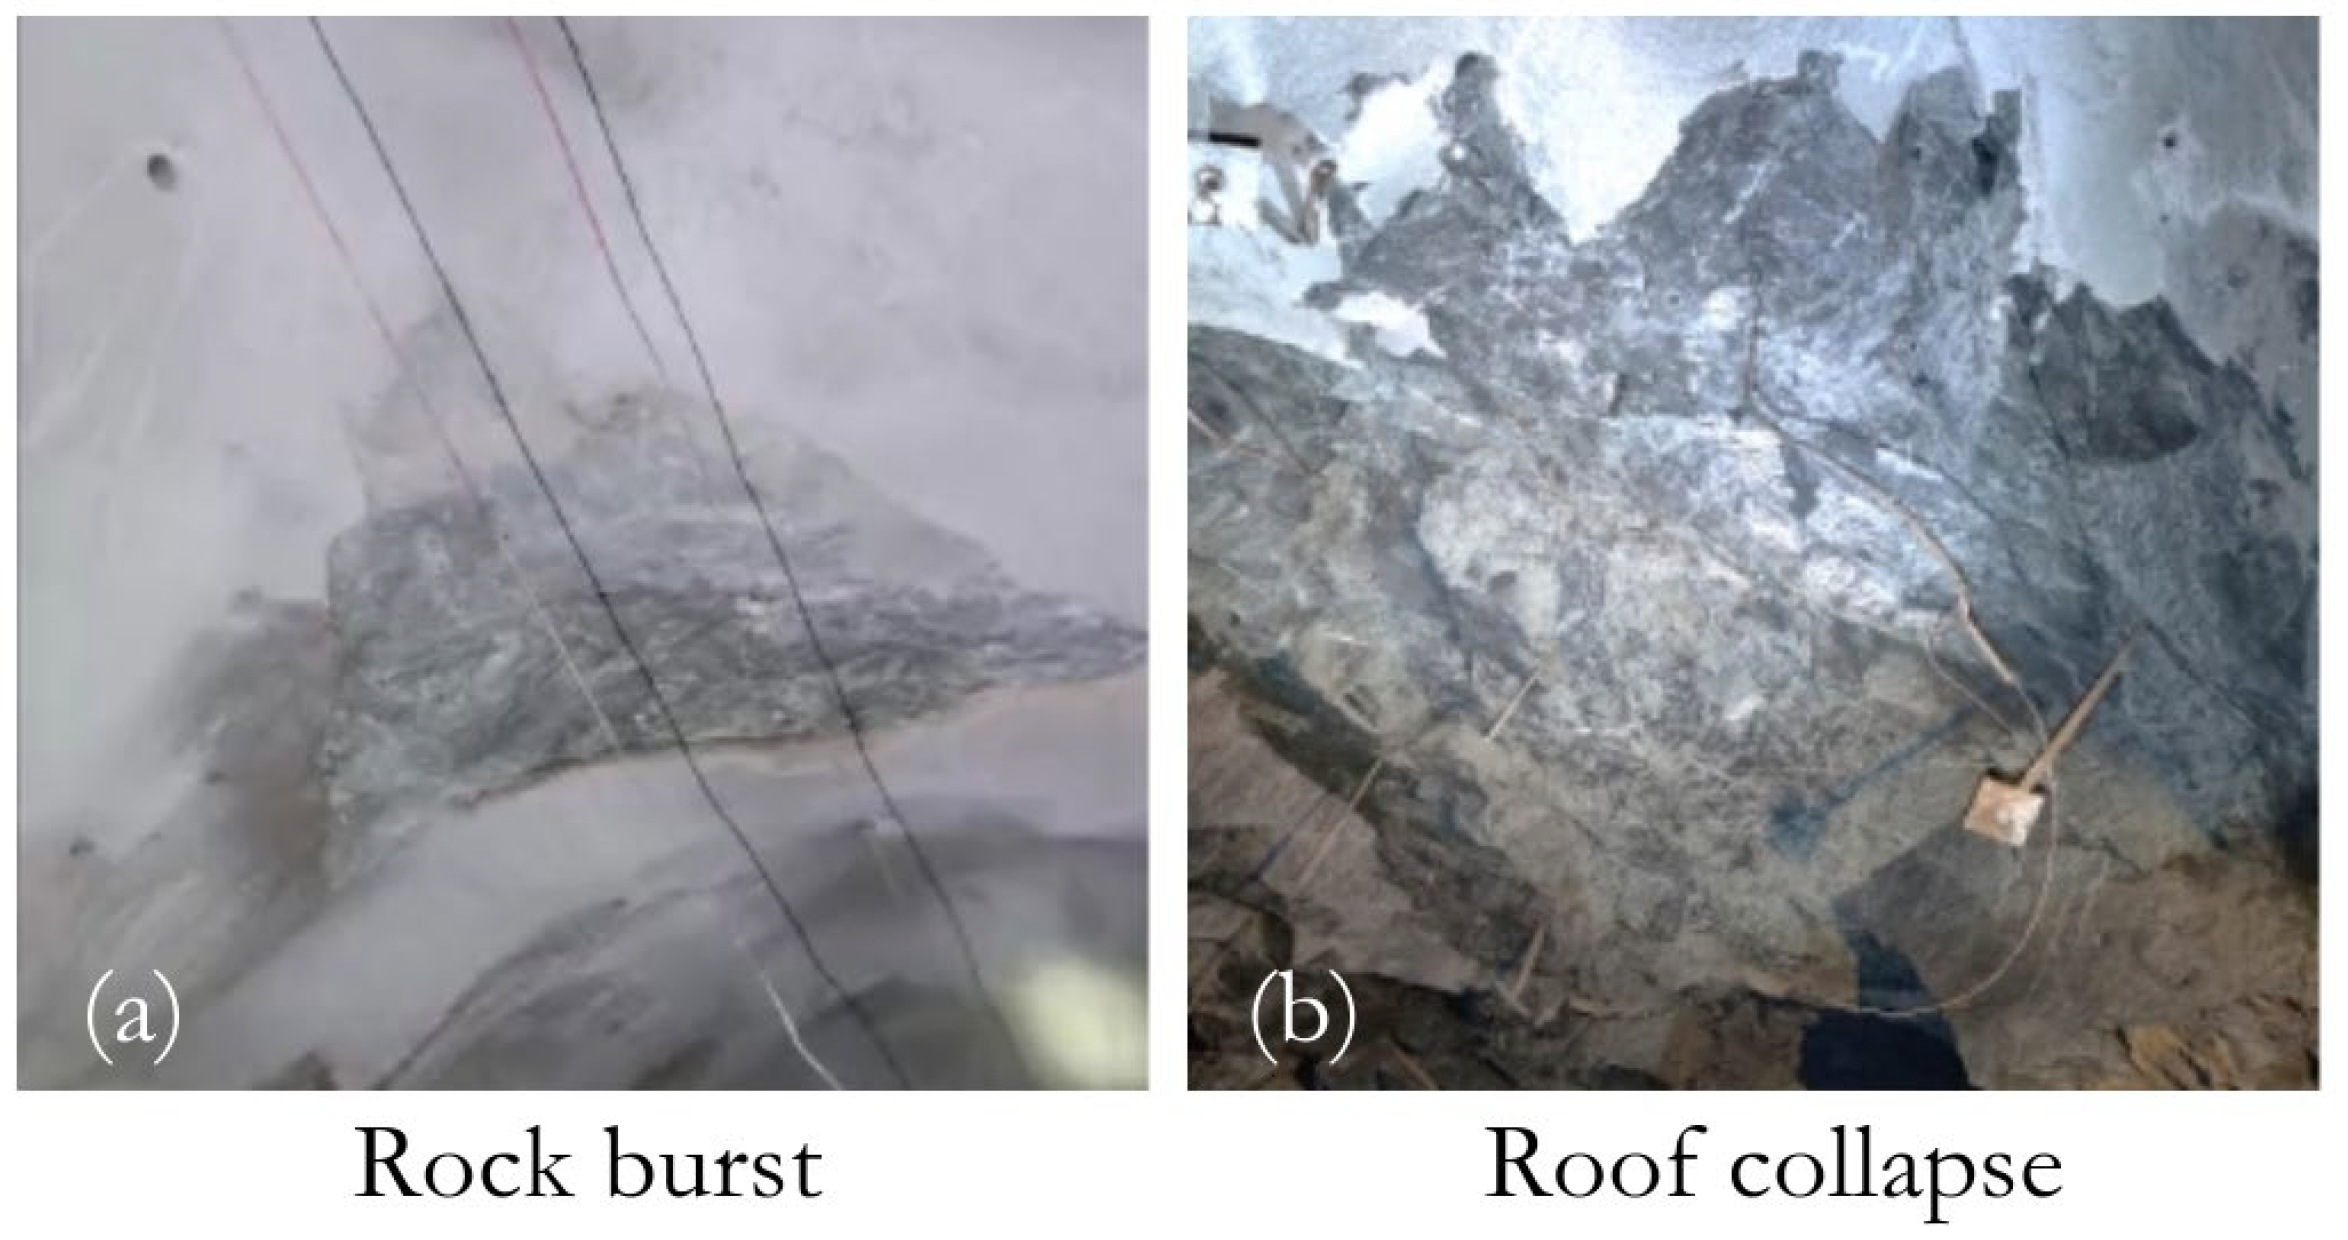
The early design of the Sishanling Iron Mine had an annual production capacity of 750 × 104 t/a, and later formed two mining areas for simultaneous mining, reaching 1500 × 104 t/a, with the characteristics of ultra-deep and ultra-large-scale mining. Due to its ultra-deep and large-scale nature, the Sishanling Iron Mine exhibits the following typical geomechanical characteristics: (1) Prominent high-stress conditions and complex stress distribution. As the mining depth increases, both vertical stress and structural stress increase significantly. The deep rock mass presents a three-dimensional, non-uniform spatial stress field dominated by horizontal stress, with a complex spatial distribution after multiple mining disturbances. (2) The mining area is large, and the distribution of wells and roadways at the mine is complex. In the future, the cumulative extension length of deep shafts and roadway projects at the Sishanling Iron Mine may reach tens of thousands of meters, arranged in a complex and staggered spatial pattern spanning vertical and horizontal kilometers. Mining locations are widely distributed, with dozens or even more mining sites operating simultaneously in different sections. (3) Large-scale mining and strong mining disturbances. Large-scale deep-hole blasting mining can involve several tons of explosives per operation, resulting in strong unloading during mining, strong disturbances during blasting, and significant cumulative effects. In addition, there are many other sources of mining disturbances, such as tunnel excavation construction and large-scale equipment work. (4) Frequent ground pressure disasters. Under high ground stress and strong blasting disturbances, dynamic disasters such as roof collapse and even rock burst occur frequently in deep mining areas (See Figure 3).
Figure 3.
Schematic diagram of deep rock mass disasters in the Sishanling Iron Mine.
Although as stated in Section 2.2, the overall quality of the rock mass in the Sishanling Iron Mine is excellent (RQD > 90%, with intact and hard rock mass), the frequent occurrence of dynamic disasters in deep mining is not contradictory to this macroscopic geological condition. The fundamental reason lies in the coupling effect of high tectonic stress, high-intensity mining disturbance, and intact, hard rock mass. Firstly, under “double super” mining conditions with a burial depth exceeding 1500 m, the stress field dominated by horizontal stress is highly concentrated, and it is easy to accumulate huge elastic strain energy in intact and hard rock masses. Secondly, large-scale deep-hole blasting and continuous mining result in strong instantaneous unloading and periodic disturbances, which easily disrupt the original stable high-stress equilibrium state. Finally, due to their brittle nature, intact and hard rock masses often exhibit sudden instability and failure under high stress rather than slow plastic deformation. This coupling of “strong rock mass–high-stress–strong-disturbance” leads to violent and concentrated energy release processes, which can trigger serious dynamic disasters such as rock bursts. Therefore, while excellent rock mass quality is a stable guarantee in shallow areas, under high-stress and strong-disturbance environments in deep areas, it instead precisely constitutes the necessary material basis for the development of high-strength rock bursts. This special mechanism also highlights the extreme importance and urgency of building a high-precision microseismic monitoring system in the mine to capture real-time precursors of rock microfractures and to warn of macroscopic instability.
2.4. Necessity of Microseismic Monitoring System Construction
The establishment of a microseismic monitoring system in deep non-coal mines is not only a technical imperative but also a regulatory requirement driven by heightened safety standards. In 2022, the National Mine Safety Administration of China issued the “Guiding Opinions on Strengthening Safety Production in Non-coal Mines” (Mining Safety [2022] No.4), which explicitly mandates that metal and non-metal underground mines with a mining depth of 800 m or more must implement an online ground pressure monitoring systems. This policy directive reflects growing recognition by the industry and regulatory bodies of the elevated risks associated with deep mining operations, including increased ground stress, rock burst potential, and strata instability. By institutionalizing such requirements, the guidelines underscore a shift from reactive disaster management to proactive risk prevention, positioning microseismic monitoring as a foundational component of modern mine safety management systems.
From both academic and practical perspectives, implementing microseismic monitoring is crucial for enhancing operational safety and ensuring compliance with national regulations. The same guideline further emphasizes the necessity of establishing comprehensive monitoring, personnel positioning, and communication systems during the infrastructure development phase of underground mines. This regulatory framework not only provides a clear policy basis for the adoption of advanced monitoring technologies but also highlights the role of such systems in facilitating early warning of geological hazards, optimizing support design, and ensuring the safety of mining personnel. Therefore, implementing a microseismic monitoring system is essential not only for regulatory compliance but also for advancing the scientific understanding of deep rock mechanics and contributing to the sustainable and safe development of deep mining projects.
Therefore, under the conditions of ultra-deep and ultra-large-scale mining in the Sishanling Iron Mine, establishing a microseismic monitoring system for underground mining areas not only meets its own safety production needs but also conforms to the clear national safety production regulations, and is of great significance for achieving the “double super” goal.
3. Overall Design and Construction of Microseismic Monitoring System
3.1. Basic Principles of Microseismic Monitoring
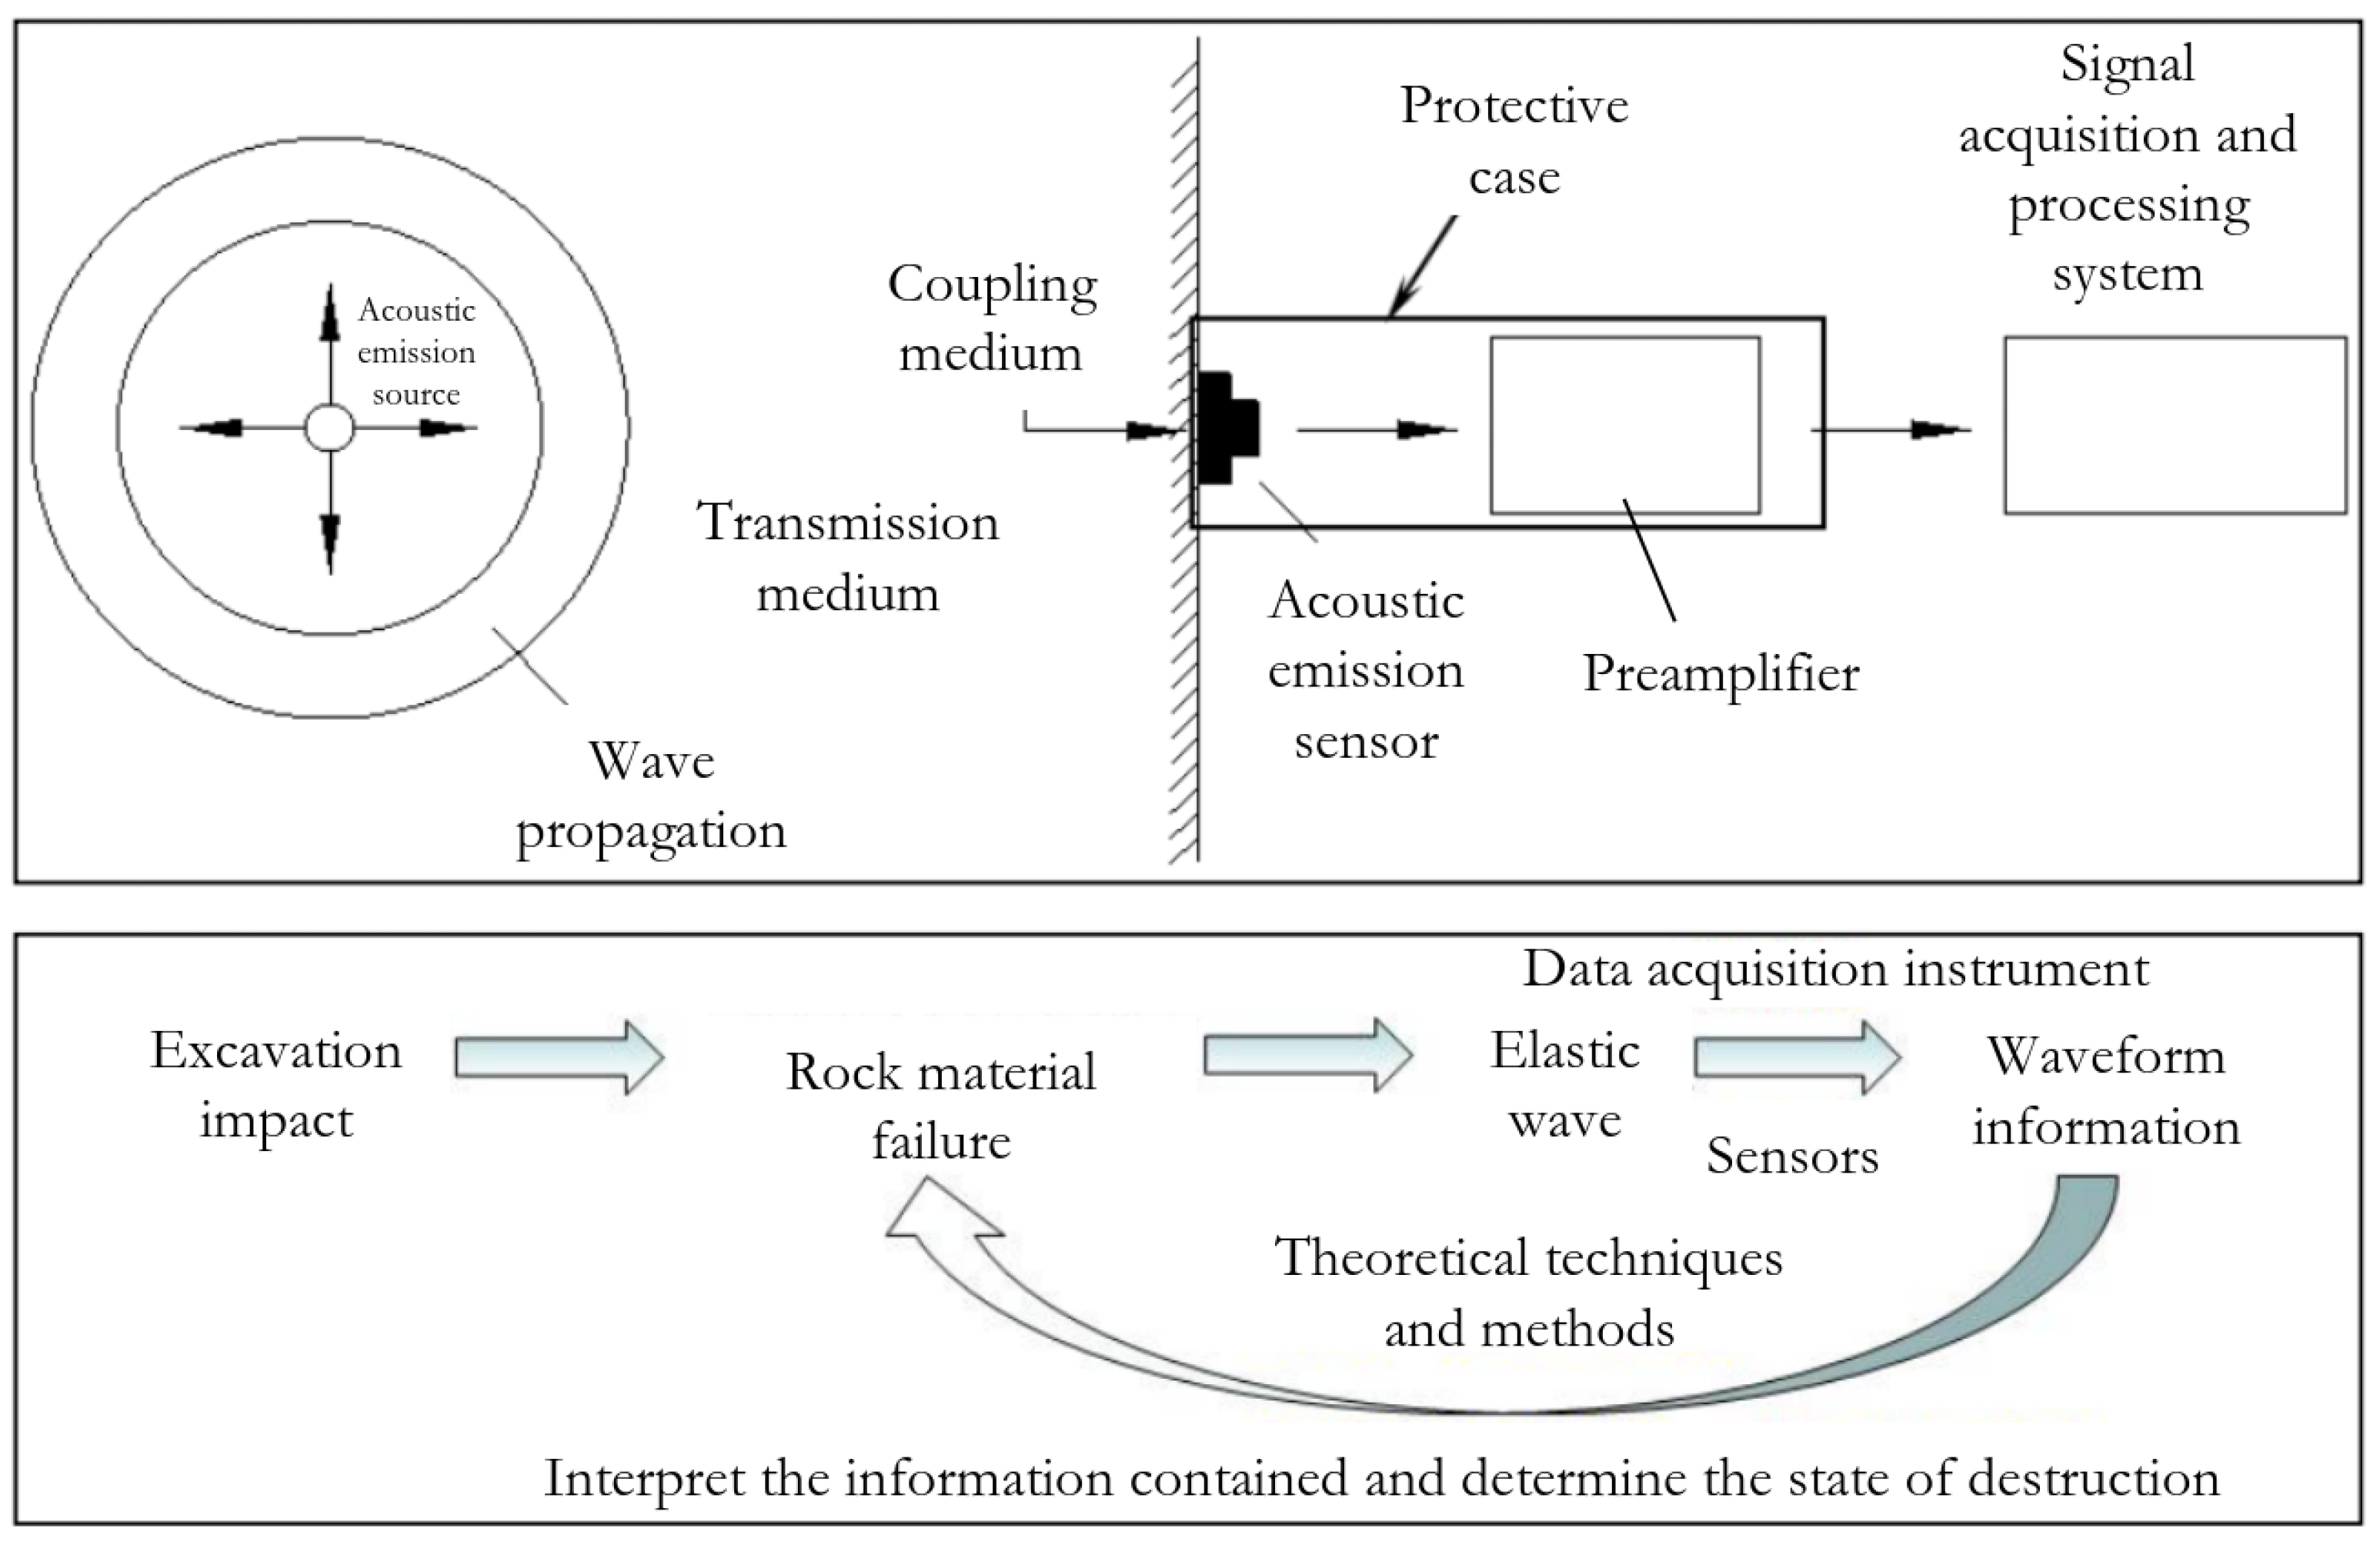
The rock mass structure is always accompanied by microseismic phenomena during the failure process. In rock masses with high-stress or stress changes, especially under the influence of mining, the rock mass is destroyed or original geological fractures are activated to produce displacement or fractures. Energy is released and propagated in the form of elastic waves, as shown in Figure 4. Collect and process elastic wave information to obtain the location, size, energy, apparent volume, seismic moment, inelastic deformation, and source mechanism of microseismic events. Based on these results, parameters such as the original rock stress field and stress drop are deduced, and, when combined with rock mechanics theory analysis, can be used to achieve the purpose of judging the stability of rock mass and provide early warning.
Figure 4.
Schematic diagram of the microseismic monitoring principle.
Microseismic monitoring technology is developed on the basis of earthquake monitoring technology, and its principle is the same as earthquake monitoring and acoustic emission monitoring technology. It is based on the sound and energy principles of rock mass fracture during the process of stress and failure. These phenomena (earthquakes, microseismicity, and acoustic emission) are primarily distinguished by their frequency ranges.
Principle of the High-Precision Positioning Algorithm: The microseismic event localization adopted in this study is based on the Time Difference of Arrival (TDOA) localization principle and the Geiger iterative optimization algorithm. The core workflow is as follows: First, the arrival times of P-waves and S-waves at each sensor are precisely identified through automatic picking techniques, and the wave arrival time differences are calculated. Second, a comprehensive velocity model incorporating the geological structural characteristics of the mining area is established to compute the theoretical travel times. Finally, the Geiger algorithm—an iterative inversion method based on the least squares principle—is employed to minimize the residuals between the observed and theoretical arrival times. By iteratively updating the source location (longitude, latitude, and depth) and origin time until convergence is achieved, the optimal source location solution is obtained. This algorithm effectively overcomes the limitations of purely geometric localization and enables high-precision spatial positioning in complex media.
3.2. Topology Structure of Microseismic Monitoring in Sishanling
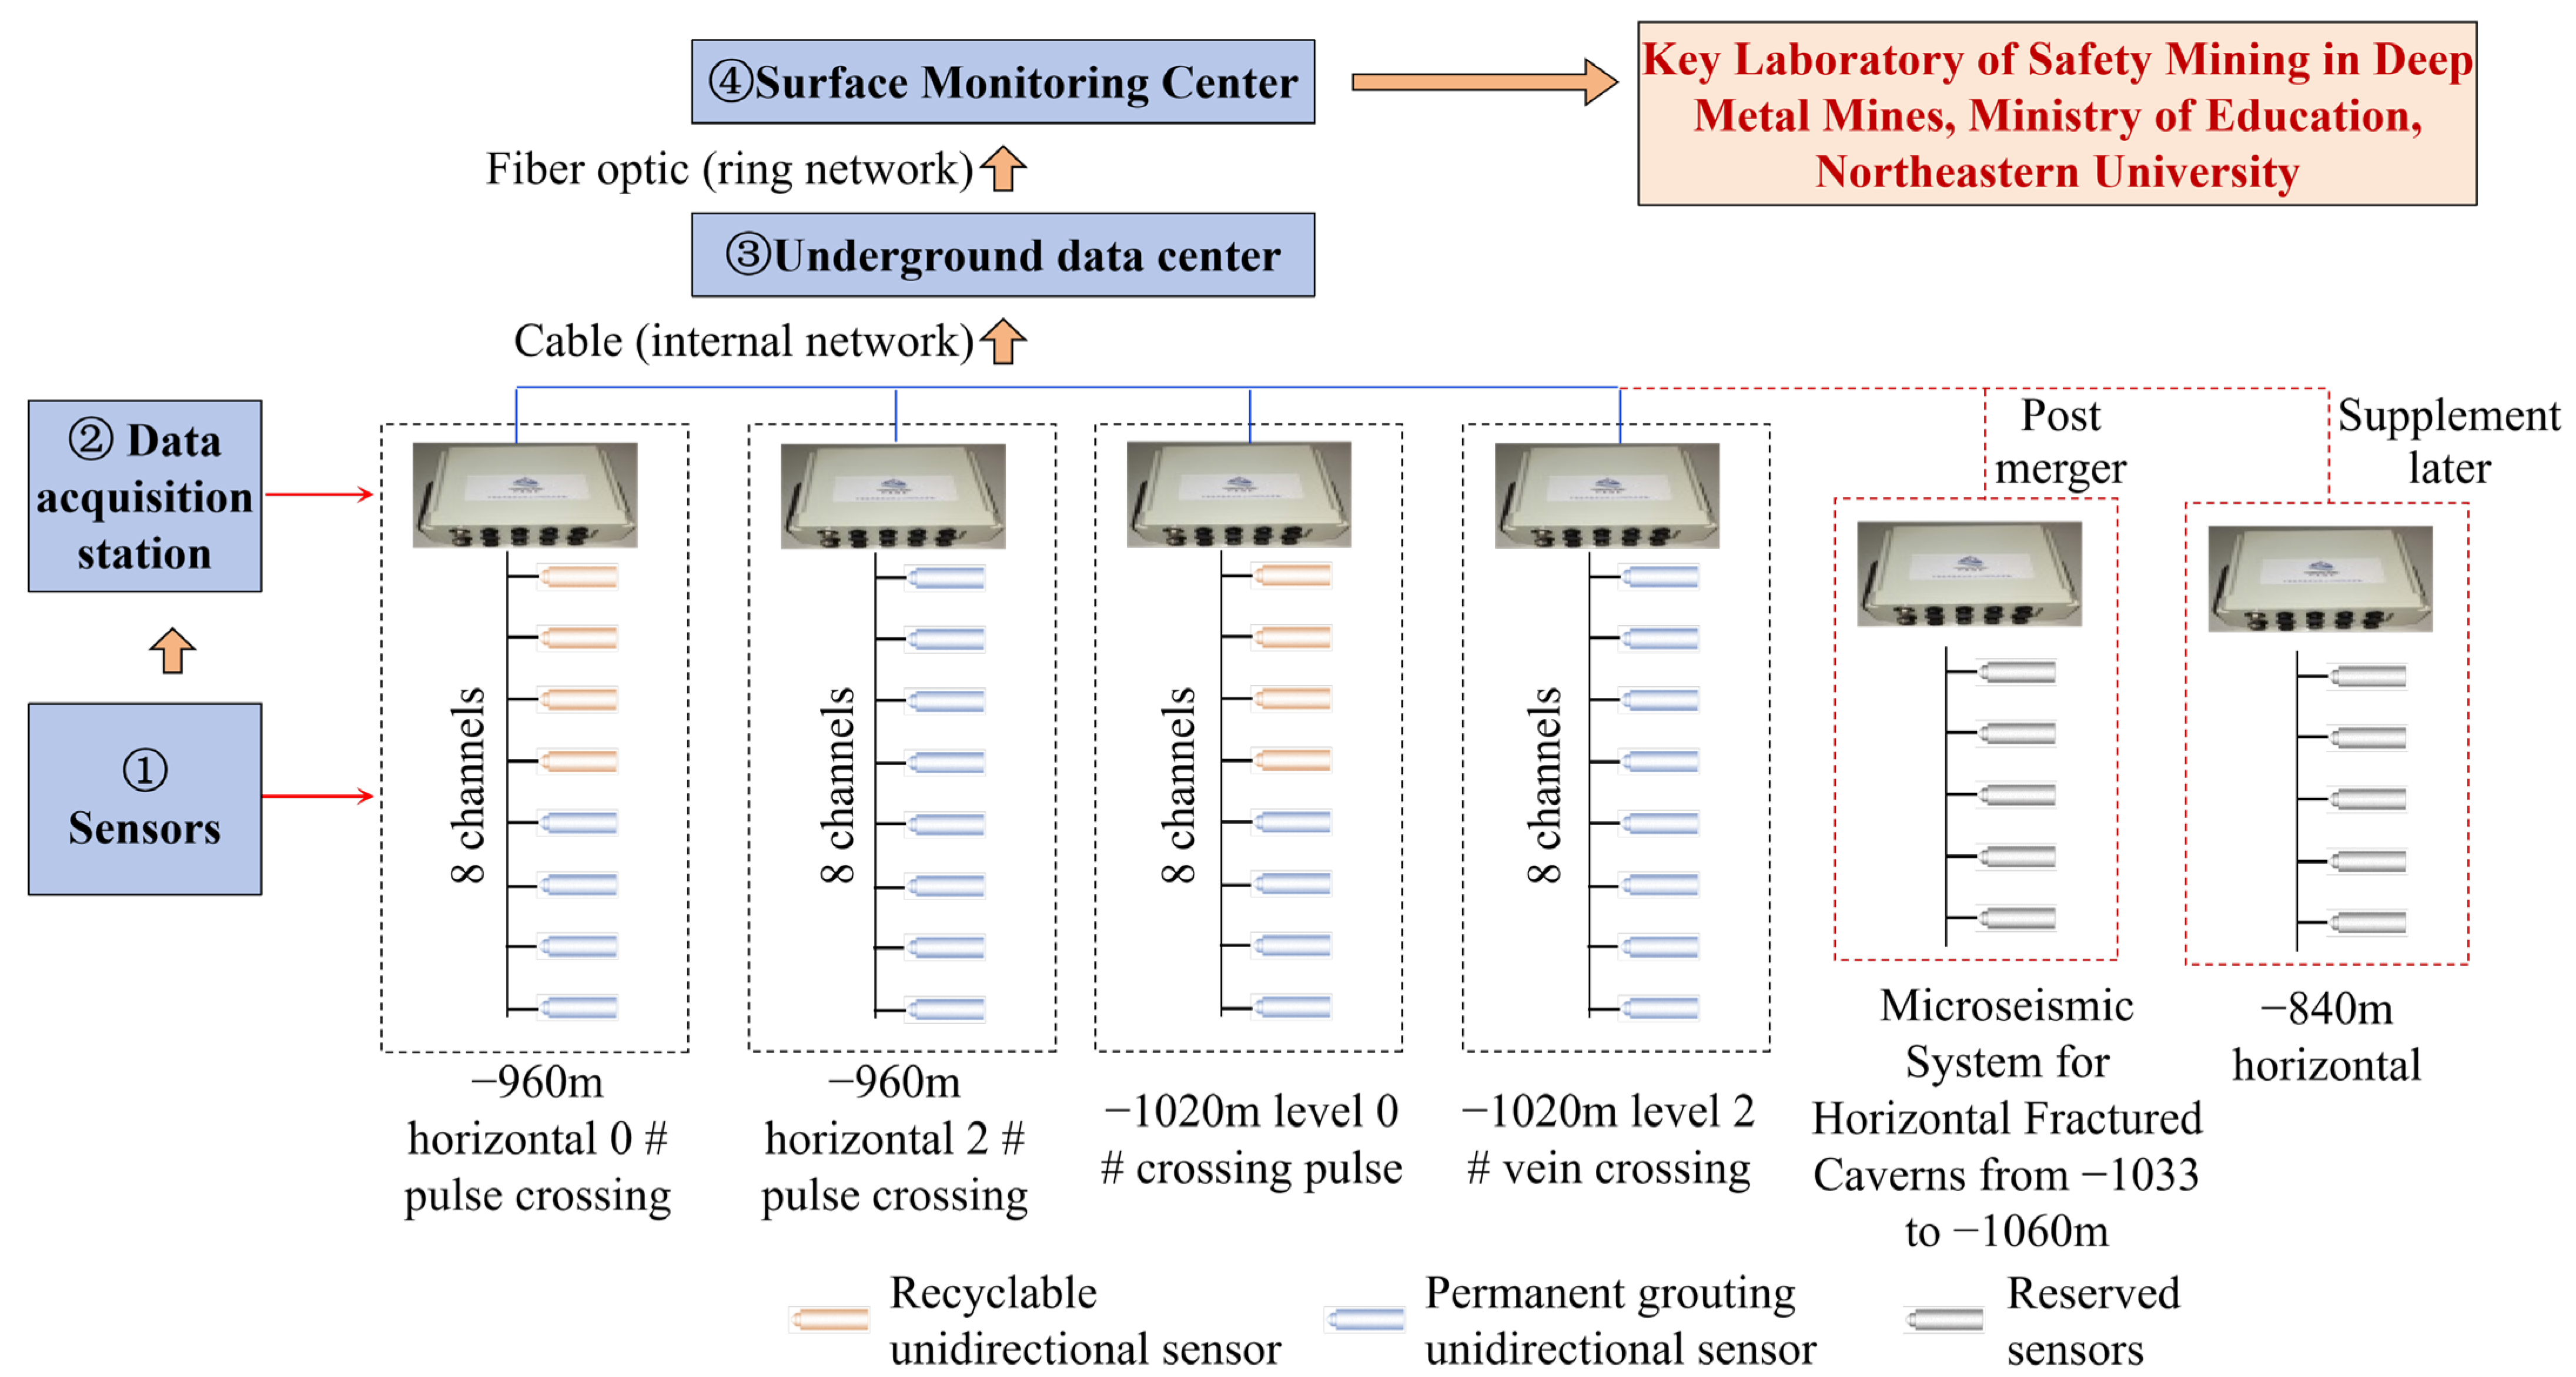
The microseismic monitoring system mainly consists of four parts: a surface monitoring center, an underground data center, data acquisition stations, and sensors. Microseismic signals are collected by sensors and pre-amplified, transmitted to acquisition stations through signal cables, and then converged in the data center before being transmitted to the surface monitoring center through mine optical fibers or cables. Four data acquisition stations (a total of 32 channels) are deployed at the −960 m and −1020 m sections, including two data acquisition stations at the −960 m level (one in the 0 # vein crossing roadway and one in the 2 # vein crossing roadway) and two data acquisition devices at the −1020 m level (one in the 0 # vein crossing roadway and one in the 2 # vein crossing roadway). After all the ore bodies in the mining area are extracted, the mining area will be transferred to the −840 m mining level. In the later stage, the monitoring area will be transferred by supplementing sensors and data acquisition stations. The specific monitoring network is shown in Figure 5.
Figure 5.
Topology diagram of the 32-channel microseismic monitoring system at the Sishanling Iron Mine.
3.3. Layout of the Sishanling Microseismic Monitoring Network
3.3.1. Deduction
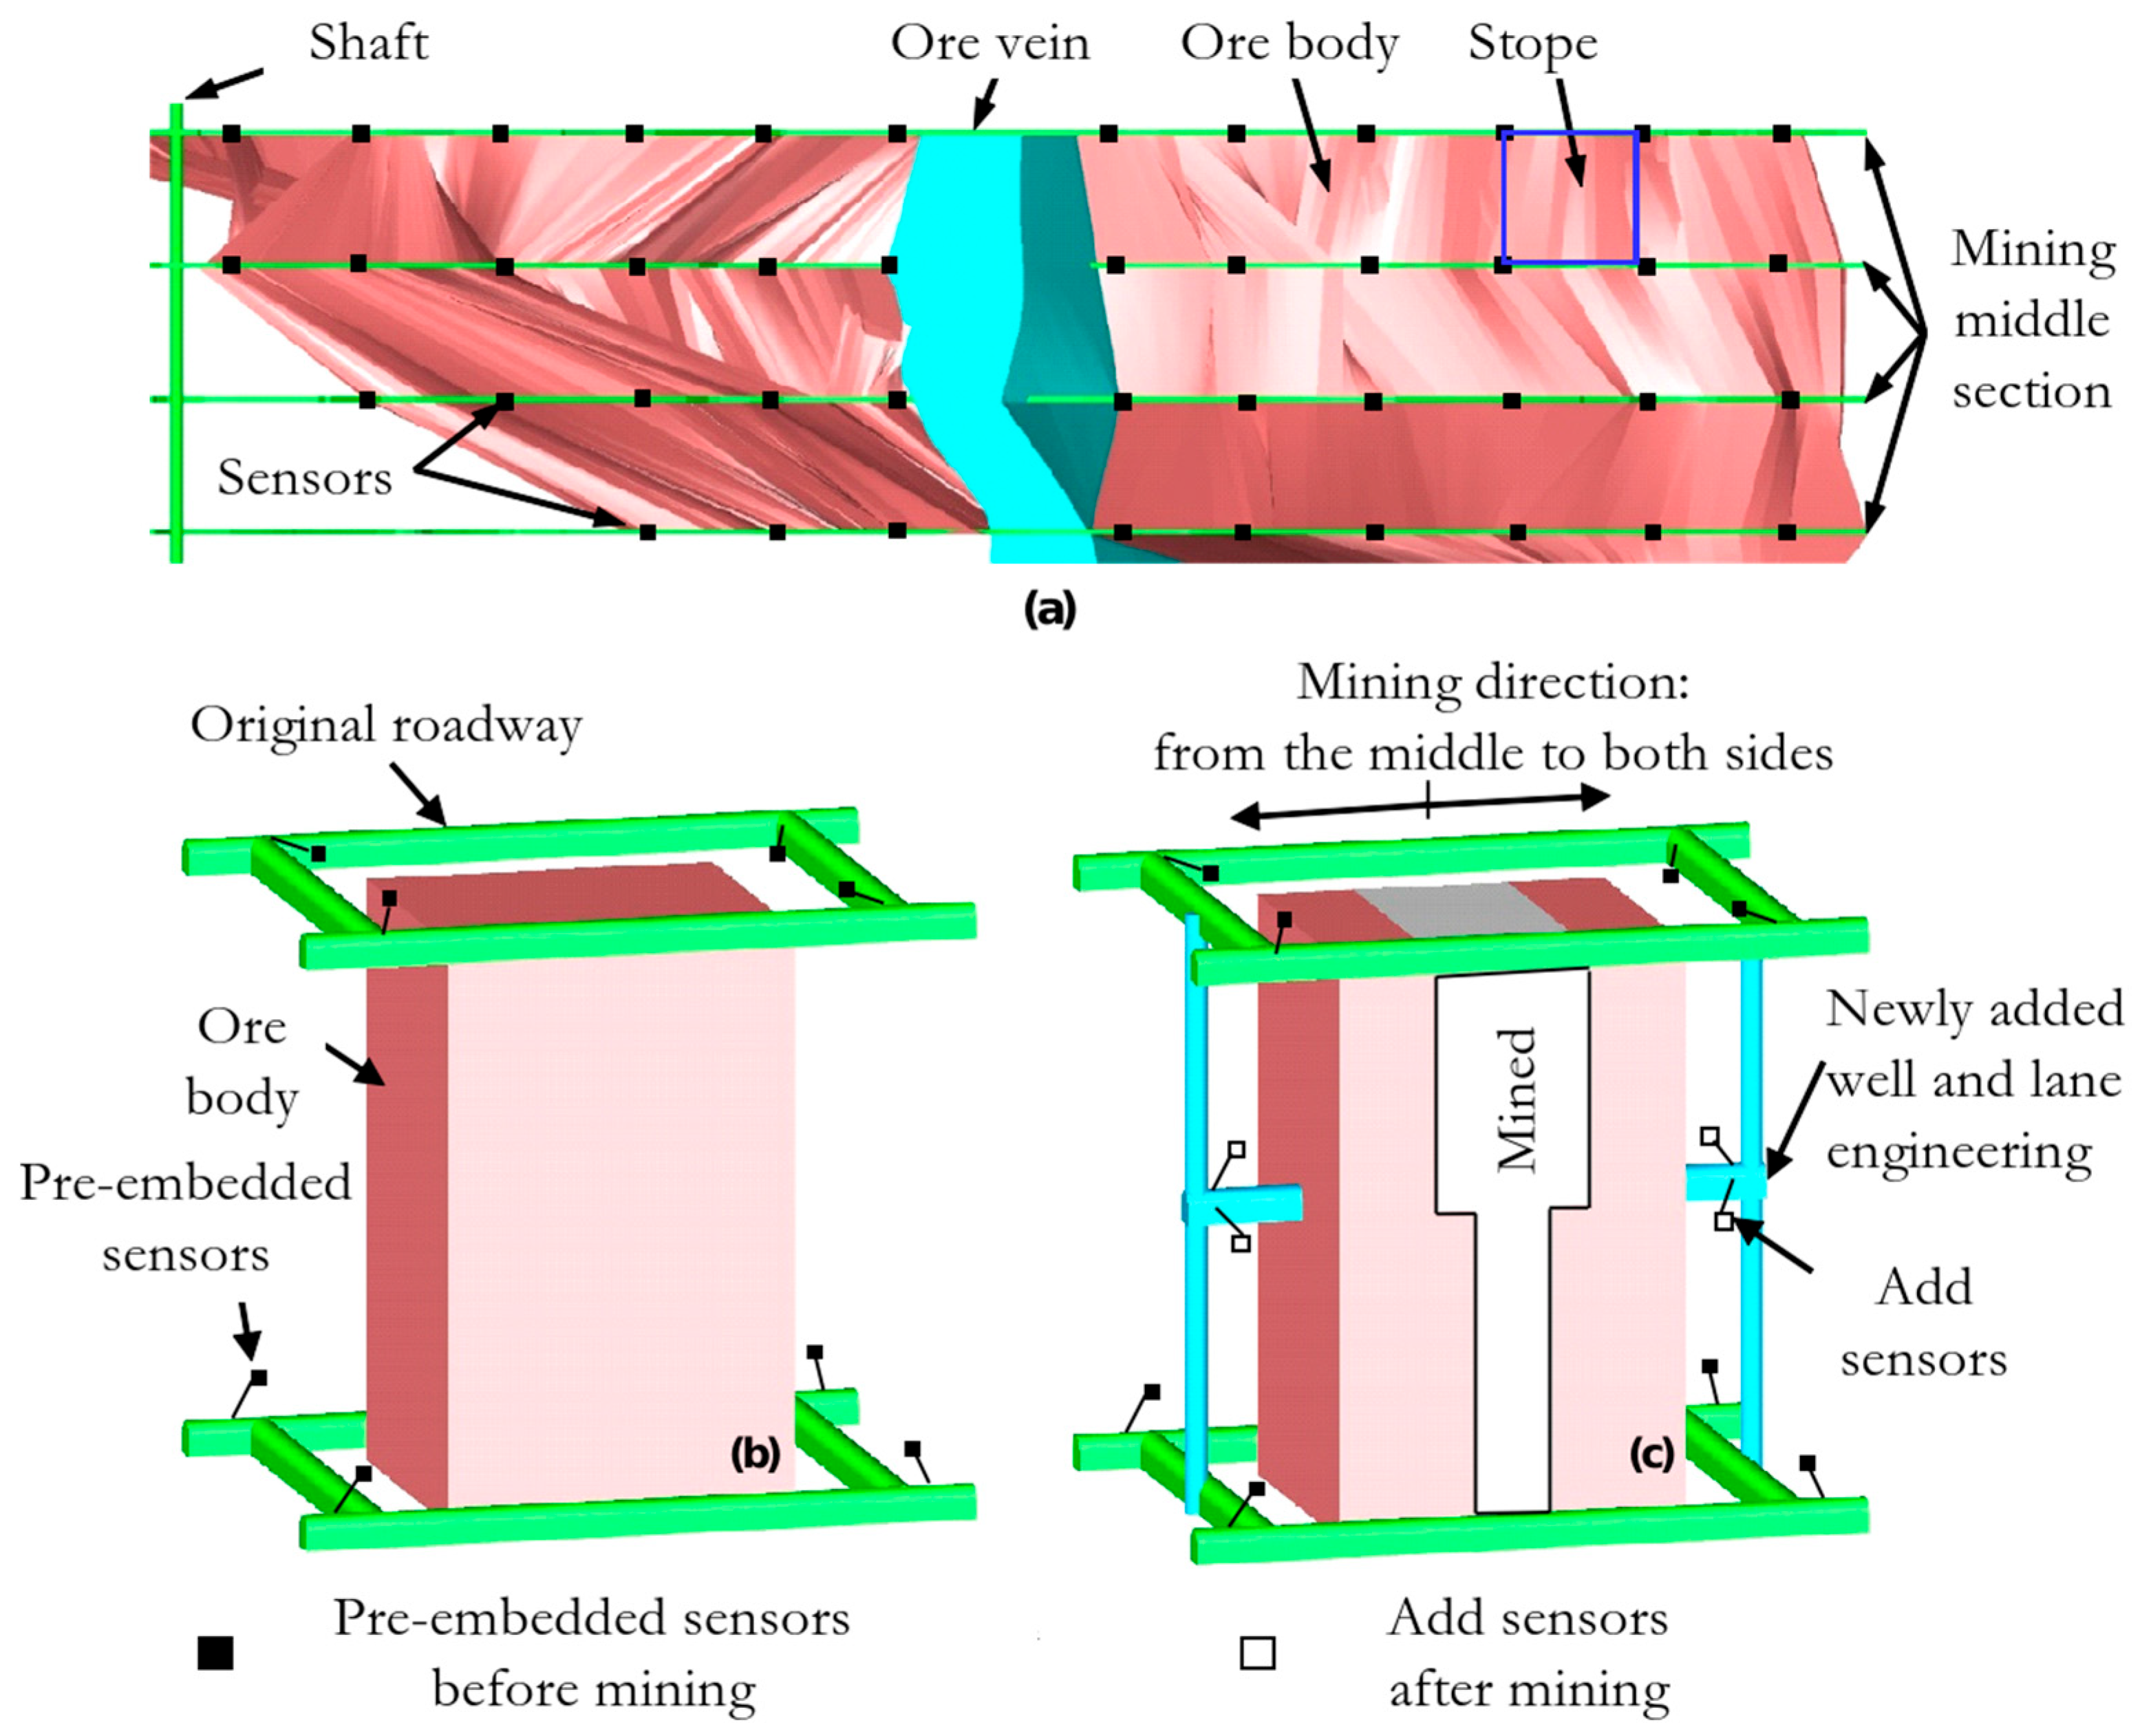
The layout of microseismic monitoring sensors is the basis for locating microseismic sources in mines. All digital information required for microseismic monitoring comes from microseismic sensors, which determine the degree to which initial errors affect the final positioning results. A well-designed microseismic monitoring sensor array can minimize the impact of initial positioning errors; conversely, a poorly designed layout can maximize initial errors and even fail to serve the purpose of microseismic monitoring. Therefore, the layout of microseismic monitoring networks should follow the following principles: (1) Key monitoring principles for key areas: The layout of the microseismic monitoring network should encompass the monitored area while maintaining high accuracy in key areas where underground engineering rock masses are prone to damage. (2) Combination of overall and local aspects: In the process of determining the testing plan and drilling layout, the entire underground engineering rock mass or the predetermined target rock mass should be taken as the testing object, highlighting key points while considering local aspects, and avoiding large machinery and electrical equipment as much as possible. (3) Scientifically reasonable density of the seismic network: If the layout of the microseismic monitoring network is too dense, which does not significantly improve monitoring accuracy; on the contrary, it cannot play a monitoring role. The distance between the sensor and the data acquisition instrument is too large, which affects the quality of signal transmission. The relationship between system magnitude sensitivity, positioning error, and source size should also be considered. (4) Full use of existing shafts, tunnels, and other engineering projects: Try to avoid building new projects solely for microseismic monitoring systems, thereby reducing construction and support costs. (5) Consideration of future monitoring needs: With the progress of mining activities, the mining area may change; therefore, monitoring channels should be reserved in advance, or equipment that has completed its mission should be recycled for monitoring new areas, as shown in Figure 6.
Figure 6.
Composite diagram of typical sensor layout networks in metal mines. (a) Global; (b) Before mining; (c) After mining.
3.3.2. Actual Construction
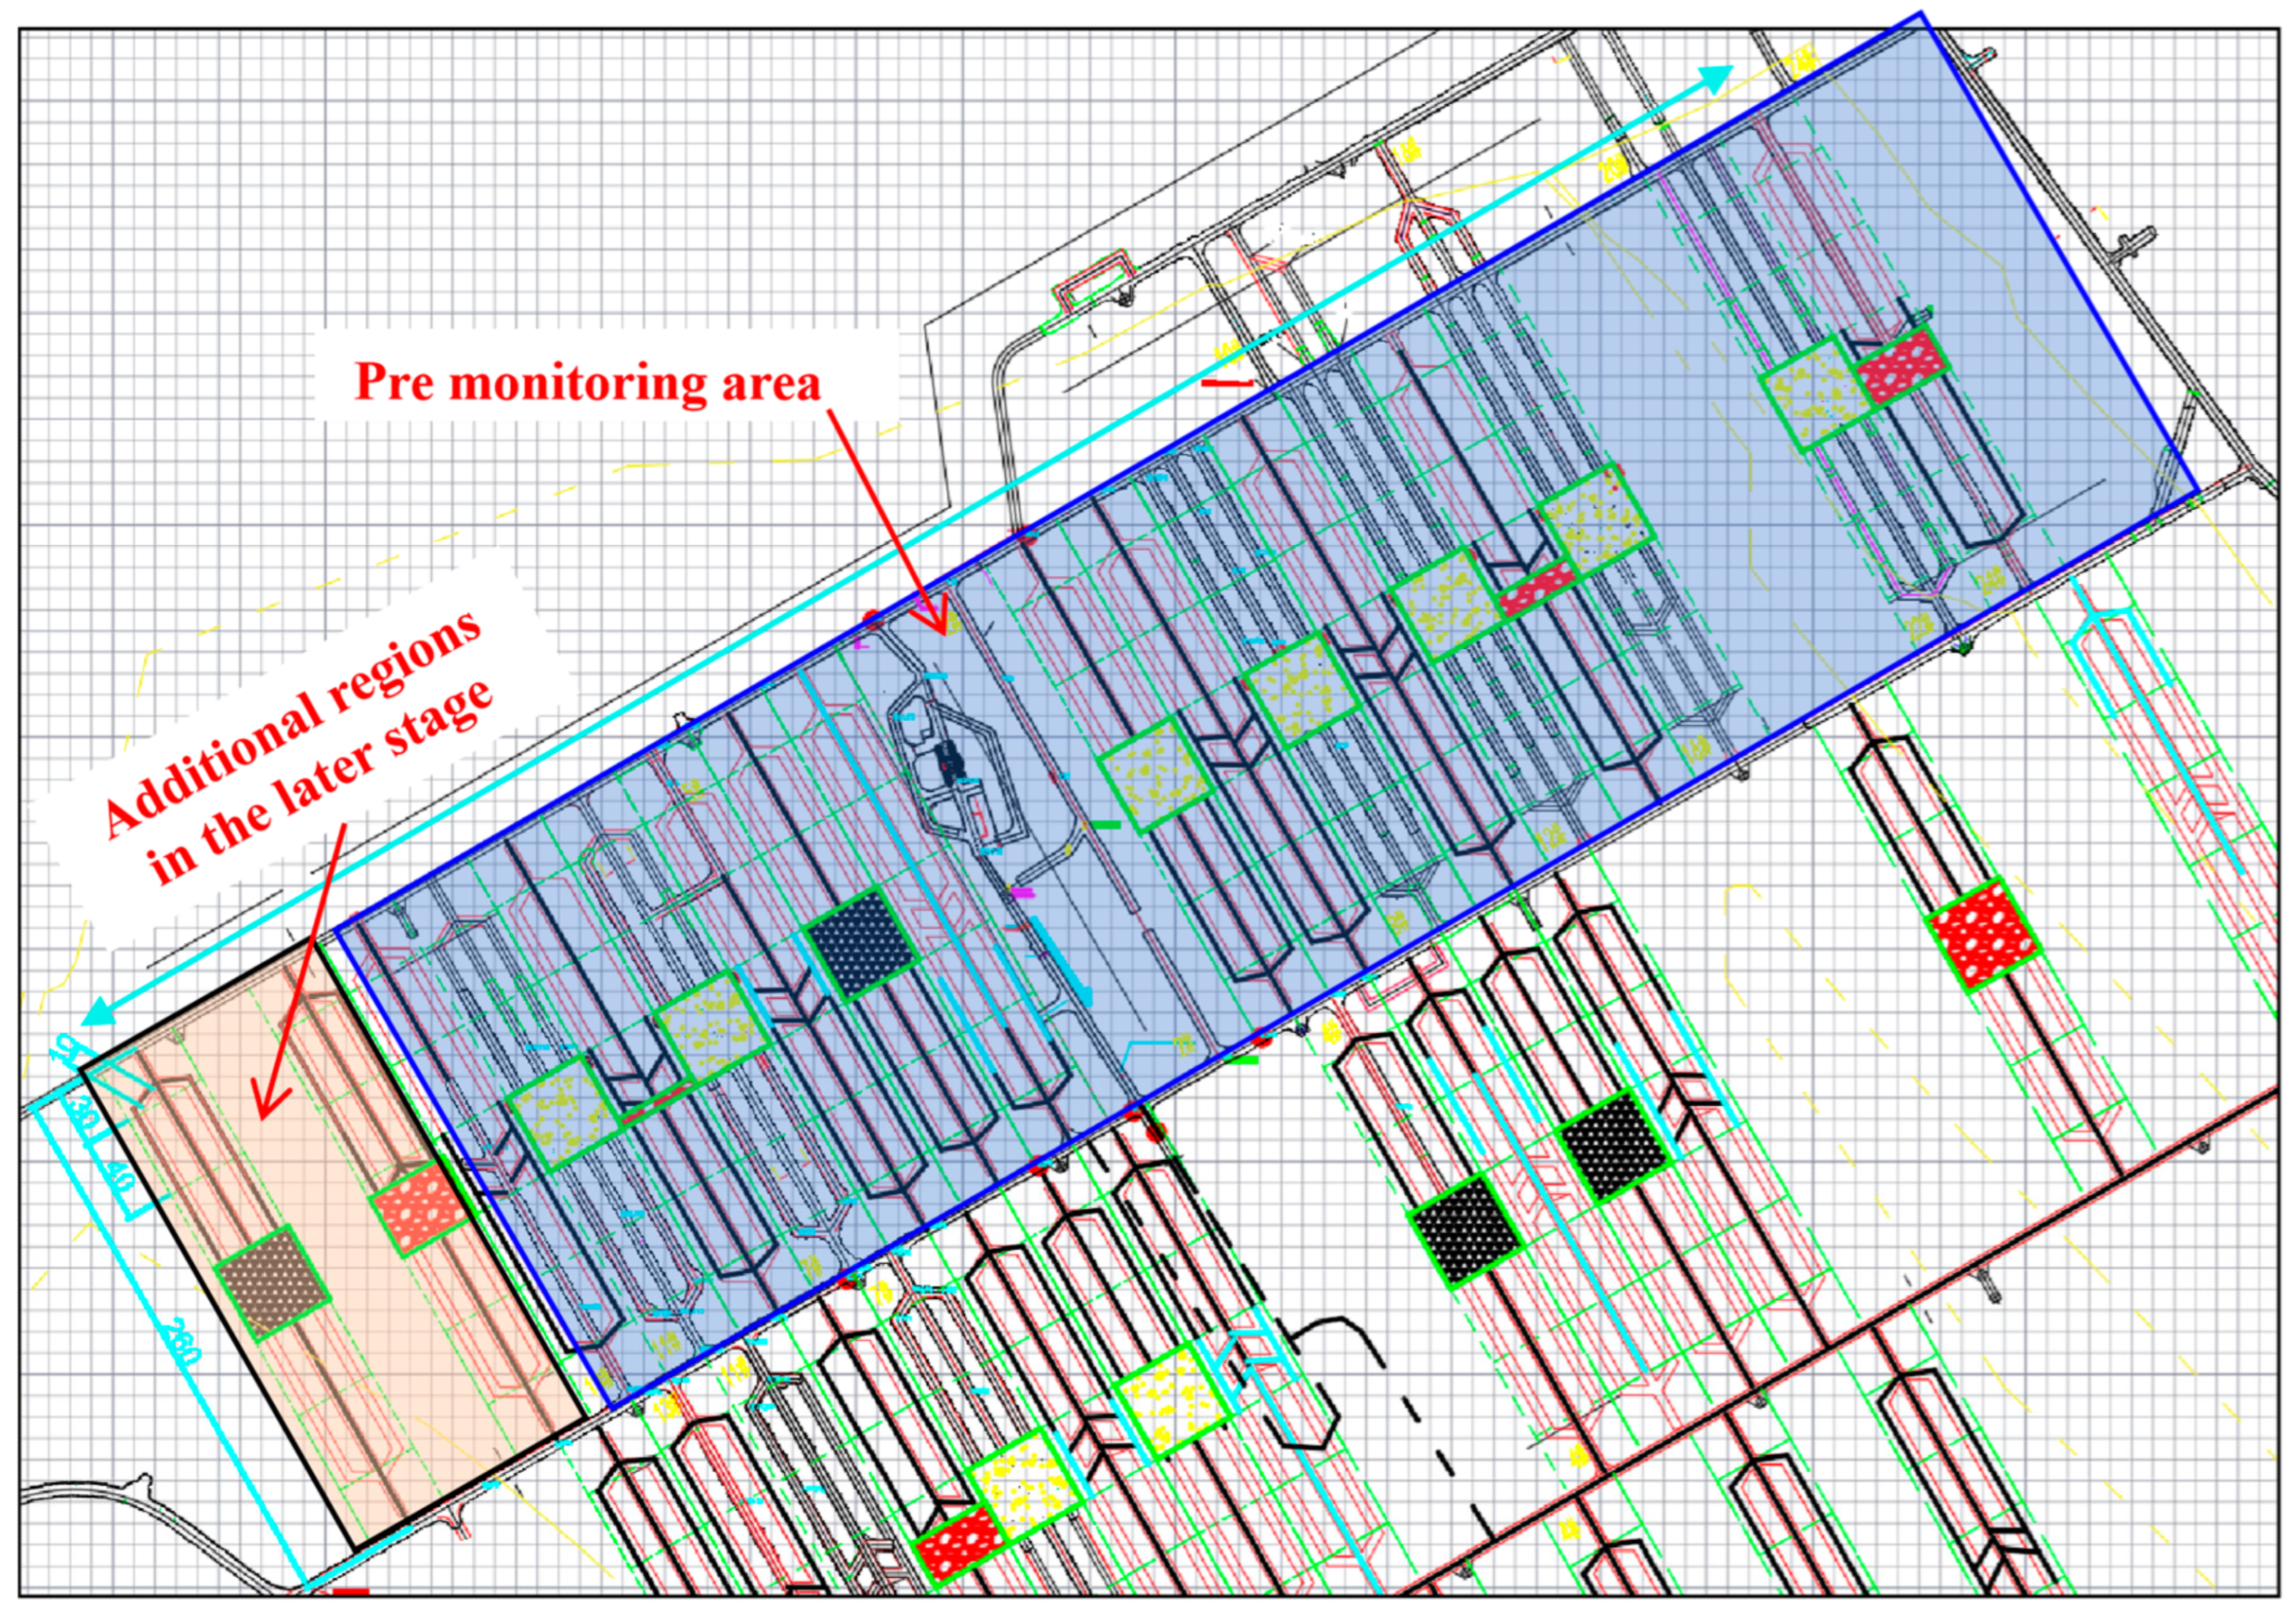
The first mining area of the deep mining area of the Sishanling Iron Mine has a length of about 1370 m along the direction of the ore body, a length of about 260 m perpendicular to the direction of the ore body, and a height of 60 m in the middle section. Taking into account the effective range of microseismic monitoring sensors and equipment costs, the 0 # mining area is divided into a preliminary monitoring area and a later supplementary area, as shown in the following figure. The first batch of microseismic sensors is arranged in the 0 # and 2 # vein tunnels of the first monitoring area. After the completion of some mining content in the early monitoring area, additional sensors will be added to the later monitoring area.
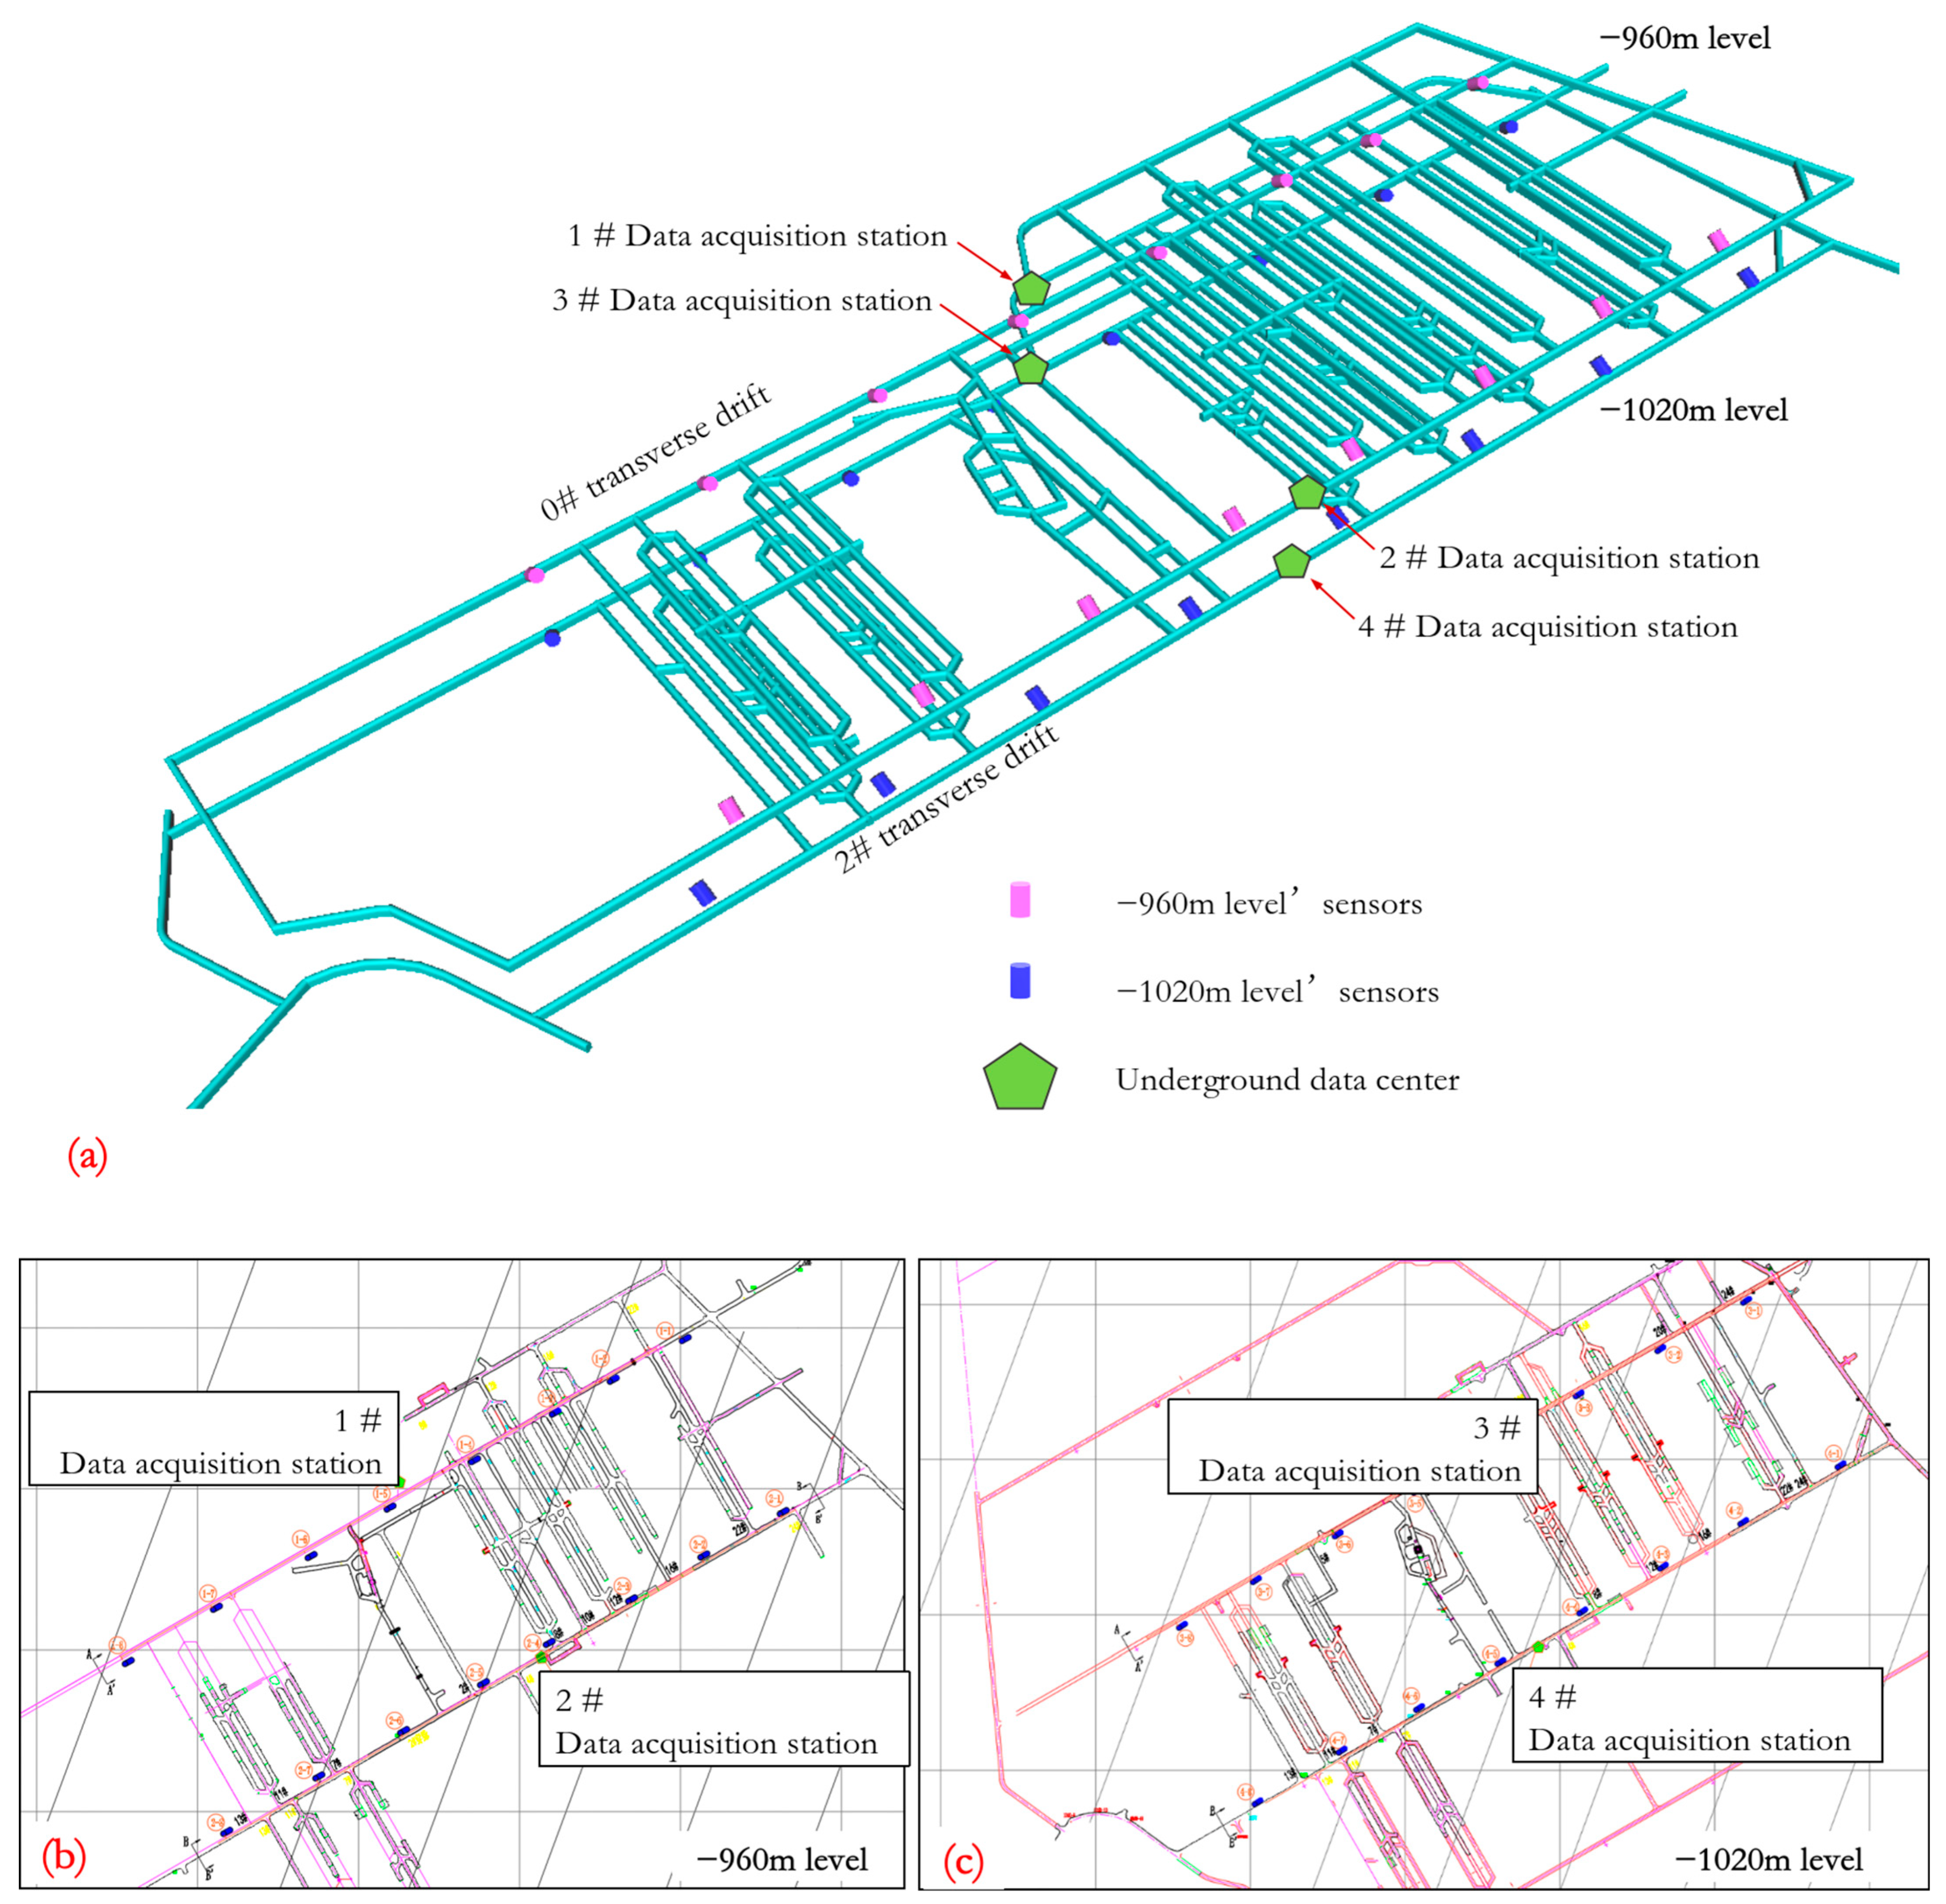
As shown in Figure 7 and Figure 8, a total of 32 channels of the microseismic monitoring system were arranged in the cross-vein roadway at the −960 m and −1020 m levels in the early stage, including 16 channels in the −960 m middle section and 16 channels in the −1020 m middle section. Among them, 16 channels are arranged in the −960 m middle section (0 # through vein 8 channels, 2 # through vein 8 channels), and 16 channels are arranged in the −1020 m middle section (0 # through vein 8 channels, 2 # through vein 8 channels). All 32 sensors are permanent one-way sensors for grouting. Four data acquisition stations are deployed in total, including two at the −960 m level and two at the −1020 m level. The specific layout adopts a centralized principle, with one underground data center planned to be located near the horse head gate of the auxiliary shaft at the −1020 m level.
Figure 7.
Horizontal mining site structure layout plan.
Figure 8.
Three-dimensional spatial layout of microseismic sensors and schematic diagrams of horizontal layouts. (a) −960 m and −1020 m; (b) −960 m; (c) −1020 m.
Figure 8 shows the four-level topology structure of the microseismic monitoring system at the Sishanling Iron Mine, covering the entire closed-loop process from underground sensing to ground decision-making. The system is based on 32 grouting sensors arranged in the middle section of the vein tunnel at −960 m and −1020 m as the sensing layer. Signals are collected locally through four collection stations, preprocessed in the underground data center, and transmitted to the ground monitoring center through a redundant fiber-optic ring network. This structure adopts a “distributed acquisition and centralized processing” mode, which not only meets the stability requirements of signal transmission under ultra-deep-well conditions but also meets the decision-making needs of real-time data processing and disaster warning throughout the entire mine. It provides a scalable network architecture example for the deployment of the “double super” mine microseismic monitoring system.
The specific sensor coordinate points are shown in Table 1, which provides a detailed list of the engineering parameters of the 32 microseismic sensors deployed in the first phase. The layout plan adopts a spatial strategy of “layered coverage and tunnel clamping”, and sensors are installed along the 0 # and 2 # vein crossing tunnels at the −960 m and −1020 m production sections, forming a three-dimensional monitoring network for the mining area. All sensors are installed in original rock through drilling holes 4–8 m deep and are permanently coupled with grouting. The opening coordinates are precisely measured, providing reliable physical references and geometric constraints for achieving meter-level positioning accuracy (overall spatial error ≤ 9.66 m).
Table 1.
Coordinates of microseismic monitoring sensors in the Sishanling Iron Mine.
4. System Performance Debugging, Verification, and Calibration
To ensure the reliability of microseismic event localization, this study established a calibrated wave velocity model for the monitoring area of the Sishanling Iron Mine. Considering that the lithology in the middle section of the main monitoring levels (−960 m and −1020 m) is mainly composed of intact and hard magnetite quartzite and hematite quartzite, and that the engineering geological conditions are relatively uniform (see Section 2.2), we adopted a layered uniform model based on active seismic source calibration. The specific process is as follows: After system installation, multiple known coordinate points were selected within the monitoring network range for small-charge blasting as artificial seismic sources. By accurately picking up the first arrival times of the P-wave and S-wave, the optimal P-wave and S-wave velocity parameters applicable to the region were optimized using an inversion algorithm. The model was subsequently validated using a set of independent blasting events, with positioning errors controlled within 15 m, demonstrating the effectiveness of the model. All microseismic event localization and error analysis reported in this article (including the optimal localization accuracy in Section 4) are based on the calculation of wave velocity models that were calibrated and validated on-site.
4.1. System Debugging and Verification
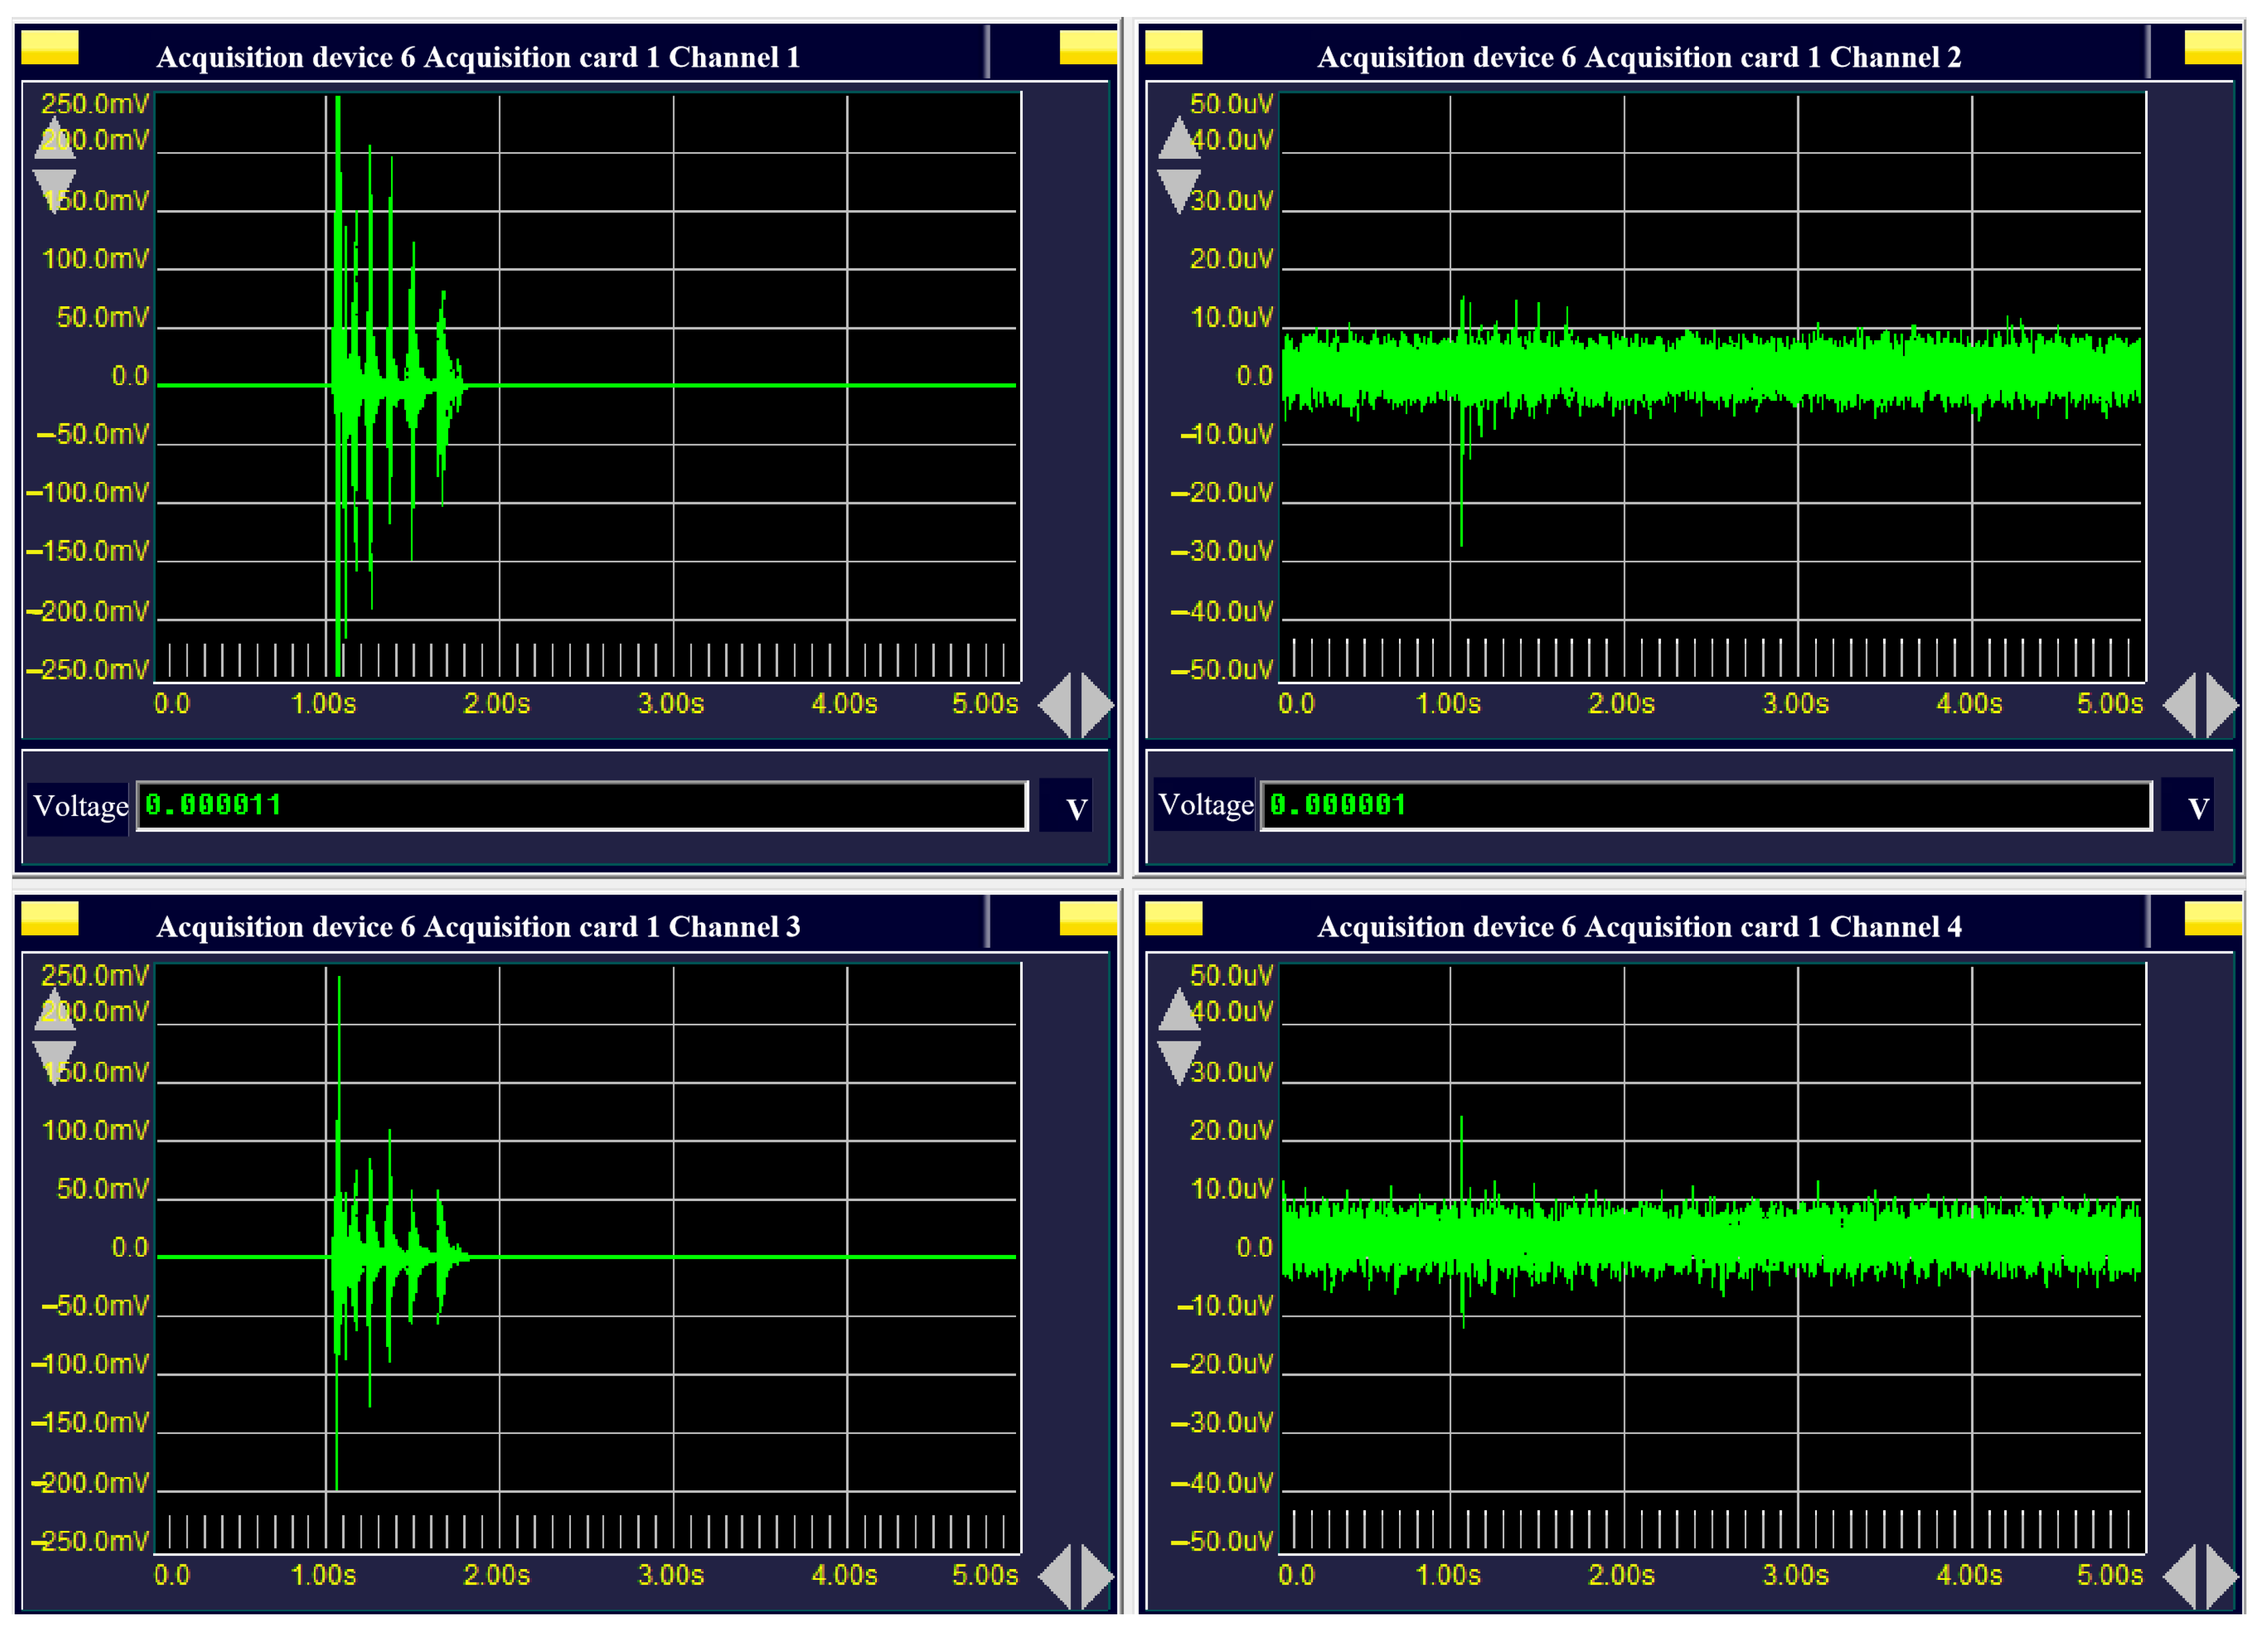
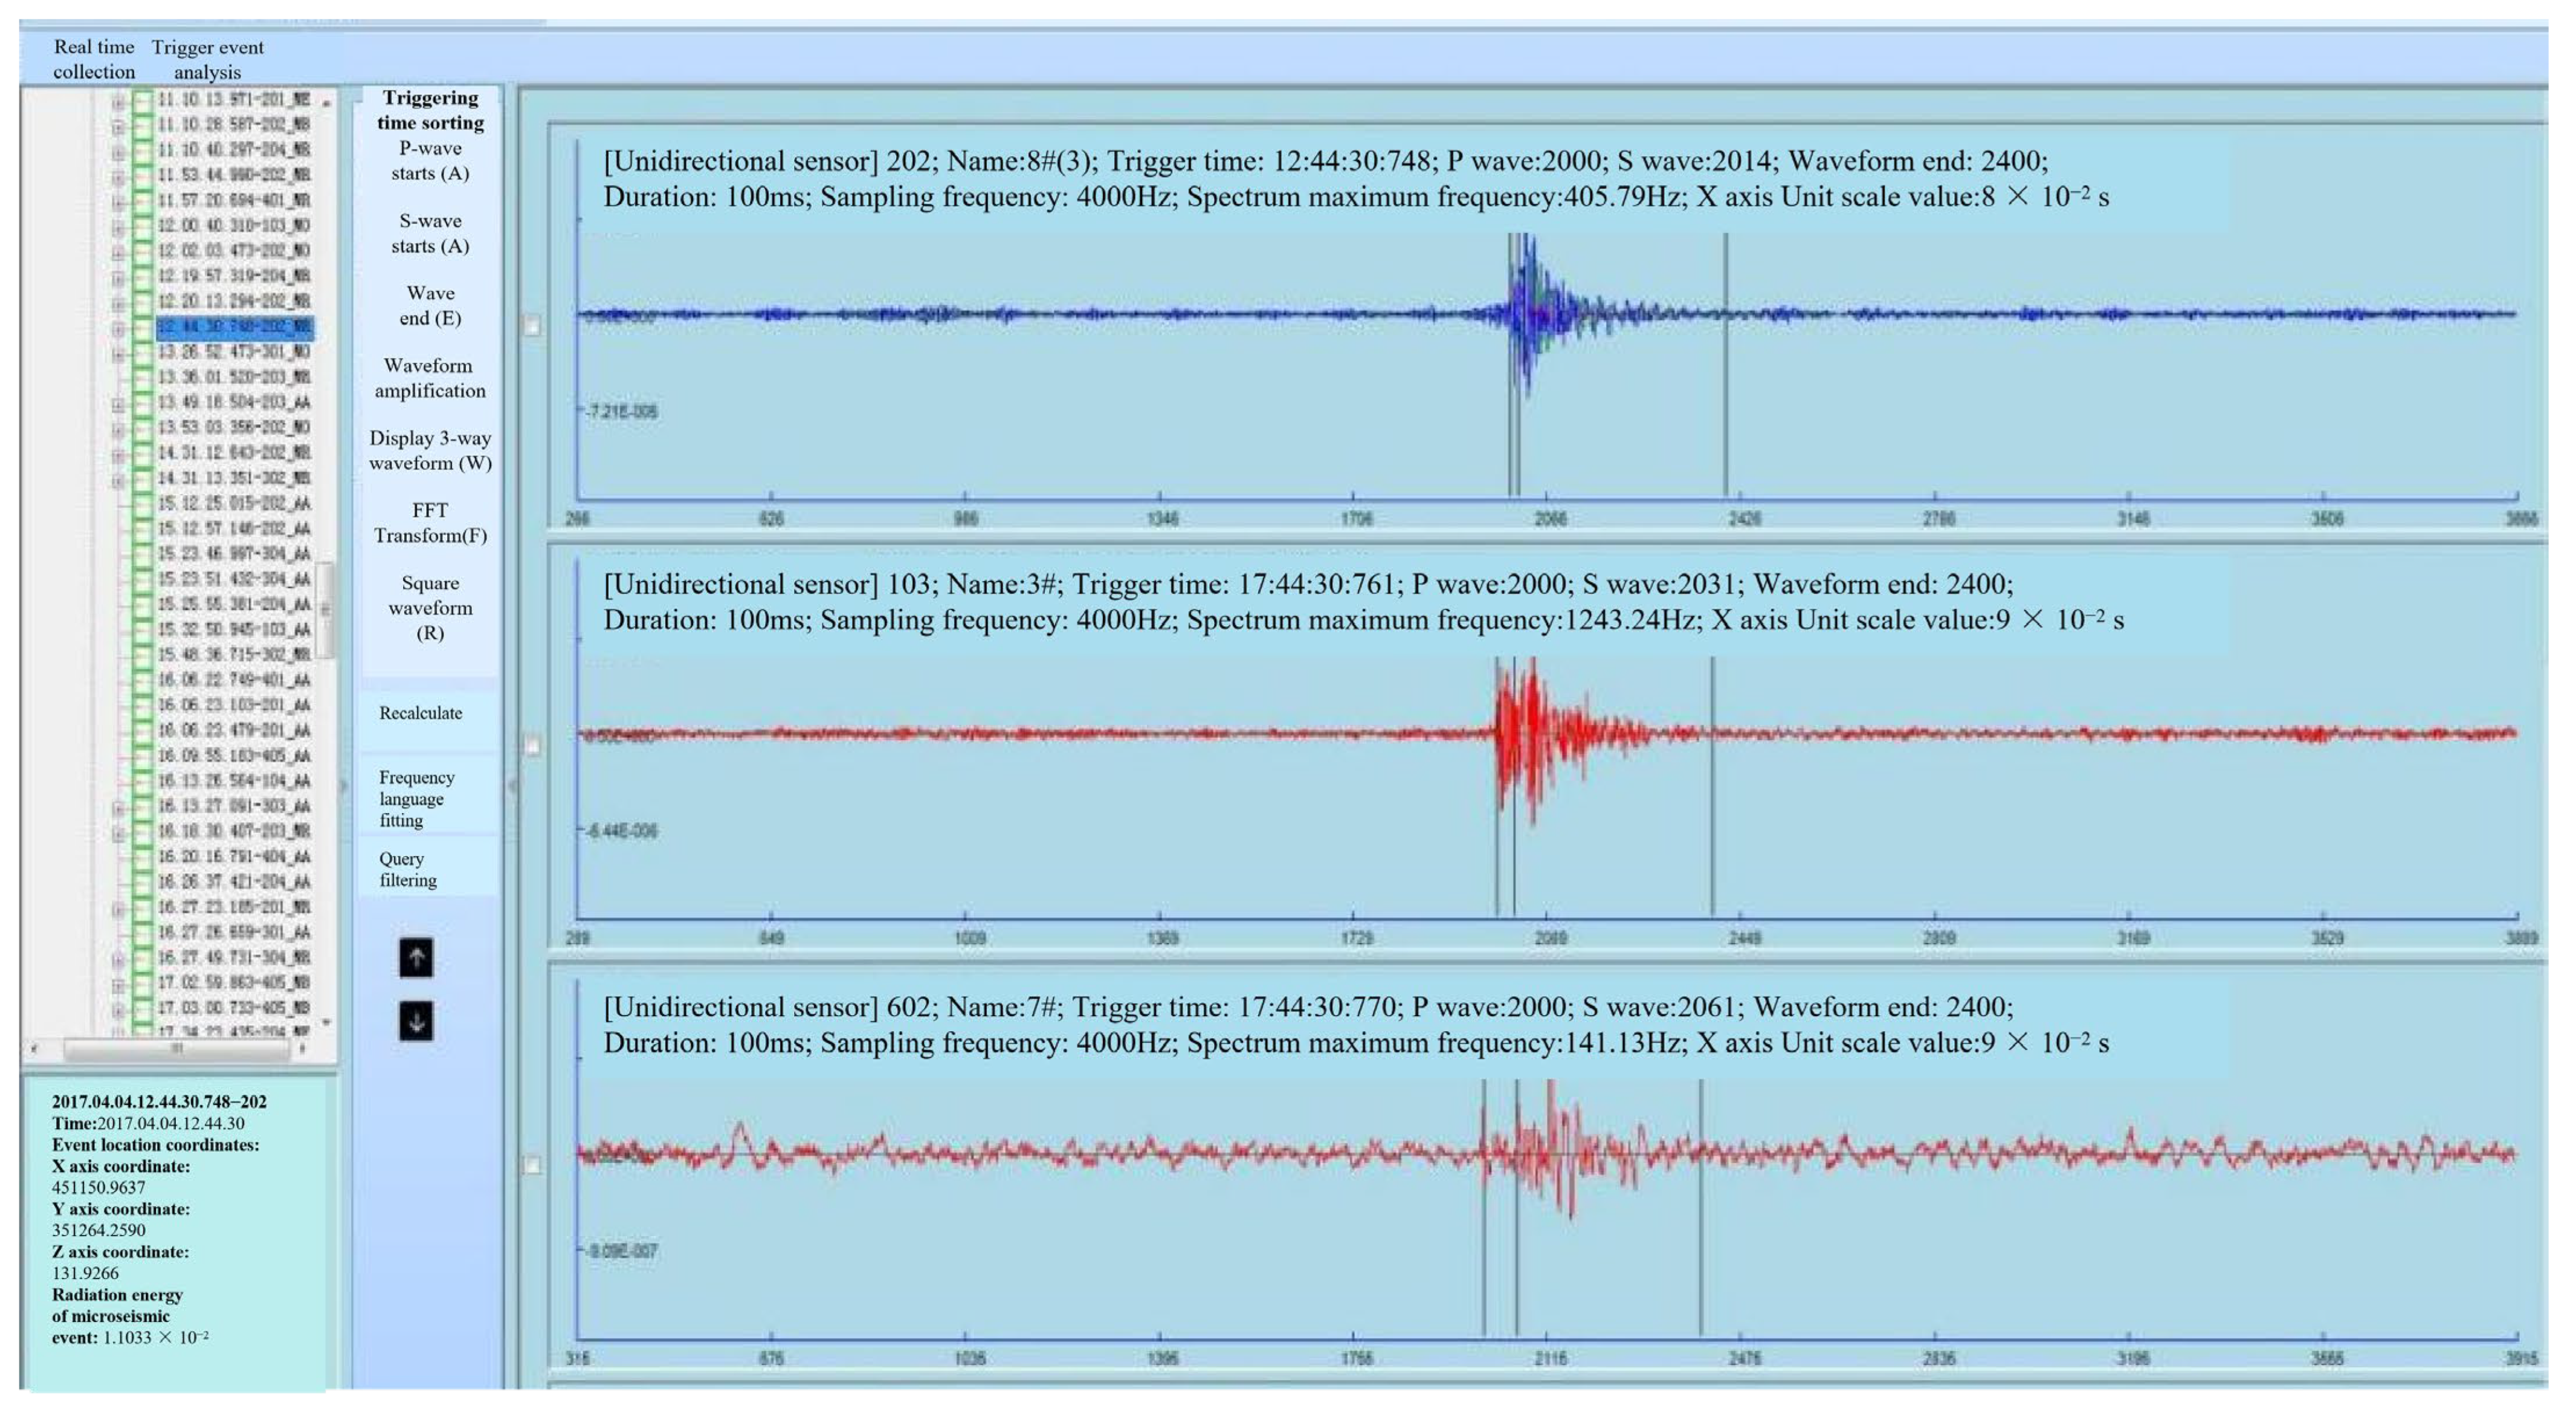
In the construction of a microseismic monitoring system for ultra-large-scale and ultra-deep-well mines, system debugging and verification are crucial. Taking the Sishanling Iron Mine project as an example, the core performance of the system was verified through strict debugging. Firstly, the system demonstrated excellent signal capture capability and can effectively identify microseismic events within the target magnitude range. Secondly, through high-precision positioning algorithms, the optimal global spatial positioning error and planar positioning error were debugged, and the accuracy threshold for earthquake magnitude calculation was clarified. As shown in Figure 9 and Figure 10, the system has achieved real-time monitoring of waveforms and intelligent recognition of wave phases, ensuring real-time and continuous data transmission and processing. These key indicators meet the core requirements of mine safety production for monitoring accuracy and reliability, and provide solid technical support for deep-well safety.
Figure 9.
High-precision real-time microseismic waveform display software.
Figure 10.
Automatic picking of P- and S-waves.
4.2. Effect Analysis
This article analyzes positioning error and magnitude identification accuracy from two dimensions: plane and section. Among them, the accuracy range of magnitude identification refers to the magnitude distribution interval of microseismic events that can be reliably picked up, fully recorded, accurately located, and have their energy calculated using calibrated wave velocity models and algorithms during actual operation of the system. This interval directly reflects the overall reliability of the system from signal detection to parameter calculation.
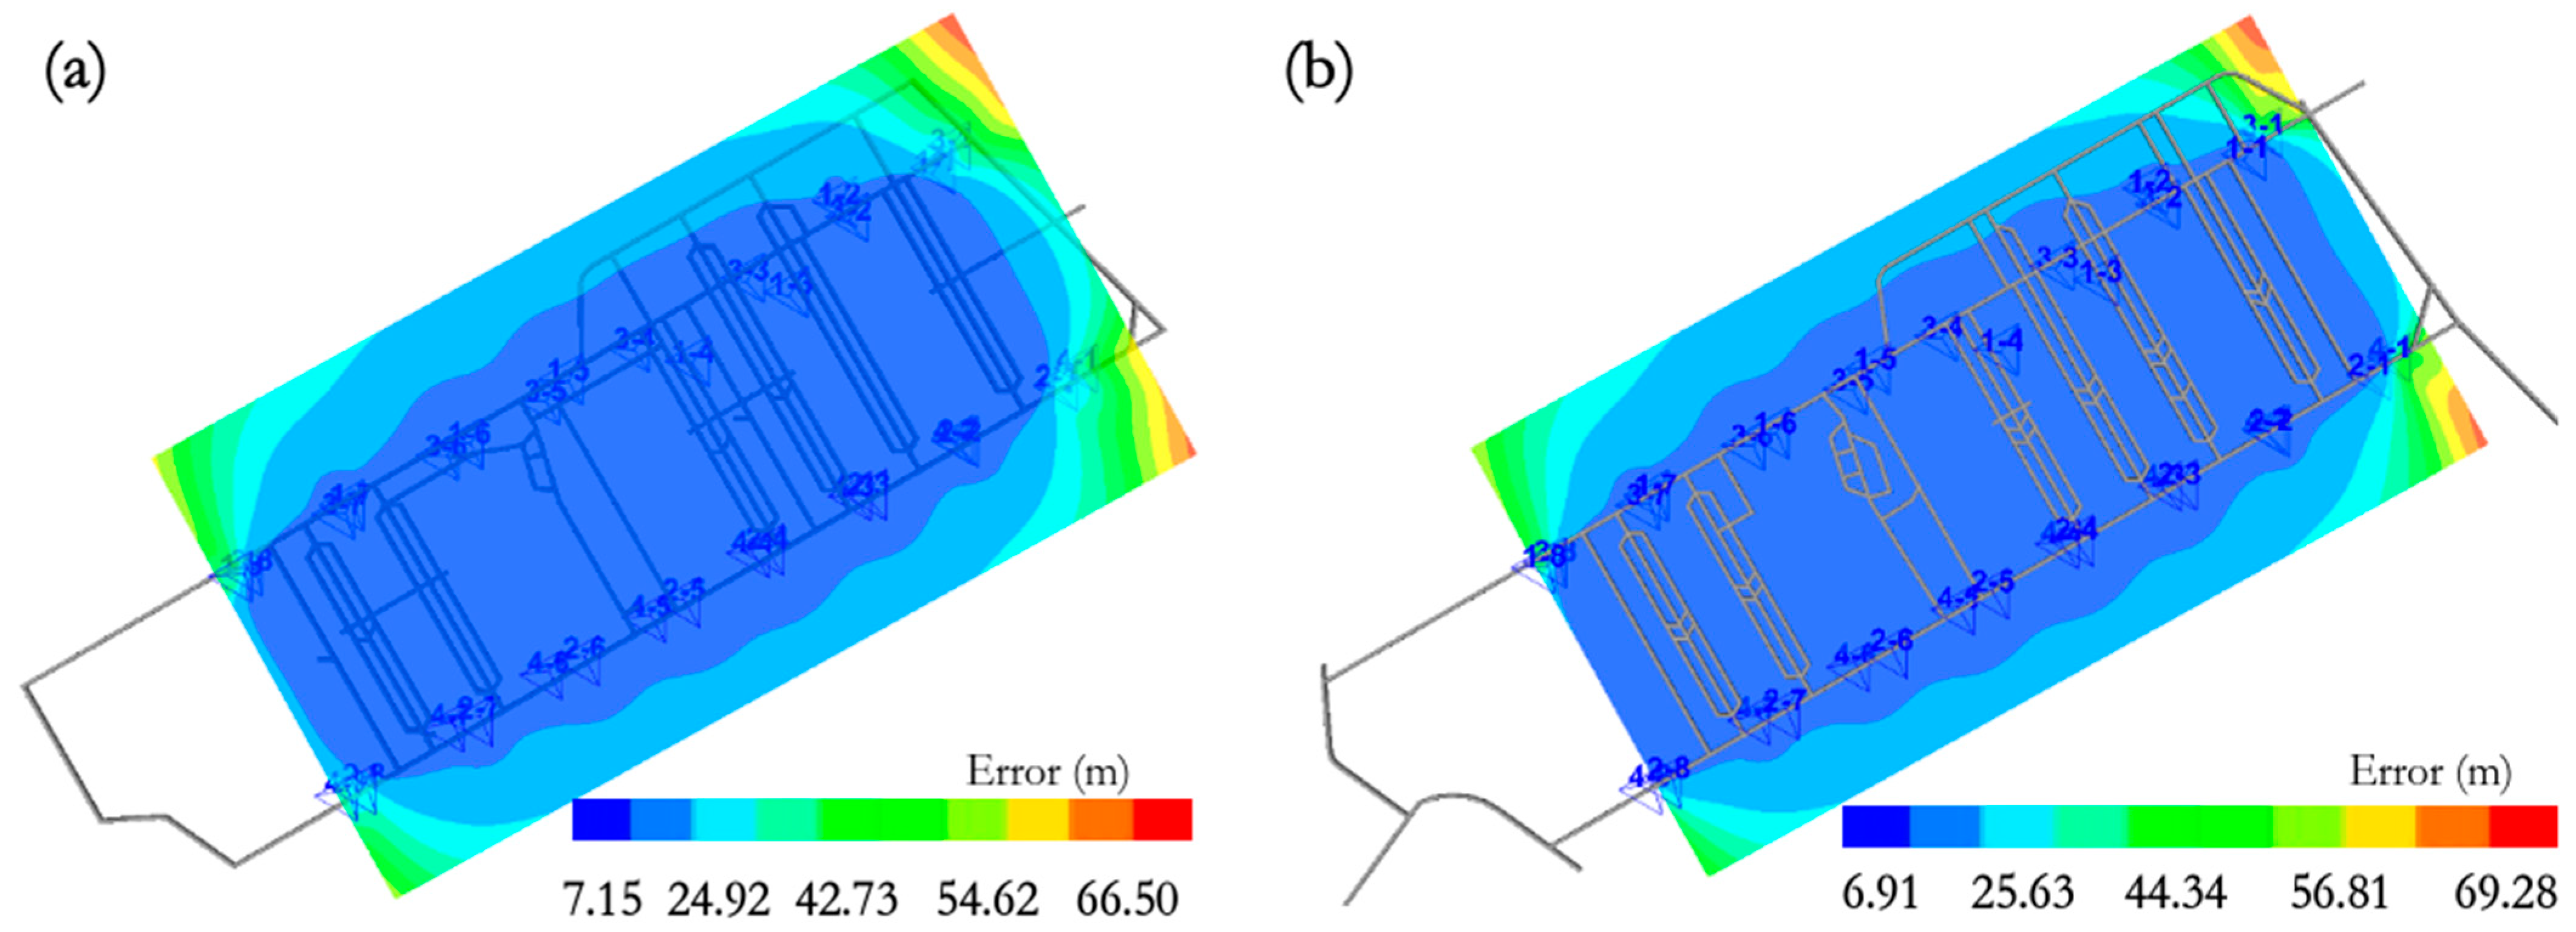
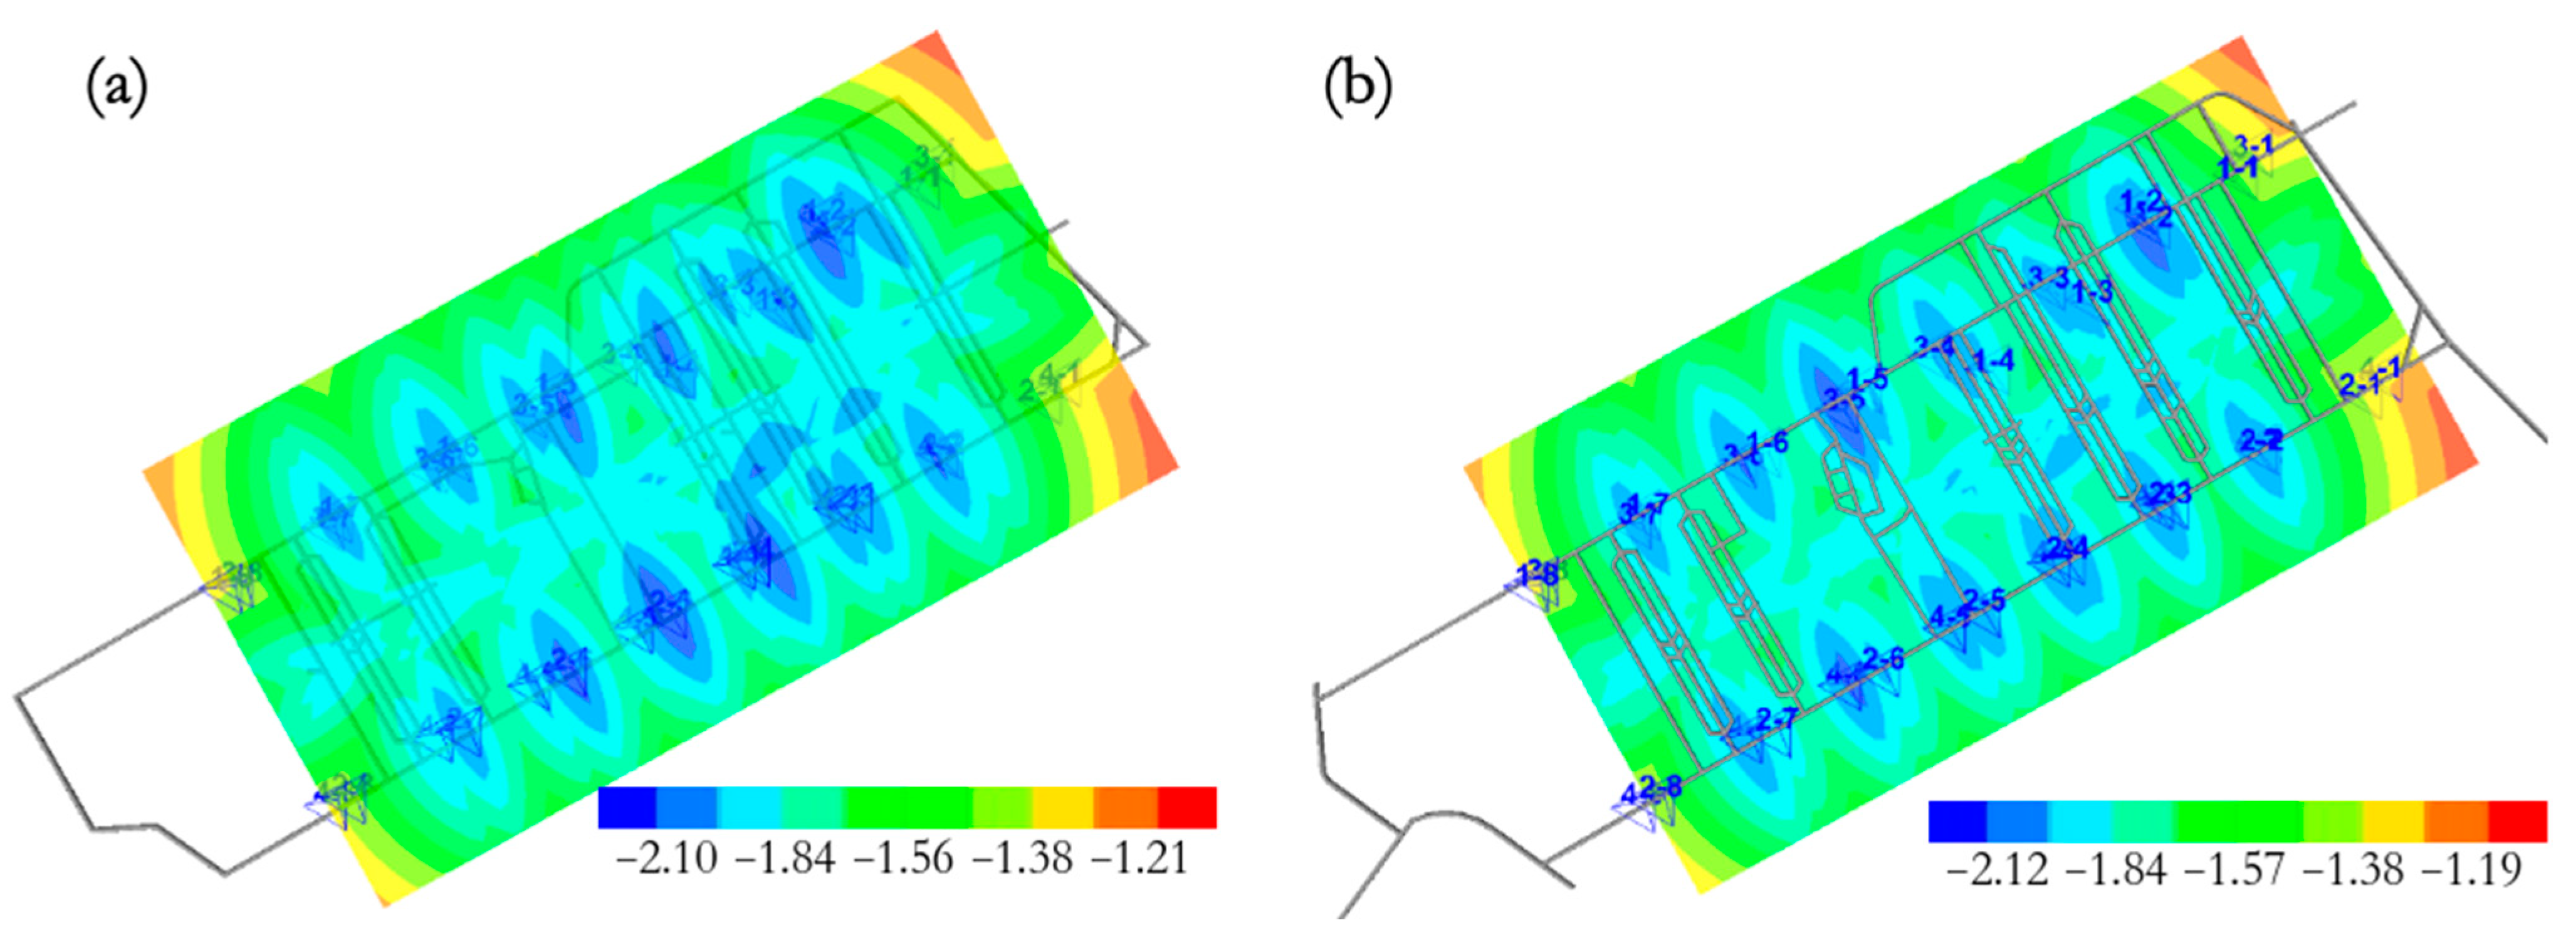
To evaluate the system’s horizontal monitoring capability, analyzing positioning error and magnitude accuracy from a top-down perspective is crucial. According to the distribution of plane positioning errors shown in Figure 11 (with color indicating error size), the system’s plane positioning errors at the −960 m and −1020 m ranges are controlled within ranges of 7.15–66.5 m and 6.91–69.28 m, respectively, indicating stable positioning performance in the plane direction. This directly verifies the applicability range of the optimal plane positioning error (6.75 m) obtained in the system debugging stage in the actual complex deep-well environment. The error distribution characteristics provide a key basis for optimizing the sensor plane layout. From the distribution map of magnitude recognition accuracy in Figure 12 (where colors represent moment magnitude), it can be seen that the magnitude ranges of events captured by the system at the −960 m and −1020 m intervals are −2.10~−1.21 and −2.12~−1.19, respectively. The color scale distribution in the figure is uniform, with no significant clustering of high or low values, indicating that the system has good consistency in identifying microseismic events across different energy levels throughout the entire monitoring plane. This not only quantifies the accuracy of the system’s magnitude calculation for microseismic events, which is highly consistent with the system’s designed capture capability (−2.14~−1.96), but also strongly confirms the overall reliability and accuracy of the monitoring results from a top-down perspective, meeting the core requirements for fine spatial warning and analysis of microseismic events in mines.
Figure 11.
Planar positioning error distribution maps for the −960 m and −1020 m levels. Color intensity indicates planar positioning error values (unit: meters), with error ranges as follows: (a) −960 m level, 7.15~66.50 m; (b) −1020 m level, 6.91~69.28 m. The color scale transitions from light (low error) to dark (high error).
Figure 12.
Magnitude identification accuracy distribution maps for the −960 m and −1020 m levels. Color represents the range of moment magnitudes (MW) of seismic events identified by the system: (a) −960 m level, −2.10~−1.21; (b) −1020 m level, −2.12~−1.19. The color scale corresponds to the magnitude size (higher numerical values indicate larger magnitudes).
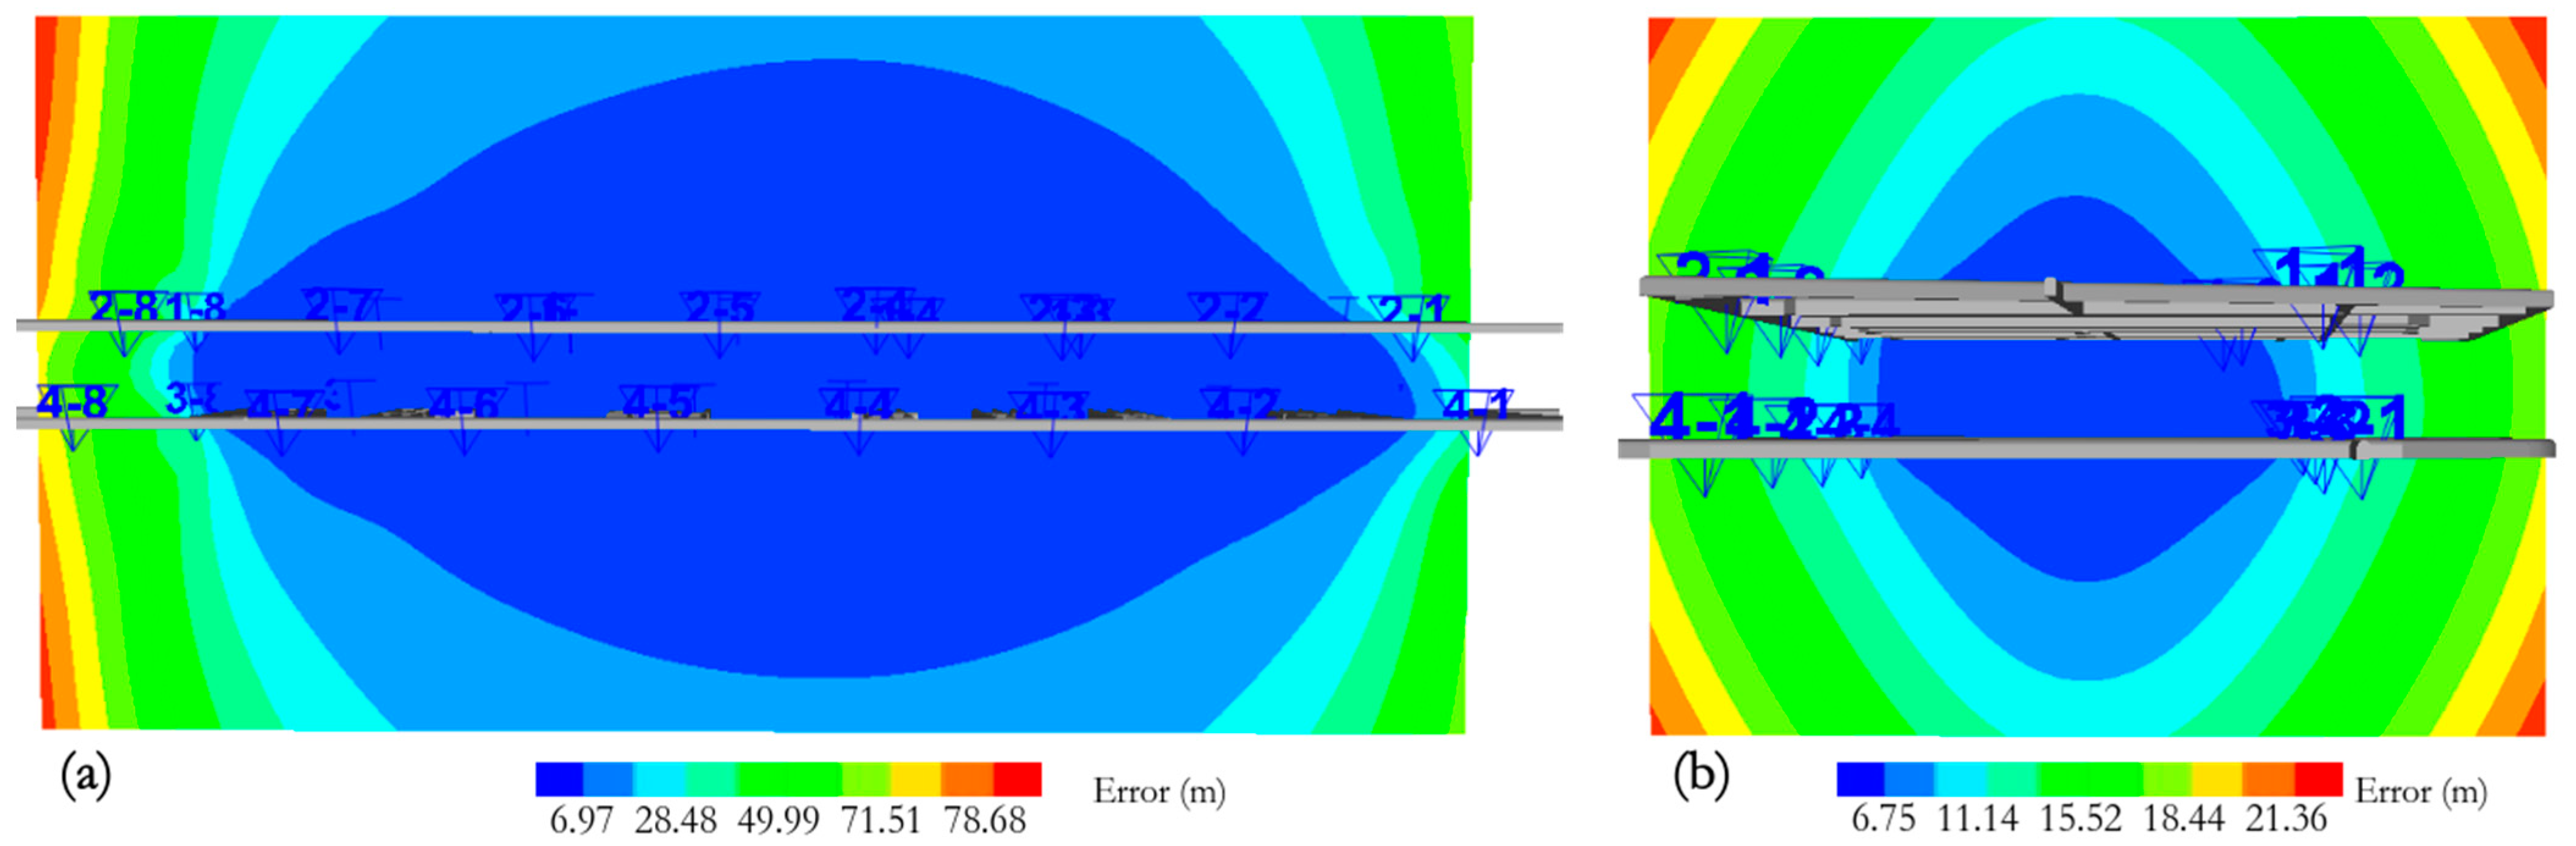
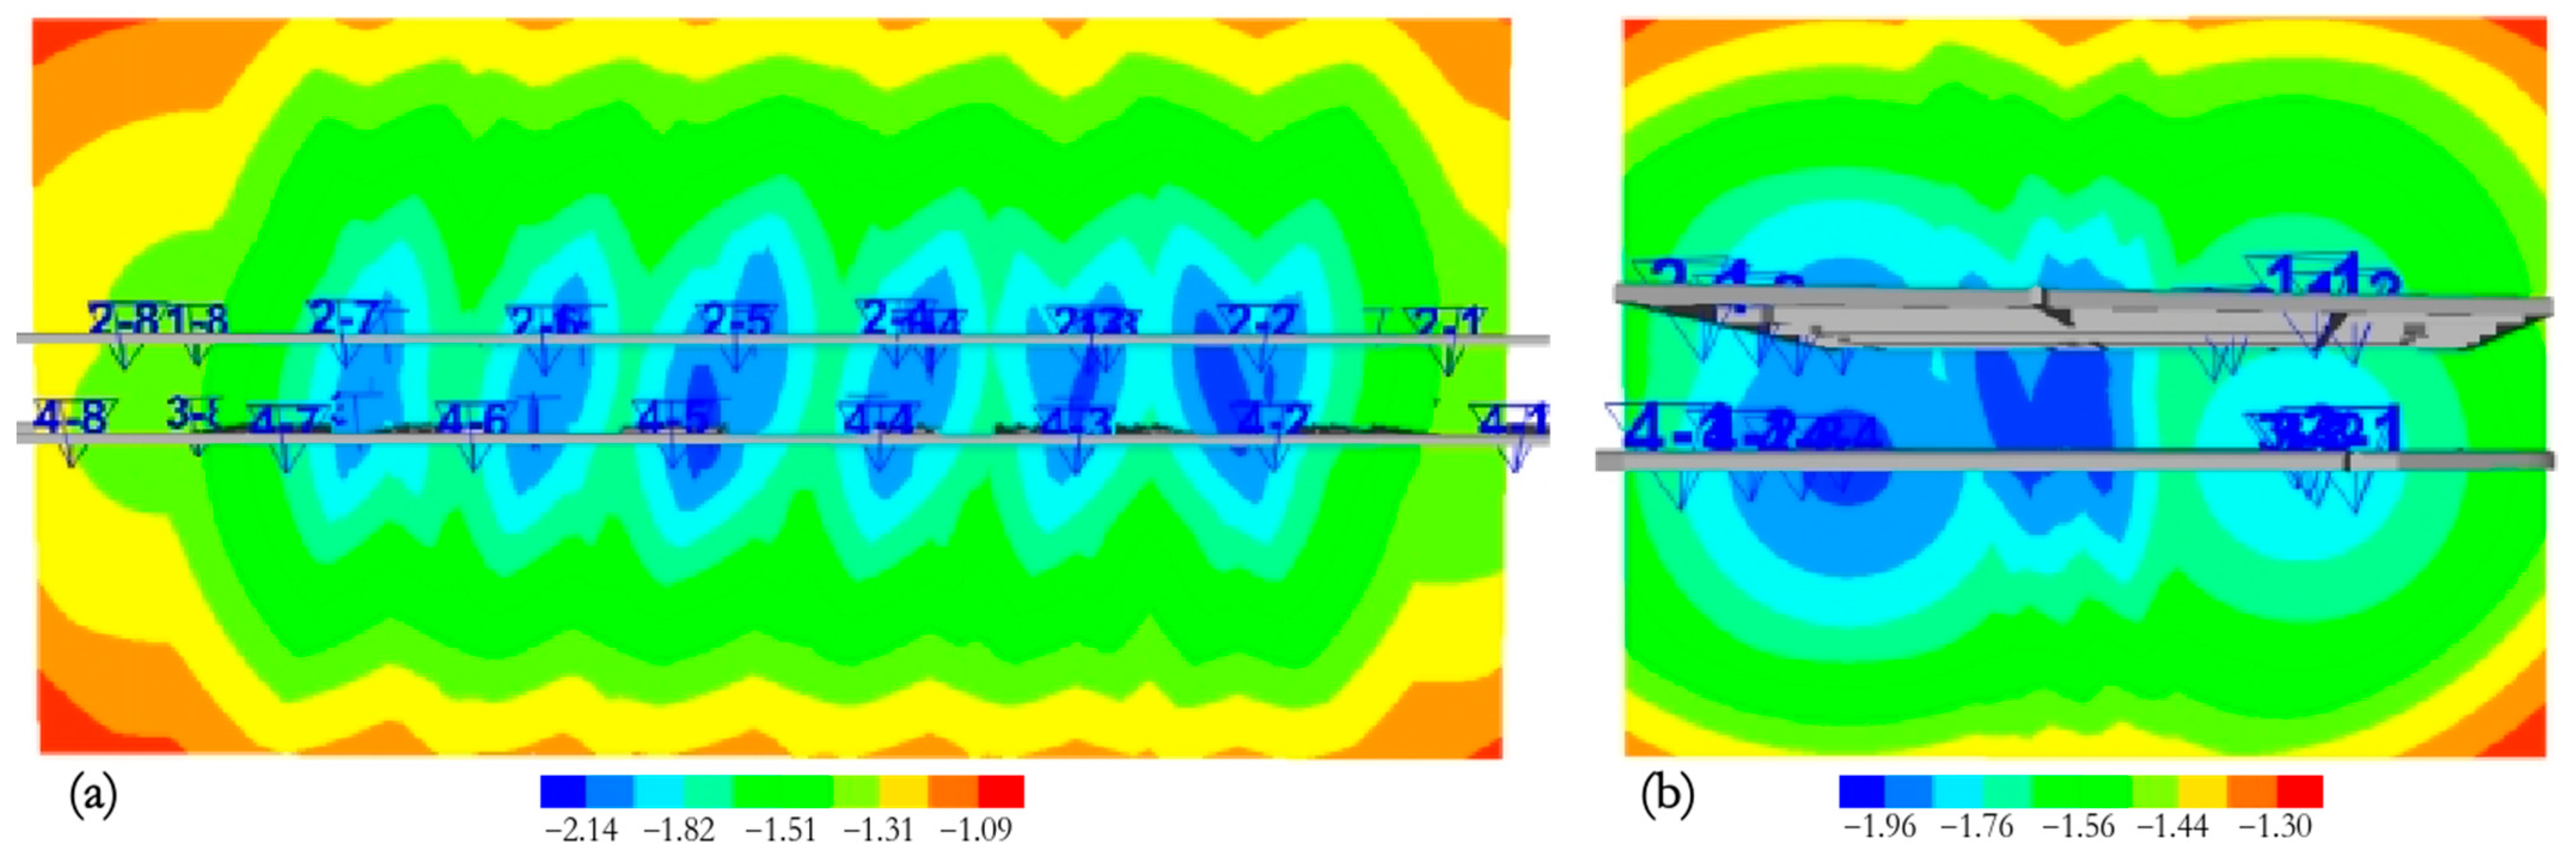
In the construction of the ultra-large-scale and ultra-deep-well microseismic monitoring system at the Sishanling Iron Mine, analyzing positioning error and magnitude accuracy from the profile direction can deeply reveal performance differences and system reliability in three-dimensional space, especially along different extension directions of the ore body. Figure 13 shows the spatial positioning error distribution along the vertical section of the ore body (corresponding to the error values of the color code/symbol size). By comparison, it can be seen that on the profile parallel to the direction of the ore body (Figure 13a), the error distribution range is relatively wide (6.97–78.68 m), with locally high-error areas (corresponding to the dark areas in the figure). On the section perpendicular to the direction of the ore body (Figure 13b), the error is significantly constrained within a lower and narrower range (6.75–21.36 m), with a more uniform distribution. This intuitively verifies that the sensor network has stronger spatial constraint capability and higher positioning stability in the dimension perpendicular to the direction of the ore body. This comparison clearly indicates that the sensor network has stronger constraint ability, better positioning accuracy, and greater stability on profiles perpendicular to the ore body direction. It directly confirms the feasibility of the globally optimal positioning accuracy (9.66 m) measured in the system debugging in a specific direction and provides a key basis for optimizing sensor deployment in the vertical direction. Figure 14 further reveals the characteristics of magnitude identification accuracy from the cross-sectional dimension. On the section parallel to the direction of the ore body (Figure 14a), the system records a wide range of earthquake magnitudes (−2.14~−1.09). On the section perpendicular to the direction of the ore body (Figure 14b), the range of magnitude identification is relatively concentrated (−1.98~−1.30). Based on the error analysis in Figure 13, this phenomenon may be related to the complexity of ray path coverage and wavefield propagation along different directions. However, the magnitude identification ranges in both directions fully cover the core monitoring capability range of the system design (−2.14~−1.96), ensuring the integrity and reliability of microseismic energy assessment from a profile perspective. This data not only fully covers the signal capture threshold of the system design (−2.14~−1.96) but also demonstrates that the accuracy ranges in both directions exceed or meet the design specifications. It strongly confirms the accuracy of the system’s energy assessment of microseismic events from the profile dimension, meeting the core requirement for comprehensive and highly reliable monitoring of microseismic activity in deep mines.
Figure 13.
Spatial positioning error distribution along profiles parallel and perpendicular to the ore body strike. (a) Profile parallel to the ore body strike, with an error range of 6.97~78.68 m; (b) Profile perpendicular to the ore body strike, with an error range of 6.75~21.36 m. Color bars or symbol sizes in the figure indicate spatial positioning error values (unit: meters).
Figure 14.
Magnitude identification accuracy distribution along profiles parallel and perpendicular to the ore body strike. (a) Profile parallel to the ore body strike, with a magnitude identification range of −2.14~−1.09; (b) Profile perpendicular to the ore body strike, with a magnitude identification range of −1.98~−1.30. Colors or symbols in the figure represent magnitude size.
4.3. Warning Cases and Effect Analysis
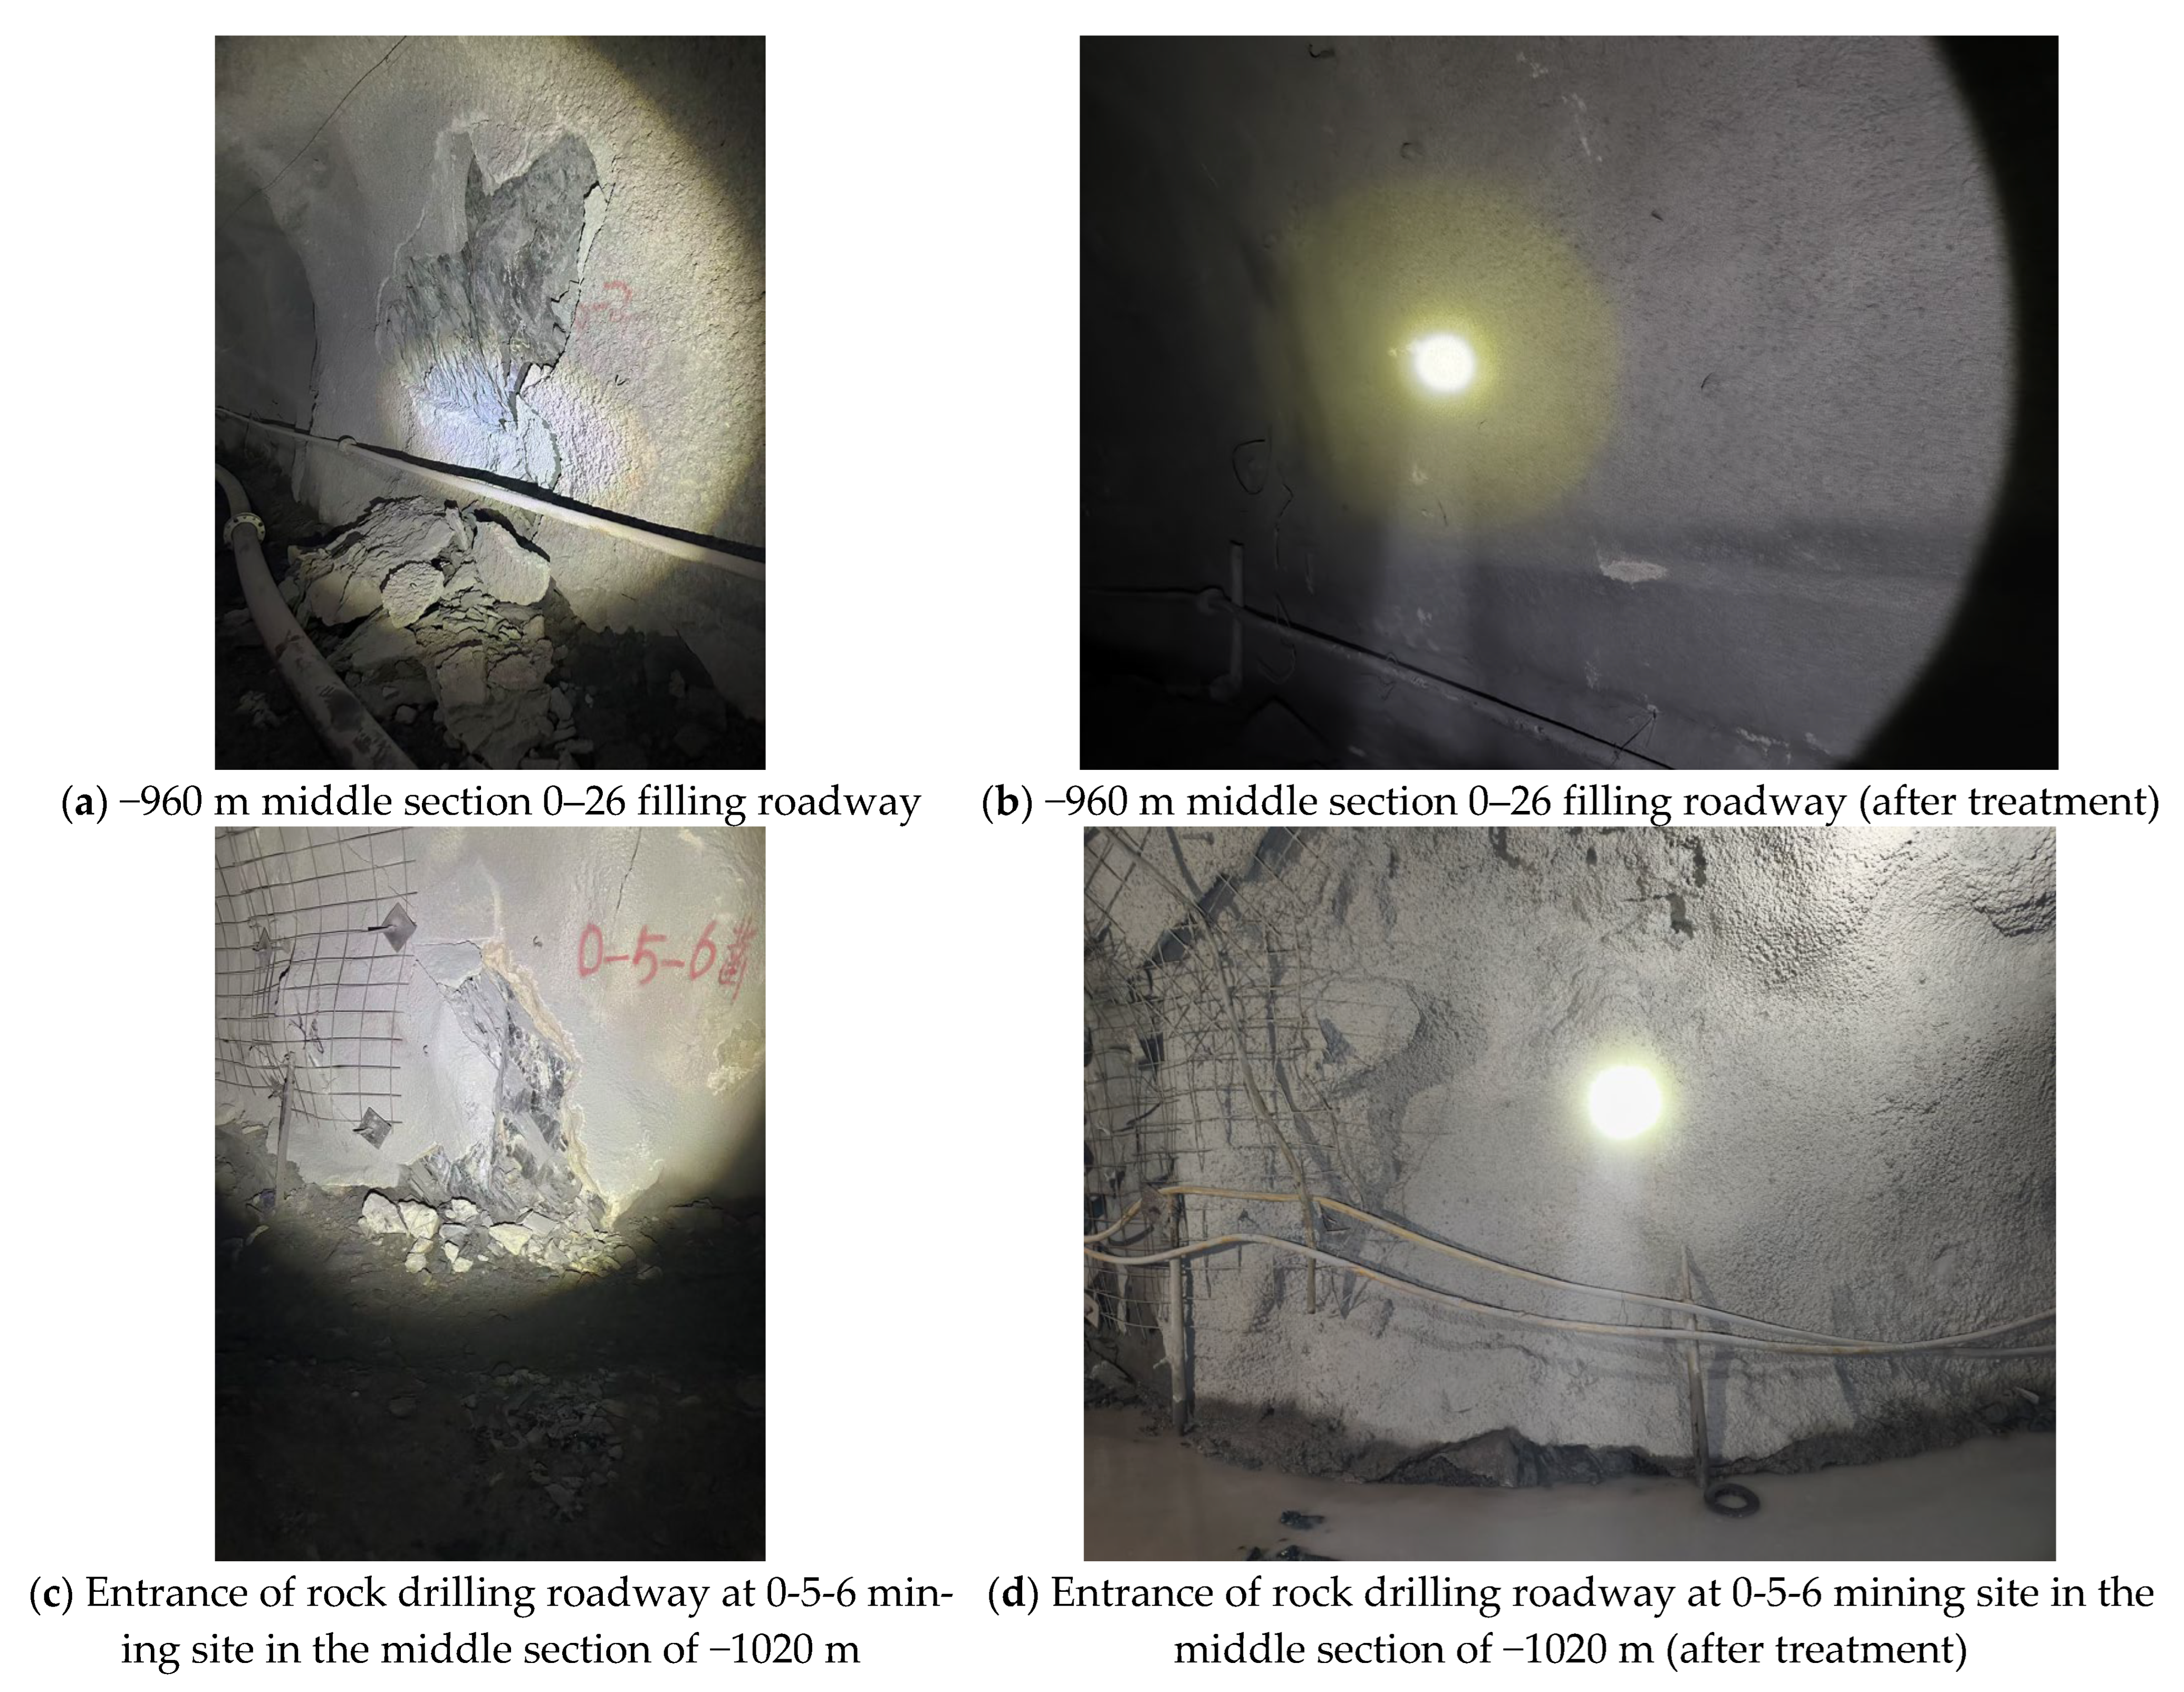
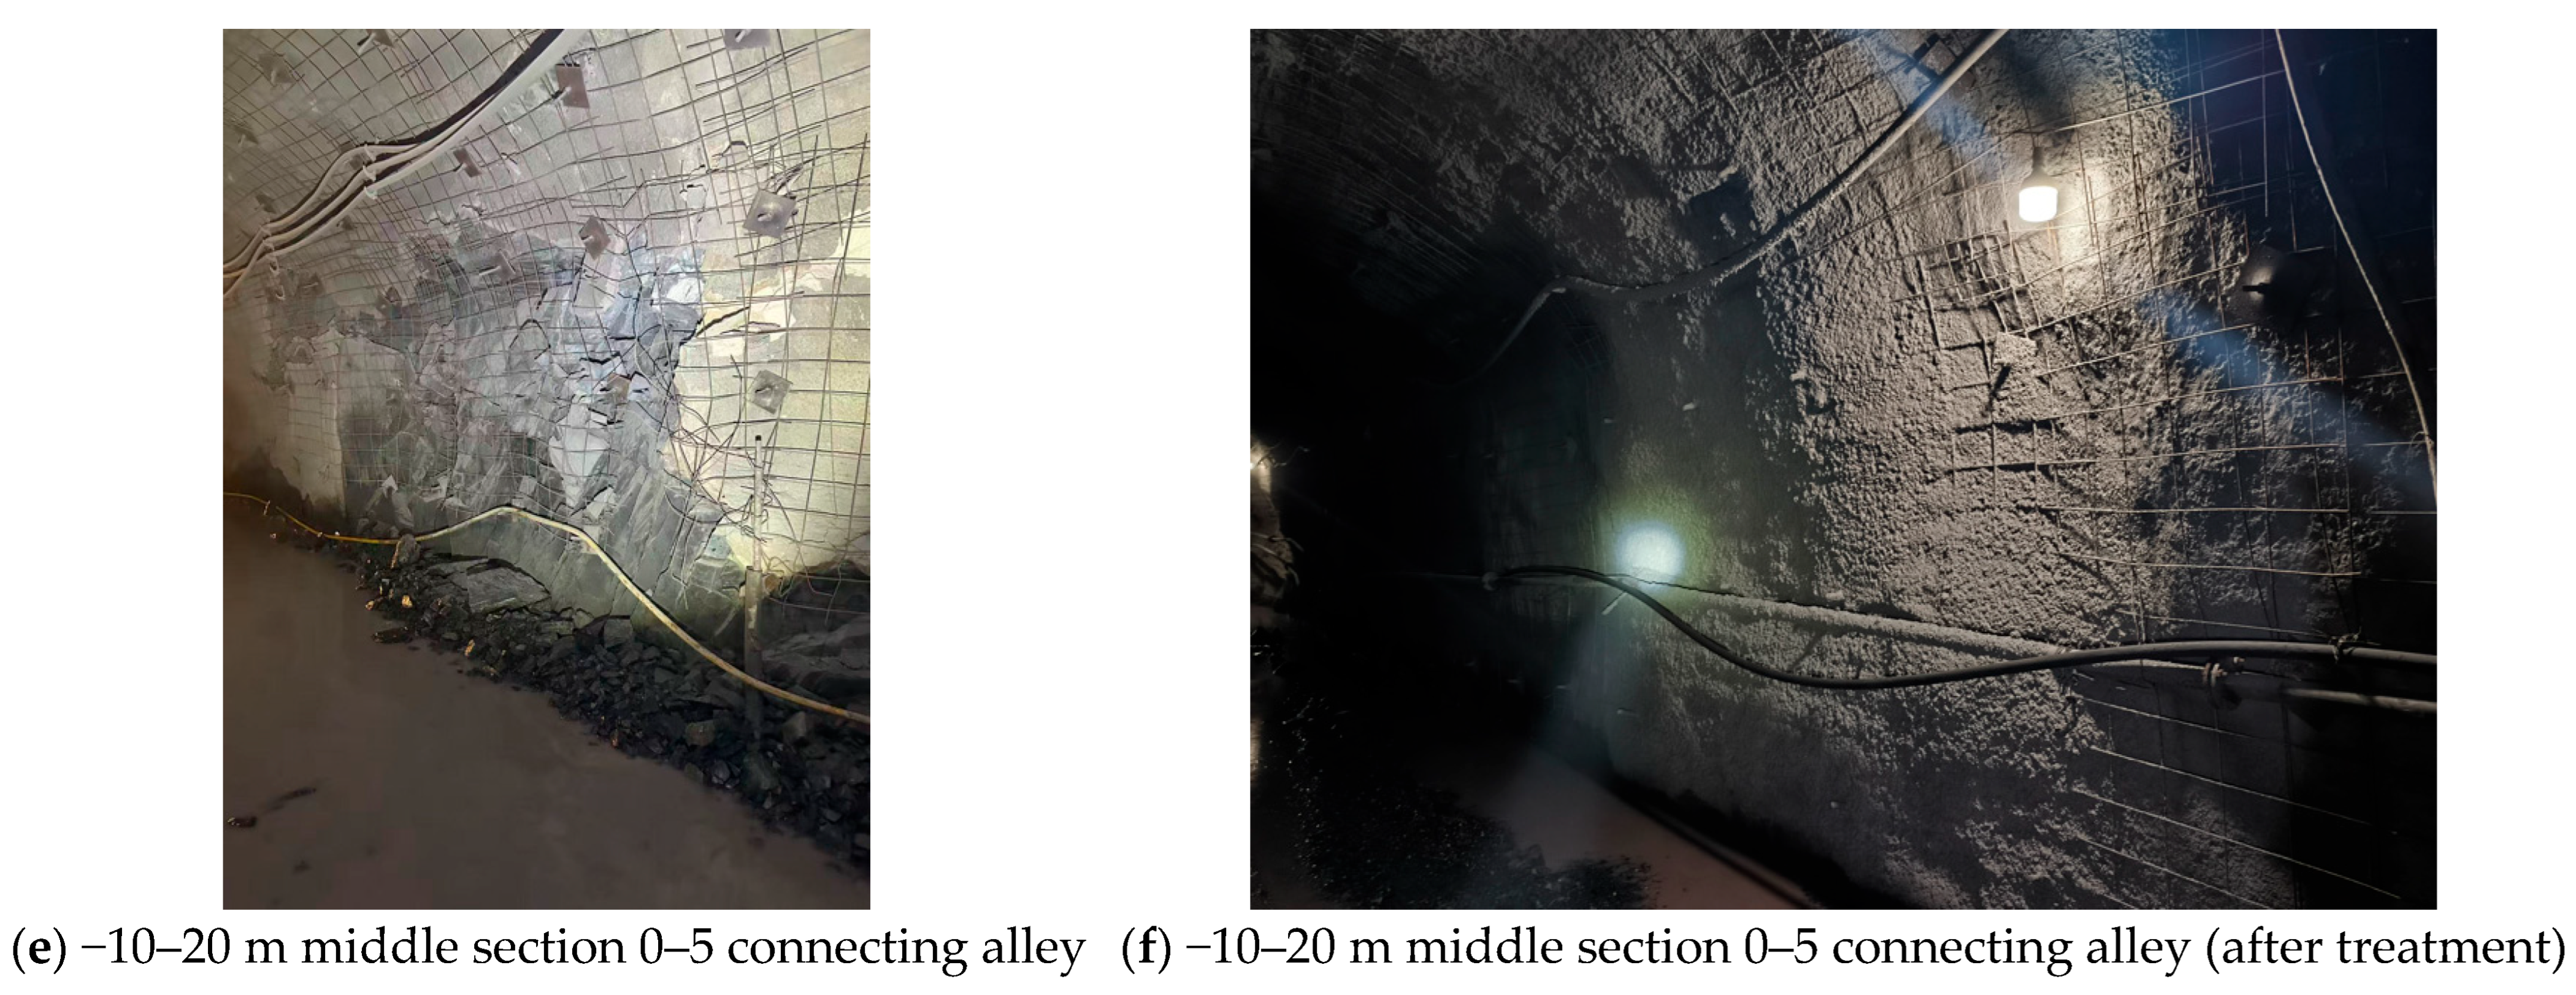
In order to effectively apply the microseismic system to the actual production of mines, evaluate the stability of surrounding rocks, and predict potential geological hazards, the ultra-large-scale deep-well microseismic monitoring system constructed in this study was tested locally in multiple key areas after being put into operation at the Sishanling Iron Mine, forming specific warning cases and effect analysis. The system successfully captured multiple typical microseismic signals of rock burst precursors and initiated complete warning responses. As shown in Figure 15, these cases clearly demonstrate the system’s ability to issue timely warnings before disasters occur at different locations (such as the 0–26 filling roadway in the −960 m section, the 0-5-6 rock drilling roadway entrance in the −1020 m section, and the 0–5 roadway in the −1020 m section) (Figure 15a,c,e).
Figure 15.
Early warning cases and their effectiveness analysis.
Specifically, in the 0–26 filling roadway case in the −960 m middle section, the system identified a total of eight microseismic events with energy ranges of −1.8 to −1.5 within twenty-four consecutive hours, triggering a yellow warning signal. The response time from the initial identification of abnormal signals to the release of warning information to on-site management was 12 min. After the mine quickly took targeted measures based on the warning information (such as strengthening support and adjusting mining sequence), the surrounding rock conditions at the same location (Figure 15b,d,f) improved significantly, and stability was significantly enhanced. In the following 72 h, only two low-energy (<−2.0) microseismic events were recorded in the area.
These case studies demonstrate that the system can effectively identify potential risks, and its warning mechanism has won valuable time for engineering intervention (with an average warning lead time of about 6 h), significantly reducing the risk of accidents and potential casualties caused by disasters such as rock bursts, reducing production interruption time caused by disaster investigation and repair, directly ensuring the continuity and safety of deep mining operations, and fully reflecting the substantial technical support and practical value provided by this study for mine safety production.
5. Discussion
5.1. Major Breakthrough Achievements
This study successfully constructed and validated a microseismic monitoring system suitable for “double super” mines. Its core breakthrough lies in achieving high-precision and real-time monitoring in extreme environments of ultra-large-scale (mining field length > 1.3 km) and ultra-deep mining (depth > 1.5 km). Traditional microseismic systems face challenges such as fast signal attenuation, large positioning errors, and multiple monitoring blind spots in such scenarios. The innovative solutions of this study are as follows: (1) proposing a dynamic sensor deployment strategy of “key monitoring, overall and local fusion”, which effectively overcomes the limitations of single-level monitoring by deploying a double-layer sensor network in the key roadway between −960 m and −1020 m, thereby achieving three-dimensional constraints on the target mining area (see Figure 8 and Table 1); (2) establishing a multi-level data processing framework that integrates high-precision positioning algorithms with intelligent seismic phase recognition technology. The optimal spatial positioning error of the system is controlled within 9.66 m, the planar positioning error reaches 6.75 m, and the seismic magnitude recognition accuracy is stable between −2.14 and −1.96, which is significantly better than the performance of conventional systems in complex deep environments. It is particularly important that the system has successfully warned of rock burst risks and guided engineering interventions multiple times in practical applications at the Sishanling Iron Mine (see Section 4.3), proving its ability to transform from “theoretically feasible” to “engineering usable” and providing a direct reference for safe and efficient mining in similar “double super” mines.
5.2. Research Limitations and Future Prospects
Although substantial progress has been made in this study, there are still several limitations that need to be improved in future work. Firstly, performance verification of the system is currently focused only on specific middle sections (−960 m and −1020 m) and specific mining periods at the Sishanling Iron Mine. As mining progresses deeper (such as below −1200 m), the stress conditions and geological structures of the rock mass may become more complex, and the existing sensor network layout and velocity model may need to be dynamically adjusted and recalibrated. Secondly, the analysis of microseismic signals in research mainly focuses on localization and energy assessment, while in-depth inversion of source mechanisms (such as rupture type and stress drop) and disaster probability prediction models based on temporal evolution are still insufficient, which limits the improvement in early warning systems from “qualitative trend” to “quantitative probability”.
To overcome the above limitations, future research can be carried out in the following three aspects. Firstly, developing adaptive sensor network optimization algorithms by combining mining progress with microseismic activity, thereby achieving dynamic and intelligent expansion and reconstruction of monitoring networks in order to continuously maintain optimal monitoring efficiency. Secondly, by deeply integrating multi-source data and coupling microseismic data with ground stress measurements, drilling imaging, and numerical simulation results of mining-induced stress, an integrated disaster mechanism model of “geology–mining response” can be constructed to enhance the scientific rigor and predictability of early warning. Thirdly, an intelligent warning paradigm based on machine learning should be explored, utilizing long-term accumulated microseismic time series big data to train intelligent models that can identify precursor patterns and predict the spatiotemporal evolution of risks, ultimately forming an intelligent rock burst prevention and control system for mines with self-learning and adaptive capabilities.
6. Conclusions
- (1)
- In response to the characteristics of “double super” mines, this study has developed a highly adaptable microseismic monitoring system as a whole solution. A complete system covering a 32-channel sensor network, a four-level data transmission architecture, and a multi-level data processing framework was designed and implemented for the special conditions of ultra-large-scale (1370 m in length) and ultra-deep-wells (mining depth exceeding 1500 m) at the Sishanling Iron Mine. Its monitoring topology structure and network layout method have, for the first time, achieved full-coverage monitoring of key mining areas under the coupled conditions of kilometer-level deep and large-scale mining sites, providing a direct engineering reference for similar “double super” mines.
- (2)
- Through on-site debugging and verification, the core performance indicators of the system met the requirements for high-precision warning. In applications at the Sishanling Iron Mine, the system effectively identifies microseismic events with magnitudes ranging from −2.14 to −1.96. Under optimal conditions, the overall spatial positioning error reaches 9.66 m, and the planar positioning error reaches 6.75 m. These key performance indicators are superior to conventional systems in the industry, providing a reliable data foundation for quantitative and accurate early warning of disasters such as rock bursts.
- (3)
- The innovation of this system is mainly reflected in the optimized sensor deployment strategy and intelligent data processing methods for ultra-deep and complex environments. In response to the challenges of rapid signal attenuation and high positioning requirements in “double super” mining, this study proposes a sensor dynamic deployment principle of “key monitoring, overall and local fusion”, as well as a data processing framework based on high-precision algorithms. This effectively solves common problems such as multiple blind monitoring areas and difficult signal recognition under complex geological conditions, significantly improving monitoring reliability and the timeliness of early warning. This is the key innovation that distinguishes it from conventional monitoring systems.
- (4)
- The practical value of the system has been successfully validated through on-site warning cases. In the practical application of the system at the −960 m and −1020 m sections, it has successfully issued multiple warnings of rock burst risks and guided mines to take effective measures for prevention and control, proving that it not only meets regulatory requirements but also directly serves production safety, ensures the continuity and efficiency of deep mining operations, and has significant prospects for technological transformation and promotion.
Author Contributions
X.W.: Writing—Original Draft, Data, and Project Administration. C.Z.: Conceptualization, Methodology, Investigation, Writing—Original Draft, Data, Software, Visualization, and Project Administration. All authors have read and agreed to the published version of the manuscript.
Funding
The authors would like to acknowledge National Natural Science Foundation of China (Grant Number 52274249, 52334003, U24B2045), and the Fundamental Research Funds for the Central Universities (FRF-AT-25-012).
Data Availability Statement
The original contributions presented in this study are included in the article. Further inquiries can be directed to the corresponding author.
Conflicts of Interest
Author Xiaodong Wang was employed by the company Benxi Longxin Mining Co., Ltd. The remaining author declares that the research was conducted in the absence of any commercial or financial relationships that could be construed as potential conflicts of interest.
References
- Islam, M.S.; Islam, M.M.; Rehman, A.U.; Alam, M.F.; Tarique, M. Mineral production amidst the economy of uncertainty: Response of metallic and non-metallic minerals to geopolitical turmoil in Saudi Arabia. Resour. Policy 2024, 90, 104824. [Google Scholar] [CrossRef] [Scilit]
- Douce, A.E.P. Metallic Mineral Resources in the Twenty-First Century. I. Historical Extraction Trends and Expected Demand. Nat. Resour. Res. 2016, 25, 71–90. [Google Scholar] [CrossRef] [Scilit]
- Wang, C.A.; Li, X. Optimizing the utilization of mineral assets and human resources for enhanced social welfare and sustainable development. Resour. Policy 2024, 90, 104755. [Google Scholar] [CrossRef] [Scilit]
- Xu, J.; Liu, C.J.; Dou, G.; Cai, Y.F. Mineral resource management in Chinese rural areas: Policy assessment for green economic growth. Resour. Policy 2024, 90, 104815. [Google Scholar] [CrossRef] [Scilit]
- Sun, W.Q.; Shao, M.Q.; Yang, D.Q. Role of essential minerals in achieving low-carbon economy and sustainability. Resour. Policy 2024, 90, 104716. [Google Scholar] [CrossRef] [Scilit]
- Kirwin, D.J. Metallic Mineral Resources: The Critical Components for a Sustainable Earth. Ore Geol. Rev. 2025, 180, 106578. [Google Scholar] [CrossRef] [Scilit]
- Ponomarenko, T.; Nevskaya, M.; Jonek-Kowalska, I. Mineral Resource Depletion Assessment: Alternatives, Problems, Results. Sustainability 2021, 13, 862. [Google Scholar] [CrossRef] [Scilit]
- Northey, S.A.; Mudd, G.M.; Werner, T.T. Unresolved Complexity in Assessments of Mineral Resource Depletion and Availability. Nat. Resour. Res. 2018, 27, 241–255. [Google Scholar] [CrossRef] [Scilit]
- Wang, S.; Yang, L.H. Mineral resource extraction and resource sustainability: Policy initiatives for agriculture, economy, energy, and the environment. Resour. Policy 2024, 89, 104657. [Google Scholar] [CrossRef] [Scilit]
- Xiong, Y.Y.; Guo, H.X.; Nor, D.D.M.M.; Song, A.D.; Dai, L. Mineral resources depletion, environmental degradation, and exploitation of natural resources: COVID-19 aftereffects. Resour. Policy 2023, 85, 103907. [Google Scholar] [CrossRef] [Scilit]
- Zuo, Z.L.; Cheng, J.H.; Guo, H.X.; Li, Y.L. Knowledge mapping of research on strategic mineral resource security: A visual analysis using CiteSpace. Resour. Policy 2021, 74, 102372. [Google Scholar] [CrossRef] [Scilit]
- Liu, J.F.; Shen, F.; Zhang, J.R. Economic and environmental effects of mineral resource exploitation: Evidence from China. Resour. Policy 2023, 86, 104063. [Google Scholar] [CrossRef] [Scilit]
- Zhai, M.G.; Hu, R.Z.; Wang, Y.; Jiang, S.Y.; Wang, R.C.; Li, J.W.; Chen, H.Y.; Yang, Z.M.; Lü, Q.T.; Qi, T.; et al. Mineral Resource Science in China: Review and perspective. Geogr. Sustain. 2021, 2, 107–114. [Google Scholar] [CrossRef] [Scilit]
- Zou, B.P.; Pei, C.H.; Chen, Q.Z.; Deng, Y.S.; Chen, Y.G.; Long, X. Progress on Multi-Field Coupling Simulation Methods in Deep Strata Rock Breaking Analysis. CMES-Comput. Model. Eng. Sci. 2025, 142, 2457. [Google Scholar] [CrossRef] [Scilit]
- Wang, J.; Dai, F.; Yan, Z.L.; Pang, Y.Y.; Wei, M.D. Dynamic response of sandstone under hydro-mechanical coupling: Macroscopic behavior and microscopic mechanism. Int. J. Rock Mech. Min. Sci. 2026, 197, 106342. [Google Scholar] [CrossRef] [Scilit]
- Soares, A.; Nunes, R.; Salvadoretti, P.; Costa, J.F.; Martins, T.; Santos, M.; Azevedo, L. Pore Pressure Uncertainty Characterization Coupling Machine Learning and Geostatistical Modelling. Math. Geosci. 2024, 56, 691–709. [Google Scholar] [CrossRef] [Scilit]
- Ding, Z.; Feng, X.J.; Wang, E.Y.; Yue, W.T.; Cao, Z.W. Failure mechanisms of fault fracture zone under dynamic loading. Eng. Fail. Anal. 2026, 183, 110324. [Google Scholar] [CrossRef] [Scilit]
- Peng, C.; Liu, W.R.; Liu, M.; Wang, X.; Du, X.T. Rockburst multi-factor coupling prediction and quantitative analysis of influencing Factors’ SHAP values based on TPE-FDM-XGBoost model. Ain Shams Eng. J. 2026, 17, 103859. [Google Scholar] [CrossRef] [Scilit]
- Shen, W.; Dou, L.M.; He, H.; Zhu, G.A. Rock burst assessment in multi-seam mining: A case study. Arab. J. Geosci. 2017, 10, 196. [Google Scholar] [CrossRef] [Scilit]
- Yan, B.Q.; Qi, Q.J.; Hou, M.Y.; Wu, X.; Cui, D.W.; Liu, J.Z. Research Review on Water Inrush Mechanism and Failure Criterion of Rock Mass in Deep Mines. Geotech. Geol. Eng. 2024, 42, 1573–1592. [Google Scholar] [CrossRef] [Scilit]
- Dong, L.J.; Yan, X.H.; Wang, J.C.; Tang, Z.; Wang, H.W.; Wu, W.T. Case study on pre-warning and protective measures against rockbursts utilizing the microseismic method in deep underground mining. J. Appl. Geophys. 2025, 237, 105687. [Google Scholar] [CrossRef] [Scilit]
- Liu, J.P.; Xu, S.D.; Li, Y.H.; Lei, G. Analysis of Rock Mass Stability Based on Mining-Induced Seismicity: A Case Study at the Hongtoushan Copper Mine in China. Rock Mech. Rock Eng. 2019, 52, 265–276. [Google Scholar] [CrossRef] [Scilit]
- Wang, S.; Wang, K.D.; Zhao, Z.G.; Miao, Y.Y.; Cai, T.Y. Research on coal mine pressure characteristics based on all-fiber optic micro-seismic monitoring. Front. Earth Sci. 2025, 13, 1549906. [Google Scholar] [CrossRef] [Scilit]
- Chen, Y.C.; Dong, L.J.; Adinolfi, G.M.; Guo, J.; Zhang, Y.H.; Vinciguerra, S. Acoustic emission and wave velocity monitoring of rock-backfill composites: Damage identification and failure characterization. Measurement 2025, 256, 118247. [Google Scholar] [CrossRef] [Scilit]
- Rui, Y.C.; Chen, J.; Pu, Y.Y.; Du, X.M. An innovative analytical solution of AE/MS source location with singular value decomposition and weight estimation. Measurement 2025, 253, 117652. [Google Scholar] [CrossRef] [Scilit]
- Zhang, Y.H.; Yang, L.B.; Dong, L.J.; Wang, J.C.; Hu, Q.C.; Pei, Z.W.; Hermans, T. Microseismic/acoustic emission sources localization method using improved search algorithm for multiple media and irregular complex structures. Measurement 2025, 249, 117034. [Google Scholar] [CrossRef] [Scilit]
- Choi, W.; Pyun, S.; Cheon, D.S. Automatic microseismic signal classification for mining safety monitoring using the WaveNet classifier. Geophys. Prospect. 2024, 72, 315–332. [Google Scholar] [CrossRef] [Scilit]
- Dong, L.J.; Tang, Z.; Li, X.B.; Chen, Y.C.; Xue, J.C. Discrimination of mining microseismic events and blasts using convolutional neural networks and original waveform. J. Cent. South Univ. 2020, 27, 3078–3089. [Google Scholar] [CrossRef] [Scilit]
- Loginov, G.N.; Yaskevich, S.V.; Duchkov, A.A.; Serdyukov, A.S. Joint Processing of Surface and Underground Microseismic Monitoring Data in Hard Mineral Mining. J. Min. Sci. 2015, 51, 944–950. [Google Scholar] [CrossRef] [Scilit]
- Zhao, C.C.; Song, D.Z.; Zhou, Z.L. Research on fractal dimension warning of microseismic spatiotemporal data for rock mass failure. J. Appl. Geophys. 2025, 242, 105898. [Google Scholar] [CrossRef] [Scilit]
- Zhao, C.C.; Zhou, Z.L.; Song, D.Z. Fractal interpretation and forewarning of mining area disasters via microseismic time-space-energy nested. Phys. Chem. Earth 2025, 139, 103905. [Google Scholar] [CrossRef] [Scilit]
- Zhou, Z.L.; Zhao, C.C.; Cai, X.; Huang, Y.H. Three-dimensional modeling and analysis of fractal characteristics of rupture source combined acoustic emission and fractal theory. Chaos Solitons Fractals 2022, 160, 112308. [Google Scholar] [CrossRef] [Scilit]
- Wang, J.; Zuo, Y.J.; Dong, L.J.; Yan, X.H. Spatiotemporal clustering of microseismic signals in mining areas: A case study of the Baoji lead-zinc mine in Shaanxi, China. Eng. Geol. 2025, 352, 108057. [Google Scholar] [CrossRef] [Scilit]
- Mao, Q.H.; Wang, P.; Azeem, T. Microseismic event location using an improved global grid search and its extended method in a downhole monitoring system. J. Geophys. Eng. 2019, 16, 159–174. [Google Scholar] [CrossRef] [Scilit]
- Shu, G.X.; Meng, X.H.; Shu, M.C.; Mu, S.Q.; Huo, S.D. Compressive Sensing-Based Spectral Inversion Algorithm and Its Application in Detailed Fault Characterization. Chem. Technol. Fuels Oils 2025, 61, 55–65. [Google Scholar] [CrossRef] [Scilit]
- Li, Z.B.; Qiao, D.P.; Yang, T.Y.; Wang, J.; Chen, H. Event recognition technology and short-term rockburst early warning model based on microseismic monitoring and ensemble learning. Sci. Rep. 2025, 15, 18674. [Google Scholar] [CrossRef] [Scilit]
- Ma, T.H.; Duan, Y.L.; Duan, W.S.; Wang, H.Q.; Tang, C.; Wang, K.K.; Cheng, G.W. Research on Intelligent Early Warning System and Cloud Platform for Rockburst Monitoring. Appl. Sci. 2025, 15, 11098. [Google Scholar] [CrossRef] [Scilit]
- Zhang, S.; Dong, L.J.; Yang, L.B.; Huang, Z.X.; Sun, D.Y.; Xiao, J.Q. Spatiotemporal damage evolution in thermo-mechanically coupled rock using acoustic emission. Int. J. Mech. Sci. 2025, 307, 110893. [Google Scholar] [CrossRef] [Scilit]
- Duan, Y.; Si, G.Y.; Canbulat, I.; Luo, X. Temporal-spatial characterization of mining-induced seismicity in the vicinity of a dyke—A case study. Eng. Geol. 2022, 307, 106788. [Google Scholar] [CrossRef] [Scilit]
- Khan, M.; He, X.Q.; Farid, A.; Song, D.Z.; Li, Z.L.; Tian, X.H.; Ni, M.Q. A novel geophysical method for fractures mapping and risk zones identification in a coalmine, Northeast, China. Energy Rep. 2021, 7, 3785–3804. [Google Scholar] [CrossRef] [Scilit]
- Gou, R.T.; Song, D.Z.; He, X.Q.; Zhang, J.G.; Guo, M.G.; He, S.Q.; Li, Z.L.; Yang, G.; Qiu, L.M. Microseismic response characteristics and stress anomaly zoning in deep outburst-prone coal seams with multi-concealed structures: A case study. J. Appl. Geophys. 2025, 242, 105932. [Google Scholar] [CrossRef] [Scilit]
Disclaimer/Publisher’s Note: The statements, opinions and data contained in all publications are solely those of the individual author(s) and contributor(s) and not of MDPI and/or the editor(s). MDPI and/or the editor(s) disclaim responsibility for any injury to people or property resulting from any ideas, methods, instructions or products referred to in the content. |
© 2026 by the authors. Licensee MDPI, Basel, Switzerland. This article is an open access article distributed under the terms and conditions of the Creative Commons Attribution (CC BY) license.