Article

Method for Monitoring the Condition of Steel Wire Ropes Based on the Analysis of Changes in the Linear Dimensions of Their Cross-Sections

by
Aleksandr Kulchitskiy
and
Mikhail Nikolaev
*
Faculty of Mineral Processing, Department of Automation of Technological Processes and Production, Empress Catherine II Saint Petersburg Mining University, 199106 St. Petersburg, Russia
*
Author to whom correspondence should be addressed.
Mining 2025, 5(4), 79; https://doi.org/10.3390/mining5040079 (registering DOI)
Submission received: 30 September 2025 / Revised: 6 November 2025 / Accepted: 18 November 2025 / Published: 22 November 2025

Abstract

Reliable detection of defects in steel wire ropes is pivotal to ensuring safety and maintaining operational reliability of hoisting and lifting systems in mining and other industries. This study proposes an automated monitoring method based on analyzing the cross-sectional size profile extracted from high-quality visual images. Each image undergoes preprocessing—adaptive binarization, noise suppression, and edge extraction—followed by formation of a one-dimensional thickness profile along the rope’s longitudinal axis. Aggregate statistical descriptors (mean, standard deviation, extrema, and shape descriptors) computed from this profile are supplied to a CatBoost gradient boosting classifier. The model achieves an F1-score exceeding 0.93 across diagnostic categories (intact, bend, kink, break), with particularly high accuracy for critical damage such as wire breaks. Compared with conventional image CNN classifiers, the proposed approach offers higher interpretability, lower computational complexity, and robustness to noise and visual artifacts. The results substantiate the method’s efficacy for real-time automated condition monitoring of mining equipment and its suitability for integration into industrial machine-vision systems. The results substantiate the method’s efficacy for real-time automated condition monitoring of mining equipment and its suitability for integration into industrial machine-vision systems.

Graphical Abstract

1. Introduction

In the mining industry, steel hoisting ropes are vital components: they are used in mine hoists, cage systems, and aerial ropeways to transport ore and personnel. Intensive cyclic loading, aggressive environments, and limited opportunities for visual inspection result in high risks of hidden damage and fatigue failure.
According to a nondestructive testing (NDT) Technology report, between 1999 and 2013 failures of steel ropes led to more than 60 fatalities and over 65 injuries across various sectors—including mine hoists, lifting devices, and ropeways.
In addition to the human toll, untimely rope diagnostics cause enormous material losses; for example, failures of large-diameter steel ropes have resulted in multi-million-dollar damages: USD 116 million for the break on the Petronius platform (1998) and USD 55 million for the incident in the Roncador Field (2014).
The social consequences include fatal incidents, injuries, operational downtime, litigation, and loss of reputation for companies and entire industries.
Over prolonged service, ropes are subject to wear, fatigue damage, corrosion, and local plastic deformation, which can ultimately lead to wire breaks. If such defects are not detected in a timely manner, they pose serious safety hazards, cause unplanned equipment outages, and lead to significant financial losses.
In mine hoists and shaft conveyances, regulatory acceptance, asset availability, and personnel safety depend on timely wire rope condition assessment under harsh conditions—abrasive dust, moisture, and variable illumination—while the wire rope is in motion. The monitoring approach investigated here is specified for these constraints: it supports continuous imaging of moving ropes, robust geometry-based feature extraction under illumination fluctuations, and rapid decision outputs that can be used directly by hoist control and maintenance planning teams. By mapping detected anomalies to mining-relevant severity categories and permissible wear limits, the method delivers actionable information rather than generic image scores, thereby aligning with the operational reality of mines and the needs of mine engineers.
Traditional rope inspection relies predominantly on manual visual examination, which has several limitations: high subjectivity, low diagnostic throughput, and strong dependence on the inspector’s experience. To overcome these drawbacks, automated machine-vision systems are increasingly being adopted for contactless condition monitoring. Such systems employ digital image processing to detect surface defects in real time, thereby providing higher reliability and reproducibility of results [1,2].
Beyond vision-based inspection, magnetic non-destructive testing (NDT)—notably magnetic flux leakage (MFL) systems—offers very high inspection throughput and a unique ability to sense subsurface and internal defects, including wire breaks and corrosion products that are invisible to cameras. This capability is particularly valuable for multi-layer hoist ropes, where cracks and broken wires may initiate beneath the outer layer. MFL instruments typically deliver two diagnostic channels: loss of metallic area (LMA) for gradual cross-section loss and local faults (LF) for discrete defects, enabling early detection of internal damage during rope motion. In this study we deliberately focus on externally observable, macroscopic geometric anomalies derived from images (kinks, bends, visible breaks). The proposed optical pipeline is therefore positioned as a complementary modality to magnetic inspection rather than its replacement, with clear benefits in low cost, straightforward integration with machine-vision hardware, and direct geometric quantification (e.g., thinning). See, e.g., Tian et al. on internal vs. external damage identification in wire ropes and recent MDPI works addressing rope defect measurement and lay-length characterization [3].
Among the most common preprocessing methods in industrial machine-vision systems are binarization and edge detection. These low-level techniques are characterized by high computational efficiency and robustness to moderate external disturbances such as illumination fluctuations, surface contamination, and image noise. Binarization converts grayscale or color images into binary masks that emphasize structural boundaries, whereas edge-detection operators—such as Sobel and Canny—localize intensity discontinuities, thereby revealing geometric anomalies along the rope contour.
Although more sophisticated approaches—such as the fast Fourier transform (FFT), wavelet-based analysis, and frequency-domain filtering—can, in principle, provide deeper insight into periodic or localized defects, they are typically extremely sensitive to environmental perturbations. Variable lighting, motion blur due to vibration, rope twist, and surface contamination substantially reduce the reliability of such methods in field applications. Moreover, these methods often require stable imaging conditions and background suppression, which are difficult to guarantee under real production conditions [4].
The paper makes three mining-specific contributions: an optical, encoder-synchronized pipeline for continuous monitoring of hoisting ropes in motion; a thickness-profile analytics workflow that translates image features into engineering quantities relevant to rope integrity (e.g., lay regularity, localized thinning, abrupt kinks/breaks); and a decision layer that maps detections to severity levels and maintenance actions used in mine operations. Together, these elements turn image processing into deployable mine-site diagnostics.
Accordingly, robust low-level operations such as binarization and edge detection remain the most practical preprocessing tools in industrial diagnostic pipelines, ensuring stable feature extraction even in noisy environments.
In recent years, convolutional neural networks (CNNs) have begun to be used for rope-defect diagnostics owing to their ability to automatically extract high-level features from visual data. However, such models are often regarded as “black boxes,” have limited interpretability, and tend to degrade under conditions poorly represented in the training set—such as contamination, illumination fluctuations, or mechanical vibrations. Furthermore, training neural networks requires large labeled datasets and high-performance computing resources that are not always available in industrial settings. These limitations hinder the scaling and maintenance of deep-learning-based systems in real-world conditions [5,6,7].
Beyond qualitative surface damage, the external geometry of steel wire ropes—primarily the rope diameter and the lay length—constitutes a critical set of quantitative indicators used in routine acceptance, in-service monitoring, and lifetime assessment. Recent vision-based studies demonstrate that both parameters can be inferred from camera images once the rope contour is reliably segmented. Classical optical pipelines extract the outer boundary and then convert image distances to metric units to estimate the rope diameter, while the periodic strand pattern is analyzed to determine the lay length as the dominant spatial wavelength along the rope axis. These approaches have been investigated alongside deep models for rope imagery and emphasized in surveys of non-destructive techniques for wire ropes and related steel products [8].
In parallel, optical diameter metrology has matured in adjacent domains (e.g., shafts) using structured-light or enhanced stripe imaging, underscoring the achievable precision of camera-based diameter estimation under proper calibration and reflectivity control—considerations directly transferable to rope inspection scenes [9].
Finally, field conditions specific to mining ropes—lubricating greases, adhered fines, and nonuniform illumination—can confound both contour extraction and periodicity analysis. Contemporary works highlight how grease and soiling affect appearance in contactless sensing and motivate explicitly accounting for these factors in the imaging model and in the evaluation protocol [10].
To overcome these limitations, the present study proposes an alternative defect-detection strategy based on geometric analysis of the rope cross-section. Unlike conventional methods that operate directly on full-resolution images, the proposed approach extracts a one-dimensional longitudinal profile that reflects changes in cross-sectional thickness along the rope. Dimensionality reduction provides several benefits:
  • a substantial reduction of input size and computational burden;
  • improved robustness to noise and visual distortions;
  • interpretable numerical representation of geometric features;
  • accurate detection of macroscopic deformations corresponding to visually discernible defects such as kinks, bends, and breaks.
Focusing on low-dimensional geometric signals rather than full-image textures bridges classical engineering insights with data-driven analytics and establishes a solid basis for lightweight, interpretable, and reliable diagnostic tools suitable for real-time deployment in industrial machine-vision systems.

2. Materials and Methods

2.1. Dataset and Image Acquisition

Two types of image datasets were prepared to evaluate the proposed method:
  • Real images acquired in controlled laboratory conditions using a calibrated optical setup. These images capture industrial steel ropes in intact condition and with visually discernible surface defects.
  • Synthetic images generated in Blender with strictly controlled defect geometry, illumination, and rope structure, providing tunable variability and precise labeling.
For mine-hoist integration, the camera–illumination module is installed near the head sheave with a protective hood and air-knife to limit dust deposition. A shaft-side incremental encoder provides rope-travel distance so that each image frame is geo-referenced along rope length; this enables continuous inspection and precise localization of defects on a moving rope. The optical axis remains approximately orthogonal to the rope, and exposure parameters are chosen to avoid motion blur at typical hoisting speeds. The resulting stream of frames is converted on-edge into thickness profiles and synchronized with encoder ticks for subsequent analytics and reporting.
The dataset comprises four diagnostic categories: intact, bend, kink, and wire break. For each category, 100–120 labeled images were collected, ensuring balanced classes and adequate representation for supervised training and validation [11,12,13]. Representative examples for all four categories—both real and synthetic—are shown in Figure 1.
The diagnostic classes were selected for their critical relevance to structural assessment and residual life prediction of steel ropes. Macroscopic deformations—e.g., bends and kinks—pose a direct threat to mechanical integrity, whereas local wire damage can serve as early indicators of failure often missed by routine visual inspection. The “no defect” class provides a reference baseline for quantifying classifier accuracy and robustness across classes [13,14,15].
Real-object images were captured using a digital camera Basler Ace acA2500 (Ahrensburg, Germany) with a 1/2.5″ CMOS sensor (2592 × 1944 px, 5 MP) and a Ricoh FL-CC1214A-2MF1.4 lens (focal length 12 mm). The camera was positioned orthogonally to the rope axis. Illumination was provided by a ring LED source with diffusers to ensure uniform lighting. A matte black background enhanced contrast and facilitated reliable binary segmentation.
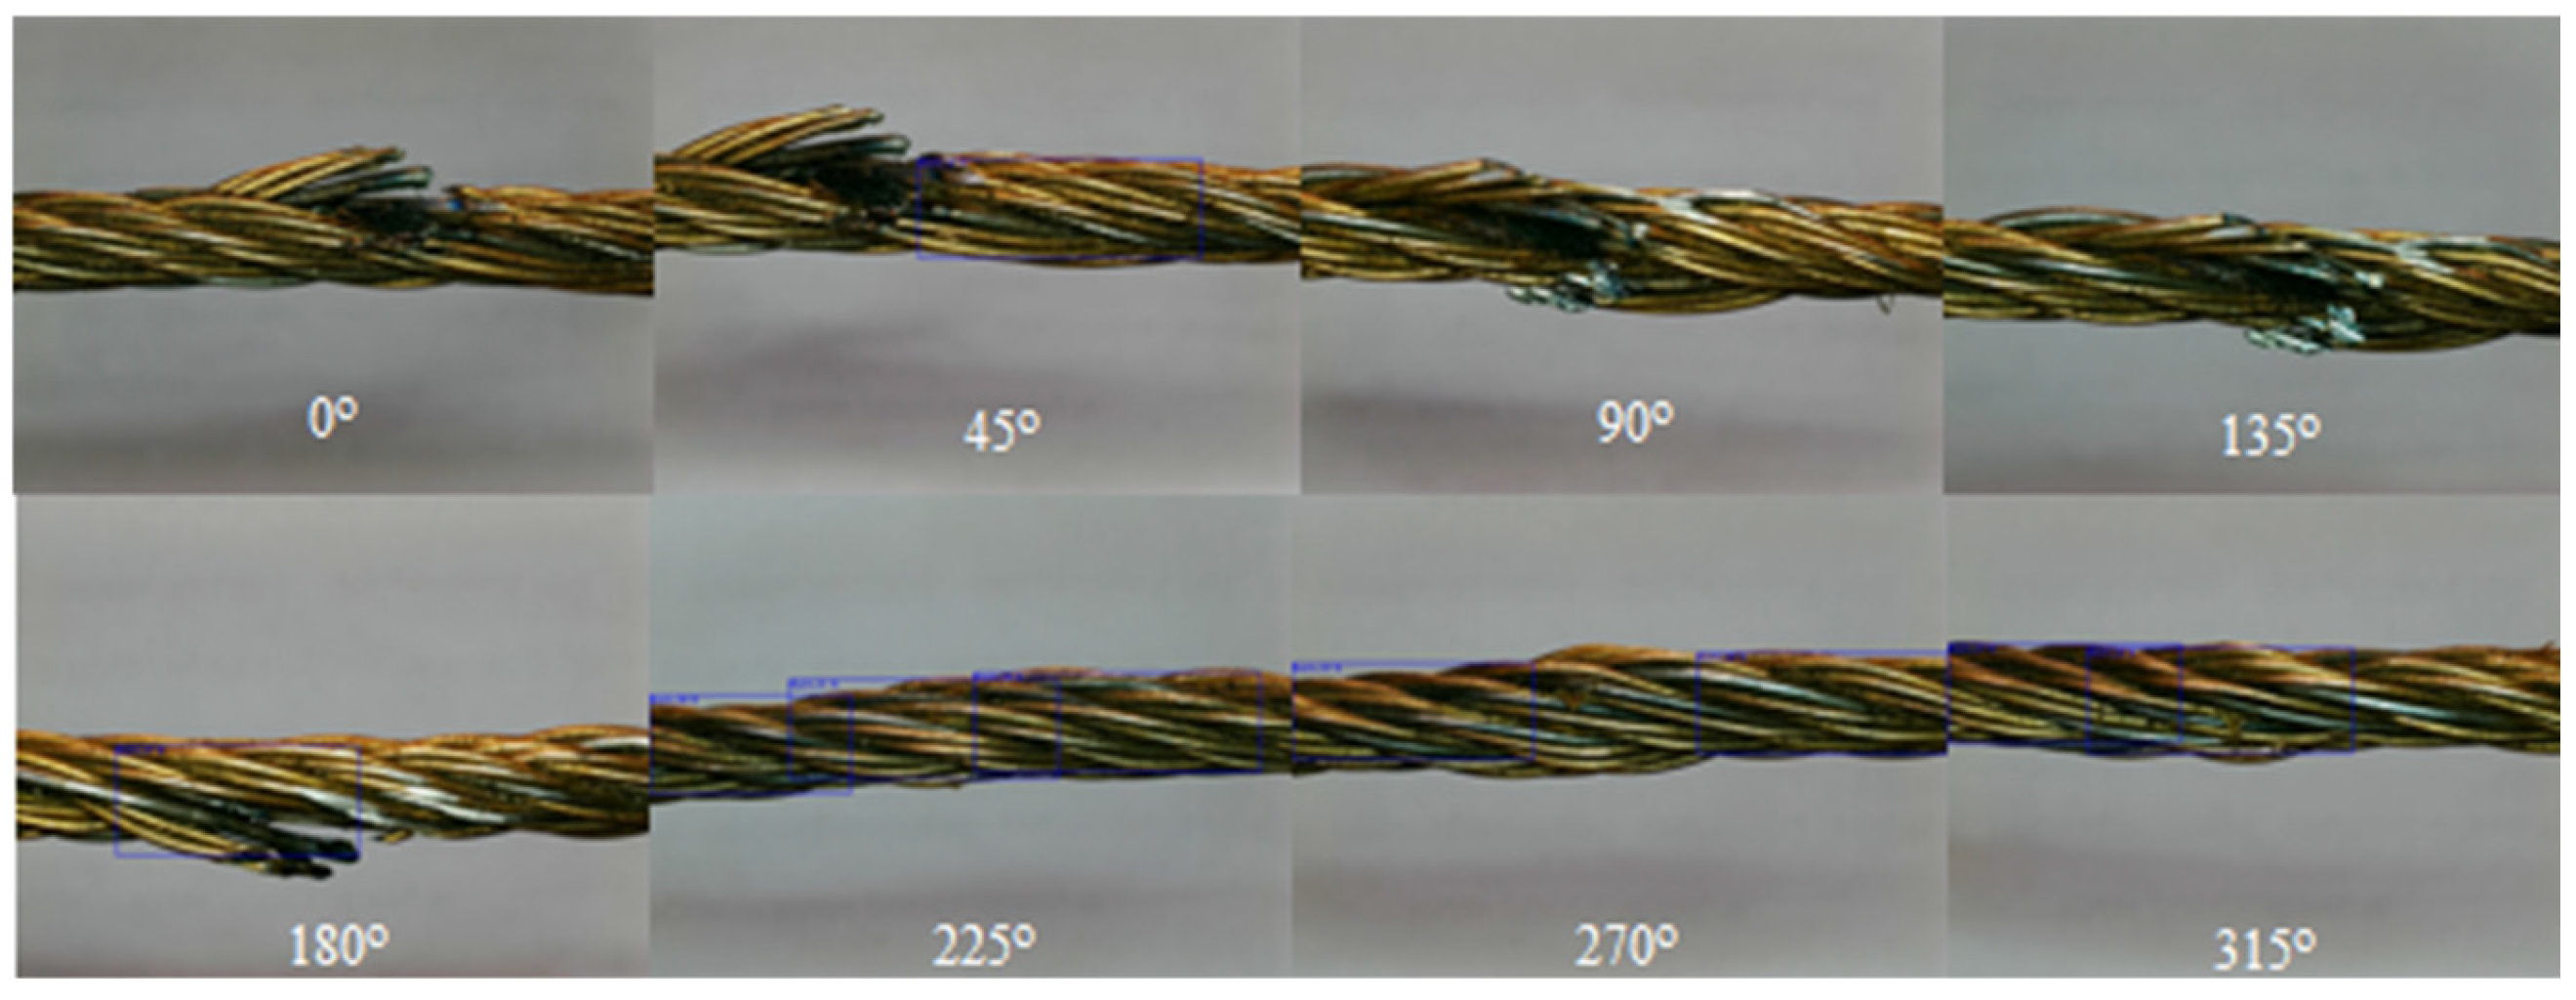
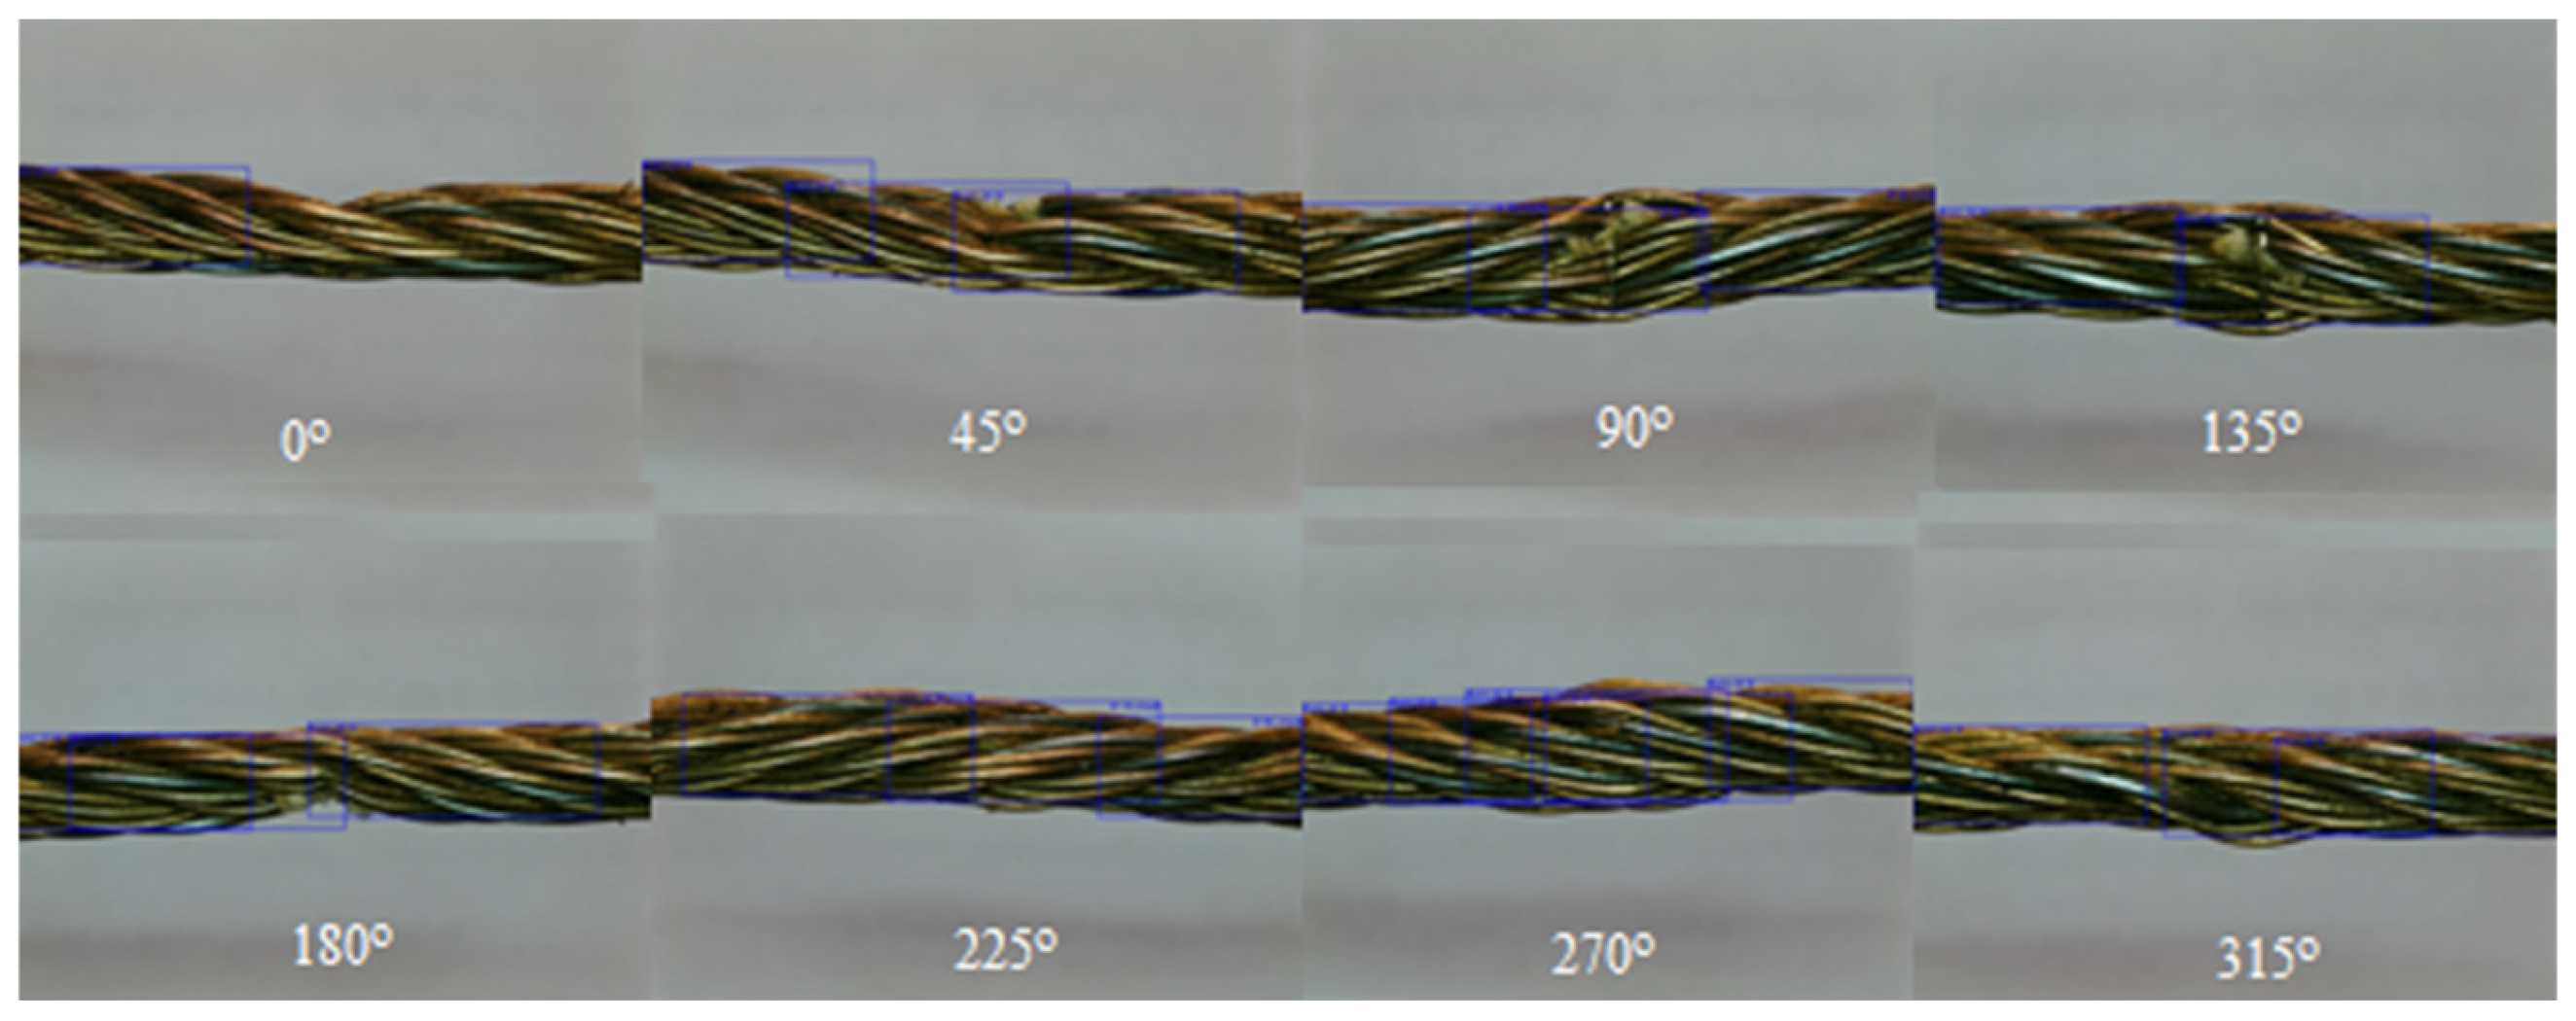
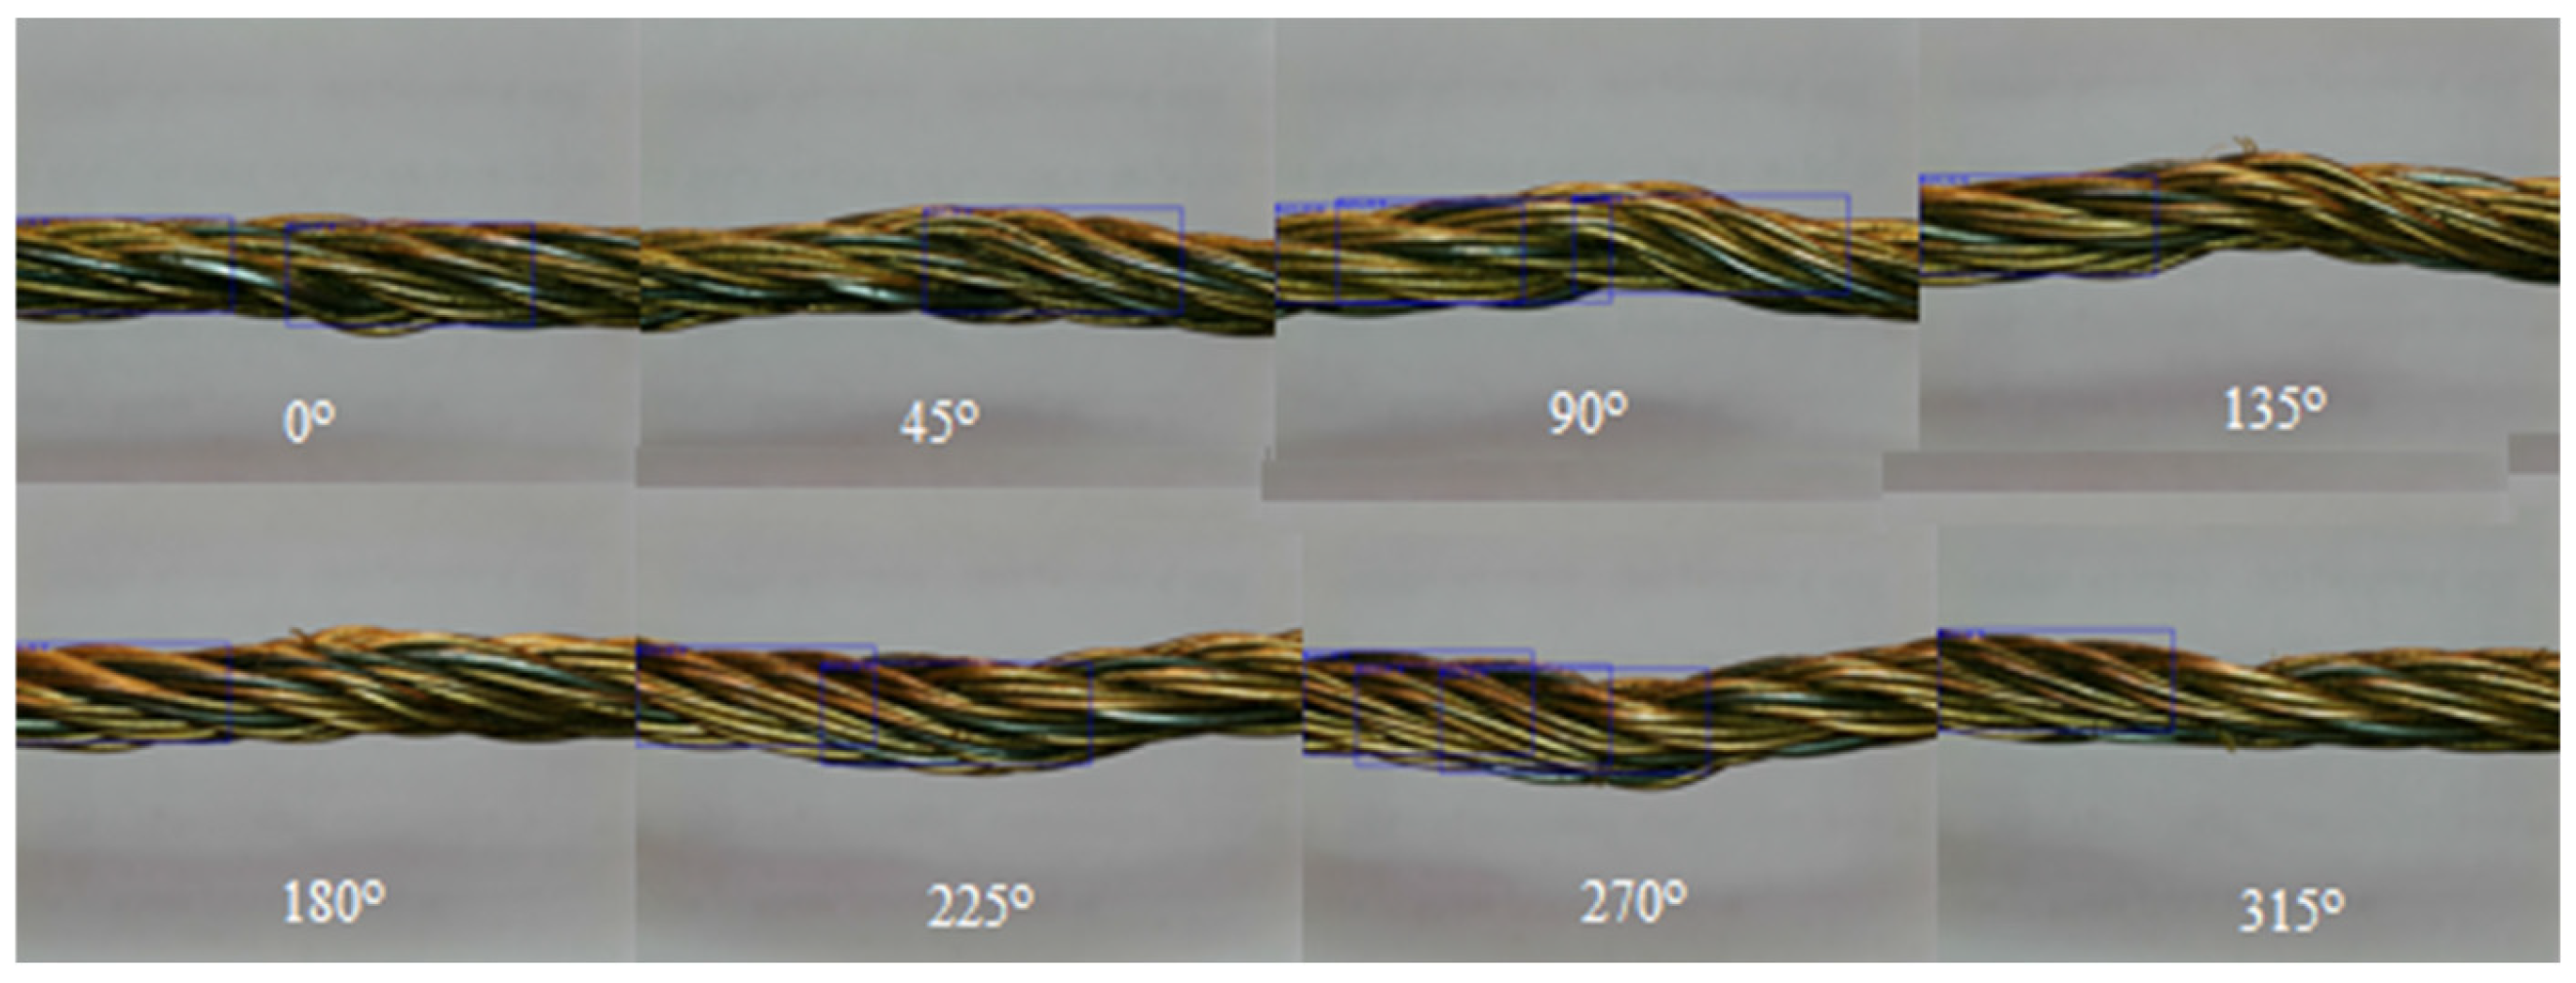
Each rope specimen was scanned along a one-meter length with a spatial step of 3–5 mm. To improve diagnostic robustness, each segment was additionally photographed from eight viewpoints, in 45° increments from 0° to 315°, by rotating the specimen. This procedure enabled assessment of viewpoint invariance and improved visualization of complex structural defects (see Figure 2, Figure 3 and Figure 4).
During operation the rope runs on guides and sheaves, and the lubricant is extruded from the outer surfaces while locally filling micro-defects. Such filling smooths surface micro-relief and can suppress texture cues that are visible to the eye or to a camera. Because our diagnostic representation is a silhouette-based thickness profile, it is comparatively robust to micro-texture changes; however, a thick or nonuniform film may lower edge contrast and must be handled by illumination and thresholding choices described below.
Figure 2 presents a set of representative images of wire breakage captured from different viewpoints. “Break” defects are characterized by pronounced strand discontinuities, protruding wire fragments, and disrupted structural coherence—hallmark features of mechanical failure.
Figure 3 shows a kink defect, defined as a sharp, localized deformation typically arising from excessive torque or bending stress. Visually, this defect is characterized by an abrupt strand misalignment and a local disruption of structural coherence.
Figure 4 illustrates a bend defect, manifested as a smooth curvature with a large radius along the rope. Unlike kinks and breaks, bends preserve strand continuity; however, they introduce an asymmetric cross-sectional geometry and a potential redistribution of mechanical loads [16].
The collected data served three key objectives:
  • verification of thickness-profile extraction accuracy under idealized conditions;
  • visual assessment of class separability based on the extracted profile shape;
  • analysis of robustness to visual perturbations—noise, illumination changes, and background nonuniformity—by controlled variation of imaging parameters.
The scope of the dataset is limited to defects that manifest on the external surface and thus produce measurable geometric signatures in the thickness profile. Internal defects within multi-layer hoist ropes—while operationally critical—are beyond the sensing depth of purely optical methods and are more appropriately addressed by magnetic NDT (LMA/LF channels). Accordingly, the present dataset supports evaluation of the proposed optical pipeline, whereas internal-damage detection is considered a complementary task for future multi-sensor integration [3].
In practical deployments the camera can operate in a continuous recording mode while the rope is in motion. An incremental shaft encoder attached to the hoist drum (or a measuring sheave) provides displacement pulses that are accumulated to a rope-length coordinate. The video stream is processed in overlapping windows; for each window, the thickness profile is extracted and classified on-the-fly. The encoder count at the window center is stored together with the timestamp, enabling precise, repeatable localization of defects along the rope during continuous operation.

2.2. Classification Model Selection

The proposed monitoring method is based on extracting a geometric descriptor—a one-dimensional thickness profile that reflects the cross-sectional shape of the steel wire rope. This profile is formed from visual data using binarization and contour analysis. Instead of processing full-size grayscale or color images, the approach reduces the visual information to a compact numerical sequence that characterizes the rope’s external geometry in the current projection.
This representation has several key advantages: it is robust to background interference, does not require high-resolution optics, and provides interpretable features suitable for classification. In addition, the reduced dimensionality lowers computational load and diminishes the risk of overfitting. The resulting profile can be aggregated and subjected to statistical analysis, which makes it compatible with both neural and traditional machine-learning methods.
To select the most effective classification algorithm, a comparative evaluation was conducted for models designed to process one-dimensional sequences or numerical feature vectors.
Among deep-learning models, one-dimensional convolutional neural networks (1D CNNs) demonstrated high sensitivity to local signal changes, which makes them particularly effective for detecting sharp geometric anomalies such as kinks and overbends. More advanced architectures, such as ResNet and InceptionTime, can recognize complex spatial structures but require substantial computational resources and careful hyperparameter tuning [17,18].
Recurrent neural networks (e.g., LSTM and BiLSTM) are well- suited to describing smooth transitions characteristic of bend-type defects due to their ability to retain long-term dependencies. However, they are less sensitive to abrupt signal changes and generally have longer training and inference times than CNNs. Transformer-based models possess high expressive power but require large training datasets and significant hardware resources, which limits their applicability under constrained computational conditions in industrial settings [19,20].
Multilayer perceptrons (MLPs) applied to deliberately engineered feature vectors remain relevant in small-data regimes. Despite ignoring the sequential structure of the signal, MLPs provide fast execution and high interpretability when well-designed features are used [21,22].
Among classical machine-learning methods, logistic regression is highly interpretable but performs poorly with nonlinear relationships. Support vector machines (SVMs) show good accuracy on small datasets but are sensitive to kernel choice and parameterization. Random Forests are resistant to overfitting and can handle heterogeneous features; however, they may lose effectiveness in the presence of overlapping class boundaries or complex feature interactions [12,23,24].
The most balanced and stable results were achieved using the CatBoost gradient-boosting algorithm. It is optimized for processing numerical and categorical data, exhibits built-in robustness to class imbalance and noise, and requires minimal manual tuning. In addition, CatBoost provides tools for feature-importance analysis. The algorithm performs strongly on small and medium-sized datasets, and its Ordered Boosting mechanism reduces the risk of target leakage, improving the model’s generalization ability. These properties make CatBoost particularly attractive for deployment in industrial diagnostic systems [25].
The summarized comparative detection models identified are presented in Table 1.

2.3. Defect Diagnosis Algorithm Based on Thickness Profile Analysis

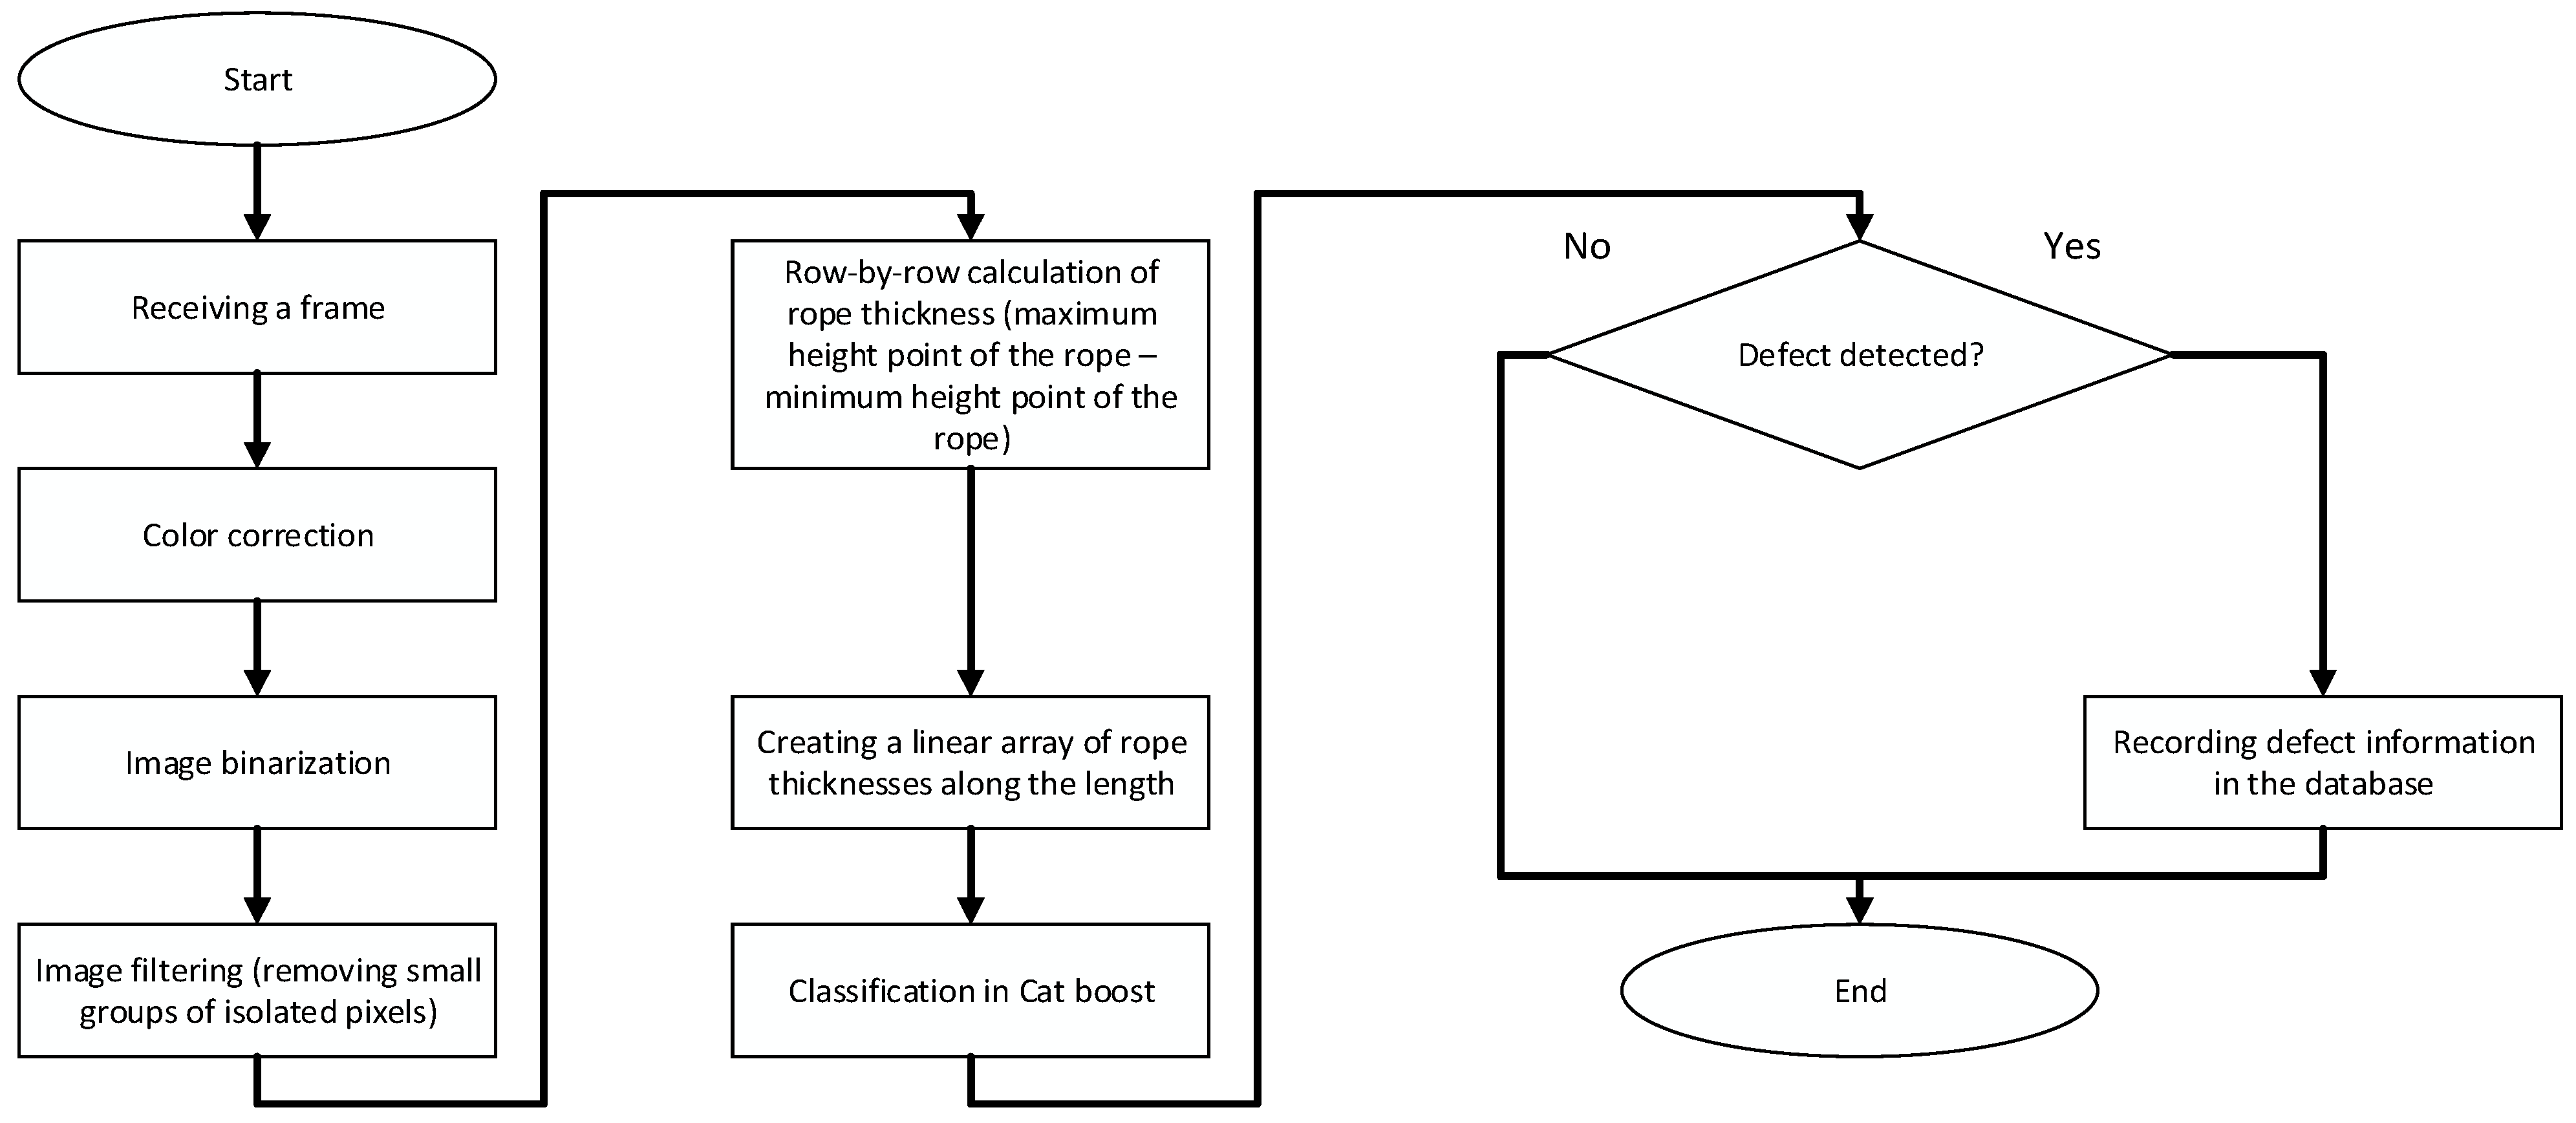
The monitoring pipeline is implemented in Python 3 (version 3.8.9) and follows the modular sequence in Figure 5.

2.3.1. Image Acquisition and Preprocessing

At the first stage of the inspection pipeline, an image of the steel wire rope is acquired and subsequently preprocessed. The goal of this stage is to suppress illumination artifacts, extract relevant contours, and prepare the data for robust geometric feature extraction even under industrial noise conditions [26,27].

2.3.2. Grayscale Conversion and Illumination Normalization

The input image captured with a high-sensitivity camera is converted to grayscale. To equalize local contrast, we apply Contrast-Limited Adaptive Histogram Equalization (CLAHE). This approach enhances detail in darker regions while limiting noise amplification in bright areas, which is particularly important under nonuniform lighting and in the presence of specular highlights from the metallic rope surface [28,29].

2.3.3. Adaptive Thresholding

After normalization, adaptive mean thresholding is applied. Unlike a global threshold that uses a single cutoff value for the entire image, the adaptive method computes an individual threshold for each region based on the local average intensity within a neighborhood around the pixel:
T i , j = 1 n 2 u , v N ( i , j ) i u , v C
where N ( i , j ) is an n × n window centered at ( i , j ) , and C is a correction constant. In this study, we used an 11 × 11 -pixel window and C = 2 , which ensured reliable delineation of rope structures under moderate illumination and background variability. The outcome of this step is a binary image that retains only the salient intensity structures—primarily the rope contours—while suppressing the background.
Effect of grease films and contamination. A thin, uniform grease layer tends to reduce local contrast by flattening surface highlights, whereas a thicker or smeared film may blur edge transitions. To counteract this, we employ CLAHE followed by adaptive mean thresholding, which preserves object boundaries under locally varying backgrounds. In scenarios with heavy lubricant or dust, we recommend: (1) backlight/silhouette illumination to emphasize the outer contour; (2) a light pre-wipe of the inspection zone to remove loose deposits (without altering rope geometry); (3) narrow-band lighting to mitigate specular glare. These steps stabilize the binary mask from which the thickness profile is computed.

2.3.4. Noise Suppression and Morphological Filtering

The binary image may still contain residual noise artifacts—isolated bright or dark pixels arising from glare, dust, or surface heterogeneity. We therefore apply a two-stage filtering procedure:
  • Median filtering with a 3 × 3 kernel effectively removes impulse noise (e.g., salt-and-pepper) while preserving sharp object boundaries, which is essential for the subsequent thickness analysis.
  • Connected-component analysis: each connected pixel group in the binary mask is labeled, and clusters with an area smaller than 50 pixels are removed as irrelevant. This threshold was chosen empirically based on a preliminary assessment of typical noise artifacts.
Upon completion of preprocessing, a clean binary mask containing only geometrically meaningful rope contours is obtained. These data are then used in the next stage to extract the one-dimensional thickness profile and to classify the rope condition.

2.3.5. Thickness-Profile Computation and Construction

At the second stage, a one-dimensional thickness profile is extracted from each preprocessed image by sequentially scanning along the rope’s longitudinal axis. For each horizontal coordinate, we compute the vertical distance between the upper and lower bright pixels (representing the rope contours). This yields a discrete numerical signal that captures the rope’s cross-sectional geometry along its length [30,31,32].
For each horizontal coordinate x i in the image, the corresponding thickness value T x i is computed as the difference between the vertical positions of the upper and lower bright pixels:
T x i = y m a x x i y m i n x i
where T x i is the thickness at position x i , and y m a x x i and y m i n x i are the maximum and minimum row coordinates of the bright pixels (after binarization) in column x i .
The resulting sequence T x i forms a continuous signal describing the longitudinal variation in the rope’s size, which serves as the basis for subsequent processing steps, including feature extraction and defect classification.
Transition to physical units. Since the subsequent analysis of thinning and compliance with standards is performed in millimeters, the locally estimated thickness/diameter expressed in pixels D p x is converted to millimeters using the calibration scale factor s (mm/px) determined during preliminary camera calibration:
D m m = D p x     s
Here, s is taken to be uniform across the field of view, and in this study s   =   0.0375   m m / p x . The scale was verified against several reference segments within the active region of the frame.
During hoist operation, each profile sample is time-stamped and associated with encoder distance, yielding position-resolved diagnostics (start/stop coordinates of a defective segment). This enables trending of the same rope segment across shifts, automatic re-inspection after maintenance, and targeted rope-rewrap or replacement actions with minimal downtime.

2.3.6. Rope-Condition Classification

To address automatic classification of steel wire rope condition, we constructed a CatBoost gradient-boosting model. Training was performed on a dataset comprising approximately 1000 images segmented into 239 rope sections. Each section is represented by a one-dimensional thickness profile extracted along the rope’s longitudinal axis and contains 1024 numerical values corresponding to the local rope thickness in pixel units. These data reliably capture both the periodic lay structure characteristic of intact sections and the distortions induced by defects.
Each segment was assigned to one of four diagnostic classes: no defect, bend, kink, or break.
To reduce the dimensionality of the raw profiles and improve the model’s generalization, we computed aggregate statistical features that summarize the global characteristics of the profile as shown in Figure 6:
  • sum—the sum of all thickness values along the section; this can reflect the overall “rope volume” in the segment. If the segment is heavily worn, the sum tends to be lower;
  • prod—the product of all thickness values; rarely used due to numerical instability (if any point is zero, the entire product collapses to zero). It can occasionally serve as an anomaly marker;
  • mean—the average thickness, providing a baseline estimate of the nominal rope thickness; a decrease may indicate overall wear or local thinning;
  • std—the standard deviation of the profile (overall variability/roughness); a high standard deviation suggests strong thickness fluctuations, potentially due to local damage or protruding wires;
  • max, min—the extreme values capturing local deformations (e.g., bulges and constrictions).
The trained CatBoost model comprises 622 trees, with an average of 46.16 leaves per tree, indicating high model flexibility and the capacity to capture complex nonlinear relationships among features. For model interpretability, we employed the PredictionValuesChange method to quantify the contribution of each feature to the classification process. The results are summarized in Table 2.
As shown in the table, the features max, std, and sum contribute most to the model’s predictions, reflecting the maximum thickness, dispersion, and aggregate mass of the profile, respectively. These indicators are particularly important for detecting break and kink defects, where the profile geometry exhibits abrupt deviations. The mean feature demonstrates moderate importance, whereas min—and especially prod—are weakly informative. The near-zero importance of prod may indicate either redundancy with other features or instability of this metric in the presence of noise and outliers.
The choice of the Logloss objective is motivated by the need for accurate probabilistic calibration of predictions, which is especially relevant in multiclass industrial inspection tasks. Using this loss not only enables categorical assignment of a segment but also provides a quantitative estimate of the model’s confidence in its decision. This is critical for automated decision-making in monitoring systems, where predicted probabilities can be leveraged for downstream filtering or risk ranking.

2.3.7. Post-Processing and Result Logging

When a defect is detected, the system automatically generates a structured diagnostic record that includes:
  • the type of the detected defect;
  • the coordinates of the defective segment along the rope;
  • the timestamp of detection;
  • the encoder-derived rope-length coordinate for the center of the processed window.
In continuous mode, an incremental encoder is used to map each processed image window to a cumulative length along the rope. This enables the system to generate location-aware defect reports (e.g., “break at 243.6 m”), simplify follow-up inspection, and support trend analysis on revisits of the same rope segments.
Each record is automatically saved to the database. If no defect is found, the system proceeds to the next image, thereby ensuring continuous real-time monitoring.

3. Results and Discussion

The effectiveness of the proposed defect-detection algorithm was evaluated on both synthetic and real images of steel wire ropes. This two-stage testing approach provided a comprehensive assessment of the method’s robustness to varying noise levels, confirmed the accuracy of thickness-profile extraction, and enabled verification of classification quality on labeled datasets.

3.1. Verification on Synthetic Images

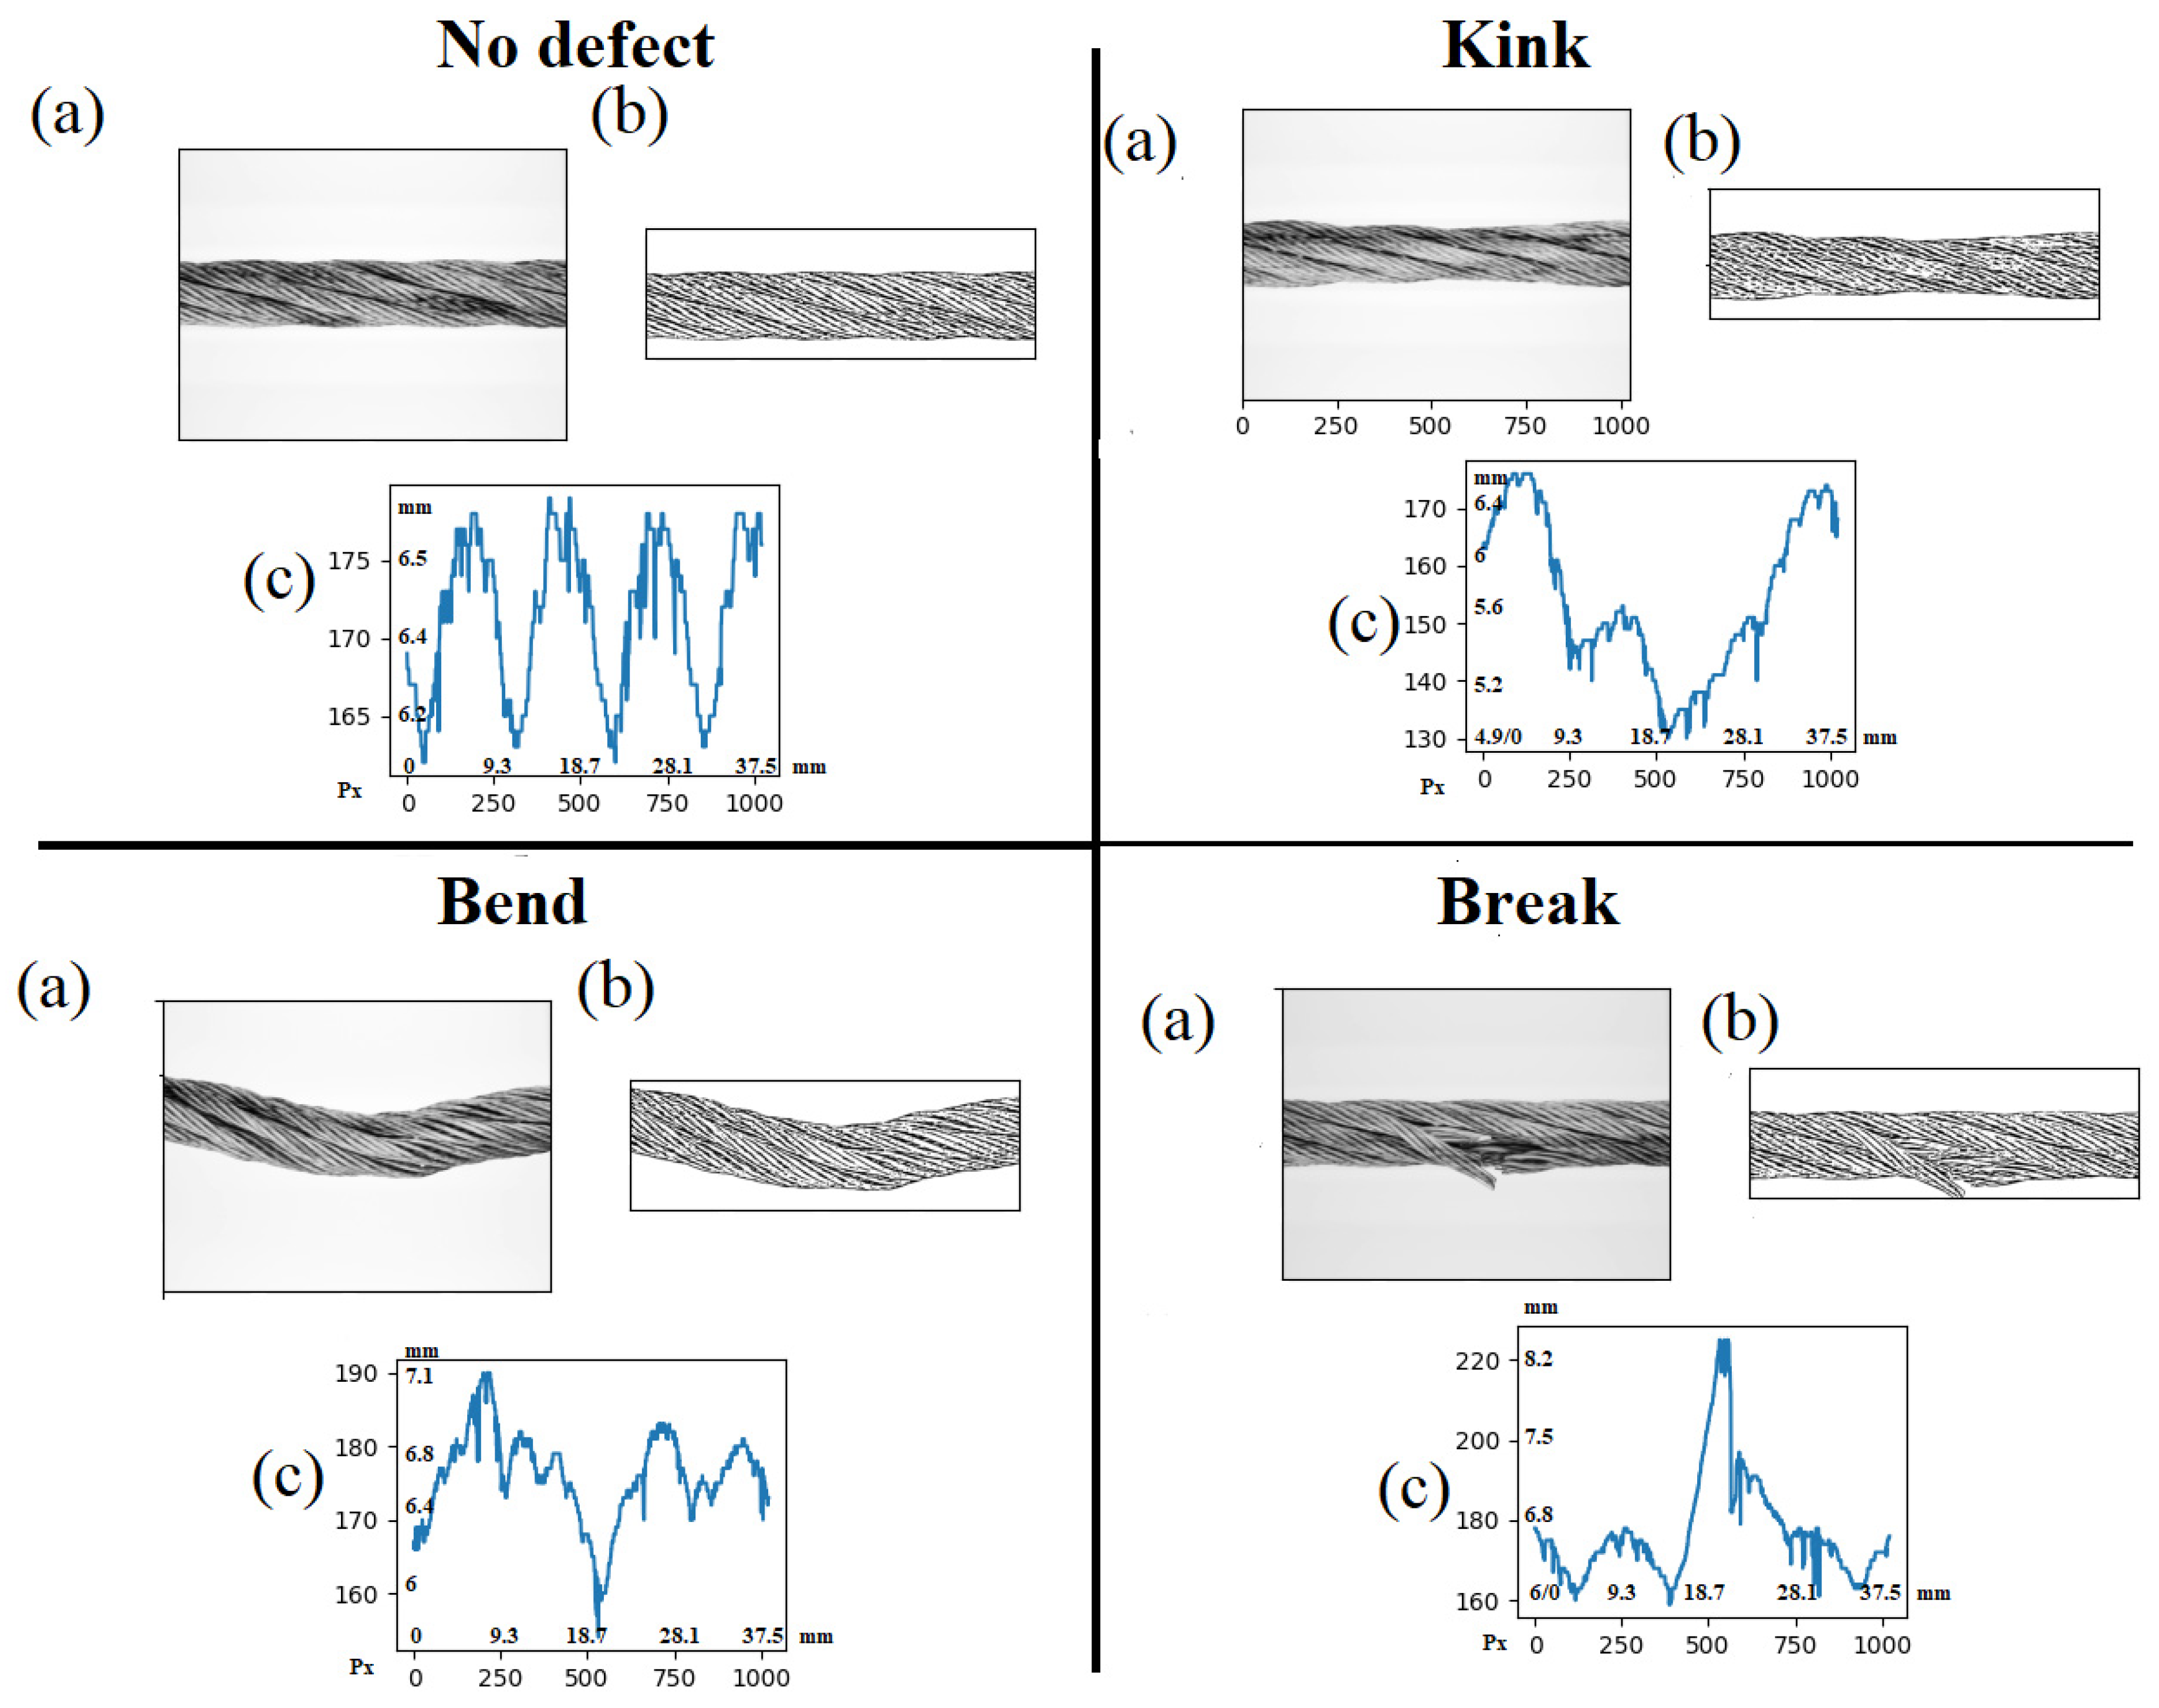
For initial validation, synthetic images were generated that emulate various rope conditions under fully controlled settings. These images made it possible to specify defect geometry precisely and served as ground truth for verifying profile shapes. Representative examples of the diagnostic pipeline are presented in Figure 7, including the original rope image, the binarized image after preprocessing, and the extracted thickness profile along the rope length.
The resulting profiles exhibit high visual separability between defect types. The no-defect class produces a regular periodic waveform corresponding to the geometry of the rope strands. Kinks are characterized by sharp symmetric constrictions, breaks mani-fest as deep localized dips approaching zero thickness, and bends result in smooth asymmetric deviations from the baseline profile.

3.2. Testing on Real Rope Images

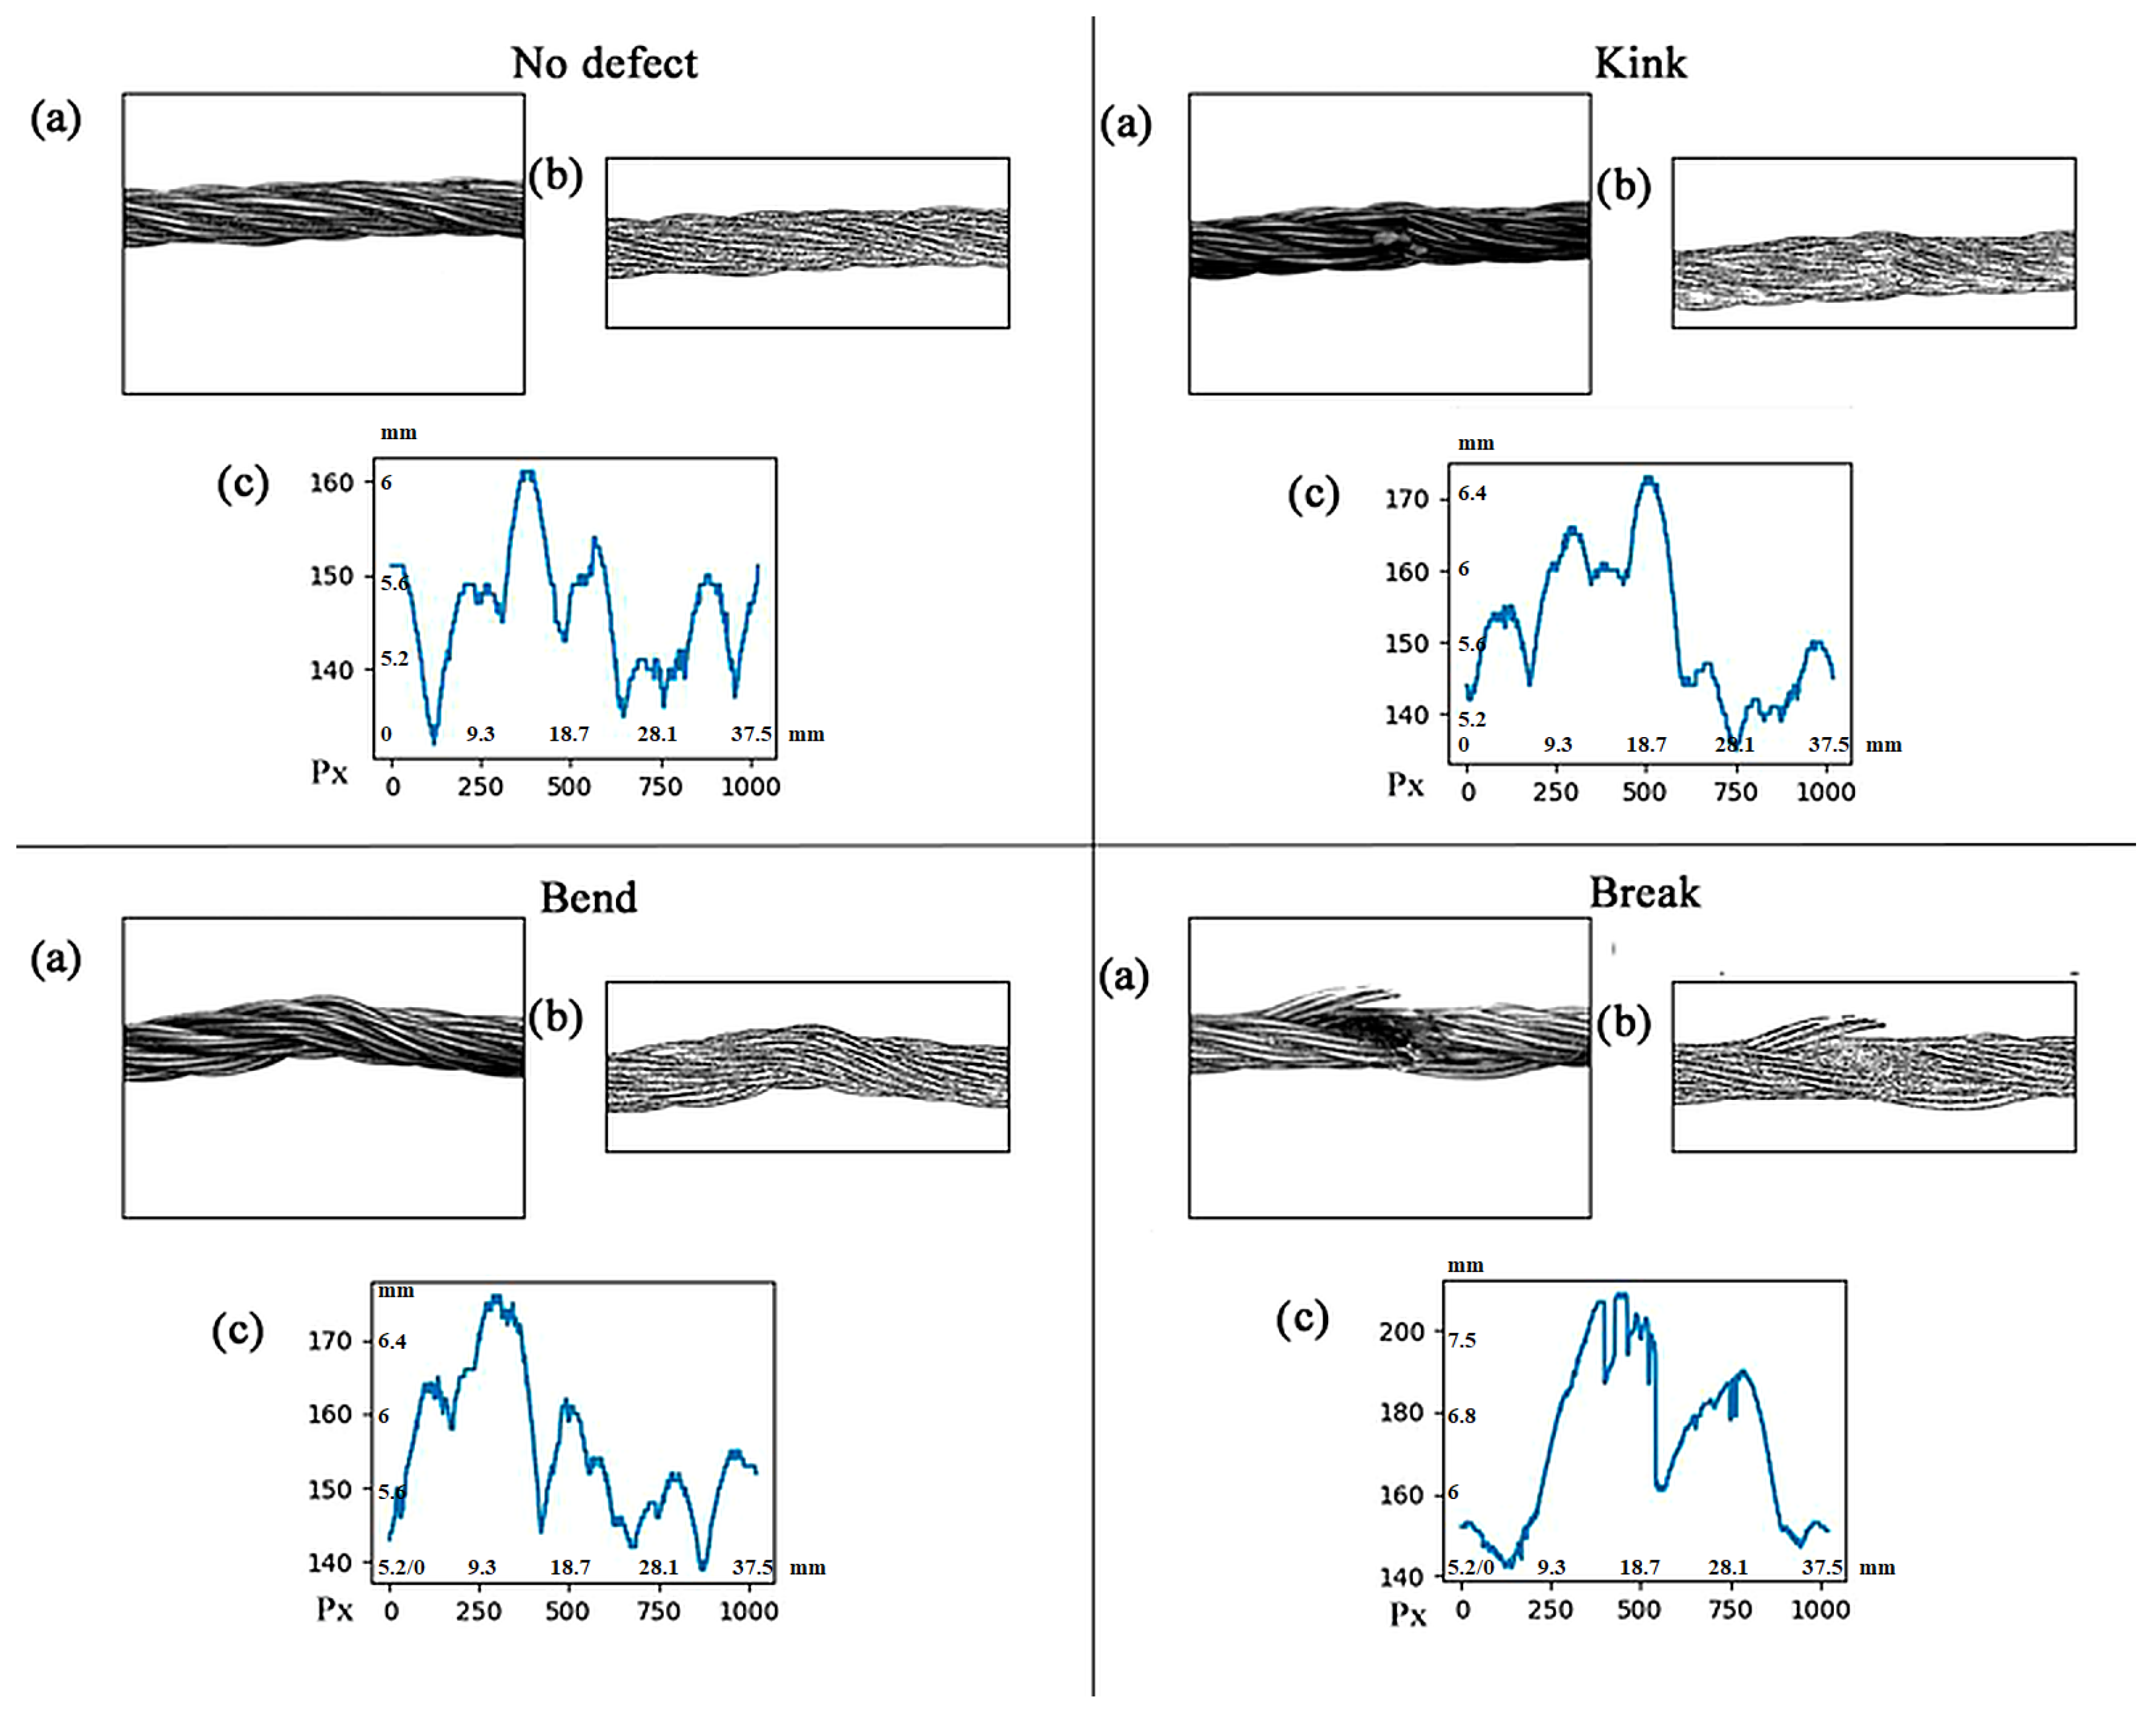
Subsequently, the algorithm was validated on real images of ropes and their damage. These images provided a near-real operating environment for testing the algorithm in the presence of rope lubricants, contaminants, and deviations of illumination from ideal conditions. Characteristic examples of data propagation through the diagnostic pipeline are presented in Figure 8, including the original image, the preprocessing result, and the corresponding thickness profile.
Despite non-ideal conditions, including residual grease and contamination, the algorithm reliably extracted geometric profiles sufficient for accurate downstream classification (Figure 8). The resulting signals preserve the shape required for accurate classification in the subsequent stages of analysis.

3.3. Profile-Based Representation of Diagnostic Classes

Upon analyzing the resulting profiles, characteristic patterns were observed for each defect type. Table 3 summarizes the visual and numerical features associated with each class.
These characteristic patterns enable reliable discrimination of defect types based solely on geometric signals [33].

3.4. Classification and Evaluation of Diagnostic Accuracy

The classification accuracy of the proposed model across all diagnostic categories is presented in Table 4. The results demonstrate consistently high values for all key metrics—ROC AUC, F1-score, precision, recall, and balanced accuracy—underscoring the model’s robustness in distinguishing steel rope conditions based exclusively on a geometric descriptor, namely the thickness profile.
The distribution of the metrics confirms stable and consistent classifier performance across all diagnostic classes. The highest indicators are obtained for the recognition of breaks, which is attributable to the pronounced structural signature of this defect in the thickness profile. Kinks are also recognized effectively due to their localized geometric deformation. In turn, bends—characterized by smoother and more gradual deviations—are more difficult to distinguish from the “intact” class, which explains the slight decrease in accuracy. Nevertheless, all indicators remain within 93–99%, which confirms the industrial applicability of the model for monitoring the technical condition of steel wire ropes [34,35,36].
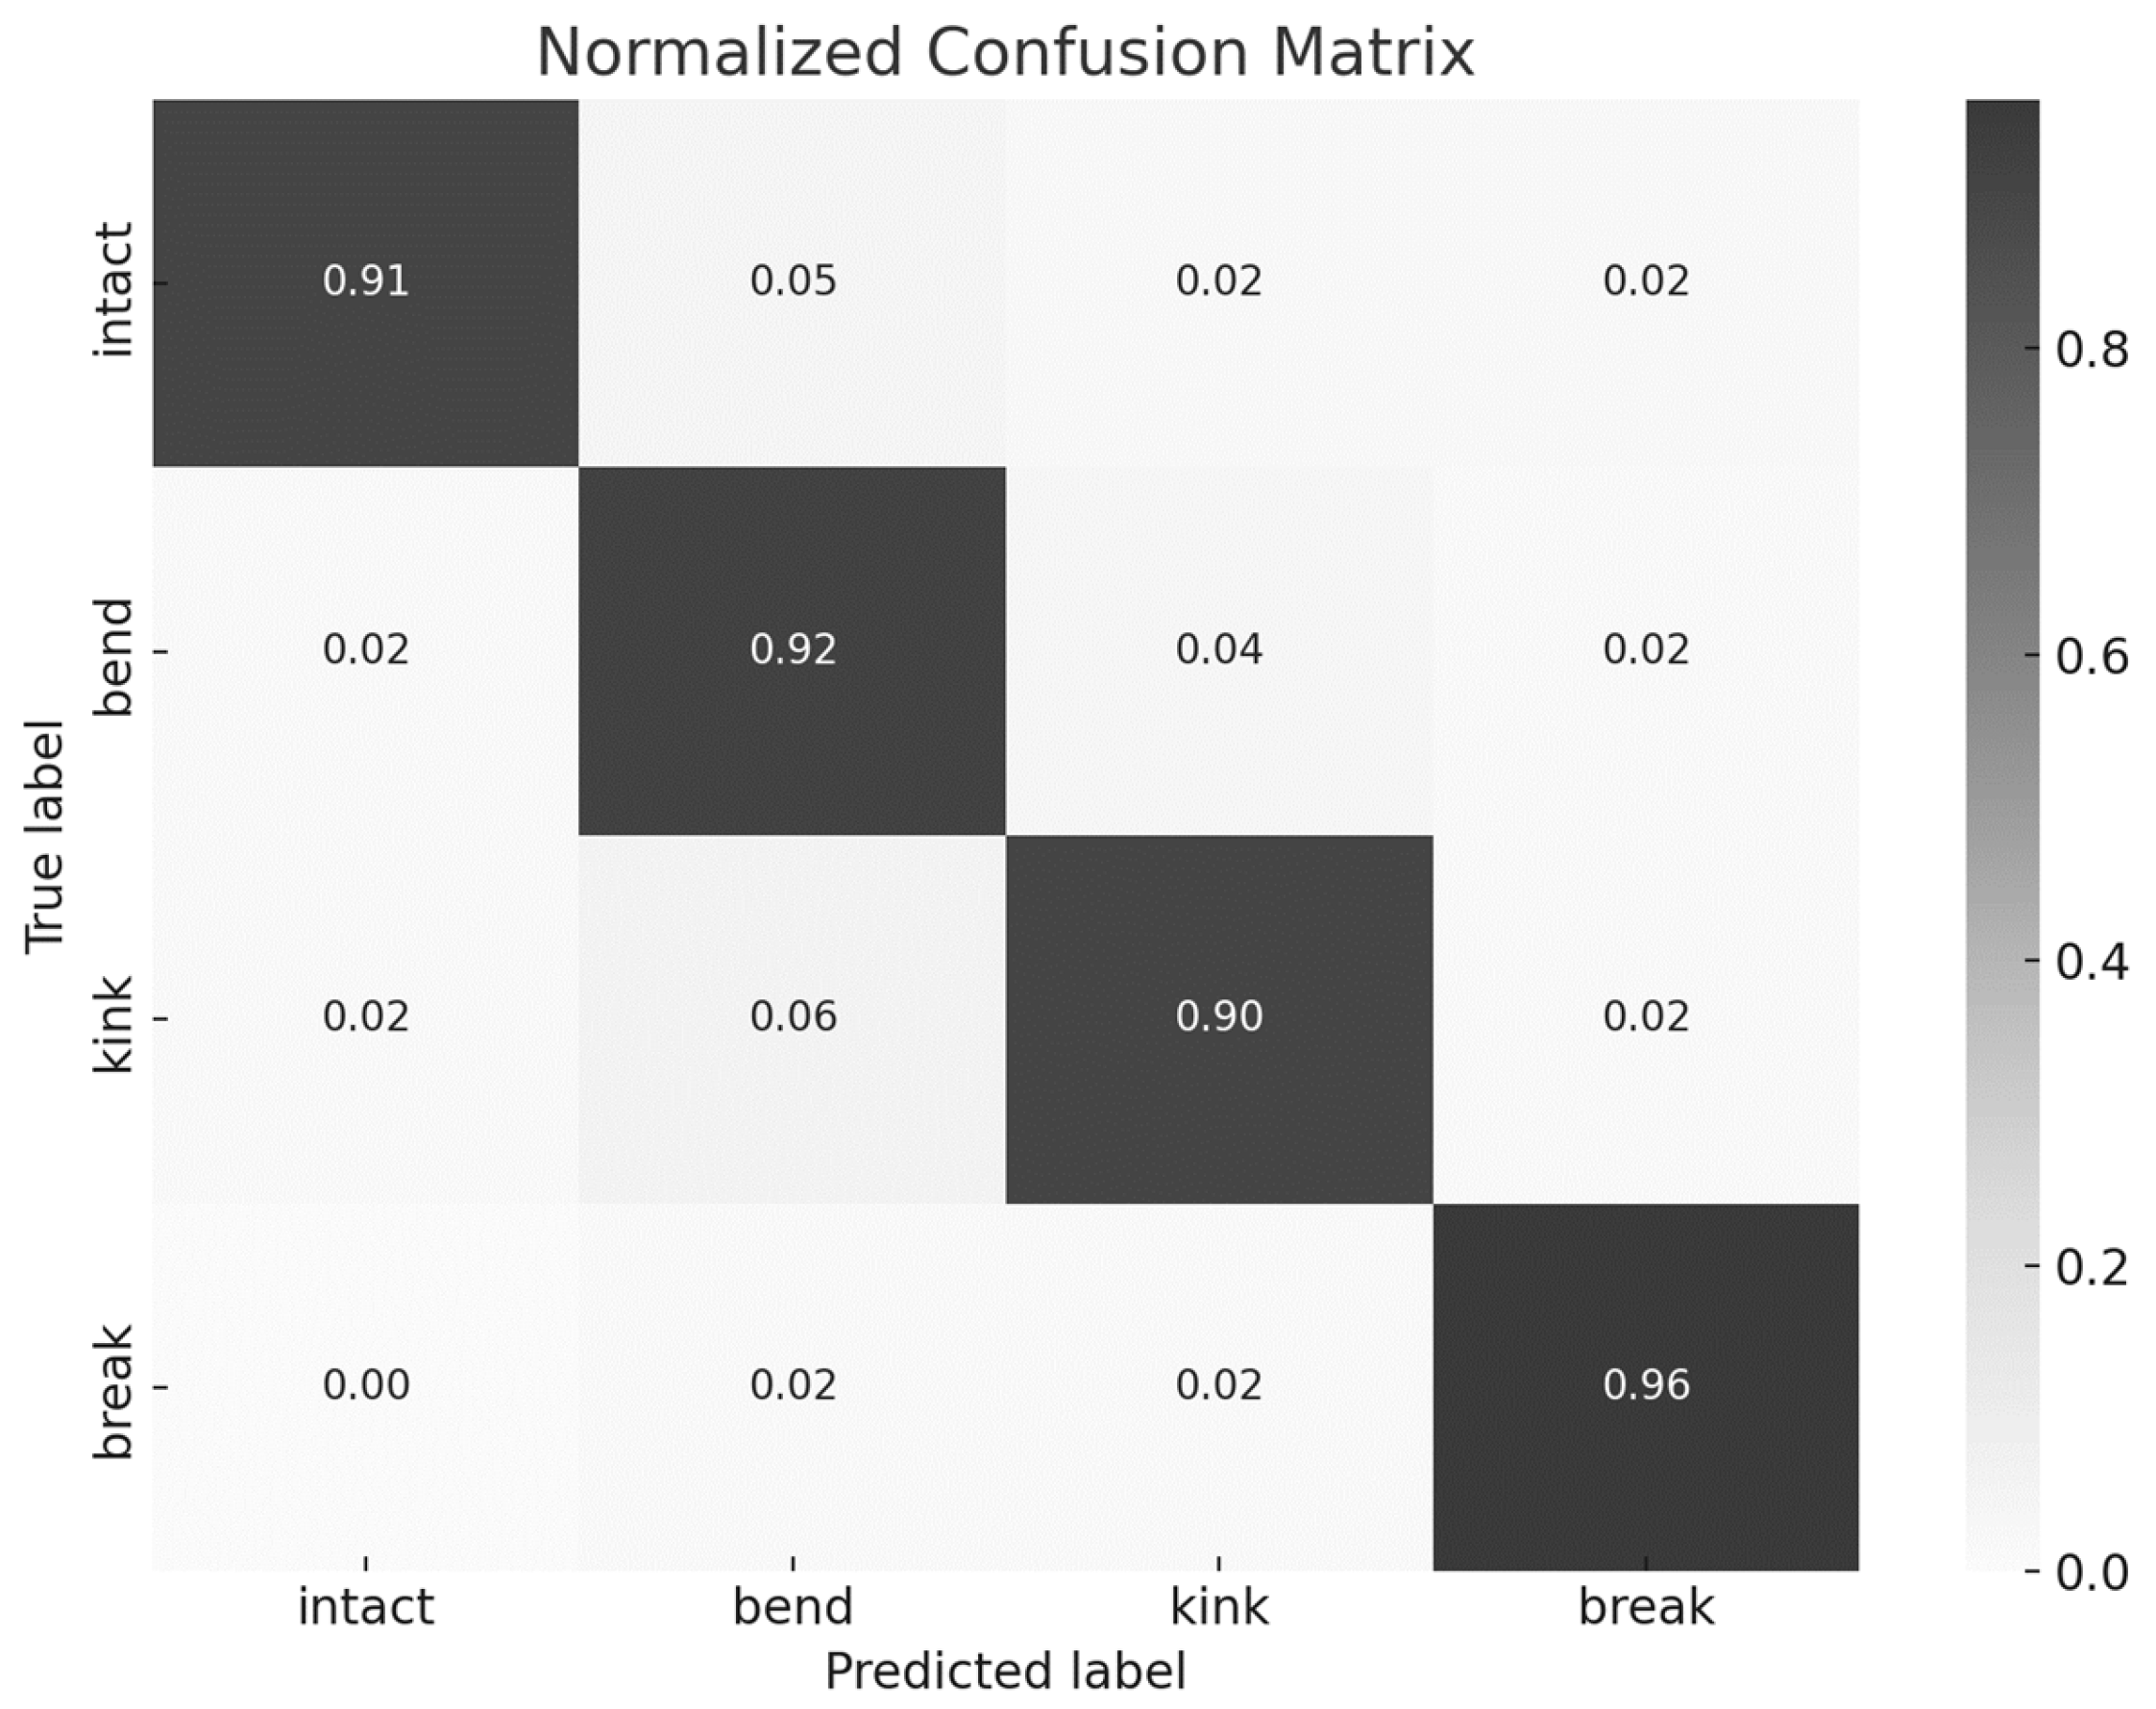
Figure 9 presents the normalized confusion matrix, reflecting the distribution of predictions with respect to the true class labels.
An analysis of the confusion matrix (Figure 9) confirms the high accuracy of recognizing classes with a pronounced geometric signature—breaks and kinks. Breaks are virtually never confused with other conditions, which is attributable to the abrupt changes in the thickness profile. Kinks, despite their more complex structure, are also recognized with high accuracy ( F 1   =   0.89 ).
The most frequent errors are associated with overlap between the “intact” and “bend” classes, which is explained by the similarity of their thickness profiles. Bends exhibit a smoother deformation shape that often does not exceed the threshold distinctly discernible by the model and can therefore be erroneously assigned to the “intact” class. Nevertheless, even in this case the F1 metric remains at an acceptable level (0.86–0.87), indicating the model’s ability to adapt to borderline cases.
Overall, all key metrics across the classes fall within the range of 0.84–0.93, which confirms the reliability and robustness of the model in solving the diagnostic task of monitoring the technical condition of steel wire ropes based on thickness-profile analysis. The results obtained indicate the industrial applicability of the approach and its potential for inclusion in automated monitoring systems.
From an operational viewpoint, magnetic systems typically achieve higher inspection throughput on moving ropes and can detect internal wire breaks and subsurface corrosion that do not produce visible surface cues. In contrast, the present optical method excels at precise geometric localization of macroscopic external anomalies and direct quantification of diameter/thickness evolution along the rope. Hence, for multi-layer hoist ropes, a hybrid scheme is advisable: MFL for fast, volumetric screening (internal/external channels) and vision-based profiling for high-resolution external geometry and thinning measurement.
However, in the practice of technical supervision and industrial safety assessment, quantitative characteristics are no less important—above all, rope thinning, i.e., a reduction of its diameter relative to the nominal value.
Diameter loss serves as an objective and easily reproducible indicator of strength degradation. Even with minimal visible damage, a diameter reduction of more than 10% can imply a critical loss of load-bearing capacity, reaching 30–50% depending on rope construction and service conditions. Unlike isolated wire breaks, thinning indicates not a local but a systemic loss of strength, often caused by internal abrasive wear or corrosion that cannot be detected without instrumental control. Ignoring this indicator can lead to sudden rope failure even under nominal load [37,38,39].
Thus, to ensure the safe operation of hoisting machinery, it is insufficient to rely solely on visual assessment of qualitative damage. A second integral component of oversight is the control of quantitative parameters, especially the degree of thinning. Their regular measurement makes it possible to detect hidden threats in a timely manner, determine the residual service life, and decide on rope replacement before an emergency situation arises. Only by combining these two approaches—visual analysis and instrumental measurement—can one speak of comprehensive diagnostics and technical control that meet modern safety requirements and regulatory prescriptions.
The quantitative wear characteristics are based on the following regulatory documents and are presented in Table 5:
PB 10-382-00—“Rules for the Design and Safe Operation of Hoisting Cranes” [40];
GOST 3241-91—Interstate Standard “Steel Wire Ropes. Technical Specifications” [41];
GOST 30631-99—Interstate Standard “General Requirements for Machines, Instruments, and Other Technical Products Regarding Resistance to Mechanical Environmental Factors during Operation” [42];
RD 10-112-6-03—“Guidelines for the Examination of Special Metallurgical Cranes” [43].
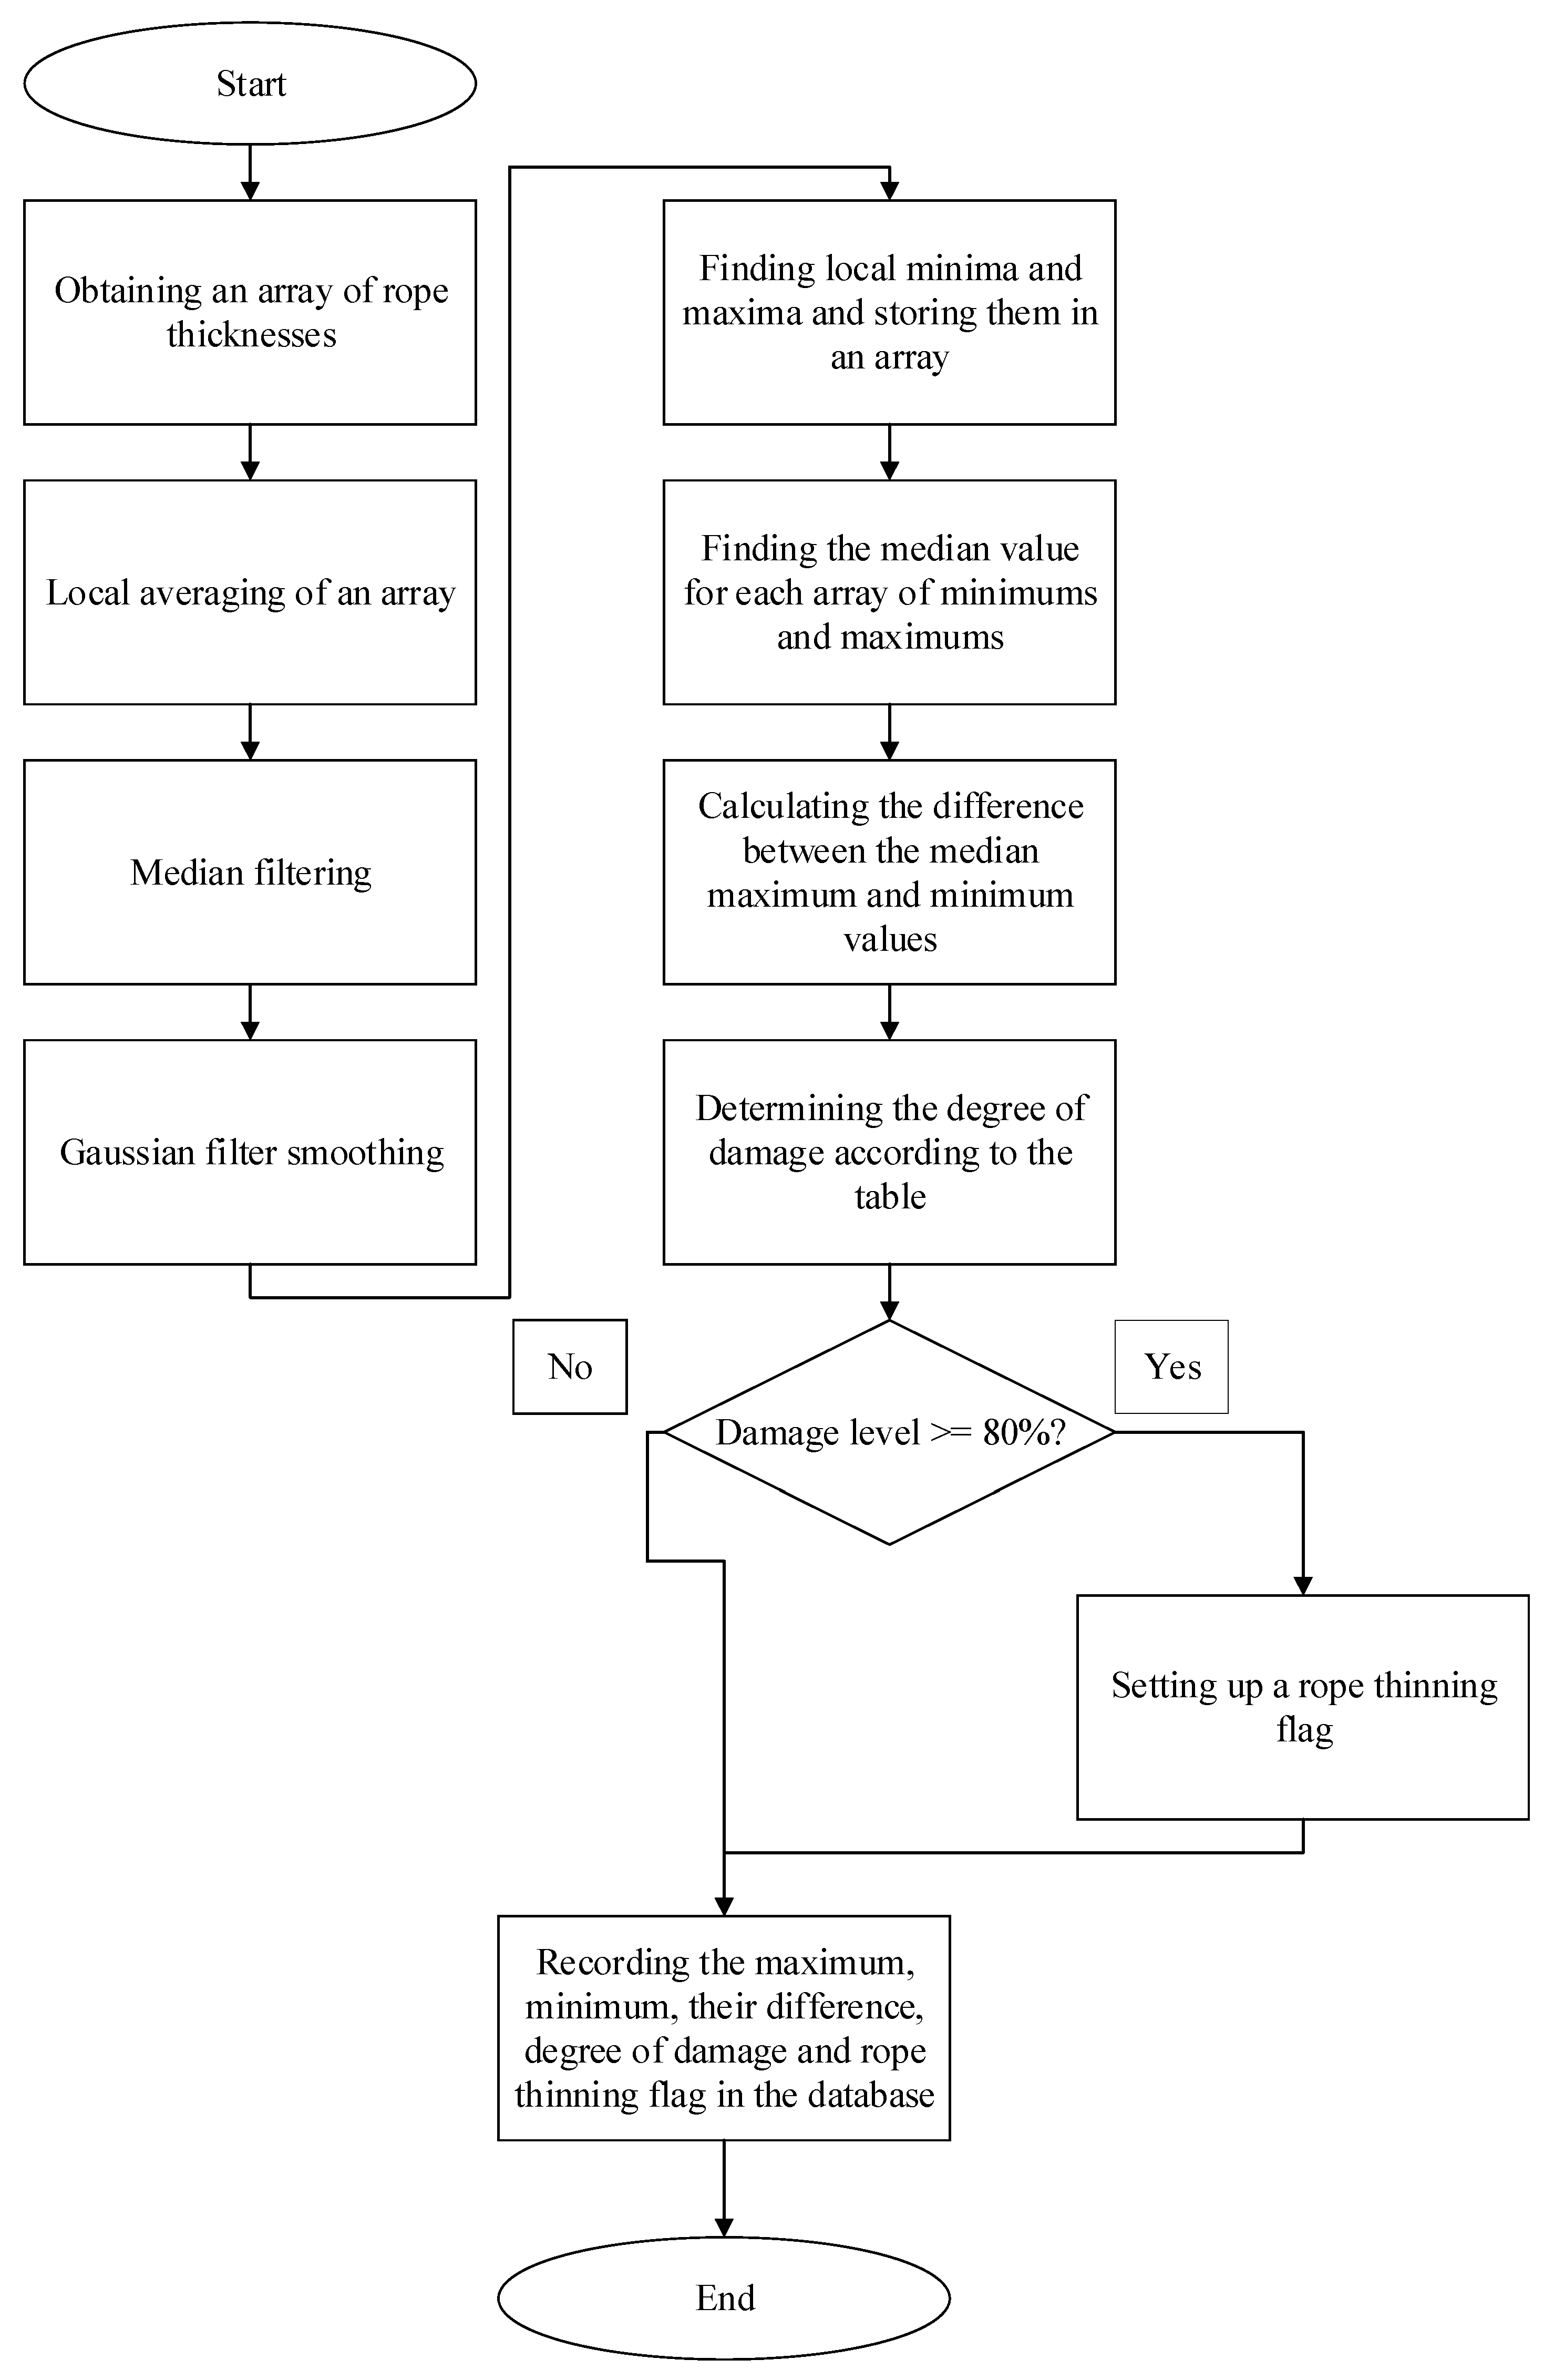
Precisely for this purpose, the following algorithm was developed, which makes it possible to accurately and promptly record the degree of rope thinning, account for permissible wear limits, and integrate the results into a system for assessing the technical condition of wire ropes.
At the input, an array of numbers is supplied, each of which corresponds to the measured relative thickness of the rope at a specific point along its longitudinal profile. First, sharp, isolated deviations from the overall profile caused by noise and glare are removed. To this end, local averaging and median filtering are performed: each value is replaced with a typical value among its nearest neighbors, while preserving large and persistent changes and eliminating small, random outliers. Then the entire rope-thickness trace is smoothed in order to obtain a clearer representation of the global shape of the strands and to eliminate “jaggedness”; smooth smoothing (a Gaussian filter) is applied to reveal the overall trend and facilitate the search for extrema. After smoothing, a search for local minima and maxima along the profile is carried out; after smoothing, a search for local minima (troughs) and maxima (crests) along the profile is carried out—this makes it possible to determine the structure of the strands and to find regions where the thickness decreases sharply—potential thinning locations. In addition, minima or peaks that are too closely spaced are excluded, which simplifies further processing. Next, the mean values of the maxima and minima are calculated, as well as the mean of the maxima and their difference, and these are compared with the reference values recorded on a benchmark rope without damage. On this basis, a conclusion is drawn regarding the suitability of the rope for further operation and the degree of its thinning over the given segment. This algorithm is presented in Figure 10.
For the purposes of objective and timely assessment of the residual service life of steel wire ropes, as well as to eliminate subjective errors during visual inspection, an algorithm was developed that is intended for analyzing the rope’s thickness profile along its entire length. It is aimed at the automatic identification of segments with anomalous thinning that may not be captured during routine regulatory inspections. The algorithm enables precise separation of genuine damage from noise caused by optical effects or measurement errors, reveals regularities in the strand-profile pattern, and performs a comparative analysis against the reference characteristics of a new rope.
For practical application of this approach, a software system based on the proposed algorithm was also implemented. It accepts an array of measured thickness values, processes them, and generates a conclusion regarding the technical condition of the rope. This system provides high accuracy in detecting segments with critical thinning and allows generating reports in a structured form for use in technical documentation and in planning rope replacement. Owing to process automation, stability and reproducibility of results are achieved, which is especially important when operating hazardous equipment [44,45,46].
To verify the operability and accuracy of the developed algorithm for detecting rope thinning, an approbation was conducted on synthetically generated thickness profiles obtained via 3D modeling in the Blender environment.
Five variants of a steel wire rope were modeled:
  • Normal (no defects)
  • With local thinning of 2.5%
  • With local thinning of 5%
  • With local thinning of 7.5%
  • With local thinning of 10%
Thinning was modeled as a reduction in the rope’s scale along two axes whose spanned plane contains the rope’s cross-section.
The algorithm correctly determined the presence and level of the defect in all test cases: for a rope with a modeled diameter of 6 mm, the absolute error in thickness determination was 0.19 mm (5 pixels). Even at a minimal thinning of 2.5%, the deviation from the actual value remained within the permissible range, which confirms the high sensitivity of the algorithm and its robustness to noise.
It should be noted that this error is twice as small as the error characteristic of traditional magnetometric methods (magnetic flux leakage, MFL), where it typically amounts to about 5%. This provides a fundamental advantage: the algorithm enables detection of thinning at earlier stages—when the loss of cross-section has not yet reached critical values—and localizes the damaged segment with greater spatial precision.
Thus, the use of the developed algorithm with high thickness resolution opens the way to a more accurate assessment of the technical condition of ropes and the timely making of decisions on repair or replacement.
Modeling in Blender made it possible to reproduce realistic rope geometry and topology, providing a trustworthy validation of the algorithm on a controlled dataset with a specified thickness, in which the true rope dimensions can be computed thanks to full knowledge of the modeling inputs.
While magnetometric methods (MFL) excel at detecting internal flaws and can be configured for full-length scanning, the proposed optical pipeline provides higher spatial precision for external macroscopic defects and early-stage localized thinning, with lower hardware and computational burden. In hoist maintenance practice, a hybrid schedule is recommended: frequent optical screening during routine operation to localize suspects with encoder coordinates, followed by targeted magnetic inspection of flagged segments. This workflow minimizes downtime while preserving high defect-detection confidence.

4. Conclusions

This study presents an effective and interpretable method for automatic classification of defects in steel wire ropes based on the analysis of one-dimensional thickness profiles extracted from visual images. The proposed approach demonstrates high diagnostic accuracy in detecting macroscopic deformations—such as wire breaks, bends, and kinks—by employing a compact yet informative set of statistical features. In contrast to deep-learning architectures, the method does not require a complex model structure or labor-intensive data annotation, while providing stable accuracy, low computational costs, and ease of integration into industrial machine-vision systems.
The statement on processing speed in this work refers primarily to a comparison with classical vision-based approaches for rope inspection (i.e., frame-based video diagnostics that use full-image processing such as global thresholding, morphology, or frequency-domain filters). In this context, the proposed profile-based pipeline is computationally lighter because it reduces images to a one-dimensional thickness signal before classification. Magnetic inspection techniques are mentioned for completeness; they target a different sensing modality (including internal defects) and are not the baseline for our runtime claims.
Intended operating modes. Although our experiments were conducted on short rope sections, the method itself is agnostic to acquisition length and supports two deployment modes: local imaging of selected areas and continuous image recording on moving ropes. In the continuous mode, each frame (or processed window) is synchronized with an incremental encoder mounted on the hoist drum or sheave, which provides a cumulative length coordinate. As a result, detected events are logged with both timestamps and absolute rope-length positions, enabling continuous monitoring and repeatable localization along the rope.
The experimental results show that variations in thickness along the rope’s longitudinal profile constitute a reliable source of diagnostic information. A CatBoost model built on aggregated features exhibited confident classification performance for the four principal rope conditions. The average accuracy across all classes was about 89%, and for the most critical class—“break”—the F1-score reached 0.92. This indicates high sensitivity of the model to severe mechanical damage characterized by pronounced geometric signatures.
Similar values of precision and recall across classes attest to the model’s balanced behavior: it is not prone to excessive false alarms nor to missed defects. The best results were obtained for recognizing breaks and kinks, which possess characteristic profile structures. Slightly lower figures for the bend and intact classes are explained by their partial visual similarity, which complicates clear separation under conditions of high variability.
From an engineering standpoint, the proposed method has a number of practical advantages: low computational requirements, no dependence on cloud platforms, and the capability for autonomous operation. The model can be deployed on compact devices (e.g., Raspberry Pi or NVIDIA Jetson), making it suitable for use within distributed machine-vision systems, including industrial sites with limited access or high noise levels.
Nevertheless, the current implementation is oriented primarily toward detecting externally observable defects on ropes under laboratory imaging conditions. In industrial environments—where rope surfaces may be contaminated and illumination unstable—the effectiveness of analysis based solely on the thickness profile may decrease. A more reliable solution in such cases is to integrate the method with classical image-processing algorithms, including convolutional neural networks (CNNs). While the current implementation targets externally observable defects and was primarily validated under laboratory imaging, field conditions—variable illumination, grease films, and contamination—can reduce edge contrast and thus challenge purely optical inspection. We therefore clarify mitigation at acquisition time (silhouette illumination, local pre-wipe, adaptive thresholding) and plan a controlled study to quantify how lubricant type/amount and particulate contamination impact thickness-profile fidelity and classification confidence. In parallel, we consider fusing the optical signal with magnetic inspection to decouple surface artifacts from structural thinning.
The developed quantitative analysis method not only demonstrated high accuracy on synthetic data but also offers practical applicability. Its sensitivity to small changes in thickness and its spatial precision exceed the capabilities of traditional magnetometric methods, making it particularly valuable where early diagnosis and precise localization of defects are required. Owing to its digital nature and the possibility of integration with modern visual inspection systems, the approach can be successfully implemented in real industrial practice, providing more reliable and accurate monitoring of the condition of steel wire ropes.
The proposed optical method is therefore complementary to magnetic inspection: while magnetic flux–based techniques are well-suited to detecting internal flaws and are inherently continuous, our approach offers lightweight, high-throughput visual screening of external geometry that can also run continuously with encoder-based localization. In applications requiring maximum coverage, both modalities can be combined to improve confidence and to fuse external-geometry cues with subsurface indications.
In future work, we plan to further develop this study by integrating the described optical diagnostic methods with magnetic inspection techniques. The combination of these two independent information channels will significantly increase the reliability and confidence of defect detection, providing a more comprehensive assessment of the technical condition of steel wire ropes in industrial environments.
The method converts images into engineering decisions tied to rope-type limits (Table 6), supports continuous monitoring on moving ropes with encoder-based localization, and can be deployed on compact edge devices near the head sheave. For mine sites, this translates to: earlier detection of hazardous defects, fewer unplanned stoppages, and tighter planning of rope maintenance and replacement—outcomes directly aligned with Mining’s focus on solving practical challenges in the mining industry.

5. Patents

For the verification of the models and methods, we used data from a database patented in the Russian Federation, which has been granted State Registration of a Database No. RU 2022621454, registered on 20 June 2022; authors: Li Yunpeng (CN), Aleksandr A. Kulchitskiy (RU), and Mikhail Yu. Nikolaev (RU).

Author Contributions

Conceptualization and methodology, A.K.; investigation, software, data curation, M.N.; writing—review and editing, A.K. and M.N.; supervision, A.K. All authors have read and agreed to the published version of the manuscript.

Funding

This research received no external funding.

Data Availability Statement

The original contributions presented in this study are included in the article. Further inquiries can be directed to the corresponding authors.

Conflicts of Interest

The authors declare no conflicts of interest.

References

  1. Mazurek, P.A. Comprehensive Review of Steel Wire Rope Degradation Mechanisms and Recent Damage Detection Methods. Sustainability 2023, 15, 5441. [Google Scholar] [CrossRef]
  2. Quiroz, V.E.; Calvopiña, D. Training of Highly Qualified Specialists in the Field of Software Development: Problems and Solutions in Higher Educational Institutions of Ecuador. ITM Web Conf. 2024, 59, 04008. [Google Scholar] [CrossRef]
  3. Tian, J.; Li, P.; Wang, W.; Ma, J.; Sun, G.; Wang, H. Quantitative Identification of Internal and External Wire Rope Damage Based on VMD-AWT Noise Reduction and PSO-SVM. Entropy 2022, 24, 981. [Google Scholar] [CrossRef] [PubMed]
  4. Li, P.; Cao, G. Wire rope lay length measurement based on DT-CWT. Measurement 2025, 256, 118041. [Google Scholar] [CrossRef]
  5. Maljaars, J.; Misiek, T. Fatigue Resistance of Steel Ropes: Failure Criterion. Steel Constr. 2021, 14, 196–204. [Google Scholar] [CrossRef]
  6. Ilyushin, Y.; Talanov, N. Evelopment of Methods and Models for Assessing Technical Condition of Mines and Underground Structures. Int. J. Eng. 2025, 38, 1659–1666. [Google Scholar] [CrossRef]
  7. Zhou, P.; Zhou, G.; Zhu, Z.; He, Z.; Ding, X.; Tang, C. A Review of Non-Destructive Damage Detection Methods for Steel Wire Ropes. Appl. Sci. 2019, 9, 2771. [Google Scholar] [CrossRef]
  8. Liu, S.; Tan, Q.; Zhang, Y. Shaft Diameter Measurement Using Structured Light Vision. Sensors 2015, 15, 19750–19767. [Google Scholar] [CrossRef]
  9. Wang, W.; Yang, H.; Chen, Y.; Huang, X.; Cao, J.; Zhang, W. Motion Analysis of Wire Rope Maintenance Device. Actuators 2023, 12, 392. [Google Scholar] [CrossRef]
  10. Gong, R.; Wang, Y.; Zhou, F.; Tang, B. Lubricating Grease Thickness Classification of Steel Wire Rope Surface Based on GEMR-MobileViT. Sensors 2025, 25, 2738. [Google Scholar] [CrossRef]
  11. Rani, A.; Ortiz-Arroyo, D.; Durdevic, P. A Survey of Vision-Based Condition Monitoring Methods Using Deep Learning: A Synthetic Fiber Rope Perspective. Eng. Appl. Artif. Intell. 2024, 136, 108921. [Google Scholar] [CrossRef]
  12. Skamyin, A.; Shklyarskiy, Y.; Lobko, K.; Dobush, V.; Sutikno, T.; Hatta, M.J. Impedance Analysis at High Harmonics. Indones. J. Electr. Eng. Comput. Sci. 2024, 33, 31–41. [Google Scholar] [CrossRef]
  13. Shklyarskiy, Y.E.; Lobko, K.K.; Kuznetsova, Y.N.; Vorobyev, M.S. Investigation of the Composite Motor Load in the Presence of Higher Harmonics in the Electrical Network. ENERGETIKA Proc. CIS High. Educ. Inst. Power Eng. Assoc. 2024, 67, 285–299. [Google Scholar] [CrossRef]
  14. Chazhoor, A.A.P.; Ho, E.S.L.; Gao, B.; Woo, W.L. A Review and Benchmark on State-of-the-Art Steel Defects Detection. SN Comput. Sci. 2024, 5, 114. [Google Scholar] [CrossRef]
  15. Bolshunov, A.V.; Ignatev, S.A.; Gorelik, G.D.; Krikun, N.S.; Vasilev, D.A.; Rakitin, I.V.; Shadrin, V.S. Comprehensive Studies of the Snow-Firn Layer in the Area of the Russian Antarctic Vostok Station. J. Min. Inst. 2025, 273, 52–64. [Google Scholar]
  16. Bolshunov, A.V.; Vasilev, D.A.; Dmitriev, A.N.; Ignatev, S.A.; Kadochnikov, V.G.; Krikun, N.S.; Serbin, D.V.; Shadrin, V.S. Results of Complex Experimental Studies at Vostok Station in Antarctica. J. Min. Inst. 2023, 263, 724–741. [Google Scholar]
  17. Ibrahim, A.A.M.S.; Tapamo, J.-R. A Survey of Vision-Based Methods for Surface Defects’ Detection and Classification in Steel Products. Informatics 2024, 11, 25. [Google Scholar] [CrossRef]
  18. Tchatchoua, P.; Graton, G.; Ouladsine, M.; Christaud, J.-F. Application of 1D ResNet for Multivariate Fault Detection on Semiconductor Manufacturing Equipment. Sensors 2023, 23, 9099. [Google Scholar] [CrossRef]
  19. Al-Selwi, S.M.; Hassan, M.F.; Abdulkadir, S.J.; Muneer, A.; Sumiea, E.H.H.; Alqushaibi, A.; Ragab, M.G. RNN-LSTM: From Applications to Modeling Techniques and Beyond—Systematic Review. J. King Saud Univ. Comput. Inf. Sci. 2024, 36, 102068. [Google Scholar] [CrossRef]
  20. Yang, T.; Li, J. Steel Surface Defect Detection Based on SSAM-YOLO. Int. J. Inf. Technol. Syst. Approach 2023, 16, 1–13. [Google Scholar] [CrossRef]
  21. Pardo, F.R.O.; Herrera, J.A.P.; Perez, M.C.R.; Cabascango, V.E.Q.; Urbano, A.P.M. Scientific Fundamentals for the Use of Serpentinized Rocks from the Eastern Region of Cuba. J. Phys. Conf. Ser. 2023, 2573, 012033. [Google Scholar] [CrossRef]
  22. Dey, D.; Haque, M.S.; Islam, M.M.; Aishi, U.I.; Shammy, S.S.; Mayen, M.S.A.; Noor, S.T.A.; Uddin, M.J. The proper application of logistic regression model in complex survey data: A systematic review. BMC Med. Res. Methodol. 2025, 25, 15. [Google Scholar] [CrossRef] [PubMed]
  23. Simakov, A.S.; Trifonova, M.E.; Gorlenkov, D.V. Virtual Analyzer of the Voltage and Current Spectrum of the Electric Arc in Electric Arc Furnaces. Russ. Metall. (Met.) 2021, 6, 713–719. [Google Scholar] [CrossRef]
  24. Shao, Z.; Ahmad, M.N.; Javed, A. Comparison of Random Forest and XGBoost Classifiers Using Integrated Optical and SAR Features for Mapping Urban Impervious Surface. Remote Sens. 2024, 16, 665. [Google Scholar] [CrossRef]
  25. Amaya-Tejera, N.; Gamarra, M.; Vélez, J.I.; Zurek, E. A Distance-Based Kernel for Classification via Support Vector Machines. Front. Artif. Intell. 2024, 7, 1287875. [Google Scholar] [CrossRef] [PubMed]
  26. Wang, D.; Qian, H. CatBoost-Based Automatic Classification Study of River Network. ISPRS Int. J. Geo-Inf. 2023, 12, 416. [Google Scholar] [CrossRef]
  27. Mordia, R.; Verma, A.K. Visual Techniques for Defects Detection in Steel Products: A Comparative Study. Eng. Fail. Anal. 2022, 134, 106047. [Google Scholar] [CrossRef]
  28. El Hiouile, L.; Errami, A.; Azami, N. Toward Automatic Monitoring for Anomaly Detection in Open-Pit Phosphate Mines Using Artificial Vision: A Case Study of the Screening Unit. Mining 2023, 3, 645–658. [Google Scholar] [CrossRef]
  29. Cheremisina, O.V.; Balandinsky, D.A.; Gorbacheva, A.A.; Lysenko, M.R.; Yinzhou, L. Physicochemical Features of Action of Ethoxylated Esters of Phosphoric Acid with Different Degree of Ethoxylation in Conditions of Froth Flotation of Apatite. Colloids Surf. A Physicochem. Eng. Asp. 2024, 708, 135974. [Google Scholar] [CrossRef]
  30. Li, Z.; Wei, X.; Hassaballah, M.; Li, Y.; Jiang, X. A Deep Learning Model for Steel Surface Defect Detection. Complex Intell. Syst. 2024, 10, 885–897. [Google Scholar] [CrossRef]
  31. Bratskikh, D.S.; Romasheva, N.V.; Konopelko, A.Y.; Nikolaychuk, L.A. Model of Supply Chain Management in the Oil and Gas Industry Using Digital Technologies. Oil Ind. 2024, 7, 120–125. [Google Scholar] [CrossRef]
  32. Cacciari, I.; Ranfagni, A. Hands-On Fundamentals of 1D Convolutional Neural Networks—A Tutorial for Beginner Users. Appl. Sci. 2024, 14, 8500. [Google Scholar] [CrossRef]
  33. Lama, B.; Momayez, M. Review of Non-Destructive Methods for Rock Bolts Condition Evaluation. Mining 2023, 3, 106–120. [Google Scholar] [CrossRef]
  34. El Hiouile, L.; Errami, A.; Azami, N. Towards Mine 4.0: A Proposed Multi-Layered Architecture for Real-Time Surveillance and Anomaly Detection in an Open-Pit Phosphate Mine. Mining 2024, 4, 672–686. [Google Scholar] [CrossRef]
  35. Peng, Y.; Liu, J.; He, J.; Qiu, Y.; Liu, X.; Chen, L.; Yang, F.; Chen, B.; Tang, B.; Wang, Y. Steel Wire Rope Damage Width Identification Method Based on Residual Networks and Multi-Channel Feature Fusion. Machines 2024, 12, 744. [Google Scholar] [CrossRef]
  36. Beloglazov, I.; Plaschinsky, V. Development MPC for the Grinding Process in SAG Mills Using DEM Investigations on Liner Wear. Materials 2024, 17, 795. [Google Scholar] [CrossRef] [PubMed]
  37. Semykina, I.Y.; Kipervasser, M.V.; Gerasimuk, A.V. Study of Drive Currents for Lifting Bridge Cranes of Metallurgical Enterprises for Early Diagnosis of Load Excess Weight. J. Min. Inst. 2021, 247, 122–131. [Google Scholar] [CrossRef]
  38. Chen, J.; Wang, Y.; Liu, S.; Ji, Z. Non-Destructive Testing of Wire Rope Algorithm Based on Lightweight YOLOv7-Tiny. In Proceedings of the International Conference on Algorithms, Software Engineering, and Network Security (ASENS 2024), Nanchang, China, 26–28 April 2024. [Google Scholar] [CrossRef]
  39. Yujra Rivas, E.; Vyacheslavov, A.; Gogolinskiy, K.V.; Sapozhnikova, K.; Taymanov, R. Deformation Monitoring Systems for Hydroturbine Head-Cover Fastening Bolts in Hydroelectric Power Plants. Sensors 2025, 25, 2548. [Google Scholar] [CrossRef]
  40. PB 10-382-00; Rules for the Design and Safe Operation of Hoisting Cranes. NPO OBT: Moscow, Russia, 2001.
  41. GOST 3241-91; Steel Wire Ropes. Technical Specifications. IPK Izdatelstvo Standartov: Moscow, Russia, 1993.
  42. GOST 30631-99; General Requirements for Machines, Instruments, and Other Technical Products Regarding Resistance to Mechanical Environmental Factors during Operation. State Committee of the Russian Federation for Standardization and Metrology: Moscow, Russia, 1999.
  43. RD 10-112-6-03; Guidelines for the Examination of Special Metallurgical Cranes. ZAO Ural Expert Center: Ekaterinburg, Russia, 2003.
  44. Zhou, M.; Lu, W.; Xia, J.; Wang, Y. Defect Detection in Steel Using a Hybrid Attention Network. Sensors 2023, 23, 6982. [Google Scholar] [CrossRef]
  45. Chu, Y.; Yu, X.; Rong, X. A Lightweight Strip Steel Surface Defect Detection Network Based on Improved YOLOv8. Sensors 2024, 24, 6495. [Google Scholar] [CrossRef]
  46. Ma, Y.; Yin, J.; Huang, F.; Li, Q. Surface Defect Inspection of Industrial Products with Object Detection Deep Networks: A Systematic Review. Artif. Intell. Rev. 2024, 57, 333. [Google Scholar] [CrossRef]
Figure 1. Examples of diagnostic categories represented in the dataset. For each class: real image (left) and corresponding synthetic rendering (right). (a) No defect; (b) Wire break; (c) bend; (d) Kink.
Mining 05 00079 g001
Figure 2. Wire break: example of eight viewing angles.
Mining 05 00079 g002
Figure 3. Representative images of the kink defect.
Mining 05 00079 g003
Figure 4. Representative images of the bend defect.
Mining 05 00079 g004
Figure 5. Optical diagnostic algorithm for steel wire rope defects based on cross-sectional thickness profiles.
Mining 05 00079 g005
Figure 6. CatBoost classification.
Mining 05 00079 g006
Figure 7. Results of processing synthetic rope images. (a) original image, (b) preprocessed binary image, (c) extracted thickness profile along the rope length.
Mining 05 00079 g007
Figure 8. Results of processing real rope images. (a) raw image; (b) processed image with detected edges; (c) cross-sectional thickness profile.
Mining 05 00079 g008
Figure 9. Normalized confusion matrix for the predictions of the CatBoost model.
Mining 05 00079 g009
Figure 10. Algorithm for determining the degree of thinning.
Mining 05 00079 g010
Table 1. Comparative performance across key criteria (qualitative).
ModelRobustness to NoiseInference SpeedHardware Requirements
1D CNNMediumModerate-speedMedium
1D ResNetHighLow-speedHigh
LSTM/BiLSTMMediumLow-speedHigh
TransformerHighComputationally intensiveVery High
MLPLowHigh-speedLow
Logistic RegressionLowHigh-speedLow
SVMMediumModerate-speedMedium
Random ForestHighModerate-speedLow
CatBoostHighModerate-speedLow
Table 2. CatBoost model training parameters.
FeatureImportance (Prediction Values Change)
max27.96
std27.95
sum26.23
mean13.89
min4.00
prod0.00
Table 3. Representative thickness-profile patterns for common types of defects in steel wire ropes.
Defect TypeVisual CharacteristicsThickness-Profile Pattern
Intact (No Defects)Uniform structure, homogeneous illumination, absence of artifactsStable line with fluctuations within 5–10% of the mean value
KinkSharp constriction, visible ruptures, disruption of wire layPeak or dip up to 30%, abrupt transitions
BendSmooth curvature, asymmetry of strandsSlow oscillations, amplitude up to 15%, no pronounced peaks
BreakWire rupture, fragments, zero thickness in individual segmentsDrop to zero, unstable shape, asymmetry
Table 4. Classification performance metrics by steel wire rope condition class.
Rope ConditionROC AUCF1-ScorePrecisionRecallBalanced Accuracy
Break0.960.920.910.930.93
Kink0.940.890.880.890.90
Bend0.910.860.840.870.88
Intact (No Defects)0.920.870.850.890.88
Table 5. Classification rope detection.
Type RopeUniform Reduction in Rope Diameter (% of Nominal Diameter)Degree Damage%
Single-layer rope with organic coreLess than 6%0
From 6% to 7%Small20
From 7% to 8%Average40
From 8% to 9%High60
From 9% to 10%Very high80
10% or moreCulling100
Single-layer rope with a steel core or single-layer ropeLess than 3.5%0
From 3.5% to 4.5%Small20
From 4.5% to 5.5%Average40
From 5.5% to 6.5%High60
From 6.5% to 7.5%Very high80
7.5% or moreCulling100
Unspinning ropeLess than 1%0
From 1% to 2%Small20
From 2% to 3%Average40
From 3% to 4%High60
Table 6. Thinning measurement error as a function of the actual thinning.
Real ThinningClassification DefectError (in Pixels)Absolute Error
(mm)
Relative Error
(%)
0%norm40.152.5
2.5%lung thinning30.111.9
5%average thinning40.152.5
7.5%moderate-severe50.192.5
10%heavy thinning30.112
Disclaimer/Publisher’s Note: The statements, opinions and data contained in all publications are solely those of the individual author(s) and contributor(s) and not of MDPI and/or the editor(s). MDPI and/or the editor(s) disclaim responsibility for any injury to people or property resulting from any ideas, methods, instructions or products referred to in the content.