Article

Influence of Phased Cover Placement on the Acid-Generating Main Waste Stockpile at the Red Dog Mine, Alaska, USA

1
Department of Earth and Spatial Sciences, University of Idaho, Moscow, ID 83844, USA
2
Department of Chemical and Biological Engineering, University of Idaho, Moscow, ID 83844, USA
3
Department of Forest, Rangeland and Fire Sciences, University of Idaho, Moscow, ID 83844, USA
4
Tailings & Water, Red Dog Operations, Teck Alaska Incorporated, Red Dog Mine, Anchorage, AK 99503, USA
*
Author to whom correspondence should be addressed.
Mining 2025, 5(4), 74; https://doi.org/10.3390/mining5040074
Submission received: 16 August 2025 / Revised: 18 October 2025 / Accepted: 3 November 2025 / Published: 7 November 2025
(This article belongs to the Special Issue Feature Papers in Sustainable Mining Engineering)

Abstract

With the weathering of iron sulfide minerals, acid rock drainage (ARD) emanates from the 60-millon tonne Main Waste Stockpile (MWS) at the Red Dog Mine. Following completion of the stockpile, a collection trench was constructed in 2012–2013 to capture and treat a portion of the ARD, and a cover system was emplaced from 2021 to 2025 to cover 90% of the stockpile. Select wells in the collection trench are associated with the different cover phases. Analysis of the water chemistry of samples collected at the wells indicates increased pH and decreased dissolved solids with each phase of the cover along with significant changes in flow and solutes such as aluminum, iron, sulfate, and zinc. Although the cover should continue to decrease ARD volume, acidity, and solute concentrations, an evaluation of historical acid production and iron sulfide consumption in the stockpile indicates a likely majority of the iron sulfide content remains available for weathering and acid production. Continued MWS ARD monitoring is necessary to evaluate the multi-year effect of the cover because of the variability of the pre-cover ARD, identification of seasonal and multi-year precipitation influences on ARD generation, and a yet to be determined influence of the cover on the volume of infiltrating precipitation.

1. Introduction

Since 1989, Teck Resources has extracted high-grade, argentiferous sphalerite-galena at the Red Dog Mine in the De Long Mountains of the western Brooks Range in Alaska (Figure 1). The acid-generating waste rock from mining of the massive sulfide deposit at the Main Pit (mined from 1989 to 2012) and the Aqqaluk Pit (mined from 2010 onward) was consolidated at the Main Waste Stockpile (MWS) adjacent to the site’s Tailings Storage Facility (TSF) (Figure 1). The completed MWS is composed of about 60 million tonnes of waste rock, covers approximately 55 hectares, and is exposed to variable weathering in this subarctic climate (Köppen classification (Dwc) with cold, long winters and warm, short summers. The weathering of iron sulfide minerals in the MWS has resulted in the release of acid rock drainage (ARD) along the toe of the MWS and into the TSF [1]. The entrance of ARD (pH as low as 1.2 and dissolved solids concentration up to 130,000 mg/L) into the TSF has influenced the mine’s ability to discharge water to the environment. To reduce ARD generation, a cover system was tested in 2016 and emplaced from 2021 to 2025 to cover 90% of the stockpile. The goal of this study is to conduct a historical evaluation of the ARD emanating from the MWS to understand the temporal changes in the water chemistry and the influence of the separate phases of the MWS cover. Identification of the cover influence and changes to ARD will assist with Teck Resource’s continual risk assessment and planning efforts to reduce ARD and its influence on ongoing operations and closure planning.
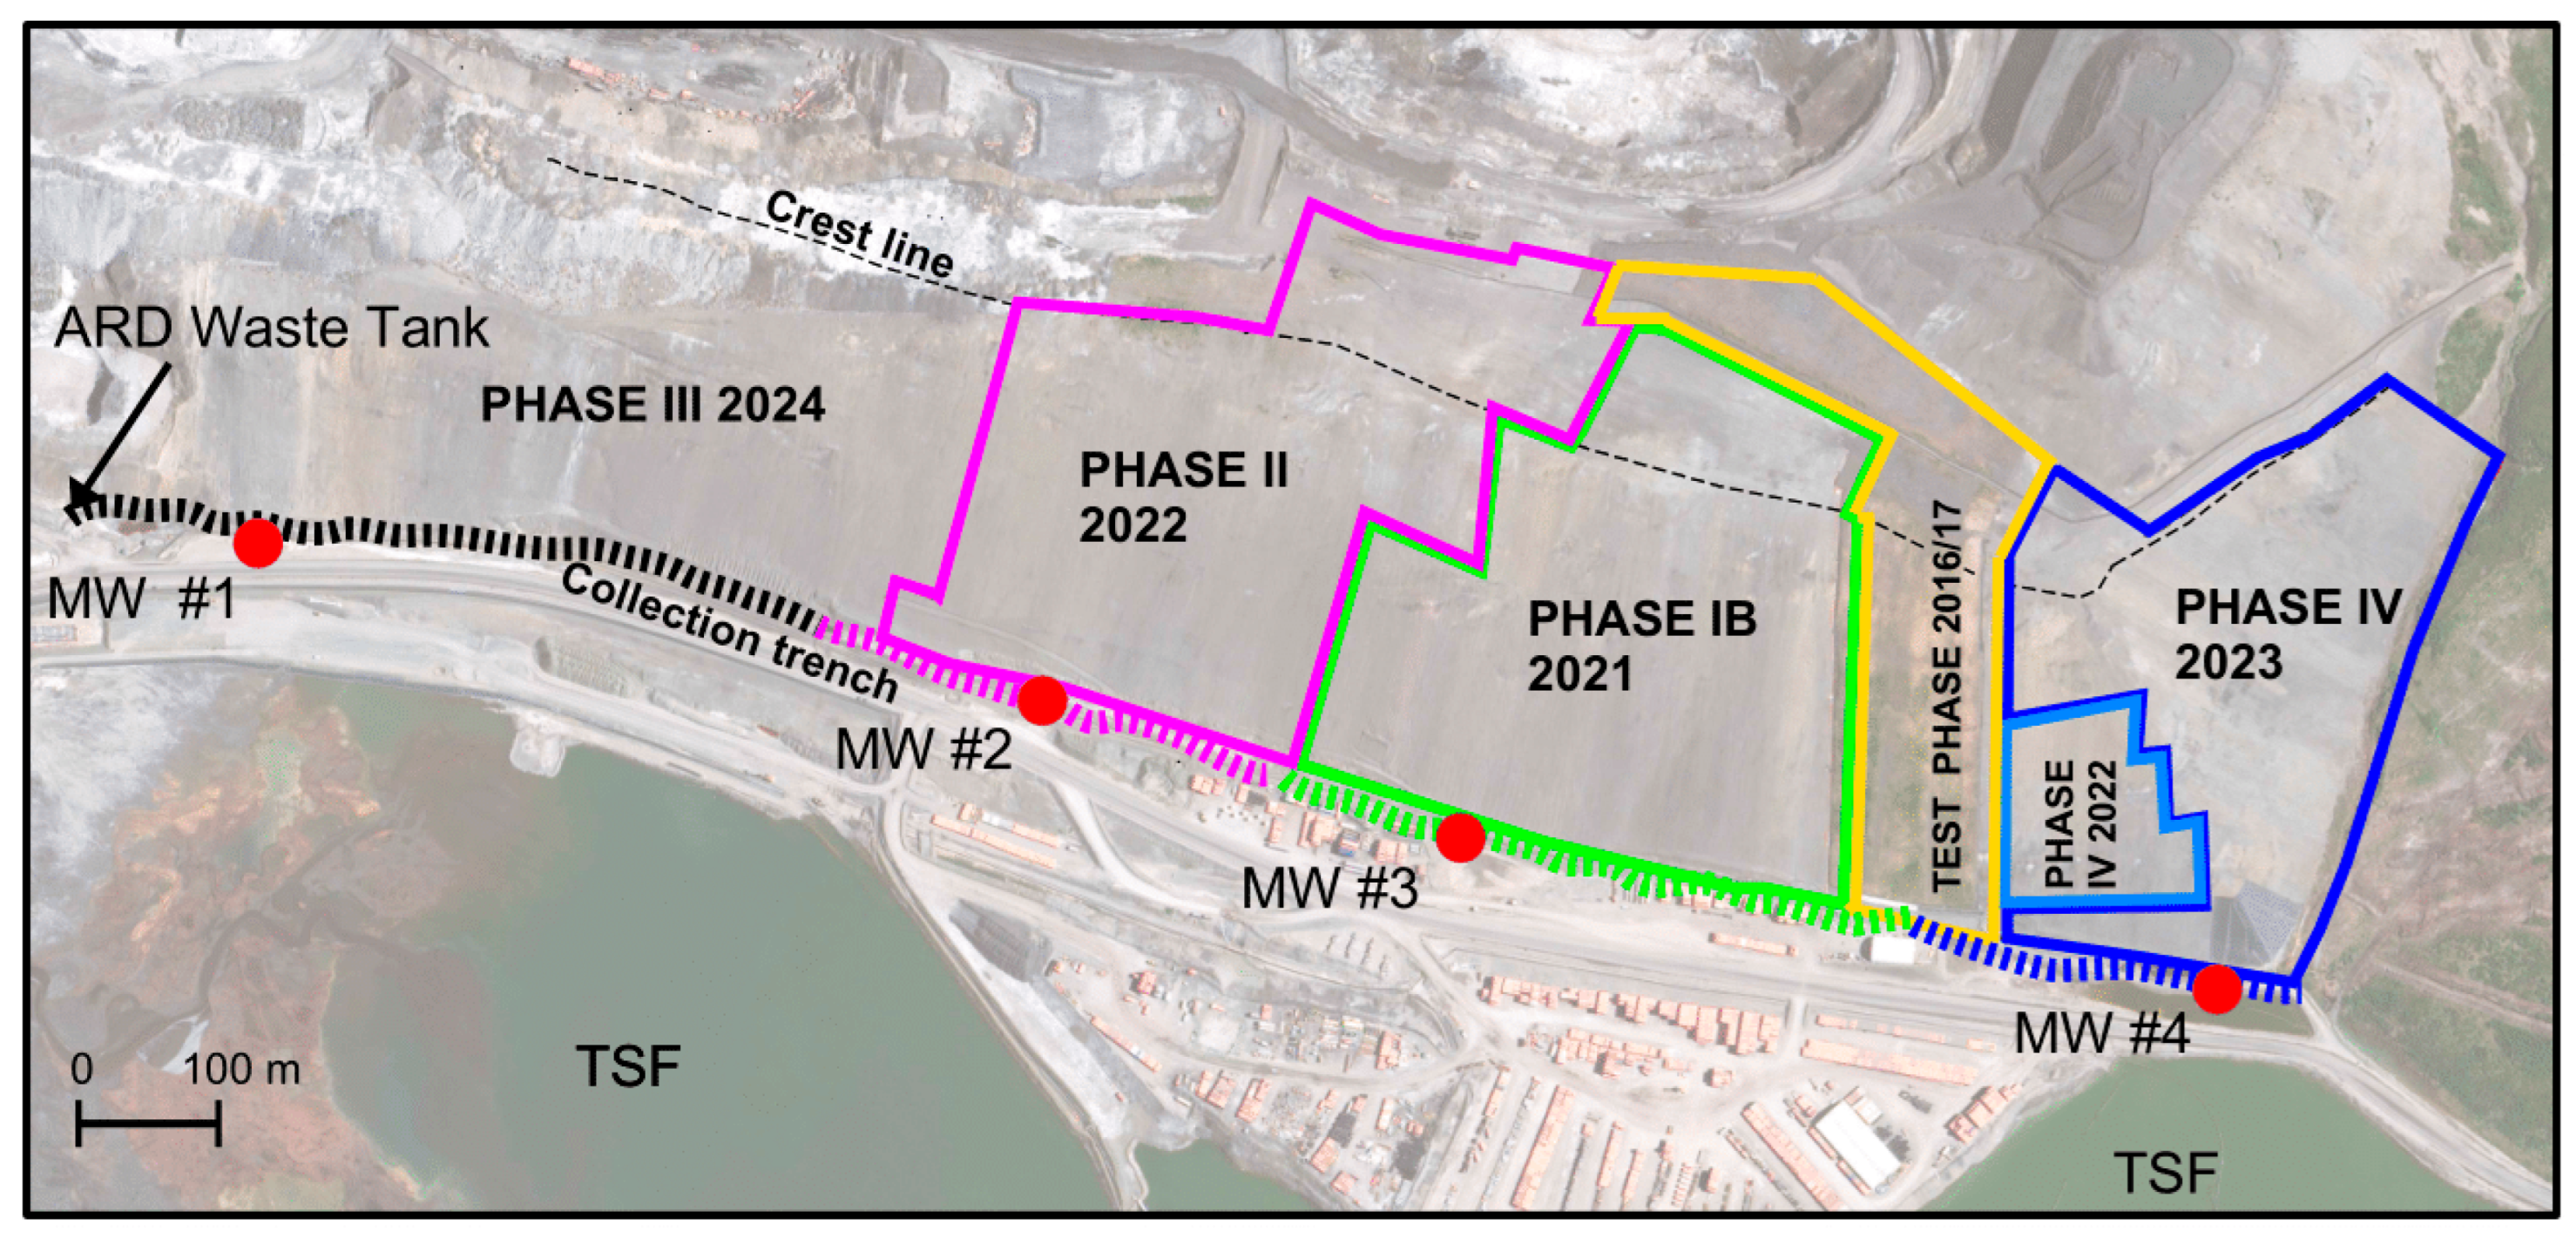
To lessen the impact of ARD on TSF water chemistry, a collection trench about 1100 m in length and up to 8 m in depth was completed along the toe of the MWS in 2013, which consisted of excavating into the weathered/fractured shale bedrock, lining with a geotextile fabric, and backfilling with coarse rock. The collection trench, which consists of four segments (Figure 2) associated with likely primary groundwater flowpaths that follow historical surface drainages [2], collects ARD from the shallow subsurface and seeps along the toe of the MWS. Each trench segment is drained by a collection pump in a shallow well (Figure 2) for diversion of the ARD to a composite ARD Tank and subsequently to water treatment facilities. Monthly water chemistry samples have been collected at each pump location and at the ARD Tank since completion of the collection trench. Prior investigations estimated peak drainage after the spring snowmelt [3] with the trench able to collect 60% to 80% of the annual ARD emanating from the pile [4].
Following completion of the MWS in 2012, Teck Resources initiated a phased placement of a stockpile cover (Figure 2 and Figure 3) that now overlays approximately 90% of the MWS. The cover consists of a geomembrane overlain by drainage aggregate and associated piping plus a top cover material from locally sourced waste rock (non-acid generating) [5]. The goal of the cover and associated protective layer (local soil and unmineralized shale and native grass seeding) is to lessen precipitation infiltration and reduce ARD generation. Monitoring of the test cover emplaced in 2016/2017 indicated that the moisture content below the cover decreased to <5% (mass/mass) compared to the above-cover moisture content, which ranged from 2% to 15% [5]. As part of a larger study into the remaining acid-generating potential of the MWS, this current study evaluated the water chemistry of the ARD collected at the MWS wells for temporal trends indicative of the effect of the phased cover placement. Additionally, the water chemistry of the combined discharge from the MWS wells (MW #1 to MW #4) at the ARD Tank was evaluated for seasonal trends indicative of the stepped influence of the cover and temporal changes indicative of the evolution of iron sulfide weathering and ARD generation.

Red Dog Geology and Acidic Drainage

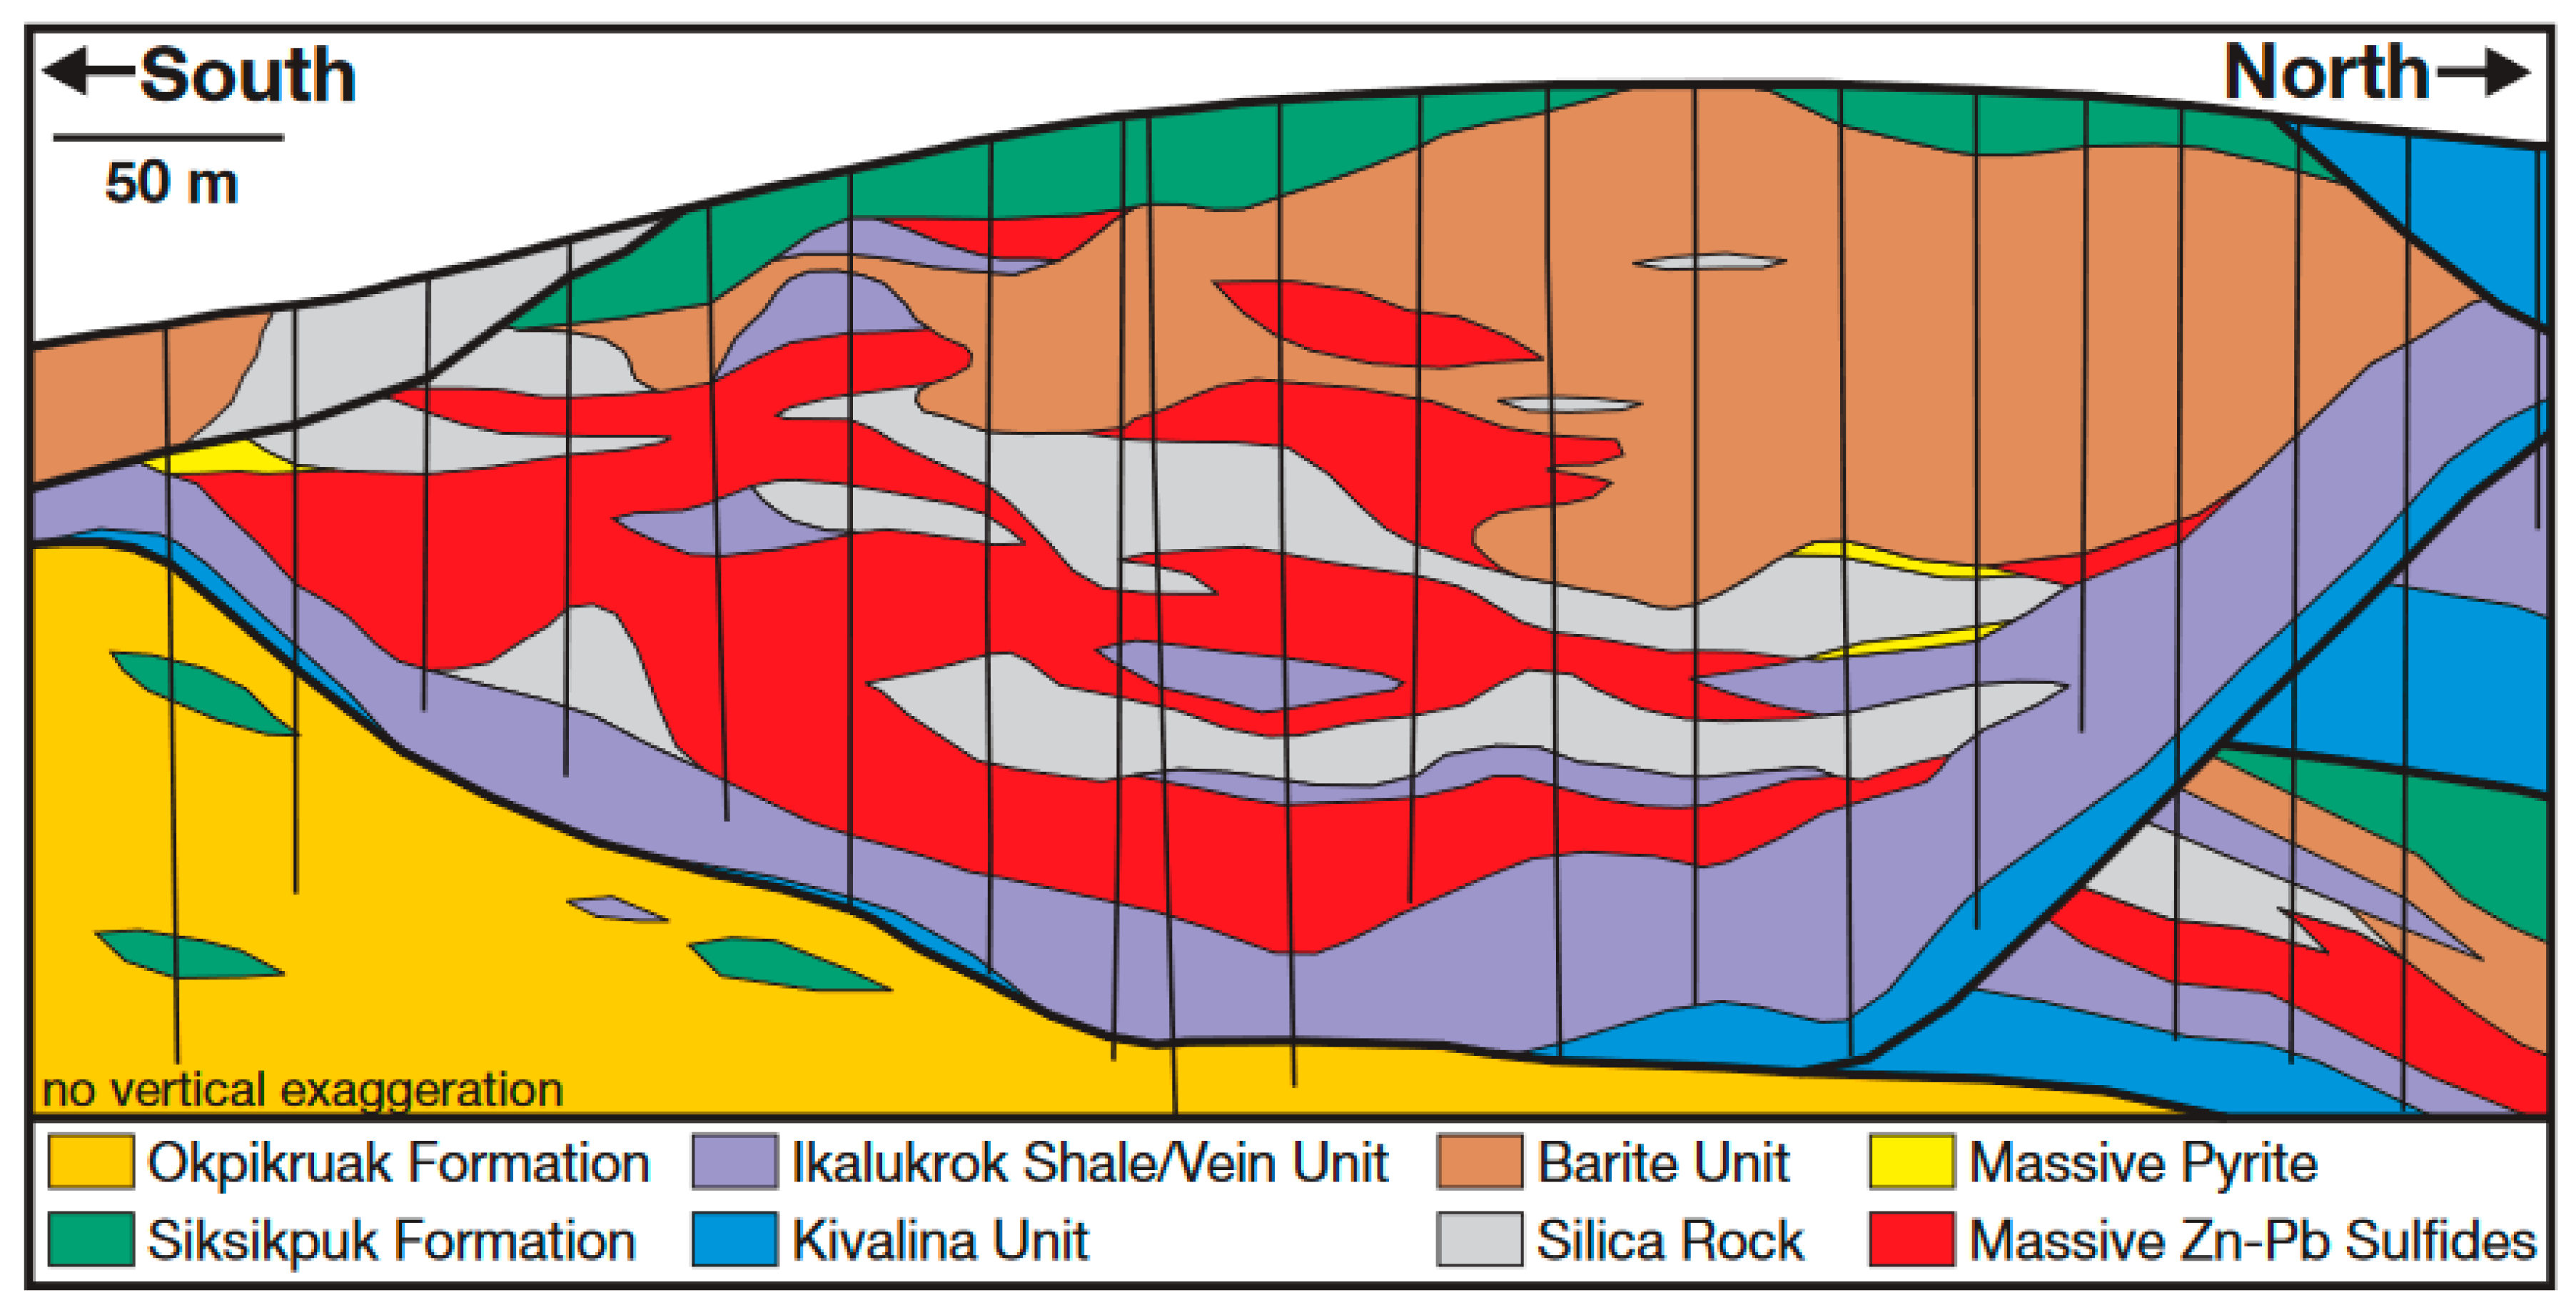
The Red Dog ore is hosted in Mississippian-Pennsylvanian black shales of the Kuna Formation of the Lisburne Group [6]. The target mineralized zones are referred to as the Main, Aqqaluk, Qanaiyaq, and Paalaa deposits (associated pit names) in the Ikalukrok unit [7] (Figure 4), which is a massive and unbedded deposit with disseminated sulfide grains and aggregates [8]. The mineralized deposit consists of a sulfide-bearing barite [BaSO4] located above interlayered zones of silicified barite, sulfidic shale, and a massive sulfide unit overlying a silicified black shale with abundant sulfide veins [7]. Major sulfide minerals, in decreasing order of abundance, include sphalerite [(Zn,Fe)S], pyrite [FeS2 (cubic)], marcasite [FeS2 (orthorhombic)], and galena [PbS]. The pyrite and marcasite are common throughout the ore body [8]. The sphalerite is estimated to contain up to 20% of the total Fe in the deposit, and Fe composes 6.6% of the ore body [6].
The waste rock generated from the Main Pit and Aqqaluk Pit that compose the MWS contains substantial Fe [1] and significant FeS2 (pyrite/marcasite) content [9]. The waste rock consists of barite, black shale, and silicified barite with quartz intrusions, but sulfide minerals as veins, clasts, laminations, and/or nodules were present throughout all mined units that produced the waste rock [7]. Although substantial carbonate units are adjacent to the mined areas, carbonate minerals are limited in the ore/waste rock units because of dissolution and replacement during hydrothermal intrusions that emplaced the massive sulfide deposit (sedimentary exhalative deposit) and associated silicification [7,8]. Pyrite is the dominant FeS2 mineral and can be present as meter-thick units and as clasts and veins [8]. The high FeS2 zones consist of banded to nodular pyrite and marcasite, which decrease in concentration moving away from the sphalerite-galena core [7]. Pre-mining weathering of the sulfide minerals only penetrated up to 20 m below the surface, primarily driven by fracture flow in the upper shale unit, with numerous byproducts, including substantial melanterite [FeSO4·7H2O] and elemental sulfur [8].
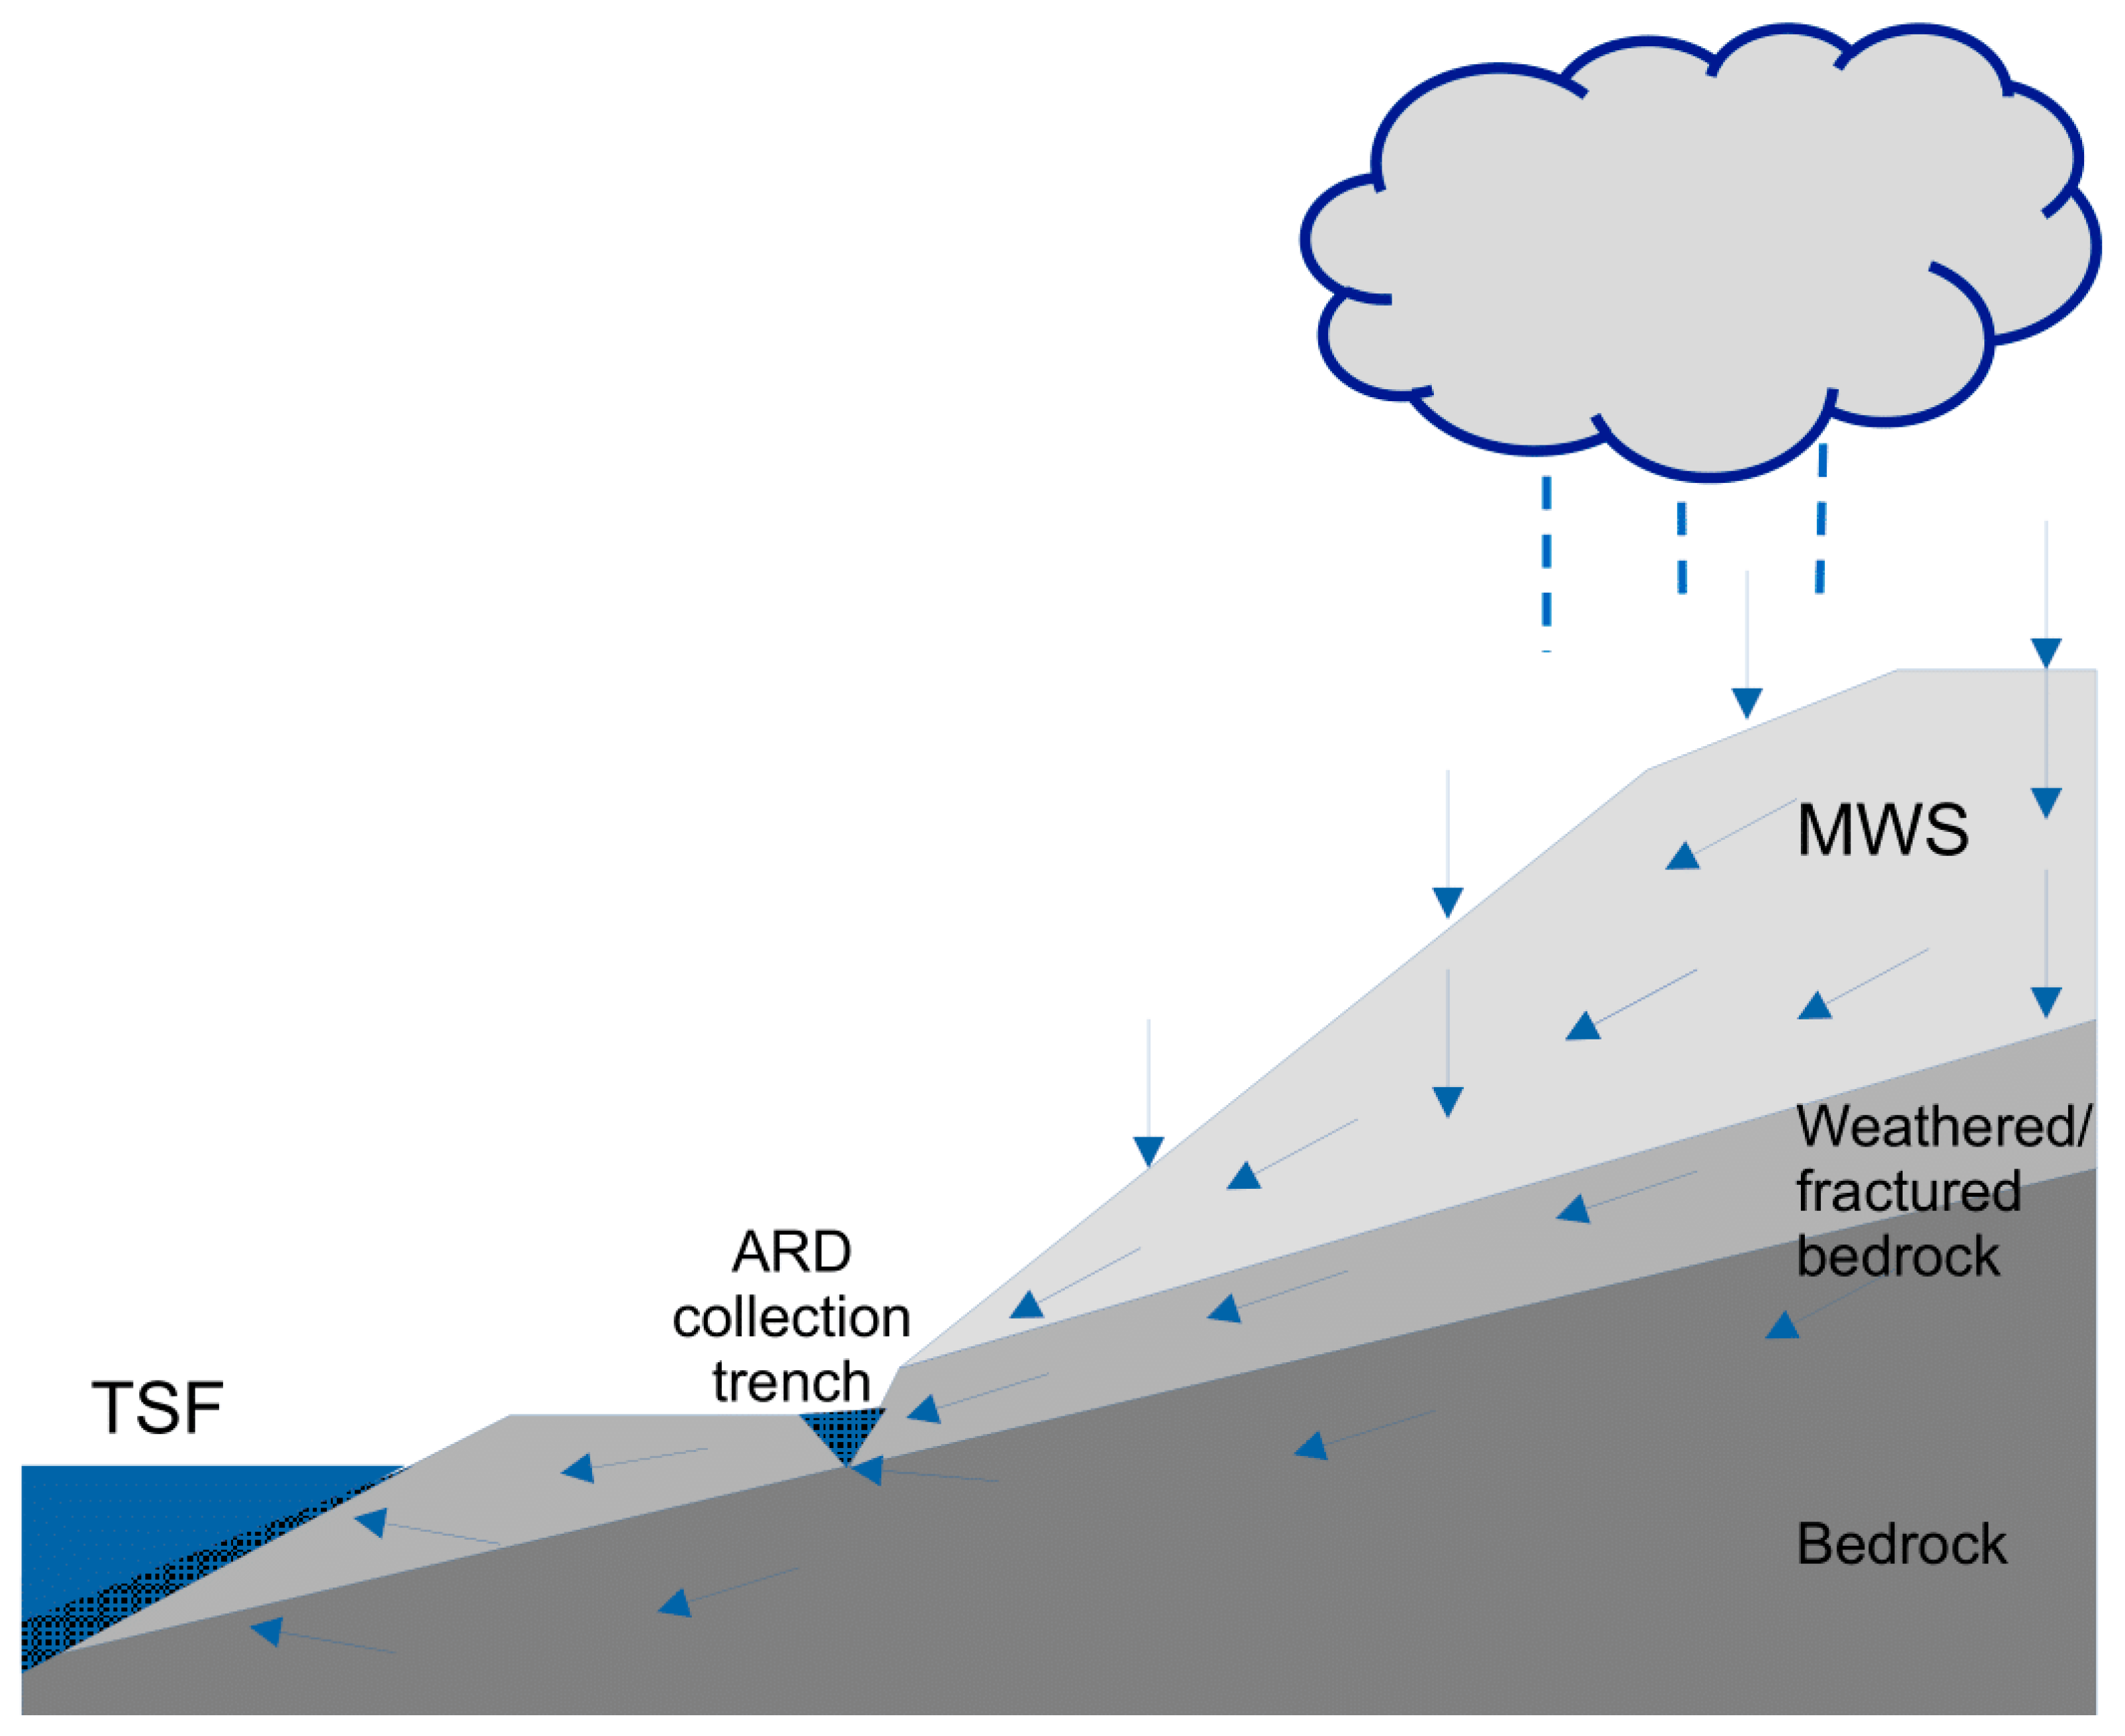
The MWS contains substantial waste rock from the Siksikpuk shale, which contains >3% FeS2 and a net neutralization potential of −91 kg CaCO3/t [10]. Other shale waste rock, such as the Ikalukrok shale, also contains substantial FeS2. The large content of the Siksikpuk waste rock in the MWS (19% of waste rock generated), along with the potential of large FeS2 clasts and veins in other units, results in substantial net acid production with weathering of the MWS [11]. The discharge of ARD from the MWS is driven by infiltrating precipitation atop the pile and a potential lower zone of groundwater above and in the underlying Okpikruak shale. The bedrock Okpikruak shale was initially frozen (e.g., permafrost) prior to construction of the MWS, but the shale has thawed because of the heat generated within the stockpile from sulfide oxidation [1]. The monitoring of groundwater at the toe of the MWS has indicated the largest ARD volumes occur from May through November [3] and that much of the ARD might be a result of the spring freshet and large rainfall events (Figure 5). Additionally, there may be sufficient infiltration and percolation and upgradient groundwater to saturate the lowest layer of MWS, which may drive ARD along the weathered bedrock [3]. The goal of the cover is to reduce water content in the MWS and reduce the volume of ARD discharging to the collection trench and TSF. The potential reduction of water content can lessen the volume and acidity of ARD by limiting the oxidation reaction of solution O2 and the sulfide minerals, given the substantially higher effectiveness of solution O2 initiating the oxidation reaction compared to soil air O2 [12]. The rate-limiting steps of ARD generation typically are the O2 adsorption and oxidation rate of the pyrite surface and the oxidation rate of Fe2+ [13,14], where a supply of oxygenated water to the pyrite surface is necessary to sustain pyrite oxidation (e.g., O2 dissociation adsorption), Fe2+ oxidation (Fe2+–Fe3+ cycling), and acid generation [15,16,17,18].
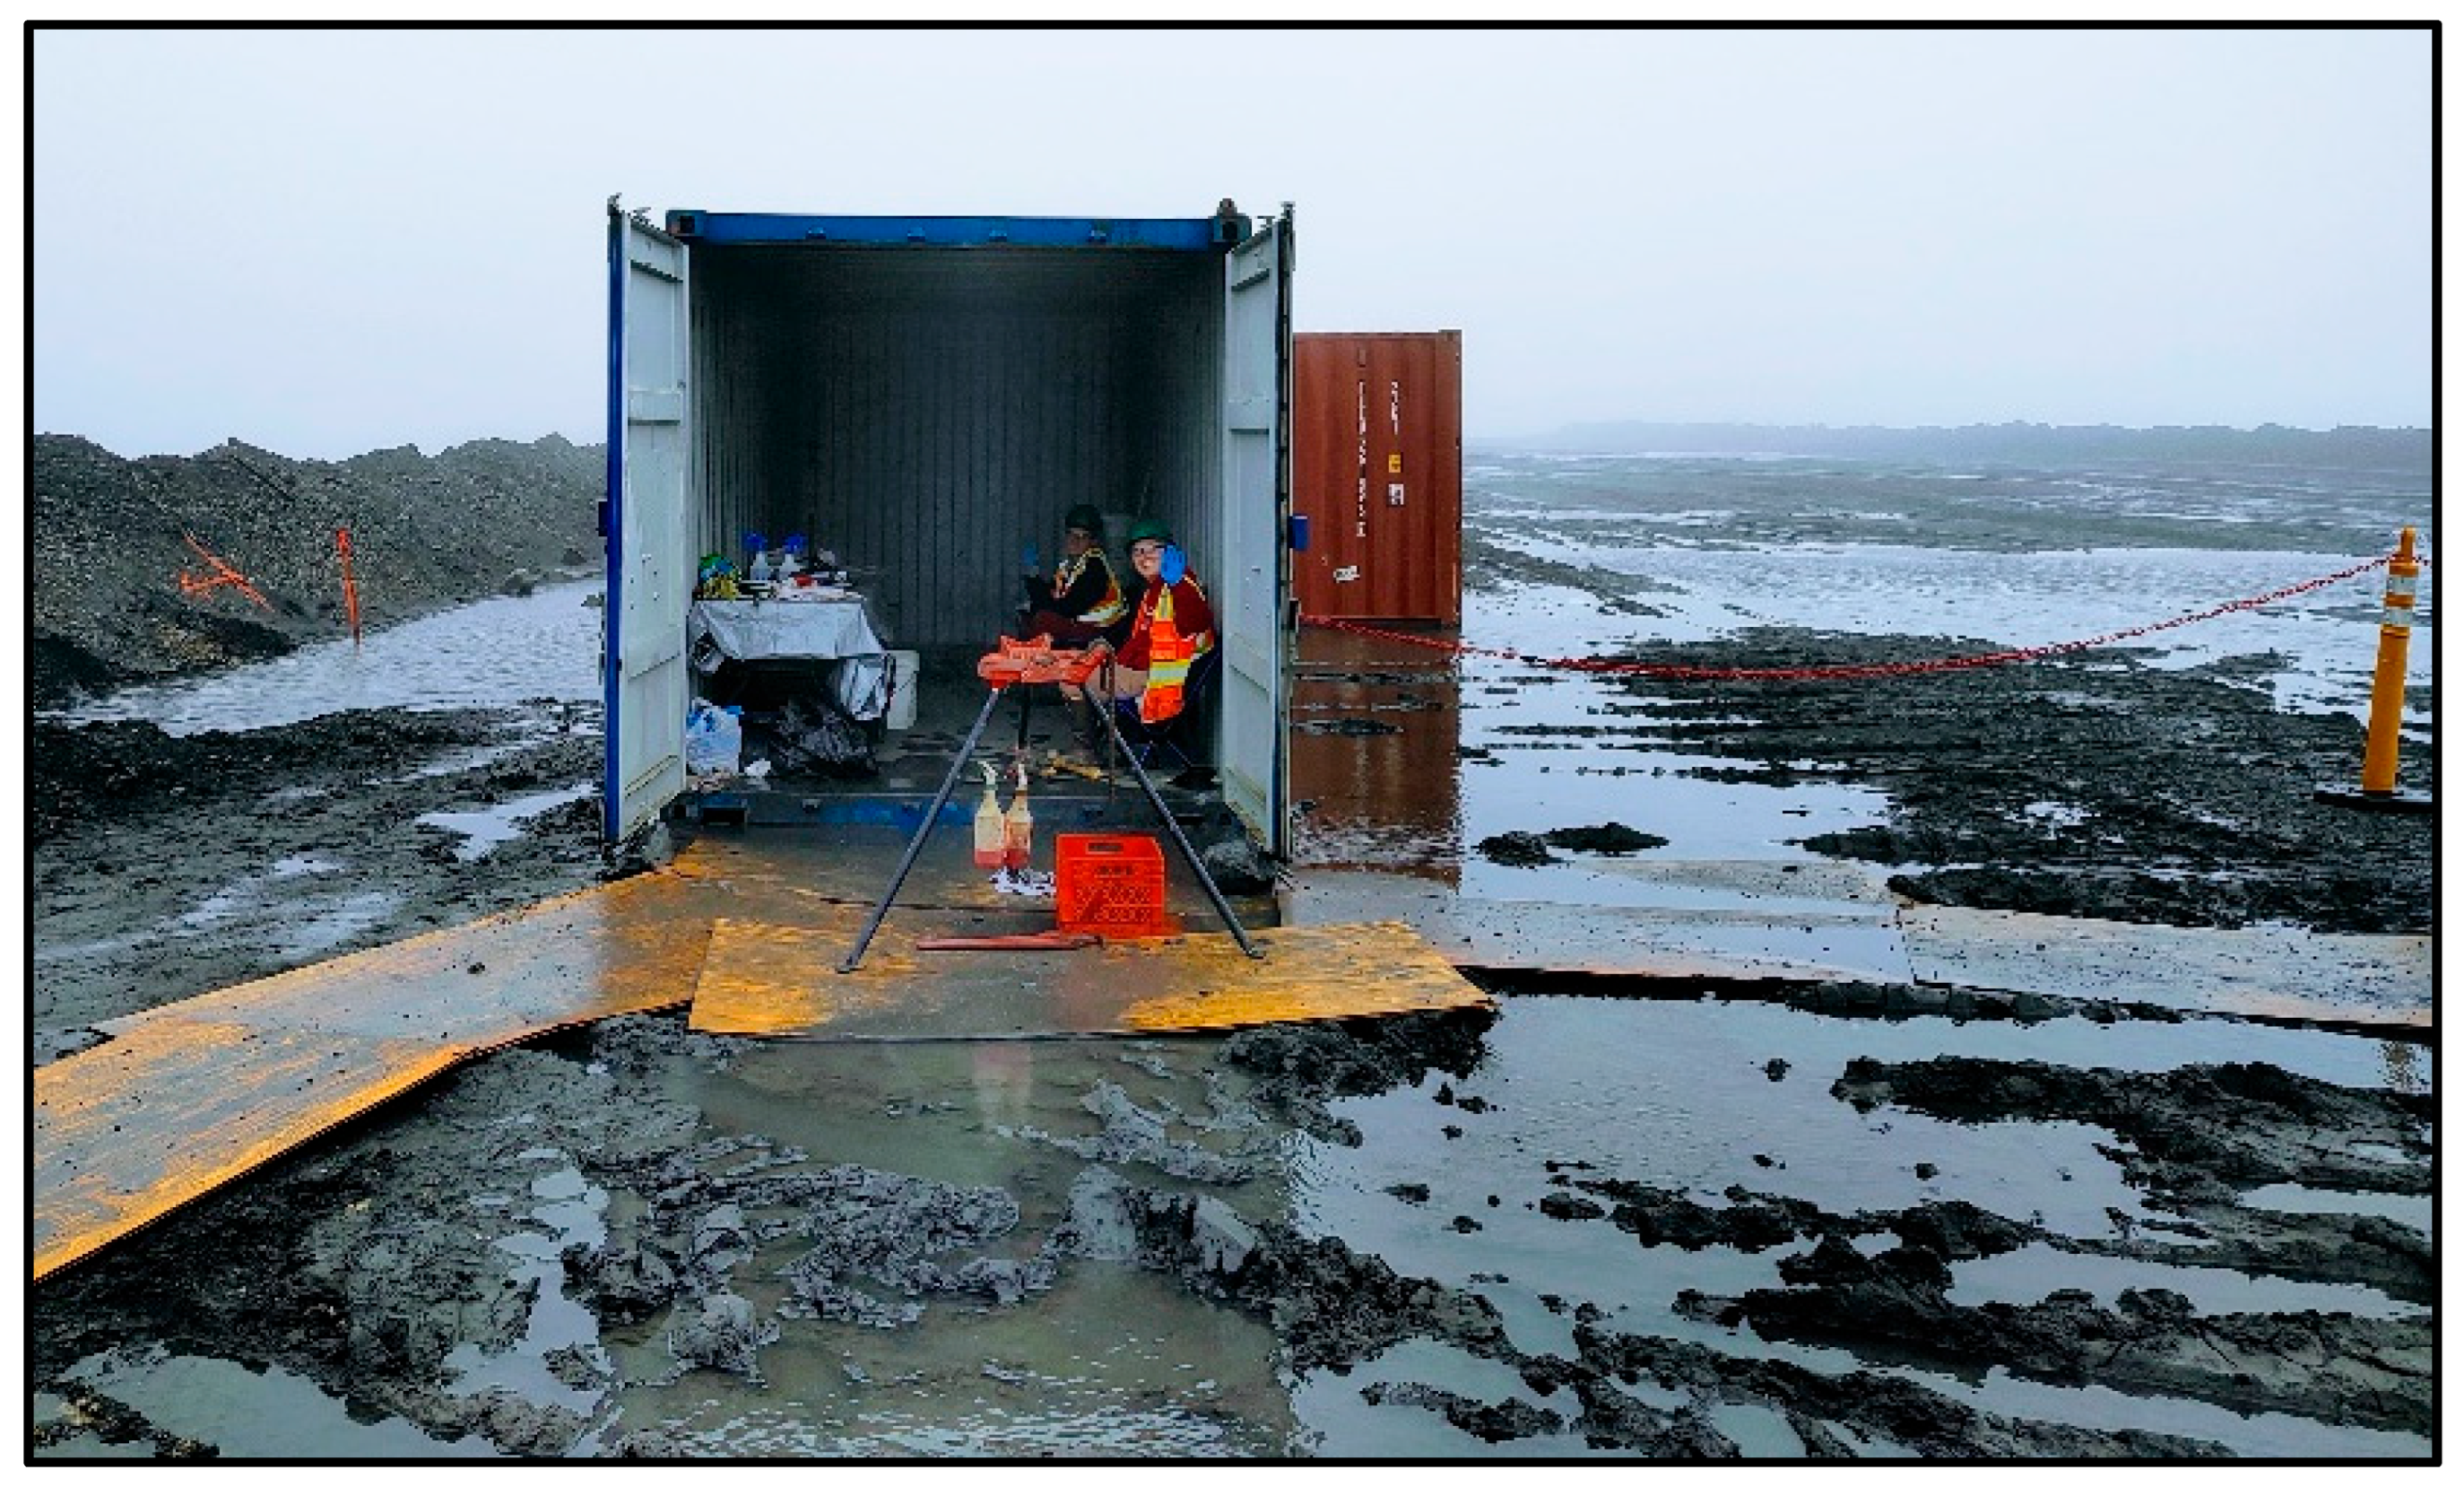
It is expected that the MWS FeS2 have undergone weathering since initiation of the stockpile in 1989 because the MWS has been exposed to an annual precipitation range of 300 to 800 mm (1992 to 2023 [19]). The study area has experienced an increasing trend in the magnitude of precipitation and the frequency of storm events [19,20,21]. The subarctic climate has not produced an expected frozen core in the MWS because of heat generated by exothermic oxidation reactions. This condition is expected to continue with ongoing ARD generation and an assumed increasing trend for temperature and precipitation in the region [20]. Additionally, there is the possibility of a saturated zone near the base of the MWS that may have weathered the lower zone of the MWS [3], along with the underlying shale bedrock. In 2006 and 2011, an examination of groundwater temperatures along the toe of the MWS prior to construction of the collection trench indicated 9 to 11 °C groundwater flowing 6 to 12 m beneath ground surface when it was expected that this zone would be permafrost [1,3]. The infiltrated portion of the annual precipitation is unknown, but only a minor portion of the estimated 550,000 m3 of annual precipitation at the MWS [1] likely enters the MWS because of the limited infiltration capacity from the high silt and clay component of the blasted shale units. Runoff and ponding are visible at the MWS during precipitation events and snowmelt (Figure 6). An evaporation study in 2011 from May through September (non-freezing period) indicated that evaporation can exceed precipitation by 45 mm (234 mm of precipitation and 279 mm of pan evaporation [22]). Yet, percolation will occur because of preferential flowpaths [2] and event-driven infiltration, such as large storms and the spring freshet [3]. Monitoring of infiltration/percolation at multiple stations across the mine site in 2010–2011 indicated net percolation of 63 to 92 mm, or 16% to 24%, of recorded precipitation [22].

2. Materials and Methods

The emplacement of each phase of the MWS cover (Figure 2) was viewed as a distinct temporal change that would influence ARD chemistry immediately following cover emplacement. Travel time in the MWS is considered highly variable, but the volume of ARD in the collection trench responds to large precipitation events and the spring snowmelt (e.g., preferential flowpath response). The wells along the toe of the MWS (Table 1 and Figure 2) have sufficient water chemistry data from prior to (2013 to 2020) and during the primary cover placement period (2021 to 2024) to evaluate changes in the ARD environmental parameters and solute concentrations (Table 1). The environmental parameters and select solutes of the ARD were analyzed as pre- and post-cover data sets from January 2013 to August 2024 and for equivalent pre- and post-cover periods (e.g., two years prior to cover installation and two years post-cover for the Phase II cover area). The water level data at the individual pump locations was insufficient (data continuity issues) for flow normalization of solute concentrations or load calculations. Therefore, water chemistry and flow data from the ARD Tank (data available from 2013 through 2023) were analyzed for concentration and load trends to understand the overall system alteration with cover placement.
Water samples from the collection trench wells were collected according to the Red Dog Operations Acid Rock Drainage (ARD)/Sump Water Hut Sampling Standard Operating Procedure (Document ID 2292, Rev. 4). Sample ports are available in each pump house for monthly collection of samples (when ARD is flowing, periods of ice each year in the wells) for environmental parameters (field parameters) and solute analysis. For collection of environmental parameter data, a YSI ProDSS multiparameter probe was calibrated for the collection of pH (standard units), conductivity (mS/cm), temperature (°C), dissolved oxygen (mg/L), and oxidation-reduction potential (ORP, mV). Separate water samples were collected and preserved for submission to ACZ Laboratories, Inc. (Steamboat Springs, CO, USA) for analysis of 0.45-μm filtered anion and cation concentrations, along with analysis of dissolved solids by gravimetry (Standard Method 2540C) and acidity as CaCO3 (Standard Method 2310B). Chloride [Cl] and sulfate [SO4] concentrations were determined via ion chromatography (EPA National Exposure Research Laboratory (NERL) Method 300.0), and ammonia [NH3 as N] was determined by colorimetry (EPA Method 350.1). Cation (aluminum [Al], cadmium [Cd], calcium [Ca], copper [Cu], iron [Fe], lead [Pb], magnesium [Mg], manganese [Mn], potassium [K], selenium [Se], sodium [Na], thallium [Tl], and zinc [Zn]) concentrations were determined via inductively coupled plasma atomic emission spectroscopy (EPA-NERL 200.7) or inductively coupled plasma mass spectrometry (EPA-NERL 200.87). Duplicate samples were randomly collected during each collection period to assess laboratory analysis accuracy.

Statistical Analysis

Although a test cover was emplaced atop the MWS in 2016–2017, this small cover placement did not have a substantive influence on ARD emanating from the MWS. Therefore, the phased cover period is considered to have begun with the initiation of the larger cover placements in 2021 (Figure 2), and all pre- and post-cover period comparisons are based on the separate phases of cover placement (Table 1). To determine changes in analytes between pre- and post-cover periods (entire study period and equivalent periods before and after the cover depending on the length of the post-cover period at each well), each well’s data were used to compare periods before and after a cover through summary statistics (median and standard deviation) and a statistical evaluation of sample set differences and an increase or decrease in an analyte. The Wilcoxon rank sum test was used to determine whether pre- and post-cover data were similar or different, and the Hodges-Lehmann estimator was used to determine the direction of change (increase or decrease) and an estimate of the size of the change. The Wilcoxon rank sum test is a non-parametric test that allows for comparison of two non-normal data sets for a significant difference between the sample set ranks, which allows for a comparison of the central tendency of the two data sets without assuming a specific distribution shape. A p value is presented along with the Wilcoxon rank sum test statistic to indicate the significance or lack of significance of the relation probability. The Hodges-Lehmann estimator is a nonparametric estimator of a population’s location parameter (e.g., location shift within the population) that is insensitive to non-normal distribution characteristics. Non-parametric Lowess (locally weighted smoothing) and Mann-Kendall analyses were used to evaluate trends of the ARD data. Lowess analysis employs a local regression within a selected temporal window, and the regression is weighted so that the central point gets the highest weight and points that are farther away receive less weight. The Mann-Kendall test is used to detect monotonic trends in time series data when the data is not normally distributed, and the trend is unlikely to be linear. The test determines the difference of each data point and every prior data point to determine a statistic (τ) representative of the sum of positive and negative signs of the differences (e.g., sign count). An associated p value is estimated to evaluate the likelihood of the trend. The Mann-Kendall test was used for trend analysis because of the non-normality and high variability of the data where an indication of an overall upward or downward trend over the selected period can be used to evaluate the significance of trends visible in Lowess trendlines.

3. Results

3.1. Summary Statistics and Indications of Decreased Solute Mobilization

The summary statistics of the MWS ARD indicate noticeable changes between pre- and post-cover periods for nearly all analytes (Table 2). The pH of the ARD collected from MW #2, #3, and #4 (wells with available pre- and post-cover periods) indicate relatively small increases in pH (mean differences of 0.02 to 0.26), although a change in pH of 0.26 represents a potential 50% decrease in acid [H+]. With the decrease in acidity, conductivity values between the pre- and post-cover periods decreased by 17% to 50% (mean differences of 2.84 to 8.52 mS/cm). Some of the largest changes in pre- and post-cover environmental parameters occurred at MW #4. These relatively large changes in environmental parameters and associated decreases in solute concentrations at MW #4 are likely a result of the relatively higher pH of the pre- and post-cover ARD in this trench segment and sustained oxidizing conditions (ORP mean values > +300 mV) (Table 2). Pre- and post-cover mean pH values at MW #4 were greater than all pre- and post-cover mean pH values for MW #2 and #3. The relatively higher pH during the pre-cover period at MW #4 (mean pH = 2.86) and its shift to a mean pH of 3.12 ± 0.61 influences Fe solubility in this S-rich environment in comparison to the smaller increases in the already lower pH values at MW #2 and MW #3 where both pre- and post-cover periods had a pH < 3 (Table 2). The shift in pH at MW #4 above the pH 3 threshold and sustained oxidizing conditions allows for increased precipitation of acidic hydroxysulfate minerals, such as jarosite [KFe3(SO4)2(OH)6], alunite [(KAl3(SO4)2(OH)6)], and schwertmannite [Fe8O8(OH)6(SO4)] [23,24,25,26].
The large solute concentrations of the MWS ARD correspond to the oxidative dissolution of the FeS2 and other sulfide minerals, which releases substantial SO4 into solution (66% to 78% of the mean TDS concentrations) and produces acid that increases the solubility of associated metals (Table 2). Correspondingly, Zn and Fe were the next greatest contributors to the TDS concentrations, respectively, and each element’s data indicates noticeable decreases in concentration following cover placement (Table 2 and Table 3). The other metal(loid) mean concentrations also decreased with cover placement except for Cd at MW #3. Changes in mean Se concentrations between the pre- and post-cover periods were relatively small (<0.1 mg/L) but these changes were relatively large in relation to the mean concentrations (<0.1 mg/L (reporting limit range of 0.00025 to 0.025 mg/L)). Corresponding to the pre- and post-cover pH, ARD data from MW #4 indicate the lowest pre- and post-cover mean concentrations of Al, Cd, Fe, Zn, and SO4 (Table 2 and Table 3). The relatively large change in SO4 concentrations at MW #4 between the two periods (from a mean of 21.87 g/L to 10.89 g/L) reflects the decreased weathering and solubility control of S and associated metals with the higher pH in this trench segment.
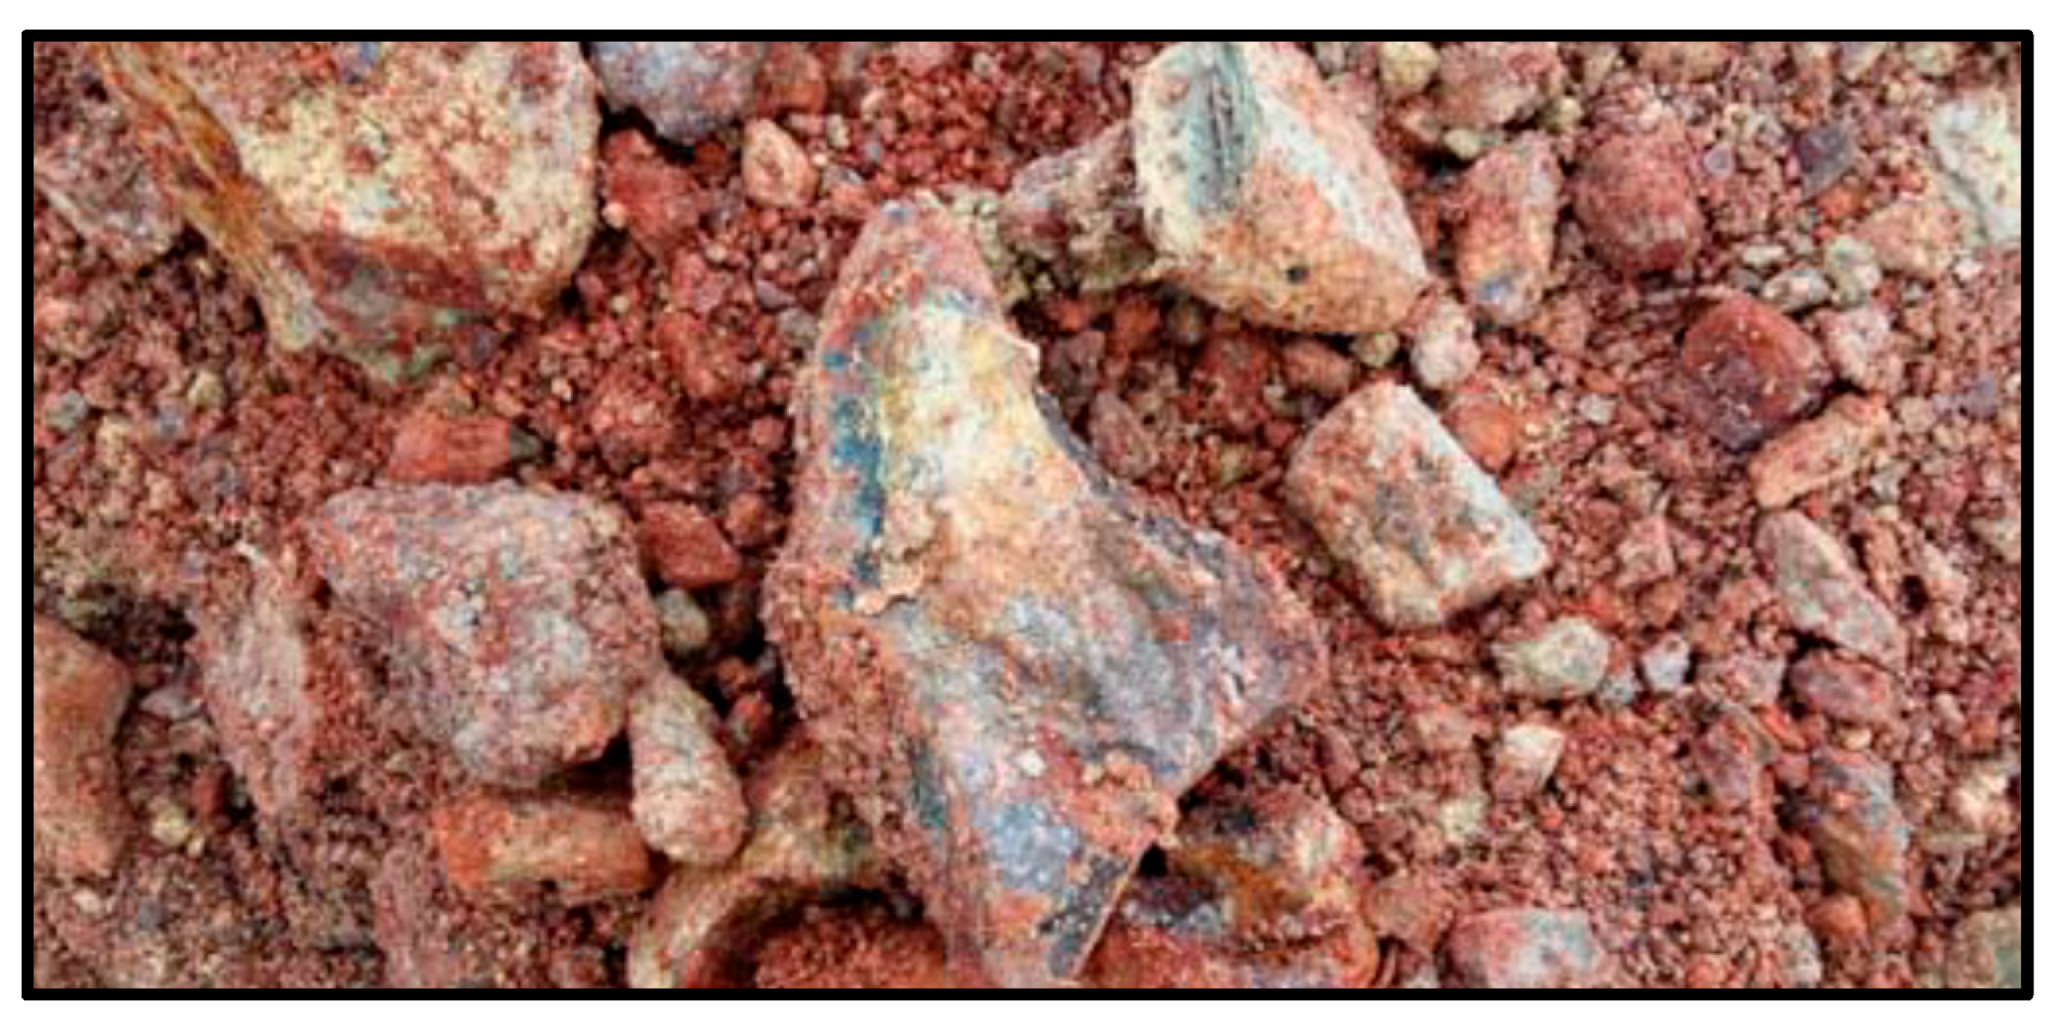
The acidity of the ARD was sufficient during the pre- and post-cover periods to mobilize Al with mean concentrations ranging from 184 to 1201 mg/L (Table 3). The presence of substantial Al in solution (>2018 USEPA aquatic life acute toxicity criteria of 4.8 mg/L), along with Fe and Mn, is indicative of the strong acid generation and mobilization of typically low solubility elements in oxidizing conditions (ORP remained positive for all but one sample from MW #4 in May 2020). The presence of substantial dissolved (0.45-µm filtration) Al concentrations indicates the likely presence of the Al3+ as Al(H2O)63+ instead of the common amphoteric gibbsite [Al(OH)3] or its amorphous form (loss of gibbsite buffering with these pH values). For pH > 2, secondary Al and Fe mineral phases, such as alunite, jarosite, schwertmannite, and ferrihydrite [Fe(OH)3], can precipitate and sorb solution metal(loid)s [27,28,29,30]. At pH values of >4, Al phases such as gibbsite and basaluminite [Al4(SO4)(OH)10] can similarly precipitate and sorb metals [30,31,32,33]. The settling of the resulting precipitates or floc is influenced by pH and concentrations of the mineral phases and their coagulation potential [27]. At pH thresholds of ≥3.5 (Fe) and ≥5.2 (Al), Fe3+ and Al3+ loss by precipitation can be >95% [33]. Although the loss of Al from solution typically occurs at higher pH levels compared to Fe, the growth of well-ordered gibbsite films on muscovite have been observed in solutions with a pH range of 3 to 4 [34]. With the low pH values of the pre-cover periods (average values range from 2.27 to 2.86), the formation of Fe and Al precipitates has been limited because of the high H+ activity. The post-cover increases in pH reduced mean Al and Fe concentrations by 20% (MW #3) to 50% (MW #4). With completion of the cover and reduction of the infiltrating precipitation, the expectation is less acid generation and greater precipitation of ochre-colored Fe oxyhydrosulfates and white precipitates characteristic of aluminum oxyhydrosulfates [35,36]. Such precipitates have been identified in past investigations near the surface and toe of the MWS, such as test pits dug in 2017 by SRK Consulting (Figure 7). Further increases in pH because of the cover placement should continue to reduce metal(loid) concentrations through less weathering and mineral precipitation and become a primary system of controlling trace element mobilization.

3.2. Pre- and Post-Cover ARD Statistical Comparison

The Wilcoxon rank sum test and Hodges-Lehman estimator values for the pre- and post-cover periods (Table 1) indicate that most of the visible changes in the mean analyte conditions/concentrations (Table 2 and Table 3) are statistically significant for each well (Table 4). Results from MW #2 indicate the most significant analyte changes between pre- and post-cover periods (p value < 0.01 for all analytes), while results from MW #3 indicate the least consistency in statistical significance, with p values ranging from <0.01 to 0.21. This difference in statistical significance in pre- and post-cover periods for the different wells indicates a lack of correlation with the length of the post-cover period since MW #3 had the longest post-cover period data set. The Hodges-Lehmann estimator results indicate the largest analyte changes in pH, conductivity, temperature, and SO4 at MW #4, while results from MW #2 indicate the largest changes in TDS and Fe. Results from MW #3 indicate the largest change for Zn.
The results of the comparison of equivalent pre- and post-cover period analyte populations indicate no statistical significance for MW #4 analytes (Table 5), which had the shortest post-cover period data set (Table 1). This lack of statistical difference at MW #4 indicates that the substantial changes in mean analyte conditions/concentrations indicated by the comparison of the full pre-cover period to the post-cover period (Table 4) may mask a greater similarity in analyte conditions/conditions just prior to the cover placement and after cover placement in this trench segment. In comparison, the additional year of monitoring for the post-cover period at MW #2 strengthens the perceived difference in equivalent pre- and post-cover periods where most analytes had results that were significantly different (p values range from <0.01 to 0.08, Table 5). Although, the mix of significant and insignificant differences in equivalent pre- and post-cover periods for MW #3 (p value range of <0.01 to 0.24) suggest local differences for the trench segments. The equivalent pre- and post-cover period analysis suggests that continued monitoring should allow for increased identification of significant changes in the post-cover ARD similar to the significant differences identified in the full data pre- and post-cover period analysis (Table 4).

3.3. Temporal Trends in Dissolved Solids and pH

An examination of TDS and pH trends in ARD at each of the wells (Figure 8) indicates seasonal and annual variations with pronounced shifts with and without cover placement. Seasonal changes are visible in ARD from each well during the pre-cover period, but ARD from each trench segment represented by the wells appears to have evolved differently. From 2013 to 2021 (pre-cover period), the TDS trend in ARD from MW #1 and MW #3 indicates an increasing trend, with opposing trends from 2022 to 2024 when TDS continued to increase in MW #1 (although with highly variable values) and TDS had a substantive but variable decline (17,800 mg/L (Table 5)) at MW #3 following placement of the cover. The TDS of ARD from MW #2 and MW #4 also declined following cover placement, but the range of values is substantial and highly variable with time. The opposing trends of ARD with and without cover placement suggest a strengthening of ARD conditions in areas without a cover (MW #1), which was counteracted by placement of the cover in other areas (MW #2–4). Correspondingly, the trend in pH values at MW #1 has declined since 2022 in contrast to the increasing trend in pH at MW #2 and steady or slightly increasing trends at MW #3 and MW #4.
The results of the statistical evaluation of potential monotonic trends (Mann-Kendall test) in pH and TDS for the pre- and post-cover periods (Table 6) align with the perceived changes visible in the Lowess trendlines (Figure 8). At MW #1, the pH data indicate a weak (τ = −0.05) decreasing and insignificant or unlikely (p value = 0.45) trend, while the TDS data indicate a stronger (τ = 0.4) and significant or highly likely (p value < 0.01) increasing trend. At MW #2, a slight increasing trend is present in the pH data (τ = 0.11 and 0.21 for pre- and post-cover periods, respectively), although the significance of the trend decreased between the two periods (p value = 0.10 and 0.15 for the pre- and post-cover periods, respectively). Correspondingly, TDS results indicate strengthening of the decreasing trend from the pre- to post-cover period (τ = −0.11 (p value = 0.09) and −0.61 (p value < 0.01)). At MW #3, pH results indicate a significant (p value < 0.01) decreasing (τ = −0.27) trend in the pre-cover period that weakened to an insignificant (p value = 0.47) decreasing trend (τ = −0.11) with a similar change in TDS from a significant (p value < 0.01) increasing (τ = 0.35) trend to an insignificant (p value = 0.66) decreasing (τ = −0.07) trend. At MW #4, the cover has not had a substantive influence on the pH and TDS trends, but the Mann-Kendall results indicate a potential (p value = 0.2) enhancement in what was an increasing pH trend (pre-cover τ = 0.13 and post-cover τ = 0.28), which also may be visible in the TDS results where τ decreased from −0.42 to −0.49 from the pre- to post-cover period (p value < 0.01 and 0.02, respectively) (Table 6).

3.4. ARD Tank Chemistry and Inflow

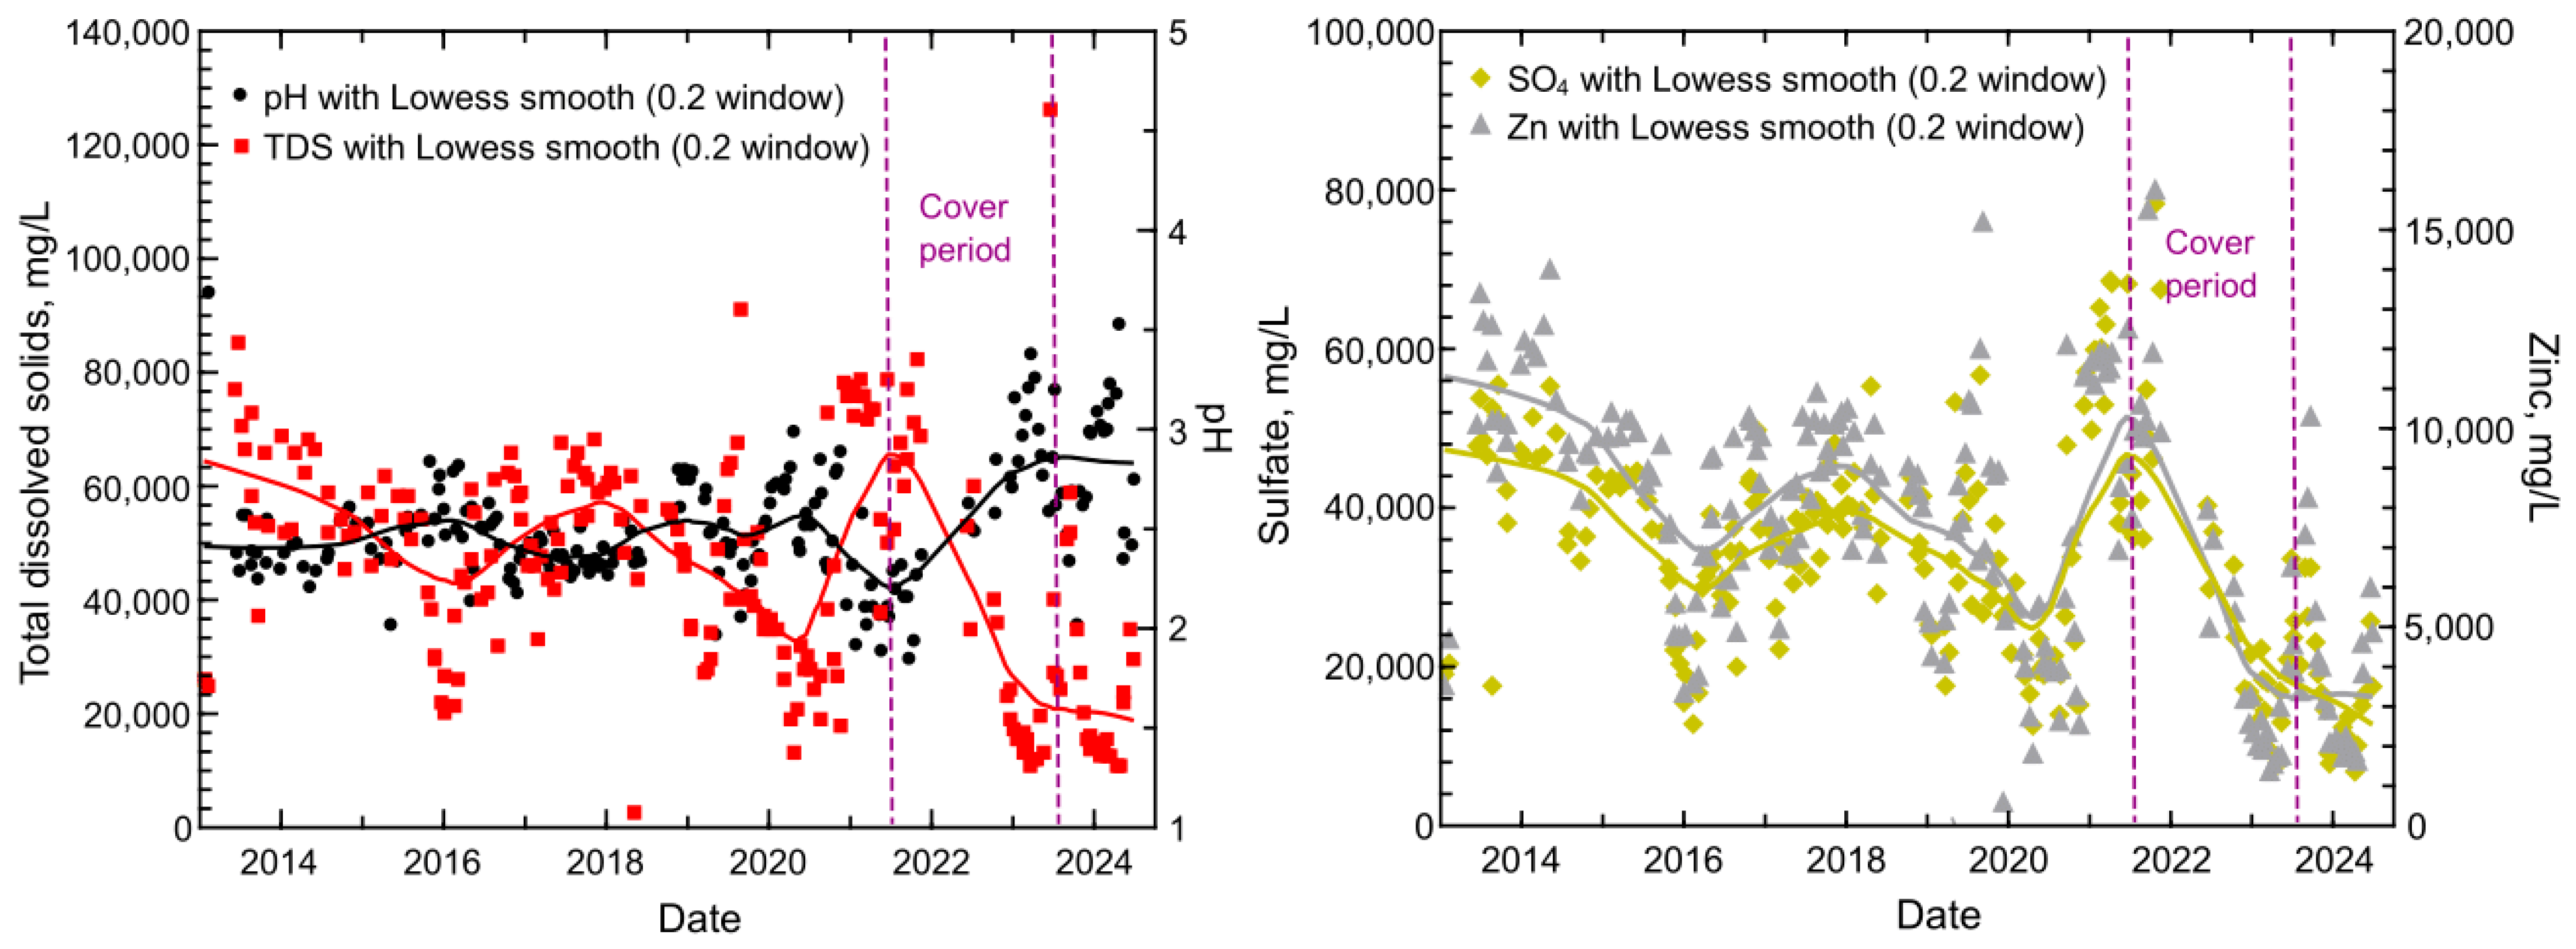
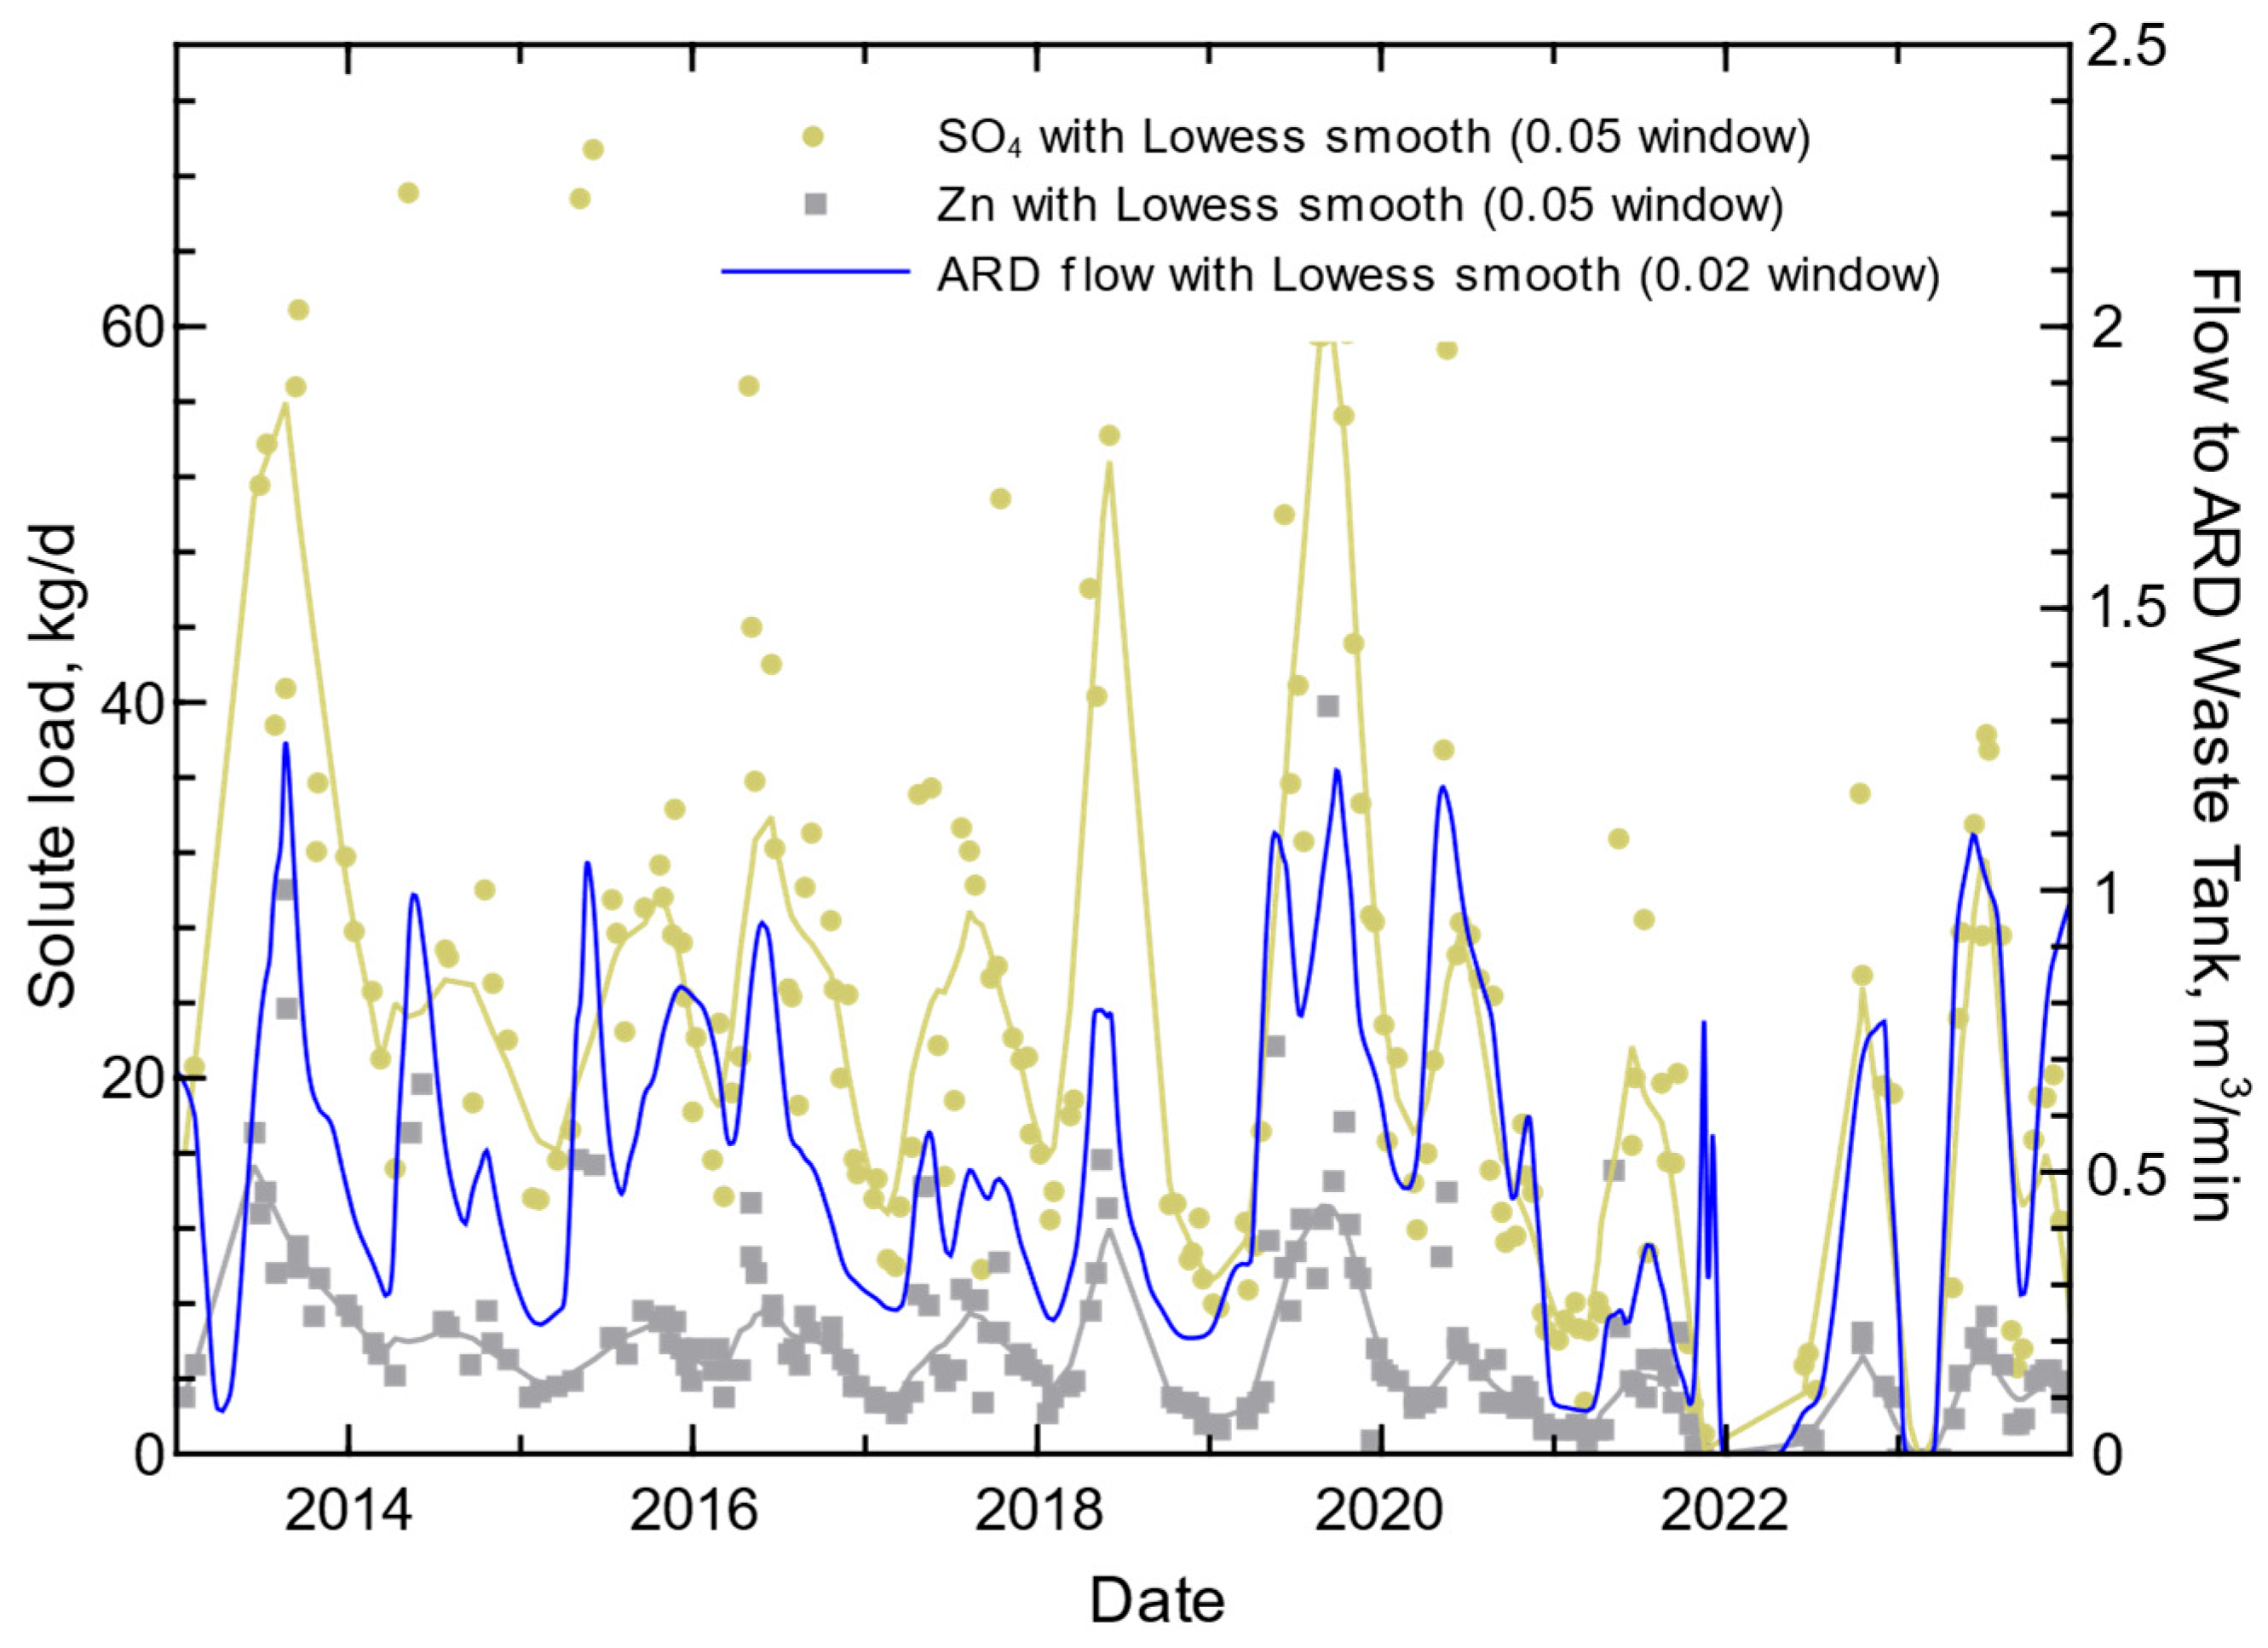
An examination of the trends in pH and TDS of the MWS ARD that was composited at the ARD Tank indicates seasonal and annual variations with pronounced shifts prior to and during the phased cover placement (Figure 9). A period of low pH and high TDS occurred prior to and during the first phase of cover placement (2021 to 2022), with a subsequent improvement in water quality indicated by the substantial increase in pH and decrease in TDS, along with less variability in the values. An examination of the flow and the SO4 and Zn loads to the ARD Tank indicates a large flushing of these solutes from the MWS in 2013, followed by a decrease and similar annual cycles with the reappearance of large loads in 2018 and 2019 (Figure 10). The relatively large SO4 and Zn loads of 2018 occurred under low flow conditions. The SO4 and Zn loads were smaller in 2020, with a substantial decline in flow and loads in 2021 and 2022.
With the initiation of the cover placements in 2021, the pH and TDS of the ARD Tank started to improve as indicated by the higher pH and lower TDS, SO4, and Zn concentrations, but such conclusions may be premature given the multi-year flux of ARD that is observable in the pre-cover period (Figure 9 and Figure 10). A Mann-Kendall trend comparison of the ARD Tank data indicates that the pre-cover period (pre-July 2021) had a pH trend of −0.03 (p value = 0.59) and a post-cover pH trend of 0.32 (p value < 0.01) with a pre-cover TDS trend of −0.11 (p value = 0.05) and a post-covered TDS trend of −0.39 (p value < 0.01). These trend statistics indicate a statistically significant improvement in pH and TDS at the ARD Tank with initiation of the cover placement, which corresponds to decreases in solute concentrations/loads, such as those seen with SO4 and Zn, the two primary solutes in the ARD. The weathering of iron sulfide minerals can produce large amounts of insoluble and slightly soluble S and Fe-bearing secondary phases consisting of various ferric (oxyhydr)oxides (e.g., ferrihydrite [Fe(OH)3] and goethite [α-FeO(OH)]), metal sulfates, and hydroxysulfates [38] that may be found as rims/rinds or adjacent to the sulfide mineral depending on the solution environment [39,40,41,42,43]. Such mineral precipitates are present at and near the surface at the MWS and have been described as dehydration or saturation products [37] in areas where the ARD is exposed to the atmosphere (Figure 7). The formation of such minerals likely will be enhanced with covering of the MWS because of decreased infiltration, which is still sufficient to generate ARD, but the decreased solution volume allows for greater precipitation of such minerals.

3.5. Estimated Acid Generation and Iron Sulfide Consumption

With the infiltration of oxygenated water into the MWS, the FeS2 reacted with available oxygen to produce acid (Equation (1)). Additional acid generation can occur with the cycling of Fe2+/Fe3+ [44] if the Fe remains available. With greater progression of the oxidative dissolution of FeS2 and accumulation of solution Fe3+, acid generation can be 8× the initial reaction with the continued presence of FeS2 and available Fe3+ (Equation (2)). Often, the reactions are combined to present an expected overall acid generation (Equation (3)) for strongly acid-generating rock. Oxidative dissolution of FeS2 has various rate limiting/enhancing factors, such as the formation of S intermediaries and Fe (oxyhydr)oxide layers (rims), which can result in decreased acid generation but also provide the e carrier for Fe2+/Fe3+ cycling [45,46,47]. Yet, the stoichiometry of the basic acid-generating equations (Equations (1) and (2)) provides the possible lower and upper bounds of H+ potential that can be used to estimate the FeS2 consumption necessary to produce the recorded pH of the ARD captured by the collection trench. To evaluate the potential consumption of FeS2 in the MWS, the pH of the ARD Tank was used to estimate the total acid generated during the period from 2013 through 2023. The monthly data of the ARD Tank pH was converted to H+ concentration (mol/L), and the concentration trend was integrated to estimate the total concentration for 2013–2023. The total concentration was multiplied by the total flow to the ARD Tank (daily value) to estimate a total abundance (mol). For comparison, the total abundance of SO4 was also calculated using the same method. The SO4 abundance provides an equivalent measure of the oxidation of sulfide minerals and the release, and oxidation, of S forms from non-sulfide minerals.
F e S 2 + 7 2 O 2 + H 2 O = F e 2 + + 2 S O 4 2 + 2 H +
F e S 2 + 14 F e 3 + + 8 H 2 O = 15 F e 2 + + 2 S O 4 2 + 16 H +
F e S 2 + 15 4 O 2 + 7 2 H 2 O = F e ( O H ) 3 + 2 S O 4 2 + 4 H + ( o r   2 H 2 S O 4 )
The MWS is estimated to contain 60 million tonnes of waste rock with an FeS2 range of 0 to 35 wt %, a median concentration of 3.7 wt %, and an average concentration of 7.7 wt % [10]. These results compare to a total S median concentration of 8.8 wt %, an average concentration of 8.4 wt %, a sulfide S median concentration of 8.1 wt %, and an average concentration of 7.8 wt % [11]. Earlier results of MWS sampling indicated a FeS2 range of 0.7 to 9.9 wt % and average of 4.2 wt % [48]. From these past results, the MWS is assumed to have a likely FeS2 content of 3 to 9 wt %, which indicates a possible MWS FeS2 content of 1.8 to 5.4 million tonnes or about 15 to 45 billion mol of FeS2 placed in the MWS from its initiation in 1989 to its completion in 2012. From Equations (1)–(3), this amount of FeS2 has the potential to generate 30 (Equation (1)) to 720 (Equation (2)) billion mol of H+ with a likely potential (Equation (3)) for 60 to 180 billion mol of H+. Given the recorded pH and flow volume (about 3.1 million m3) of ARD from the collection trench to the ARD Tank, it is estimated that a total of about 47.5 billion mol of H+ were captured from 2013 to 2023. If the collection trench is capturing 60% to 80% of the ARD emanating from the MWS [4], then the MWS has produced approximately 59 to 79 billion mol of H+. This H+ production represents about 40% to 80% of the medium H+ potential (Equation (3)) for an assumed 5% to 7% FeS2 content (middle of the FeS2 range) in the MWS (Table 7). If the MWS sulfide weathering sustained high acid production through retention of Fe at the mineral/pore water interface (Equation (2)), the H+ released from the MWS during this period for the middle FeS2 range (5% to 7%) represents 11% to 20% of this larger estimate of H+ potential (Table 7). Given past evaluations of weathering of the MWS [9,11], the 40% to 80% production of potential H+ appears to be a reasonable assumption of past H+ production and remaining H+ production (20% to 60%).
There is insufficient data from the construction of the MWS and monitoring of its seepage from 1989 to 2012 to estimate the produced H+ during this pre-collection trench period, but consumption of the FeS2 and production of H+ would have been smaller given the building of the MWS over this period (less available FeS2) and initial infiltration/wetting of the waste rock. If the pre-collection trench period produced 50% of the H+ that was produced during the 2013–2023 period, the results for the likely scenario of 5% to 7% FeS2 and 4 × H+ per mol of FeS2 would adjust to a potential remaining H+ potential (FeS2 content) of −19% to 36%. The −19% H+ potential is derived from the 5% FeS2 with 60% trench capture (11% H+ potential for 80% capture), which indicates that the FeS2 content of the MWS is >5% FeS2 because ARD generation has continued. For comparison, an assumed 9% FeS2 for the medium acid production (Equation (3)) indicates a remaining 67% of acid production from consideration of the 2013–2023 H+ estimate and 51% of the H+ potential after weathering of the MWS from its initiation through 2023. Therefore, the remaining acid-generating potential of MWS waste rock may still be substantial.
For comparison to the H+ release from the MWS, the ARD sent to the ARD Tank from 2013–2023 contained a cumulative total of about 4300 Mmol of SO4 (0.42 Mt). Using the estimated 60% to 80% ARD captured by the collection trench, an estimated 5400 to 7200 Mmol of SO4 were released from the MWS during this period, with an associated range of 8100 to 10,800 Mmol of SO4 since initiation of the MWS (assuming a 1.5× multiplier, as noted above). Past investigations have estimated a total sulfide S average concentration of about 7.8 to 10.6 wt % with a total S of about 10.7 wt %, indicating that nearly all of the available S is present in sulfide minerals [10,11]. However, S content can range from negligible to >30% of waste rock depending on its formation/unit association, including high S content in waste rock generated from mining the massive sulfide bed and barite units [11]. Assuming a sulfide S concentration of 9 wt %, full S oxidation and S release as SO4 (2× per sulfide) with the weathering of the sulfide minerals (no oxidation or solubility controls), the sulfide source could produce a total of about 168,500 Mmol of SO4. With the relatively small amount of released SO4 estimated for the 2013–2023 period (<5%) and the entire lifespan of 1989–2023 (<7%) in comparison to the potential SO4 release from weathering of the sulfide minerals, the comparison of the H+ release and SO4 release indicates substantial retention of SO4 in the MWS. Retention of the SO4 likely occurs with precipitation of sulfate minerals, such as melanterite, jarosite, schwertmannite, and/or gypsum, which can precipitate from sulfate-rich waters in the pH range of 1 to 3 and remain stable in these acidic conditions [49]. Such minerals were identified during past investigations (e.g., Figure 7) of the MWS [9,11] indicative of solubility controls on SO4. The presence of such minerals is supportive of the assumption of sustainable greater acid generation (Equations (2) and (3)) with oxidative dissolution of the MWS FeS2.

4. Discussion

Monitoring of ARD from the Red Dog Mine’s MWS since completion of the collection trench indicates how environmental parameters and solute concentrations have changed with the phased placement of the stockpile cover. Temporal trends of water chemistry at wells associated with each cover placement show improvements in pH and dissolved solids during post-cover periods, while data from the uncovered location shows similar or worsening conditions throughout the monitoring period (2013–2024). Statistical analysis of the ARD data indicates mostly improvements in water quality with each cover placement, but the data trends prior to cover placement and the length of the post-cover monitoring periods are influences on the statistical significance between the pre- and post-cover periods. Yet longer post-cover periods can indicate greater statistical significance in water quality improvements, which should continue to strengthen with longer periods of post-cover monitoring.
With collection and analysis of the composited ARD from the entire collection trench at the ARD Tank, the resulting pH data provide insight into historical acid generation and iron sulfide consumption within the entire MWS. Given past estimates of FeS2 and sulfur concentrations of the waste rock, weathering of the pile during the 2013–2023 period may have produced about 40% to 80% of the potential acid generation given a possible 5% to 7% FeS2 content and conservative (medium) estimate of acid production (Equation (3)). The inclusion of the pre-completion period of the stockpile from 1989 to 2012 for estimating acid generation from its initiation through 2023 suggests a remaining acid-generating potential of ≥36% (7% FeS2) with the potential for up to 50% of the remaining acid-generating potential (9% FeS2). With completion of the primary stockpile cover in 2025 (90% coverage), the volume, acidity, and solute concentrations of the ARD emanating from the MWS should continue to decline, but there is sufficient remaining FeS2 content and potential infiltration zones to allow for continued ARD production. With the potential slowing of the ARD generation because of the cover placement and reduced infiltration, it is unlikely that the stockpile will exhaust its acid-generating capacity prior to closure of the mine site that is planned for 2031. The subsequent portions of this study will be used to further investigate the acid-generating potential of the MWS to increase our understanding of ARD release from the stockpile and inform closure planning.

Author Contributions

Conceptualization, J.B.L., A.B., D.E.A., T.E.L. and B.E.; methodology, J.B.L., D.E.A. and T.E.L.; validation, J.B.L., A.B. and E.M.; formal analysis, J.B.L.; investigation, J.B.L., A.B., D.E.A., T.E.L., E.M. and B.E.; resources, J.B.L. and E.M.; data curation, J.B.L., A.B. and E.M.; writing—original draft preparation, J.B.L. and A.B.; writing—review and editing, J.B.L., A.B., D.E.A., T.E.L., E.M. and B.E. visualization, J.B.L.; project administration, J.B.L., E.M. and B.E.; funding acquisition, J.B.L., E.M. and B.E. All authors have read and agreed to the published version of the manuscript.

Funding

This work was funded by Red Dog Operations, Teck Alaska Incorporated.

Data Availability Statement

The original contributions presented in this study are included in the article. The existing monitoring data is part of the Teck Alaska Incorporated’s environmental monitoring program and is housed within their environmental management system where the data is released for regulatory purposes. Further inquiries can be directed to the corresponding author.

Acknowledgments

Completion of the work could not have been possible without assistance from Red Dog Operations Tailings and Water personnel. We thank the editors and anonymous reviewers for their valuable suggestions.

Conflicts of Interest

Although Emile Milan and Bridget Eckhardt are part of Teck Alaska Incorporated and the study was funded by Teck Alaska Incorporated, personnel at the Teck Alaska Incorporated and the parent company Teck Resources did not restrict the data availability, the data analysis, or the results interpretation and had no role in the decision to publish the results of the study. The University of Idaho authors declare no conflicts of interest.

References

  1. Clark, J.L.; Christensen, D.; Lum, B. Acid Rock Drainage Source Control Opportunities at the Red Dog Zinc and Lead Mine, USA. In Proceedings of the Mine Closure 2011, Lake Louise, AB, Canada, 18–21 September 2011. [Google Scholar]
  2. Willowstick Technologies, LLC. Red Dog Mine Waste Rock Dump Drainage Collection Trench; Teck Alaska Incorporated: Anchorage, AK, USA, 2014; p. 70. [Google Scholar]
  3. Golder Associates, Inc. Summary of 2011 Site Work and Recommendations for 2012 Field Monitoring Program, Main Waste Stockpile Cut-Off Feasibility Study, Red Dog Mine, Alaska; Golder Associates, Inc.: Anchorage, AK, USA, 2012; p. 53. [Google Scholar]
  4. Golder Associates, Inc. Summary of Main Waste Stockpile 2013 Services, Red Dog Mine, Alaska; 133-95040; Golder Associates, Inc.: Anchorage, AK, USA, 2014; p. 68. [Google Scholar]
  5. Geosyntec Consultants. Main Waste Stockpile Cover, 2020 Test Plot Monitoring; Geosyntec Consultants: Anchorage, AK, USA, 2020; p. 18. [Google Scholar]
  6. Moore, D.W.; Young, L.E.; Modene, J.S.; Plahuta, J.T. Geologic Setting and Genesis of the Red Dog Zinc-Lead-Silver Deposit, Western Brooks Range, Alaska. Econ. Geol. 1986, 81, 1696–1727. [Google Scholar] [CrossRef]
  7. Blevings, S.K.; Kraft, J.L.; Stemler, J.U.; Krolak, T.E. An Overview of the Structure, Stratigraphy, and Zn-Pb-Ag Deposits of the Red Dog District, Northwestern Alaska. In Tectonics, Metallogeny, and Discovery: The North American Cordillera and Similar Accretionary Settings; Colpron, M., Bissig, T., Rusk, B.G., Thompson, J.F.H., Eds.; Society of Economic Geologists: Littleton, CO, USA, 2013; Volume 17, ISBN 978-1-62949-043-4. [Google Scholar]
  8. Kulas, J.E. Geology of the Red Dog Mine, Western Brooks Range, Alaska; Cominco Alaska Incorporated: Kotzebue, AK, USA, 1992; p. 11. [Google Scholar]
  9. Gajonera, D. A Study of the Initial Stages of Weathering of Red Dog Mine Waste. Ph.D. Thesis, Queen’s University, Kingston, ON, Canada, 2016. [Google Scholar]
  10. SRK Consulting. Final Kinetic Test Results, Red Dog Mine; Teck Alaska Incorporated: Kotzebue, AK, USA, 2003. [Google Scholar]
  11. SRK Consulting. Geochemical Characterization of Aqqaluk and Main Waste Stockpile Waste Rock, Red Dog Mine—Final Report; Teck Alaska Incorporated: Kotzebue, AK, USA, 2020. [Google Scholar]
  12. Ritchie, A.I.M. Sulfide Oxidation Mechanisms: Controls and Rates of Oxygen Transport. In Environmental Geochemistry of Sulfide Mine Wastes; Jambor, J.L., Blowes, D.W., Eds.; Mineralogical Association of Canada: Ottawa, ON, Canada, 1994; Volume 22, pp. 201–245. [Google Scholar]
  13. Singer, P.C.; Stumm, W. Acidic Mine Drainage: The Rate-Determining Step. Science 1970, 167, 1121–1123. [Google Scholar] [CrossRef] [PubMed]
  14. Smith, E.E.; Shumate, K.S.; Singer, P.C.; Stumm, W. Direct Oxidation by Adsorbed Oxygen during Acidic Mine Drainage. Science 1970, 169, 98. [Google Scholar] [CrossRef]
  15. Holmes, P.R.; Crundwell, F.K. The Kinetics of the Oxidation of Pyrite by Ferric Ions and Dissolved Oxygen: An Electrochemical Study. Geochim. Cosmochim. Acta 2000, 64, 263–274. [Google Scholar] [CrossRef]
  16. Johnson, A.C.; Romaniello, S.J.; Reinhard, C.T.; Gregory, D.D.; Garcia-Robledo, E.; Revsbech, N.P.; Canfield, D.E.; Lyons, T.W.; Anbar, A.D. Experimental Determination of Pyrite and Molybdenite Oxidation Kinetics at Nanomolar Oxygen Concentrations. Geochim. Cosmochim. Acta 2019, 249, 160–172. [Google Scholar] [CrossRef]
  17. Moses, C.O.; Kirk Nordstrom, D.; Herman, J.S.; Mills, A.L. Aqueous Pyrite Oxidation by Dissolved Oxygen and by Ferric Iron. Geochim. Cosmochim. Acta 1987, 51, 1561–1571. [Google Scholar] [CrossRef]
  18. Rimstidt, J.D.; Vaughan, D.J. Pyrite Oxidation: A State-of-the-Art Assessment of the Reaction Mechanism. Geochim. Cosmochim. Acta 2003, 67, 873–880. [Google Scholar] [CrossRef]
  19. Eckhardt, B.; Brown, T.; Oester, T. Selection of Climate Change-Informed Design Storm Events for a Tailings Storage Facility at Red Dog Operations, Alaska, USA. In Proceedings of the Tailings and Mine Waste 2023, Vancouver, BC, Canada, 5–8 November 2023; pp. 781–792. [Google Scholar]
  20. Wendler, G.; Gordon, T.; Stuefer, M. On the Precipitation and Precipitation Change in Alaska. Atmosphere 2017, 8, 253. [Google Scholar] [CrossRef]
  21. Poujol, B.; Prien, A.F.; Molina, M.J.; Muller, C. Dynamic and Thermodynamic Impacts of Climate Change on Organized Convection in Alaska. Clim. Dyn. 2021, 56, 2569–2593. [Google Scholar] [CrossRef]
  22. O’Kane Consultants, Inc. Teck Resources—Red Dog Mine, Oxide Stockpile Full-Scale Cover System, 2010–11 Annual Performance Monitoring Report; Teck Resources: Anchorage, AK, USA, 2012; p. 33. [Google Scholar]
  23. Bigham, J.M.; Nordstrom, D.K. Iron and Aluminum Hydroxysulfates from Acid Sulfate Waters. Rev. Mineral. Geochem. 2000, 40, 351–403. [Google Scholar] [CrossRef]
  24. Bladh, K.W. The Formation of Goethite, Jarosite, and Alunite during the Weathering of Sulfide-Bearing Felsic Rocks. Econ. Geol. 1982, 77, 176–184. [Google Scholar] [CrossRef]
  25. Fernández-Remolar, D.C.; Carrizo, D.; Harir, M.; Huang, T.; Amils, R.; Schmitt-Kopplin, P.; Sánchez-García, L.; Gomez-Ortiz, D.; Malmberg, P. Unveiling Microbial Preservation under Hyperacidic and Oxidizing Conditions in the Oligocene Rio Tinto Deposit. Sci. Rep. 2021, 11, 21543. [Google Scholar] [CrossRef]
  26. Schoepfer, V.A.; Burton, E.D. Schwertmannite: A Review of Its Occurrence, Formation, Structure, Stability, and Interactions with Oxyanions. Earth-Sci. Rev. 2021, 221, 103811. [Google Scholar] [CrossRef]
  27. Guerra, P.; Valenzuela, J.; Rámila, C.; Cattaneo, G. Settling of Iron and Aluminum Particles in Acid Solutions for Acid Drainage Remediation. Water 2022, 14, 2231. [Google Scholar] [CrossRef]
  28. Hudson-Edwards, K.A. Uptake and Release of Arsenic and Antimony in Alunite-Jarosite and Beudantite Group Minerals. Am. Mineral. 2019, 104, 633–640. [Google Scholar] [CrossRef]
  29. Lecomte, K.L.; Maza, S.N.; Collo, G.; Sarmiento, A.M.; Depetris, P.J. Geochemical Behavior of an Acid Drainage System: The Case of the Amarillo River, Famatina (La Rioja, Argentina). Environ. Sci. Pollut. Res. 2017, 24, 1630–1647. [Google Scholar] [CrossRef] [PubMed]
  30. Sánchez España, J. Chapter 7—The Behavior of Iron and Aluminum in Acid Mine Drainage: Speciation, Mineralogy, and Environmental Significance. In Thermodynamics, Solubility and Environmental Issues; Letcher, T.M., Ed.; Elsevier: Amsterdam, The Netherlands, 2007; pp. 137–150. ISBN 978-0-444-52707-3. [Google Scholar]
  31. Nordstrom, D.K. Hydrogeochemical Processes Governing the Origin, Transport and Fate of Major and Trace Elements from Mine Wastes and Mineralized Rock to Surface Waters. Appl. Geochem. 2011, 26, 1777–1791. [Google Scholar] [CrossRef]
  32. Sánchez-España, J.; Yusta, I.; Burgos, W.D. Geochemistry of Dissolved Aluminum at Low pH: Hydrobasaluminite Formation and Interaction with Trace Metals, Silica and Microbial Cells under Anoxic Conditions. Chem. Geol. 2016, 441, 124–137. [Google Scholar] [CrossRef]
  33. Sánchez-España, J.; Yusta, I.; Diez-Ercilla, M. Schwertmannite and Hydrobasaluminite: A Re-Evaluation of Their Solubility and Control on the Iron and Aluminium Concentration in Acidic Pit Lakes. Appl. Geochem. 2011, 26, 1752–1774. [Google Scholar] [CrossRef]
  34. Lee, S.S.; Schmidt, M.; Sturchio, N.C.; Nagy, K.L.; Fenter, P. Effect of pH on the Formation of Gibbsite-Layer Films at the Muscovite (001)–Water Interface. J. Phys. Chem. C 2019, 123, 6560–6571. [Google Scholar] [CrossRef]
  35. Consani, S.; Carbone, C.; Dinelli, E.; Balić-Žunić, T.; Cutroneo, L.; Capello, M.; Salviulo, G.; Lucchetti, G. Metal Transport and Remobilisation in a Basin Affected by Acid Mine Drainage: The Role of Ochreous Amorphous Precipitates. Environ. Sci. Pollut. Res. 2017, 24, 15735–15747. [Google Scholar] [CrossRef]
  36. Menshikova, E.; Osovetsky, B.; Blinov, S.; Belkin, P. Mineral Formation under the Influence of Mine Waters (The Kizel Coal Basin, Russia). Minerals 2020, 10, 364. [Google Scholar] [CrossRef]
  37. SRK Consulting. Red Dog Geochemical Characterization–Sample Selections for the Main Waste Stockpile; Teck Alaska Incorporated: Kotzebue, AK, USA, 2017. [Google Scholar]
  38. Jambor, J.L.; Nordstrom, D.K.; Alpers, C.N. Metal-Sulfate Salts from Sulfide Mineral Oxidation. Rev. Mineral. Geochem. 2000, 40, 303–350. [Google Scholar] [CrossRef]
  39. Elberling, B.; Nicholson, R.V.; Scharer, J.M. A Combined Kinetic and Diffusion Model for Pyrite Oxidation in Tailings: A Change in Controls with Time. J. Hydrol. 1994, 157, 47–60. [Google Scholar] [CrossRef]
  40. Evangelou, V.P.; Zhang, Y.L. A Review: Pyrite Oxidation Mechanisms and Acid Mine Drainage Prevention. Crit. Rev. Environ. Sci. Technol. 1995, 25, 141–199. [Google Scholar] [CrossRef]
  41. Fan, R.; Qian, G.; Li, Y.; Short, M.D.; Schumann, R.C.; Chen, M.; Smart, R.S.C.; Gerson, A.R. Evolution of Pyrite Oxidation from a 10-Year Kinetic Leach Study: Implications for Secondary Mineralisation in Acid Mine Drainage Control. Chem. Geol. 2022, 588, 120653. [Google Scholar] [CrossRef]
  42. Gu, X.; Heaney, P.J.; Reis, F.D.A.A.; Brantley, S.L. Deep Abiotic Weathering of Pyrite. Science 2020, 370, eabb8092. [Google Scholar] [CrossRef]
  43. Nordstrom, D.K. Aqueous Pyrite Oxidation and the Consequent Formation of Secondary Iron Minerals. In Acid Sulfate Weathering; John Wiley & Sons, Ltd.: New York, NY, USA, 1982; pp. 37–56. ISBN 978-0-89118-905-3. [Google Scholar]
  44. Stumm, W.; Morgan, J.J. Aquatic Chemistry: Chemical Equilibria and Rates in Natural Waters, 3rd ed.; John Wiley & Sons: New York, NY, USA, 1996; ISBN 978-0-471-67303-3. [Google Scholar]
  45. Bao, Z.; Bain, J.; Saurette, E.; Zou Finfrock, Y.; Hu, Y.; Ptacek, C.J.; Blowes, D.W. Mineralogy-Dependent Sulfide Oxidation via Polysulfide and Thiosulfate Pathways during Weathering of Mixed-Sulfide Bearing Mine Waste Rock. Geochim. Cosmochim. Acta 2022, 317, 523–537. [Google Scholar] [CrossRef]
  46. Davis, G.B.; Ritchie, A.I.M. A Model of Oxidation in Pyritic Mine Wastes: Part 1 Equations and Approximate Solution. Appl. Math. Model. 1986, 10, 314–322. [Google Scholar] [CrossRef]
  47. Dos Santos, E.C.; de Mendonça Silva, J.C.; Duarte, H.A. Pyrite Oxidation Mechanism by Oxygen in Aqueous Medium. J. Phys. Chem. C 2016, 120, 2760–2768. [Google Scholar] [CrossRef]
  48. SRK Consulting. Waste Rock Dump Evaluation of Geochemical, Temperature and Gas Monitoring Data—1999, Project: 1UC009.04; Teck Alaska Incorporated: Kotzebue, AK, USA, 2000. [Google Scholar]
  49. Alpers, C.N.; Nordstrom, D.K.; Ball, J.W. Solubility of Jarosite Solid Solutions Precipitated from Acid Mine Waters, Iron Mountain, California. Sci. Geol. Bull. 1989, 42, 281–298. [Google Scholar] [CrossRef]
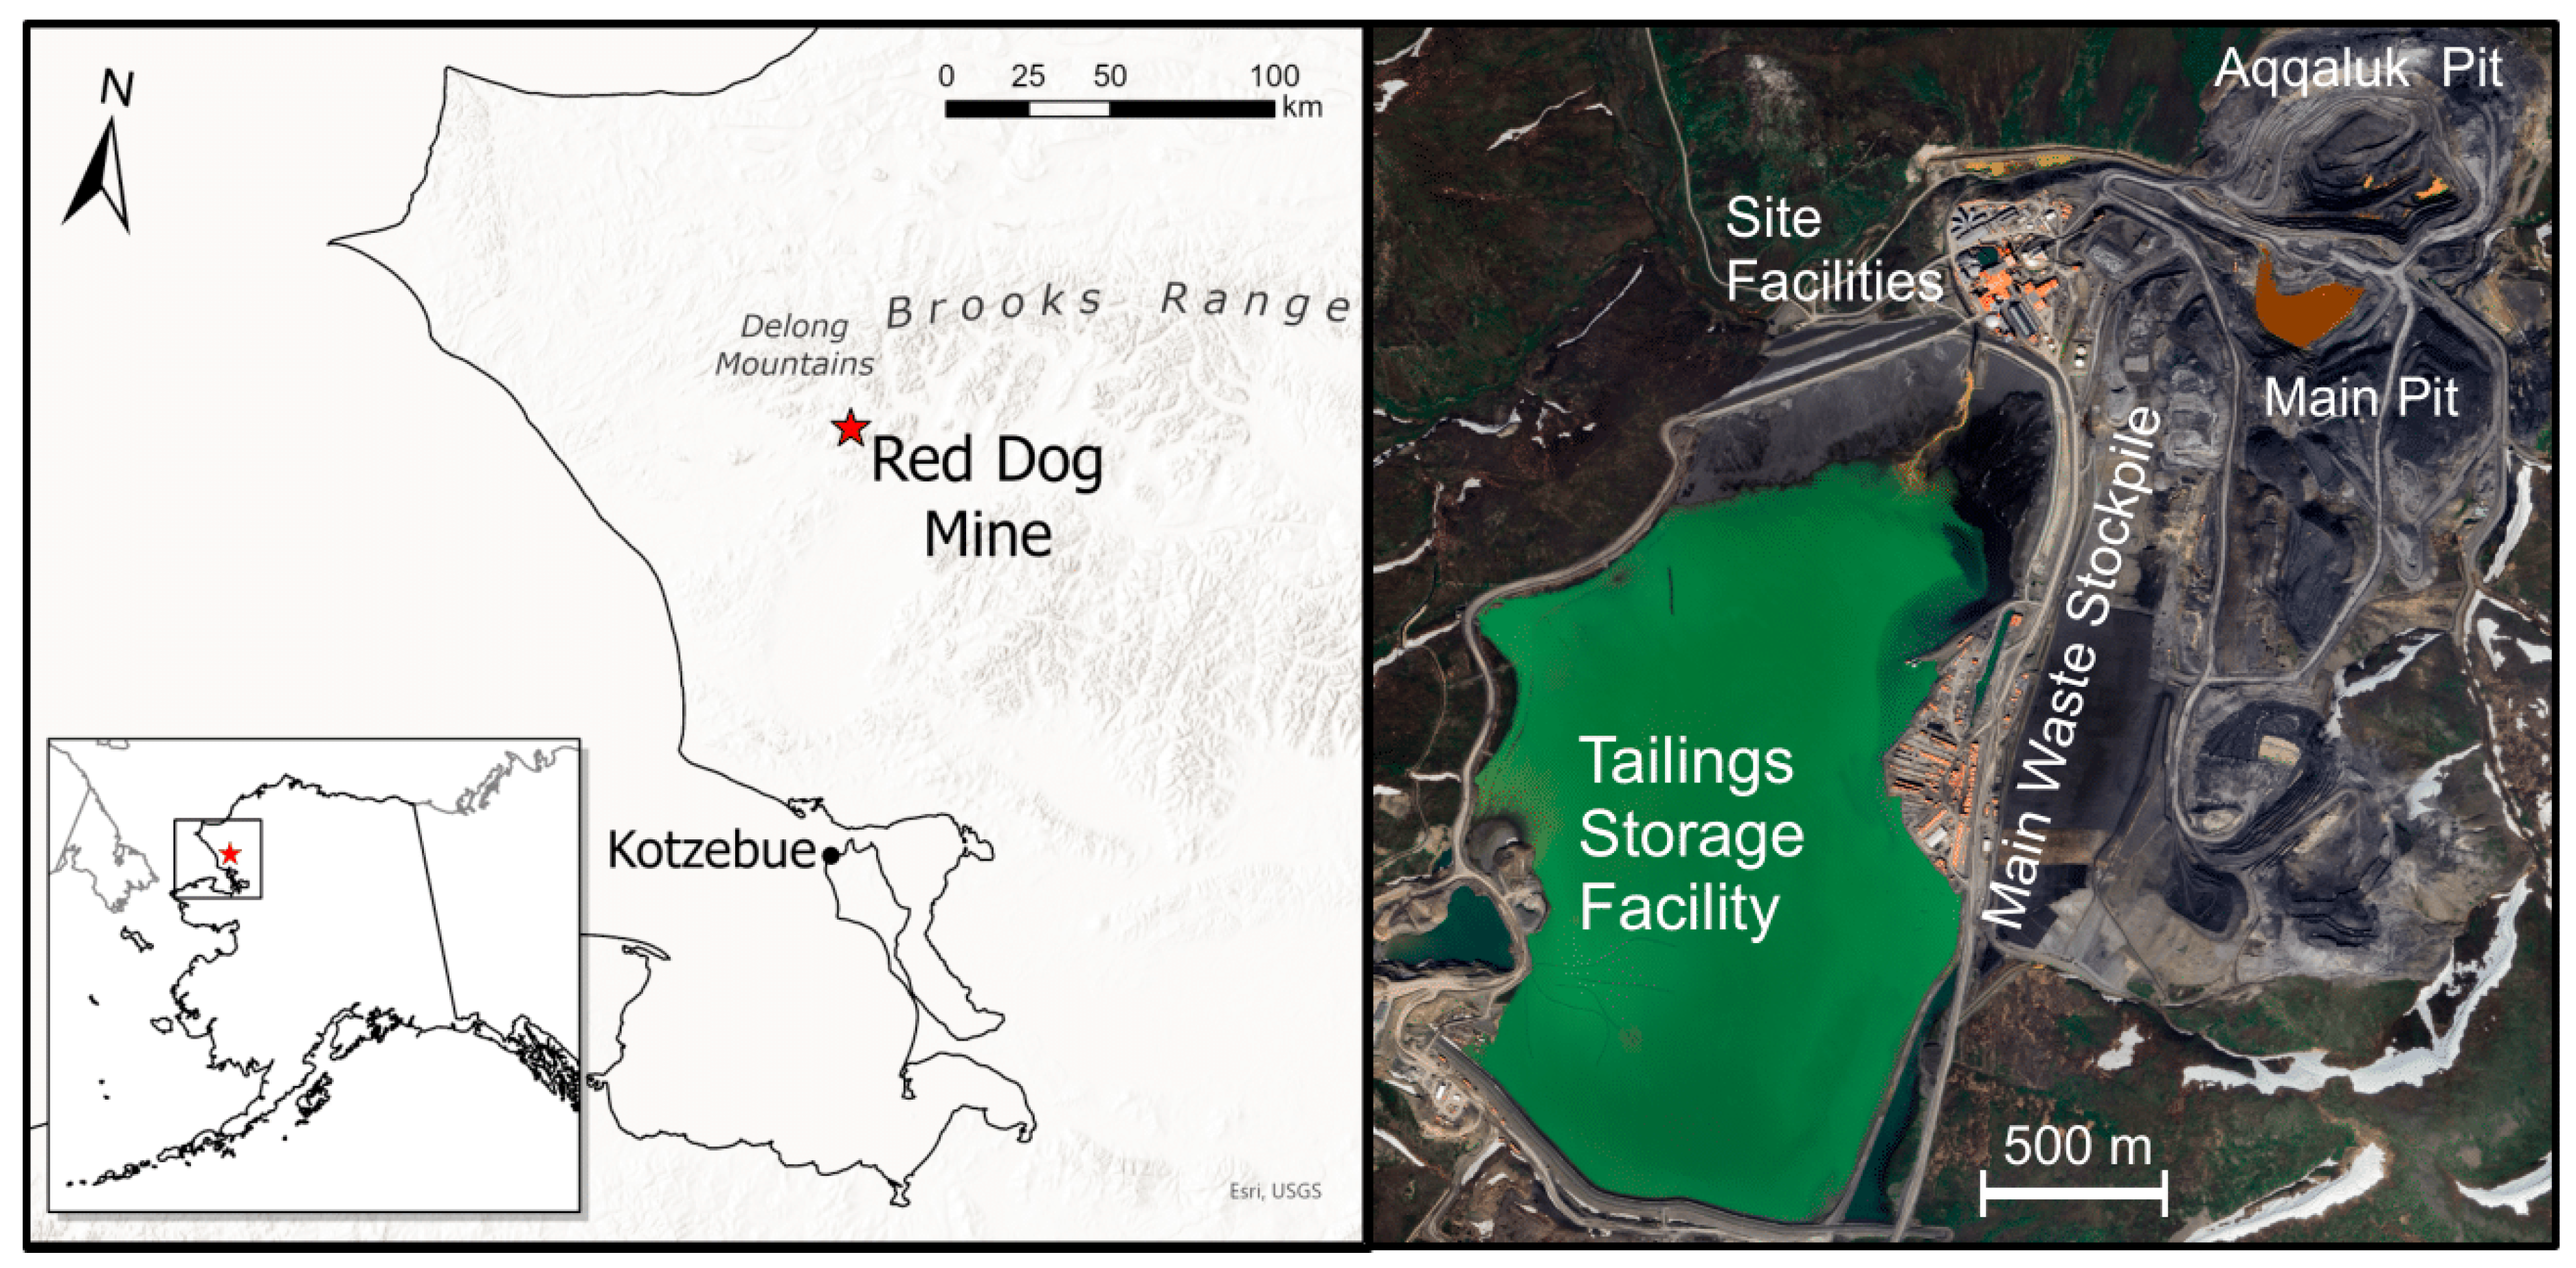
Figure 1. Location of Teck Resource’s Red Dog Mine and an aerial view of the Tailings Storage Facility (TSF), Main Waste Stockpile (MWS), and pits at the mine in 2023.
Mining 05 00074 g001
Figure 2. Main Waste Stockpile, collection trench, wells, cover phases, and the Tailings Storage Facility (TSF) (adapted from the 2023 Geosyntec/Teck Red Dog Operations Construction Phasing Main Waste Stockpile, Red Dog Mine drawing). Trench collection areas (trench segments) indicated by colored hash markings, which represent the collection area of each well (red dot) and the associated cover that would influence ARD collected in those trench segments.
Mining 05 00074 g002
Figure 3. Main Waste Stockpile: (a) cover construction from top of the pile, (b) covered portion of the pile with seeded growth, (c) aerial view of a portion of the pile, and (d) flume for measuring discharge from the cover collection system.
Mining 05 00074 g003
Figure 4. Generalized cross section of the Aqqaluk deposit indicating typical layering of the mineralized Red Dog ore [7]. Drill holes are indicated.
Mining 05 00074 g004
Figure 5. Cross-sectional view of conceptual flow model of the Main Waste Stockpile (MWS) where precipitation-derived acid rock drainage flows towards the collection trench (ARD trench) and the Tailings Storage Facility (TSF). The collection trench is estimated to collect 60% to 80% of all ARD emanating from the MWS [4].
Mining 05 00074 g005
Figure 6. Ponding of rainfall atop the Main Waste Stockpile during a waste rock sampling in July 2024 following a 16-mm storm event recorded at the Red Dog Mine airport.
Mining 05 00074 g006
Figure 7. Example of iron (oxyhydr)oxide and hydroxysulfate precipitates in a test pit dug by SRK Consulting in 2017 as part of a geochemical investigation of the upper weathered zone of the Main Waste Stockpile. This test pit was considered to be strongly oxidized with the presence of hematite, limonite, and jarosite [37].
Mining 05 00074 g007
Figure 8. Dissolved solids and pH trends in the acid rock drainage collected by the trench wells. The dashed line indicates completion of the portion of the cover that influences ARD collected by the individual trench well.
Mining 05 00074 g008
Figure 9. Total dissolved solids, pH, sulfate, and zinc trends in the acid rock drainage collected by the trench wells as a composite flow recorded at the ARD Tank.
Mining 05 00074 g009
Figure 10. Recorded flow and sulfate (SO4) and zinc (Zn) monthly loads of the acid rock drainage collected by the trench wells as a composite drainage recorded at the ARD Tank.
Mining 05 00074 g010
Table 1. Cover placement, area covered, and associated collection trench well (2023 Geosyntec/Teck Red Dog Operations Construction Phasing Main Waste Stockpile, Red Dog Mine drawing).
CoverCover
Completed
Pre-Cover DataArea Covered (ha)Associated Well
(Figure 2)
Phase IB2021January 2013 to June 202112.95MW #3
Phase II2022January 2013 to June 20228.38MW #2
Phase IV2023January 2013 to June 20239.87MW #4
Phase III 12024/25All data14.93MW #1 2
1 Numbering is out of order because of continued use of the Phase III area until the cover period. 2 Background well: no cover placement during the study period.
Table 2. Pre- and post-cover, mean and standard deviation of field parameters, total dissolved solids (TDS), iron, and sulfate for acid rock drainage sampled by the collection trench wells. Cond., conductivity; ORP, oxidation reduction potential; Temp., temperature. The pre-cover periods for each monitoring well are presented in Table 1.
WellpHCond. (mS/cm)ORP (mV)Temp. (°C)TDS (g/L)Fe (g/L)SO4 (g/L)
MW #12.63 ± 0.3916.00 ± 3.72402 ± 5910.25 ± 2.8054.42 ± 14.652.29 ± 0.9139.16 ± 12.96
MW #2:
Pre-cover2.58 ± 0.3016.31 ± 3.64403 ± 4010.16 ± 3.7449.94 ± 12.122.48 ± 0.6337.49 ± 9.29
Post-cover2.77 ± 0.3013.47 ± 4.17381 ± 3014.21 ± 2.1939.21 ± 12.541.79 ± 0.8729.71 ± 9.27
MW #3:
Pre-cover2.27 ± 0.3929.59 ± 31.84458 ± 5117.55 ± 4.5282.27 ± 25.782.95 ± 0.8160.69 ± 20.55
Post-cover2.29 ± 0.1521.07 ± 5.94470 ± 4817.85 ± 7.4077.13 ± 29.352.37 ± 0.8151.67 ± 21.21
MW #4:
Pre-cover2.86 ± 0.3512.65 ± 6.52365 ± 9314.81 ± 7.2329.10 ± 15.361.44 ± 0.8121.87 ± 10.79
Post-cover3.12 ± 0.616.27 ± 4.20320 ± 619.57 ± 4.2816.08 ± 8.400.68 ± 0.4710.89 ± 5.79
Table 3. Pre- and post-cover, mean and standard deviation of primary metal(loid) concentrations for acid rock drainage sampled by the collection trench wells. The pre-cover periods for each monitoring well are presented in Table 1.
WellAl (mg/L)Cd (mg/L)Cu (mg/L)Pb (mg/L)Mn (mg/L)Se (mg/L)Zn (g/L)
MW #1848 ± 21865 ± 169.9 ± 3.20.45 ± 0.80397 ± 1050.03 ± 0.0210.67 ± 2.92
MW #2:
Pre-cover786 ± 223 32 ± 112.8 ± 1.60.15 ± 0.21409 ± 1360.03 ± 0.107.96 ± 1.78
Post-cover523 ± 25818 ± 18 1.3 ± 2.20.10 ± 0.32295 ± 790.02 ± 0.015.82 ± 2.79
MW #3:
Pre-cover1201 ± 38767 ± 207.6 ± 2.90.03 ± 0.10582 ± 1670.08 ± 0.0914.53 ± 4.34
Post-cover964 ± 43073 ± 387.1 ± 3.10.01 ± 0.01465 ± 2310.09 ± 0.0412.57 ± 4.25
MW #4:
Pre-cover366 ± 23628 ± 175.1 ± 4.10.21 ± 0.18444 ± 2020.02 ± 0.054.47 ± 2.44
Post-cover184 ± 14710 ± 4.81.2 ± 1.10.10 ± 0.02231 ± 1260.01 ± 0.012.09 ± 1.04
Table 4. Results of two-tail Wilcoxon rank sum test with Hodges-Lehmann estimator (HL est.) comparing pre- and post-cover pH, conductivity, temperature, total dissolved solids (TDS), iron, sulfate, and zinc values for acid rock drainage collected at the trench wells. The Hodges-Lehmann statistic is the median of the pre-cover × post-cover differences. A positive statistic indicates greater values in the pre-cover population. The pre-cover periods for each monitoring well are presented in Table 1.
WellpHConductivityTemperatureTDSFeSO4Zn
MW #2:
p value<0.01<0.01<0.01<0.01<0.01<0.01<0.01
HL est.−0.252760−4.413,60081087002530
MW #3:
p value<0.01<0.010.020.12<0.010.210.01
HL est.−0.1458022.610,65077072003000
MW #4:
p value0.06<0.01<0.01<0.01<0.01<0.01<0.01
HL est.−0.3061075.211,80071097652110
Table 5. Results of two-tail Wilcoxon rank sum test with Hodges-Lehmann estimator (HL est.) comparing equivalent pre- and post-cover periods for pH, conductivity, temperature, total dissolved solids (TDS), iron, sulfate, and zinc values for acid rock drainage collected at the trench wells. The Hodges-Lehmann statistic is the median of the pre-cover × post-cover differences. A positive statistic indicates greater values in the pre-cover population. The pre-cover periods for each monitoring well are presented in Table 1.
WellpHConductivityTemperatureTDSFeSO4Zn
MW #2:
p value<0.010.08<0.01<0.01<0.010.020.02
HL est.−0.201617−3.210,65065082001395
MW #3:
p value<0.01<0.010.240.02<0.010.200.01
HL est.−0.2065721.417,80082095003300
MW #4:
p value0.760.760.980.720.90.960.72
HL est.0.08170−0.1−108530.5105−201
Table 6. Results of the Mann-Kendall test for monotonic trends for the pre- and post-cover pH and total dissolved solids (TDS) values from the collection trench wells. A negative tau (τ) value indicates a possible decreasing trend, and positive τ indicates a possible increasing trend. Associated p values indicate the potential significance of the trend. The pre-cover periods for each monitoring well are presented in Table 1.
Well (Period)pH τpH p ValueTDS τTDS p Value
MW #1−0.050.450.4<0.01
MW #2:
Pre-cover0.110.10−0.110.09
Post-cover0.210.15−0.61<0.01
MW #3:
Pre-cover−0.27<0.010.35<0.01
Post-cover−0.110.47−0.070.66
MW #4:
Pre-cover0.130.06−0.42<0.01
Post-cover0.280.20−0.490.02
Table 7. Estimates of iron sulfide (FeS2) and hydrogen ion (H+) availability, production, and/or consumption with weathering of the Main Waste Stockpile (MWS) from 2013 through 2023 for four potential FeS2 concentrations.
Total ARD: 60% Captured by the TrenchTotal ARD: 80% Captured by the Trench
FeS2 concentration3%5%7%9%3%5%7%9%
FeS2 (Mt) 11.83.04.25.41.83.04.25.4
FeS2 (Mmol) 115,00025,00035,00045,00015,00025,00035,00045,000
Total flow (103 m3)52005200520052003900390039003900
ARD H+ (Mmol) 279,20079,20079,20079,20059,40059,40059,40059,400
Low acid production (Equation (1), 2 × H+ for each mol of FeS2)
Potential H+ (Mmol)30,00050,00070,00090,00030,00050,00070,00090,000
Remaining H+ (%)−164−58−1312−98−191534
Medium acid production (Equation (3), 4 × H+ for each mol of FeS2)
Potential H+ (Mmol)60,000100,000140,000180,00060,000100,000140,000180,000
Remaining H+ (%)−322143561415867
High acid production (Equation (2), 16 × H+ for each mol of FeS2)
Potential H+ (Mmol)240,000400,000560,000720,000240,000400,000560,000720,000
Remaining H+ (%)6780868975858992
1 The available FeS2 is an estimate of the FeS2 emplaced in the MWS during its construction based on analysis of waste rock by SRK Consulting (2000, 2003, 2020). The available FeS2 has not been adjusted for loss from weathering prior to 2013. 2 The estimated total H+ in the MWS ARD from 2013 through 2023 is derived from the pH and flow recorded for the ARD Tank and the estimated 60% to 80% of the total ARD captured by the collection trench [4].
Disclaimer/Publisher’s Note: The statements, opinions and data contained in all publications are solely those of the individual author(s) and contributor(s) and not of MDPI and/or the editor(s). MDPI and/or the editor(s) disclaim responsibility for any injury to people or property resulting from any ideas, methods, instructions or products referred to in the content.