1. Introduction
Ontario’s supply mix has significantly changed over the last decade—wind, solar, bioenergy, waterpower, refurbished nuclear and natural gas-fired resources have replaced Ontario’s coal fleet [
1]. From 2014 to 2024, the renewable energies share, including hydroelectricity, wind and solar, increased by 3.8%, with hydroelectricity remaining the dominant contributor [
2,
3]. However, this rapid growth of renewable energy sources has introduced significant intermittency and seasonal variability to power systems, while the high reliance on hydroelectricity further challenges the energy supply system due to the vast geological space it requires [
4].
To ensure grid reliability and resilience, large-scale, long-duration energy storage solutions are urgently required, and further changes are required to reduce the system’s dependence on extensive spatial resources. In this context, underground energy storage systems have provided a promising solution, among which underground pumped hydro storage (UPHS) stands out. Pumped hydro storage (PHS) remains the most mature and cost-effective energy storage technique, comprising about 96% of global storage power capacity and 99% of global storage energy volume [
5], and the energy efficiency can reach up to 80% [
6]. Unlike electrochemical storage, this efficiency does not degrade significantly over time [
7]. It also offers fast response and grid stability services, as it can rapidly shift from pumping to generating, providing peaking power, frequency regulation and black-start capability [
8]. However, traditional PHS systems are constrained by their geographic specificity, whereas UPHS—by utilizing underground formations such as salt caverns or excavated chambers—offers feasibility across a wider range of geological settings and reduces reliance on extensive surface space. This approach circumvents the steep topography normally required for surface pumped hydro, enabling large-scale energy storage even in flat regions [
9]. By moving reservoirs underground, it avoids flooding new valleys or building large dams in sensitive areas, minimizing environmental footprint [
10]. It provides an even more effective alternative in regions with flat stratigraphic formations and limited surface space, such as Ontario, Canada.
Southern Ontario lies along the eastern flank of the Michigan Basin, where the Upper Silurian Salina Group hosts thick, laterally extensive evaporite sequences [
11,
12]. The salt units, notably Salina A2 and B, can reach thicknesses exceeding 60–100 m individually, with the entire group locally exceeding 400 m in cumulative thickness [
13]. The history of salt mining and solution extraction can be traced to the 1980s and demonstrates continuity through to recent years [
2,
3]. Not only the salt mines themselves but also the extensive underground voids created by mining have been widely utilized for energy storage. Solution-mined salt caverns in Sarnia area were used to store liquid hydrocarbons, regulated under the Oil, Gas and Salt Resources Act [
14], and caverns in the Sarnia–Windsor region have been used for hydrocarbon storage [
15]. In addition to hydrocarbon storage, several studies have demonstrated the suitability of these caverns for hydrogen and CO
2 storage applications, emphasizing their tightness, thermal stability, and reusability for energy transition purposes [
16,
17,
18]. The existence of numerous legacy and operational caverns further highlights their suitability for energy storage applications. They demonstrate the viability of salt caverns as secure, large-capacity underground reservoirs, making them especially suitable for UPHS, which is less prone to leakage than other storage methods coupling with gases.
Early feasibility studies and pilot designs have confirmed the technical potential of UPHS. For example, modeling of a proposed hybrid UPHS using abandoned coal mine voids in China showed a round-trip efficiency around 80–83% and demonstrated that daily energy cycling is feasible with proper design [
19]. Similarly, Pujades et al. conducted a detailed numerical assessment of UPHS performance in mined voids, confirming comparable efficiencies and stable operation under realistic geological conditions [
9]. Researchers in Europe have also explored the possibility of utilizing abandoned deep coal mines and open-pit quarries as UPHS reservoirs, finding that such systems could effectively provide grid-scale storage [
20]. Beyond performance evaluation, Menéndez et al. conducted a detailed geomechanical assessment of underground powerhouse caverns and tunnel networks in closed coal mines, confirming that structural stability can be maintained under operational pressures up to 420 kPa when proper support systems are implemented [
21]. Their subsequent study combined empirical rock-mass classification with numerical modeling, further verifying that reinforced shotcrete and bolting effectively control deformations and ensure long-term stability of underground reservoirs [
22]. Researchers have also proposed UPHS configurations that couple a surface (or shallow) upper reservoir with a deep cavern serving as the lower reservoir, or employ twin caverns at different depths within a salt dome [
23]. However, few simulations have validated such configurations. Recent studies have primarily focused on UPHS in generic excavated caverns rather than salt-specific settings. Considerable research has addressed the potential impacts of brine leakage; for example, Pujades et al. demonstrated that exchanges between an underground reservoir and surrounding groundwater can markedly reduce the round-trip efficiency of an UPSH system [
20]. Thermo-mechanical behavior has also been identified as a critical factor in underground gas storage, where simulations show that varying the heat-transfer coefficient at the cavern wall alters both the surrounding rock temperature and the pressure evolution during gas injection and withdrawal [
18], yet the thermal effects of UPHS systems remain rarely examined. In parallel, numerous studies on underground compressed air and hydrogen storage have highlighted the importance of thermo-mechanical coupling in salt caverns. Temperature fluctuations during cyclic gas injection and withdrawal can significantly alter creep rate, stress redistribution, and permeability evolution in halite, directly affecting cavern stability [
24,
25]. These findings underline the need to assess similar thermo-mechanical effects for water-based UPHS systems, where long-term heat exchange with the host rock may influence deformation and leakage behavior. Moreover, despite the recognized potential of the Salina Group and extensive studies on UPHS and underground energy storage, limited work has explored the geomechanical feasibility of UPHS caverns in Ontario—particularly studies that integrate long-term deformation with thermal and leakage effects.
In this study, long-term simulation combining elasto-plastic deformation and creep development with thermal and brine leakage effect is conducted targeting at the lithology and geology of Salina Group in south Ontario. Building upon the previous work that established safe pressure ranges for cavern operation, the present study extends the analysis to thermo-mechanical coupling, emphasizing the role of temperature effects on cavern stability and performance, with the leakage effect considered.
2. Geological Setting
Southern Ontario lies on the eastern margin of the Michigan Basin, where the Upper Silurian Salina Formation comprises a series of evaporite units (A–G), among which units F, D, B, and the lower part of A2 contain halite deposits [
26]. Unit B provides the most suitable interval for large-scale cavern development owing to its thickness, lateral continuity, and relatively pure halite content. In contrast, Units F and D are interbedded with shale, dolomite, or anhydrite, while Unit A2, though locally composed of high-quality salt, is too thin to accommodate large storage caverns alone.
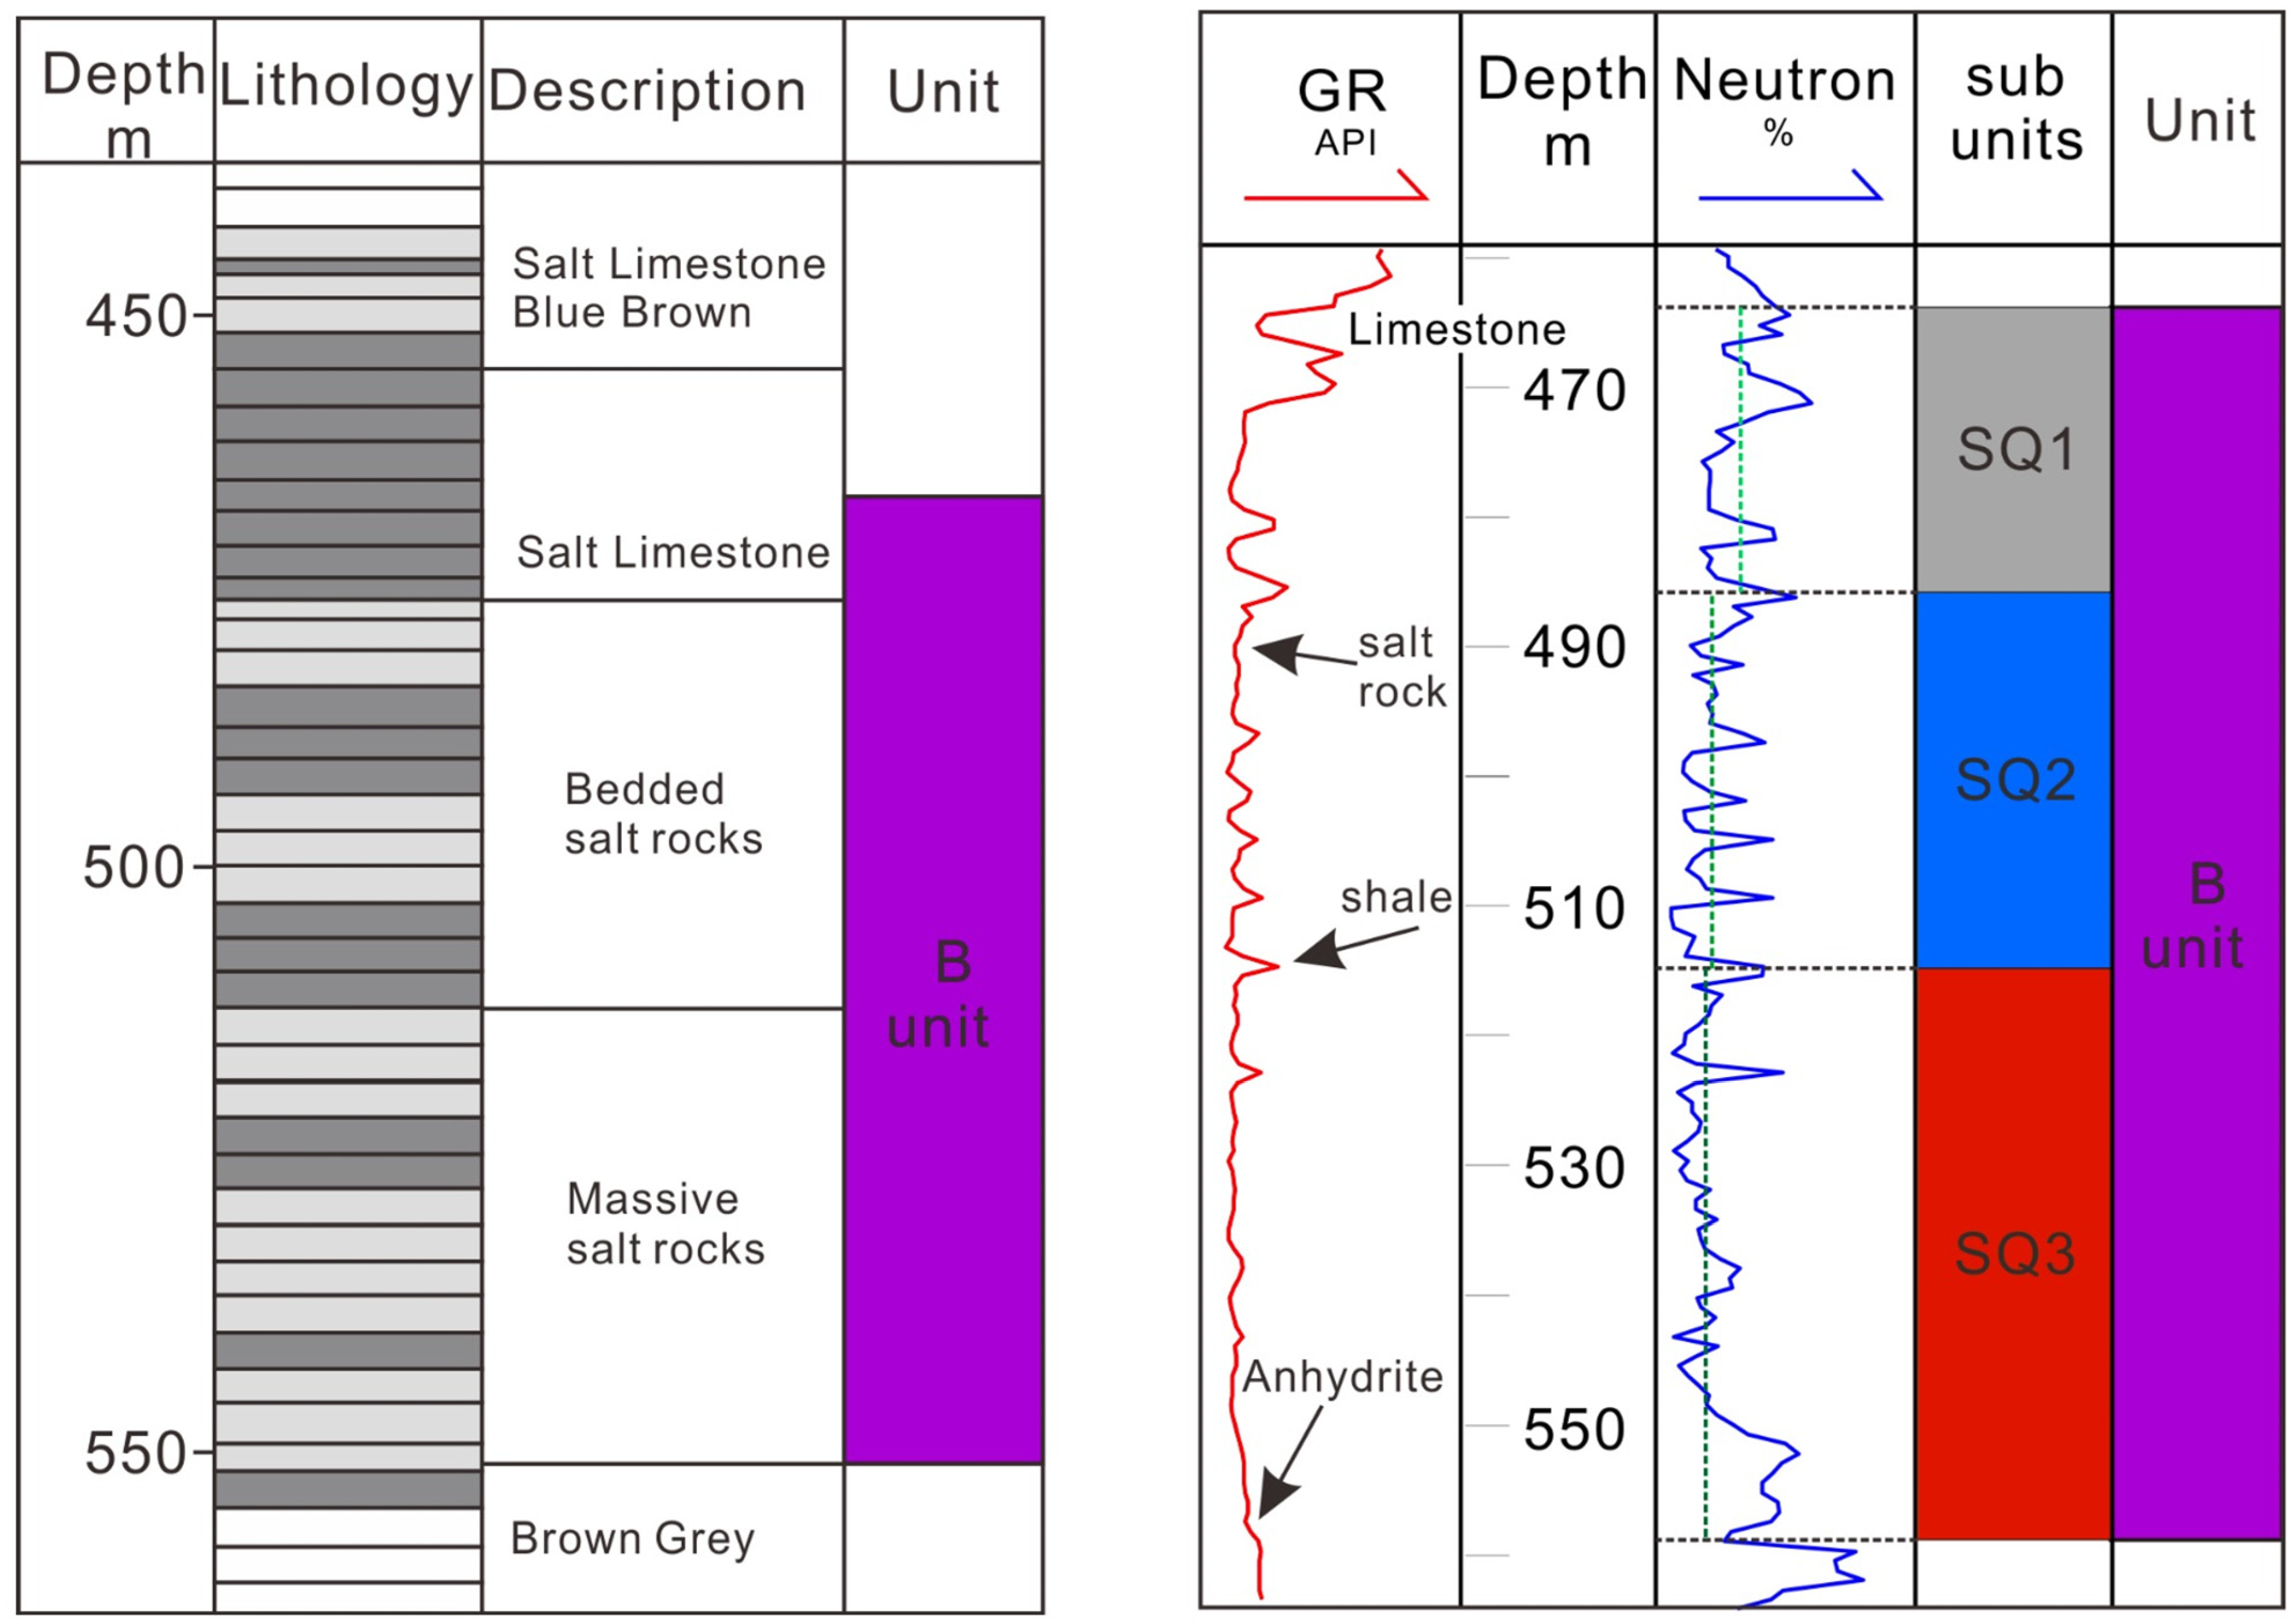
Figure 1 demonstrates the detailed lithology distribution of the Salina Formation.
Unit B can be subdivided into three high-frequency sequences based on logging data. SQ1 contains significant carbonate material and is generally excluded from cavern design. SQ2 is characterized by halite with thin shale interbeds, while SQ3 consists predominantly of massive halite with stable logging responses.
Figure 2 illustrates the components of these subunits and around unit B, using data from wells F006864 and T003039 as examples [
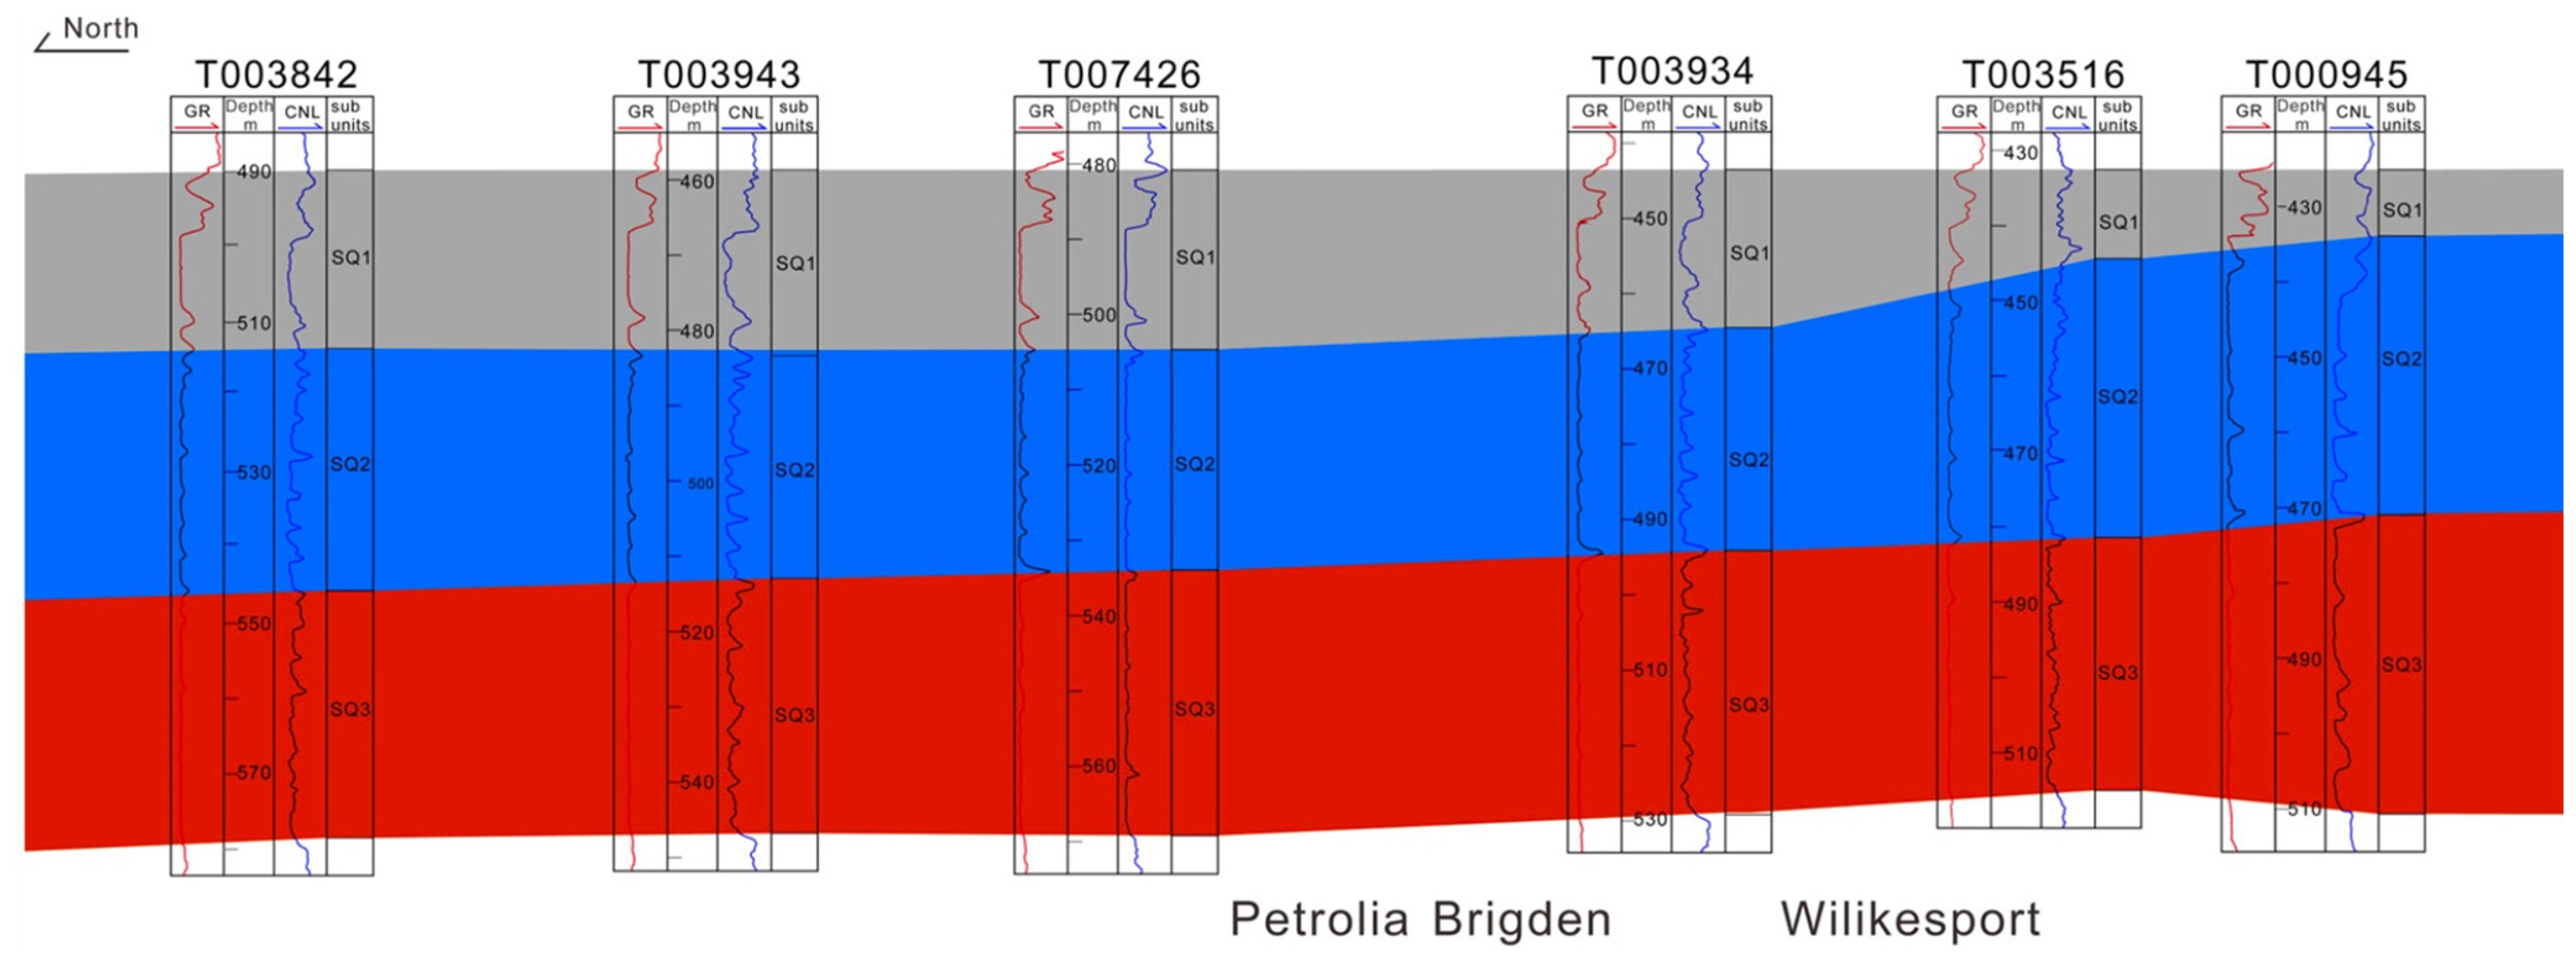
20]. Each subunit is distinguished by a different color. For modeling purposes, average thicknesses of 30 m for SQ2 and 35 m for SQ3 were adopted, reflecting the uniform conditions observed in the Petrolia–Bridge–Wilkesport area.
Figure 3 illustrates the north–south variation in halite subunits, showing a relatively stable thickness distribution across the study area. On this basis, the strata are approximated as horizontal and laterally continuous in the numerical model, a simplification that captures regional trends while reducing computational complexity. Shale layers were incorporated into SQ2 to account for heterogeneity, while SQ3 was treated as nearly pure halite. This simplified stratigraphic representation provides a geologically reasonable basis for evaluating the thermo-mechanical performance of salt caverns.
3. Constitutive Model
3.1. Elastoplastic Constitutive Model
In this study, the Drucker–Prager (D–P) material model is employed to simulate the elastoplastic behavior of the surrounding rock mass. By incorporating both frictional and cohesive strength parameters, the D–P criterion effectively captures the onset of plastic yield and shear failure in salt formations. The model has been widely applied in geotechnical and petroleum engineering, particularly in cases involving geomaterials with significant plasticity, such as during borehole stability analysis, tunnel excavation, and solution-mined cavern development, where accurate assessment of near-field failure mechanisms is essential.
Considering the compressive stress negative, the yield criterion for the Drucker-Prager model is expressed as follows:
where
is the second invariant of the stress deviator tensor, and
is the first invariant of the stress tensor, defined as follows:
where
,
,
being the principal effective stresses. α and k are related to the material’s cohesion and friction angle through the following expressions:
This formulation links the Drucker–Prager criterion to the conventional Mohr–Coulomb parameters, enabling its convenient use in numerical implementations while preserving consistency with the physical meaning of shear strength in rocks.
3.2. Creep Constitutive Model
The rheological behavior of halite was described using the Norton–Bailey creep law, which defines the creep strain rate as [
27]:
where A is the creep coefficient, n is the stress exponent, and q is the equivalent stress term. The latter is related to the deviatoric stress state through:
To capture the primary stage of creep, a strain-hardening function was introduced [
27]:
where m is the hardening exponent (set to 0.4 in this study),
is the equivalent creep strain, and
is a small shift parameter (
) introduced to avoid singularity at the onset of loading.
is a reference time, here taken as 1 h. As creep develops, the value of
gradually decreases toward zero, signifying the transition from primary creep to the secondary creep regime. This formulation thus enables a smooth representation of the creep evolution of halite under long-term loading conditions.
To couple the thermal effect on the creep deformation, Arrhenius thermal function was introduced as follows [
27]:
where Q is the creep activation energy (set to 54 kJ/mol in this study), R is the universal gas constant (8.314
). T is the absolute temperature,
is a reference temperature, here taken as 303.15 K. This function scales the creep rate according to the temperature difference relative to
, capturing the acceleration of halite creep at elevated temperatures.
3.3. Brine Leakage Constitutive Model
To simulate brine leakage during long-term injection–withdrawal cycles, the Darcy flow formulation was employed to represent fluid migration in the porous host rock. The governing mass balance equation is as follows [
28]:
where
is the porosity of the surrounding rock,
is the brine density,
is the Darcy velocity, and
represents fluid sources or sinks. The Darcy velocity is defined as
with
the intrinsic permeability of the formation,
the dynamic viscosity of brine,
the pore pressure, and
gravitational acceleration. The host rock is assumed to be isotropic.
Because halite typically has very low porosity and permeability, the initial condition of the host formation was set as fully compacted and dry, with brine inflow occurring only through operational injection when leaching and during the circulations. Although the leakage rate is expected to be limited, its long-term effect on cavern stability and stress redistribution requires consideration, and the existence of shale interlayers may accelerate the leaking process. In such low-permeability media, the Reynolds number remains small, and flow conditions are well within the Darcy regime, ensuring the validity of this formulation.
To include the compressibility of both the brine and the porous matrix, the governing equation can be written as [
28]:
where
and
and
denote the compressibility of brine and of the host rock, respectively. This formulation provides a generalized conservation equation for simulating brine seepage through low-permeability salt and shale layers under UPHS operation.
However, it is noteworthy that this approach assumes single-phase Darcy flow and does not account for additional mechanisms such as molecular diffusion, capillary effects, or gas–brine interactions. This simplification is justified because, although cushion gas may leak to a limited extent, its inventory is small and connectivity to the formation is low; consequently, long-term leakage is dominated by liquid flow through the surrounding strata. Moreover, small-scale heterogeneity and permeability anisotropy are not explicitly represented; these could locally enhance or suppress leakage along interbeds or dissolution zones. Nevertheless, given the extremely low permeability of the host salt and interbedded formations, the single-phase Darcy assumption provides a reasonable and conservative estimate of long-term brine migration.
3.4. Thermal Expansion
Thermal loading due to temperature variations was incorporated through a linear thermal strain formulation. The total strain tensor is expressed as the sum of elastic, plastic/creep, and thermal components:
The thermal strain term is given by
where
is the coefficient of thermal expansion of the rock, and I is the identity tensor.
3.5. Poroelasticity
The coupling between solid deformation and pore pressure evolution caused by long-term brine leakage was represented using Biot’s poroelasticity theory. The equilibrium equation can be expressed as follows [
29]:
where S is the total stress tensor,
is the absolute pore pressure,
is the reference pore pressure,
is the Biot coefficient, and
is the body force vector.
The fluid mass balance is written as [
29]:
where
is the fluid density,
is the pore pressure,
is the Darcy velocity,
is the volumetric strain of the solid skeleton, and
is a source term. The storage coefficient is defined as:
with
the fluid compressibility, and
the solid compressibility, expressed as:
where
is the drained bulk modulus of the porous medium.
4. Numerical Model
A three-dimensional numerical model was constructed in COMSOL Multiphysics 6.3, incorporating both Unit B and the underlying A2 evaporite unit to provide sufficient vertical separation for cavern placement. The upper cavern was positioned within Unit B and the lower cavern within Unit A2. For modeling purposes, Unit B was subdivided into three layers (SQ1–SQ3) with average thicknesses of 25 m, 30 m, and 35 m, respectively, while the A2 salt layer was assigned a thickness of 45 m. Overlying carbonate and anhydrite strata were simplified as homogeneous elastic formations to reduce model complexity. A representative model domain of 200 m × 200 m × 200 m was adopted, with the top boundary corresponding to a burial depth of 455 m. Based on computational analysis, the average density of the overlying strata is assumed to be 2300 kg/m
3. Material parameters were derived from published laboratory and field data for the Salina Group and comparable evaporitic formations within the Michigan Basin and northern Appalachian region [
30,
31,
32,
33]. Because no site-specific core tests or in situ measurements are available for Southern Ontario, representative literature values were adopted to capture the typical mechanical, hydraulic, and thermal behavior of bedded salt and its interbeds. The selected datasets are consistent with previous numerical studies on evaporite storage systems in Canada and other North American salt provinces, ensuring that the model reflects realistic regional conditions while maintaining computational simplicity.
The detailed mechanical properties of the rock mass are listed in
Table 1.
The caverns were modeled as vertical cylinders with a diameter-to-height ratio of 1.5. Rounded edges, fillet radius of 5 m, were adopted to represent the irregular shaped of leached cavern geometry. To allow for well installation, a 15 m vertical offset was introduced between the two caverns. Engineering guidelines were followed to maintain adequate buffer zones between cavern walls and surrounding strata, as a minimum thickness of 20 m is recommended for the hanging wall, and 10 m for the footwall, to ensure mechanical integrity and prevent failure [
16,
17]. However, adjustments were made to account for the limited thickness of the A2 salt unit. The final cavern height was set to 30 m, with 10 m and 5 m reserved for the hanging wall and roof, respectively.
The UPHS cycle was simulated by alternately transferring brine between two vertically separated caverns. At the beginning of each cycle, one cavern was fully filled while the other contained approximately 20% of its volume to ensure the brine level remained above the outlet of the production tube. During the charging phase, brine was pumped out from the lower cavern and flows to the upper cavern, letting buffer air cushion transferred to the lower cavern through outer casing automatically. In the discharging phase, brine was pumped from the upper cavern, and the pressure differential drove it back into the lower cavern, converting gravitational potential energy into electricity. To preserve cavern integrity during circulation, a residual pressure was maintained by buffer air cushion. Following engineering guidelines, residual working pressures were defined as 20%, 30%, and 40% of the vertical geostatic stress, corresponding to 2.4–4.9 MPa for the upper cavern and 2.8–5.5 MPa for the lower cavern. This approach avoids excessive pressure drops that could induce large stress fluctuations or destabilize the cavern walls. To ensure overall stability of both caverns, a buffer air pressure of 5 MPa was selected and maintained throughout the entire process.
The flow rate was fixed at 1.8 m
3/s, consistent with previous UPHS studies in Europe, balancing hydraulic efficiency with turbine stability [
9]. For caverns of the chosen size, the charging or discharging time was calculated as approximately 5.7 h, as calculated below, and both phases were simplified to 6 h for modeling, resulting in two cycles per day and simulating a total period of five years. The brine level variations within one cycle were represented by periodic functions f(t), which regulate the hydrostatic load and internal cavern pressure applied in the model.
The corresponding energy output per daily cycle was estimated as below,
where
is the density of brine, h is the height difference between two caverns, which is 65 m in this study. V is the volume of working brine, which is 0.8 times the cavern volume. η is system efficiency, assumed to be 0.8. The energy stored in a single charge cycle, approximately 12,576 kWh, sufficient to supply 500–600 households, assuming a typical daily consumption of 20–30 kWh per household [
33].
During UPHS operation, the temperature of injected brine represents a critical factor influencing the thermo-mechanical response of salt caverns. Brine injected into the cavern undergoes relatively slow circulation compared to gas storage systems, leading to gradual and long-term heat exchange with the surrounding rock mass. Previous studies on underground gas storage have demonstrated that temperature fluctuations at the cavern wall directly alter creep rates and stress redistribution in salt formations [
34,
35]. However, unlike rapid gas injection, as brine circulation occurs over extended periods and with relatively low heat input, the thermal evolution can be approximated as quasi-isothermal. Consequently, the cavern wall was assigned constant temperature boundary conditions representing different injection scenarios, specifically 10 °C, 15 °C, and 20 °C. These values were selected within a reasonable and conservative range of operational brine temperatures under surface ambient conditions and pumping-induced heating, representing realistic brine conditions expected for underground pumped hydro storage systems in temperate regions such as Southern Ontario [
34,
36]. Previous modeling of underground energy storage systems including compressed air and water storage has adopted similar near-isothermal temperature ranges (10–20 °C) to represent quasi-steady operational conditions [
21]. Higher injection temperatures (>25 °C) were not considered because they are uncommon under Canadian surface climate and could unrealistically accelerate halite creep and permeability evolution. Therefore, the chosen range adequately brackets the realistic thermal conditions while capturing their potential influence on cavern deformation and brine leakage, enabling assessment of how modest but sustained temperature differences affect salt creep, deformation, and cavern stability over long-term cyclic operation. The thermal expansion of brine is neglected in this study, as its effect on pressure and leakage is considered negligible compared with the dominant creep and mechanical responses of the surrounding salt rock. The detailed thermal properties of the rock mass and brine are listed in
Table 2.
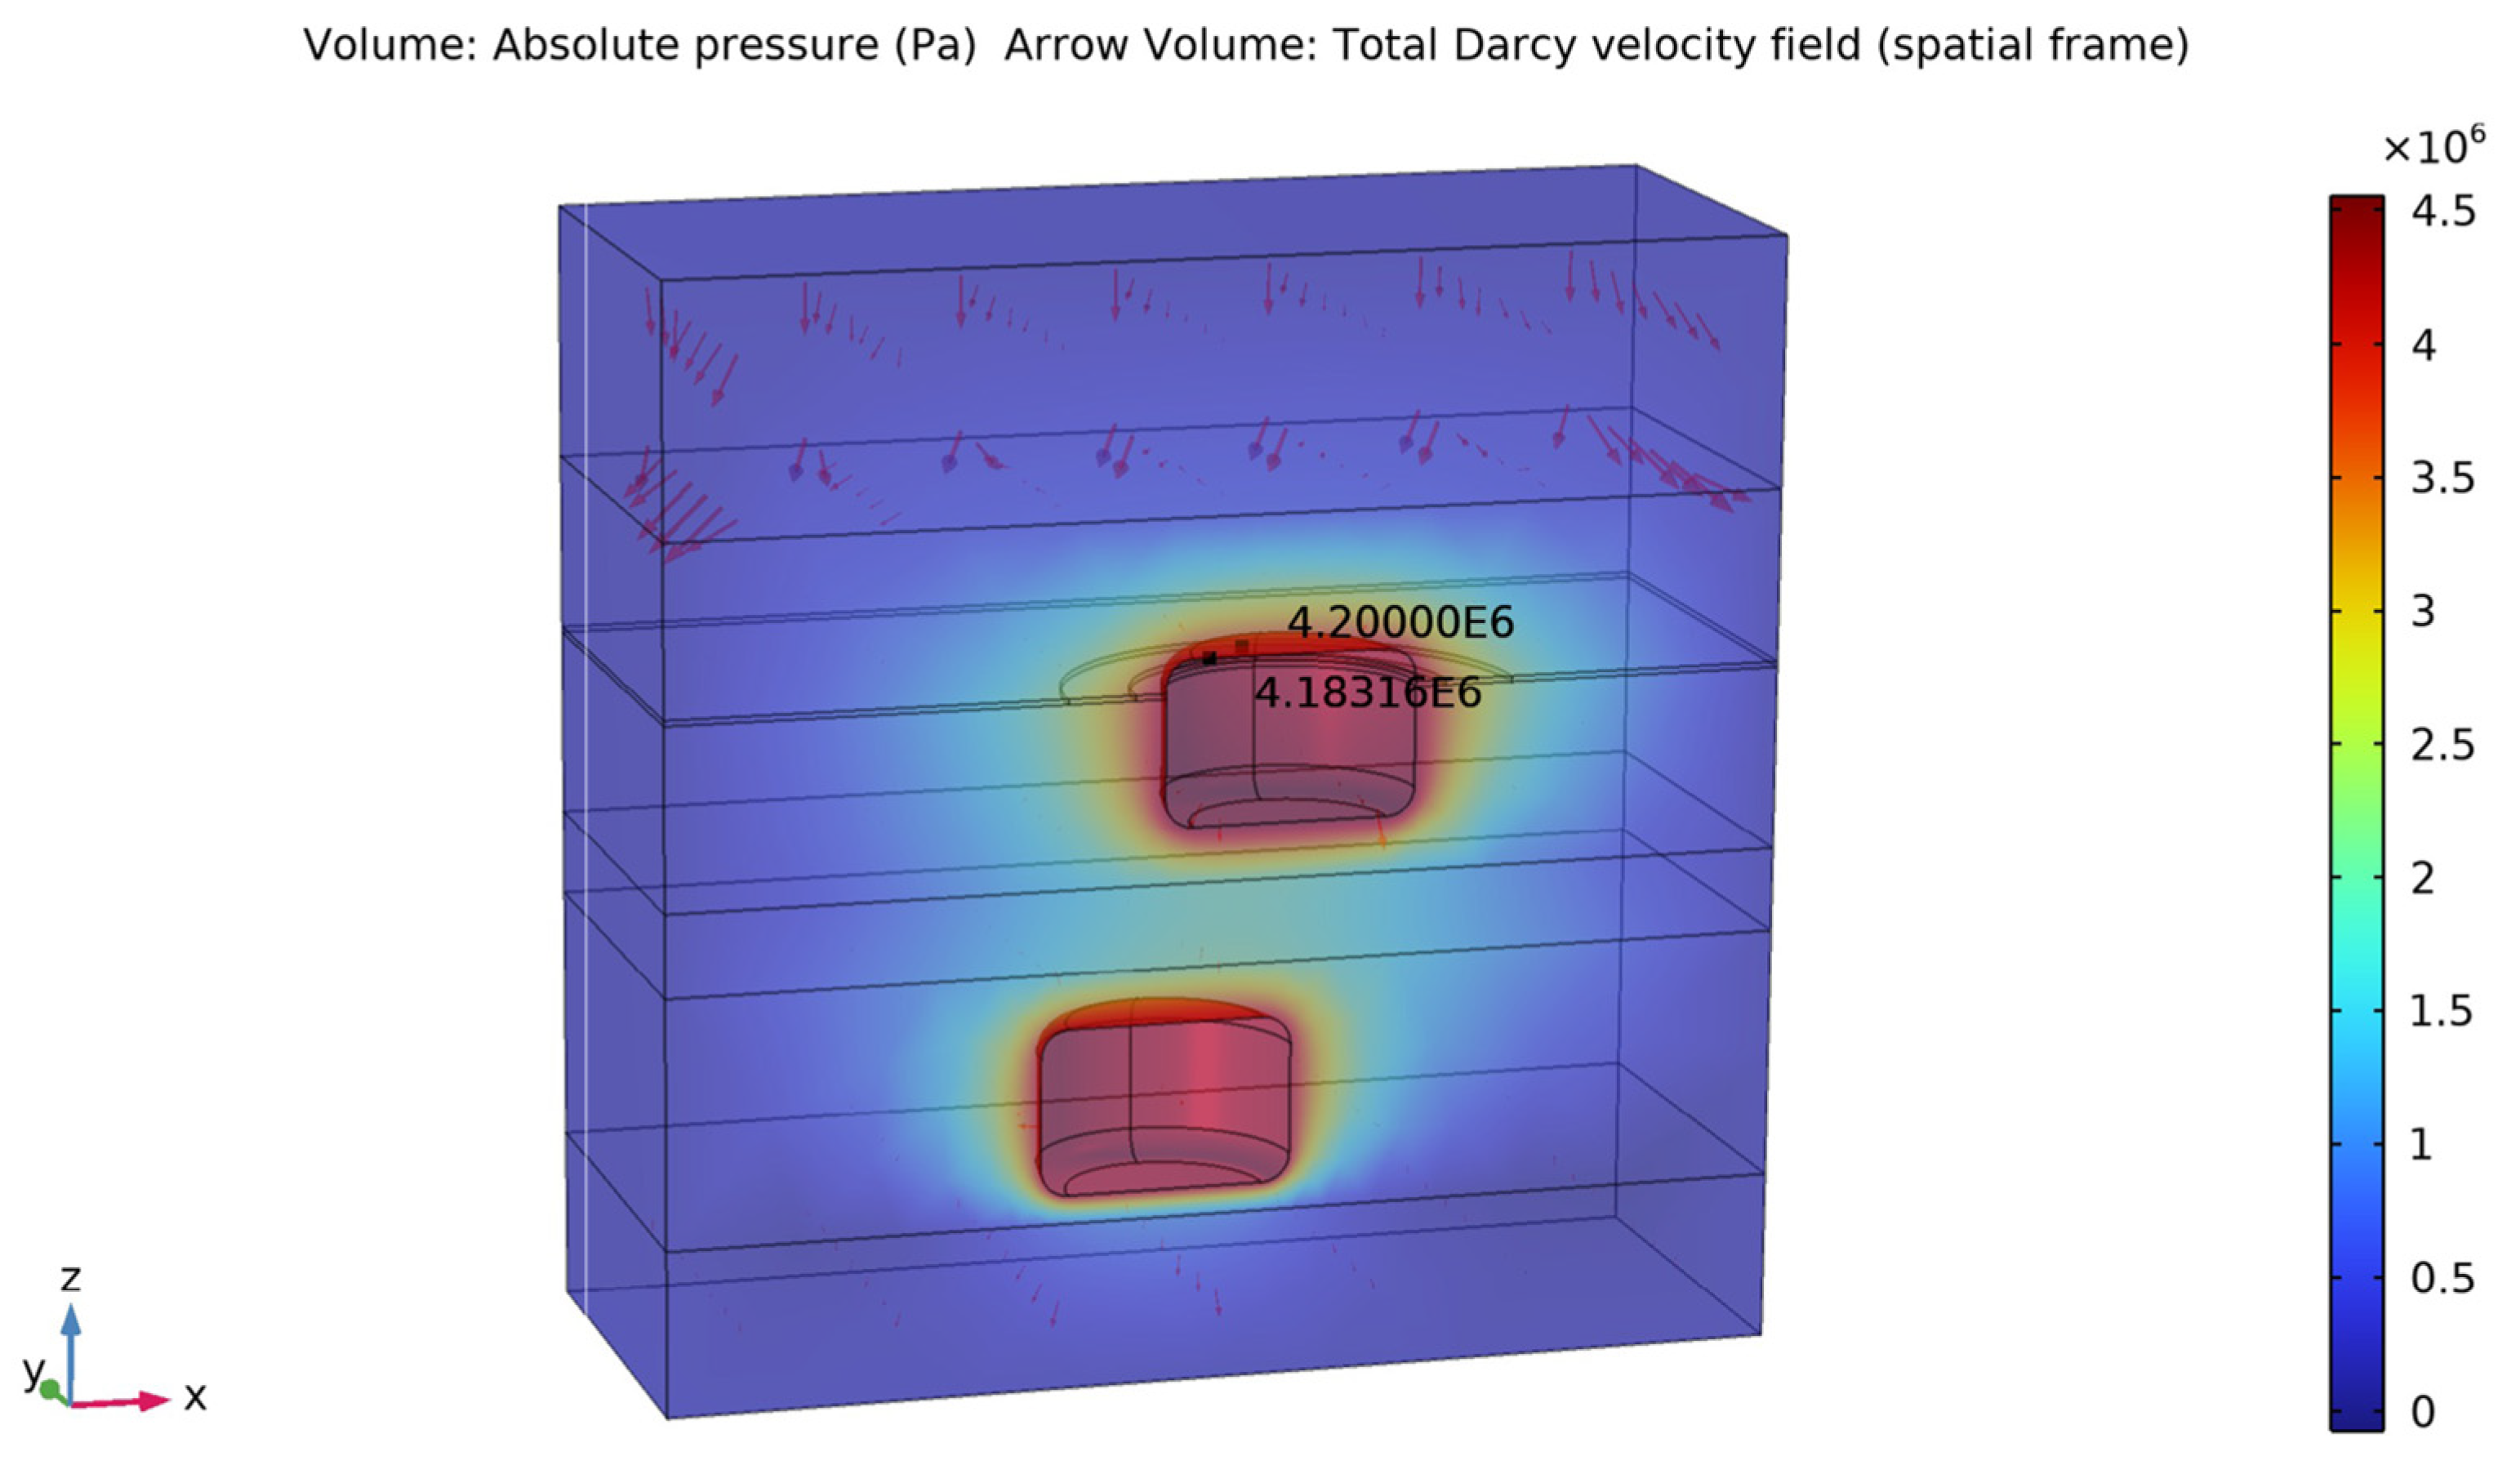
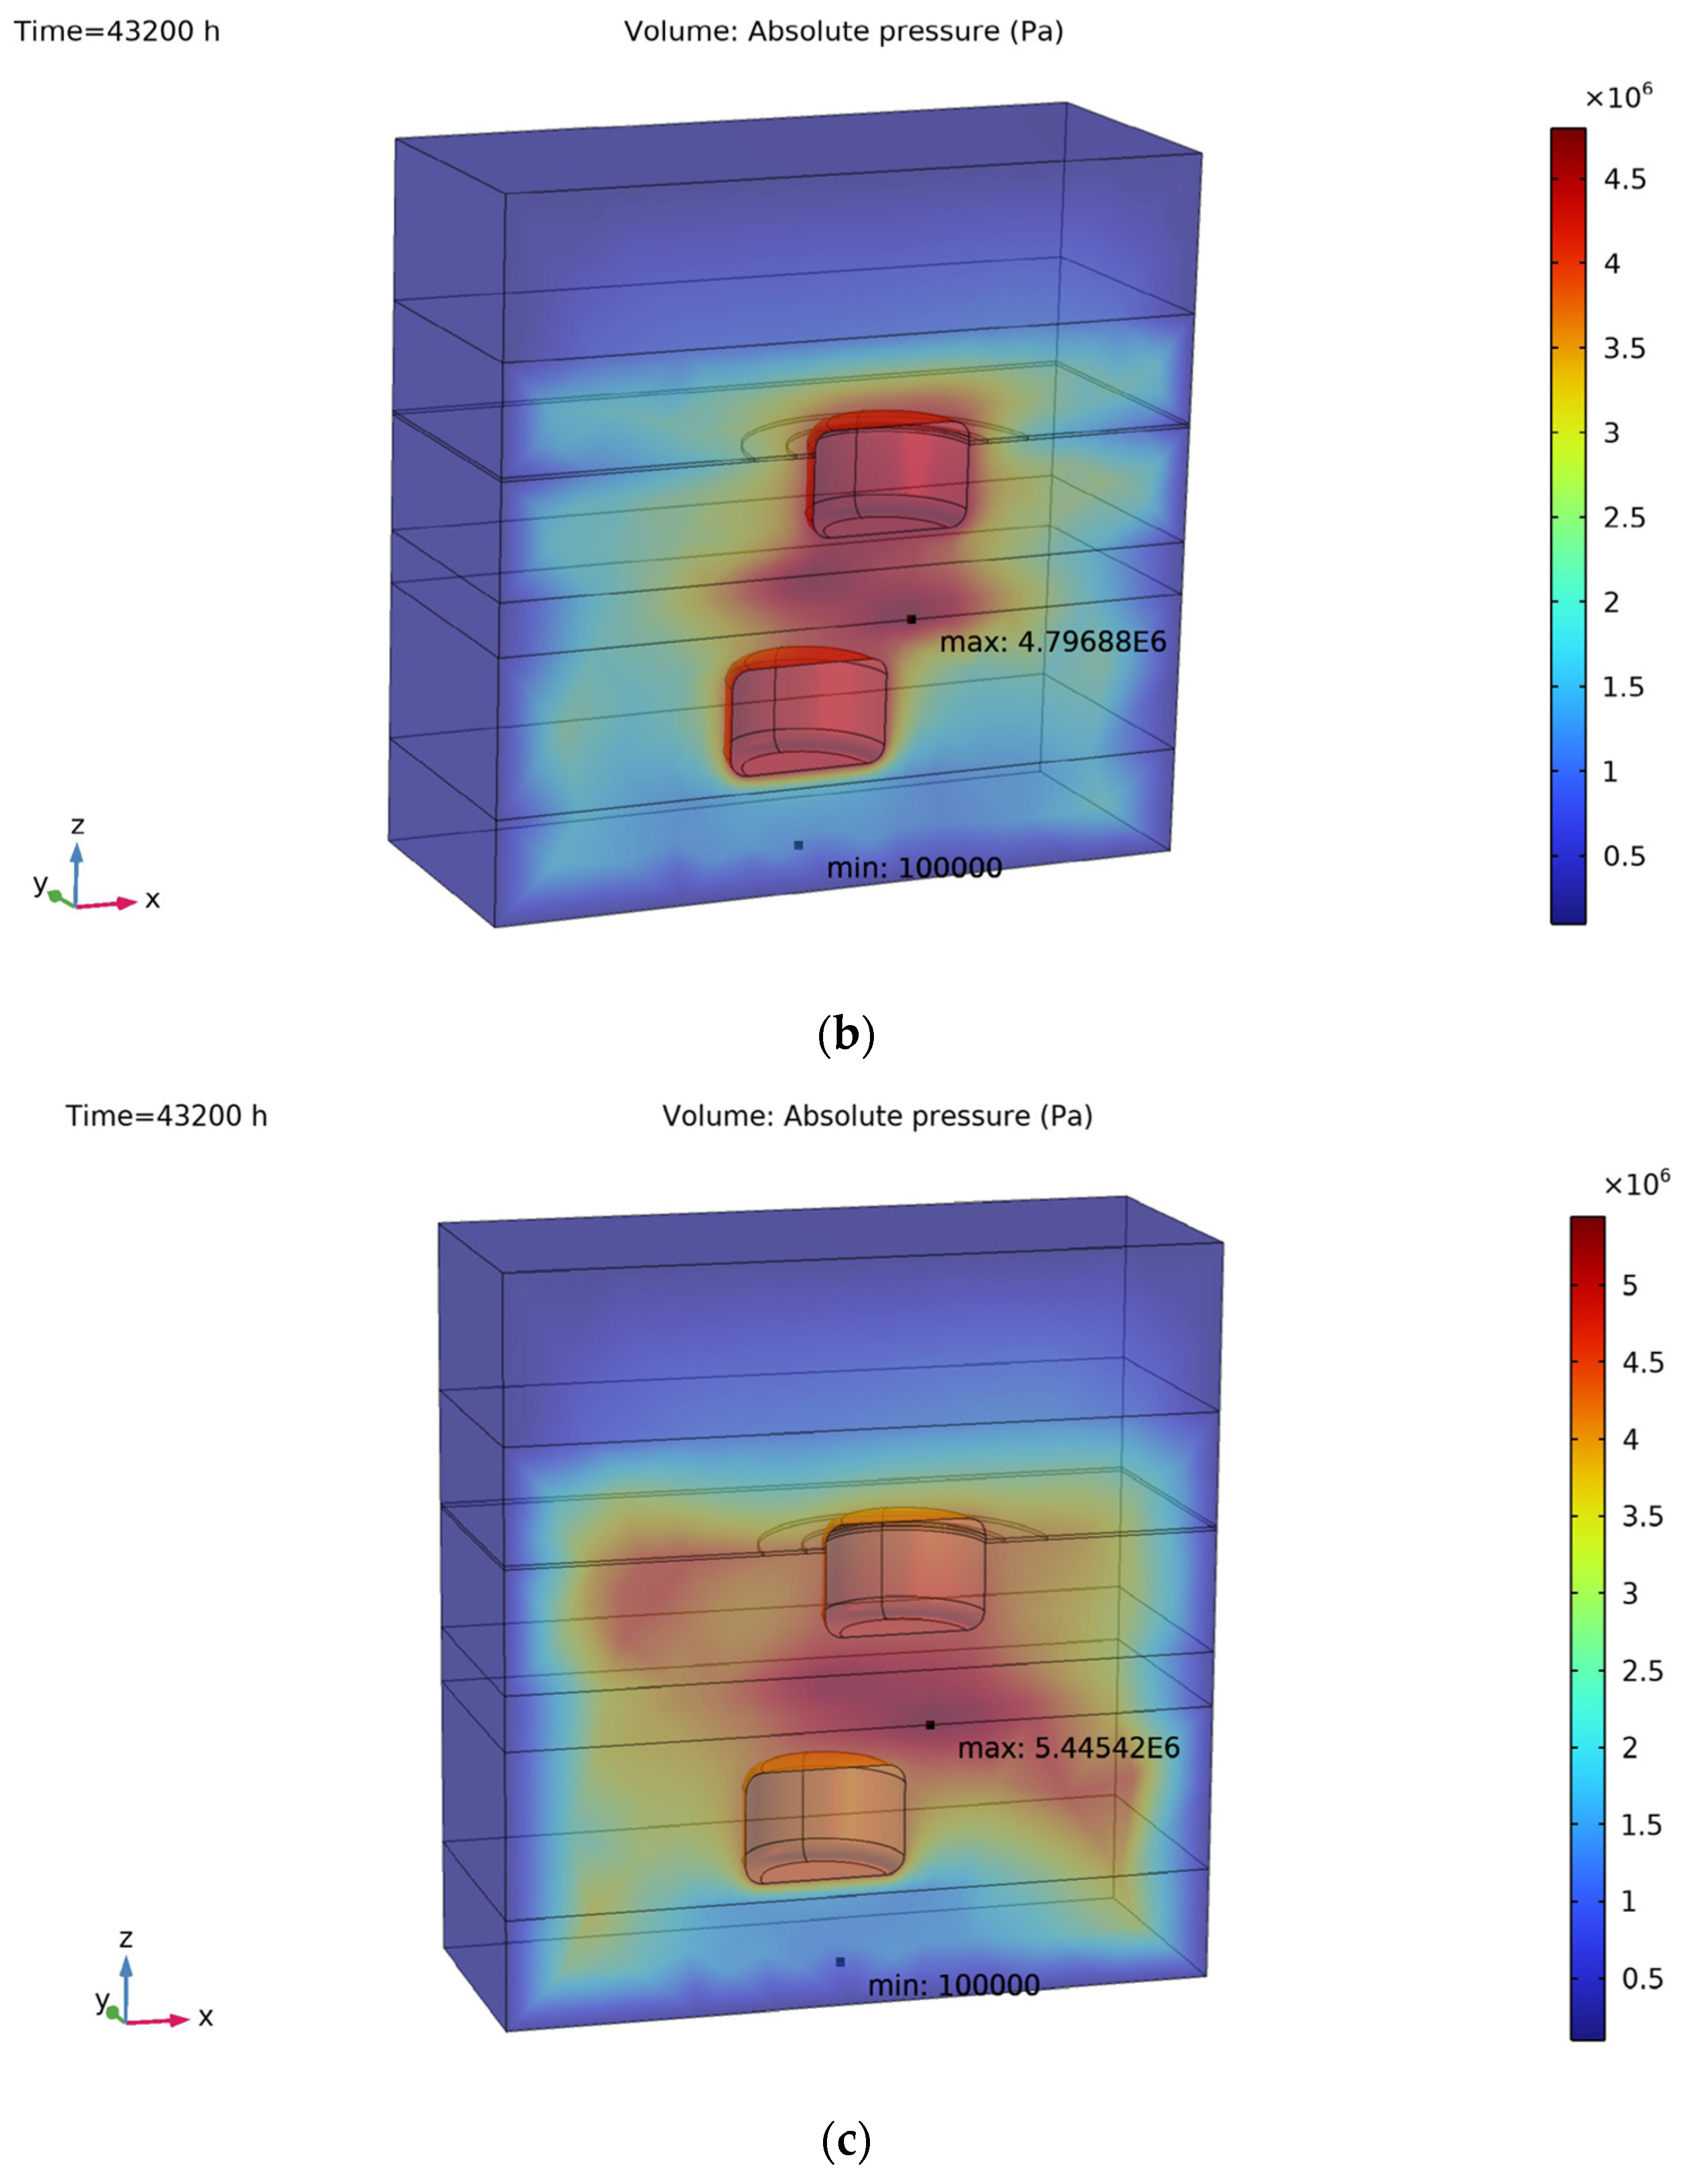
To implement the Darcy flow model, representative hydrogeological parameters of the host rock and brine were specified. The values were chosen within conservative ranges reported for bedded salt formations in Southern Ontario and analogous sedimentary basins, ensuring that the long-term leakage behavior is reasonably captured. To account for initial conditions, the pore pressure was set to 0.1 MPa to represent residual gas pressure, and a preliminary steady-state simulation was conducted to reproduce pore pressure redistribution caused by cavern leaching. This step provides a physically consistent initial pore pressure field for the subsequent transient percolation analysis. In addition, the model boundaries were treated as open to brine outflow, allowing saltwater to discharge freely from the domain, thereby representing the natural dissipation of seepage through the surrounding formation. The adopted percolation parameters are summarized in
Table 3.
The numerical domain was discretized using a nonuniform tetrahedral mesh to balance computational efficiency and accuracy. Local mesh refinement was applied along the cavern boundaries and interbedded interfaces, where strong gradients of stress, strain, and pore pressure were expected. The minimum element size near the cavern wall was 0.6 m, gradually increasing to 8 m toward the outer boundaries to reduce the total number of elements while maintaining resolution in critical zones. This configuration allowed accurate representation of the irregular cavern geometry and mechanical contrasts between salt, shale, and limestone layers. To ensure numerical reliability, a mesh independence analysis was performed by comparing displacement and pore-pressure results under identical cyclic loading conditions for successively refined meshes. The differences between medium and fine meshes were found to be less than 1%, confirming that the adopted mesh resolution was sufficient to capture both the mechanical deformation and leakage behavior. Although a full-scale sensitivity study involving multi-level refinement was not undertaken due to computational cost, the achieved convergence demonstrates that the selected mesh provides a robust compromise between accuracy and efficiency for simulations.
This work provides an initial step toward evaluating the geomechanical feasibility of UPHS in Southern Ontario, yet several simplifications must be recognized. The stratigraphic model is assumed to be laterally uniform, without explicitly accounting for anisotropy or localized heterogeneities such as micro-fractures, which may influence stress redistribution and underestimate brine leakage. Such assumptions may result in an optimistic estimate of cavern stability and should be revisited in future studies through site-specific characterization. In addition, uncertainties remain regarding the coupled thermal and hydraulic responses of the system. While the present analysis incorporates boundary temperature variations and potential brine seepage, further refinement will require high-resolution field data to constrain heat transfer coefficients, and permeability variations of interbeds. Addressing these factors will enable a more comprehensive and reliable assessment of cavern integrity and operational safety under realistic UPHS conditions.
6. Conclusions
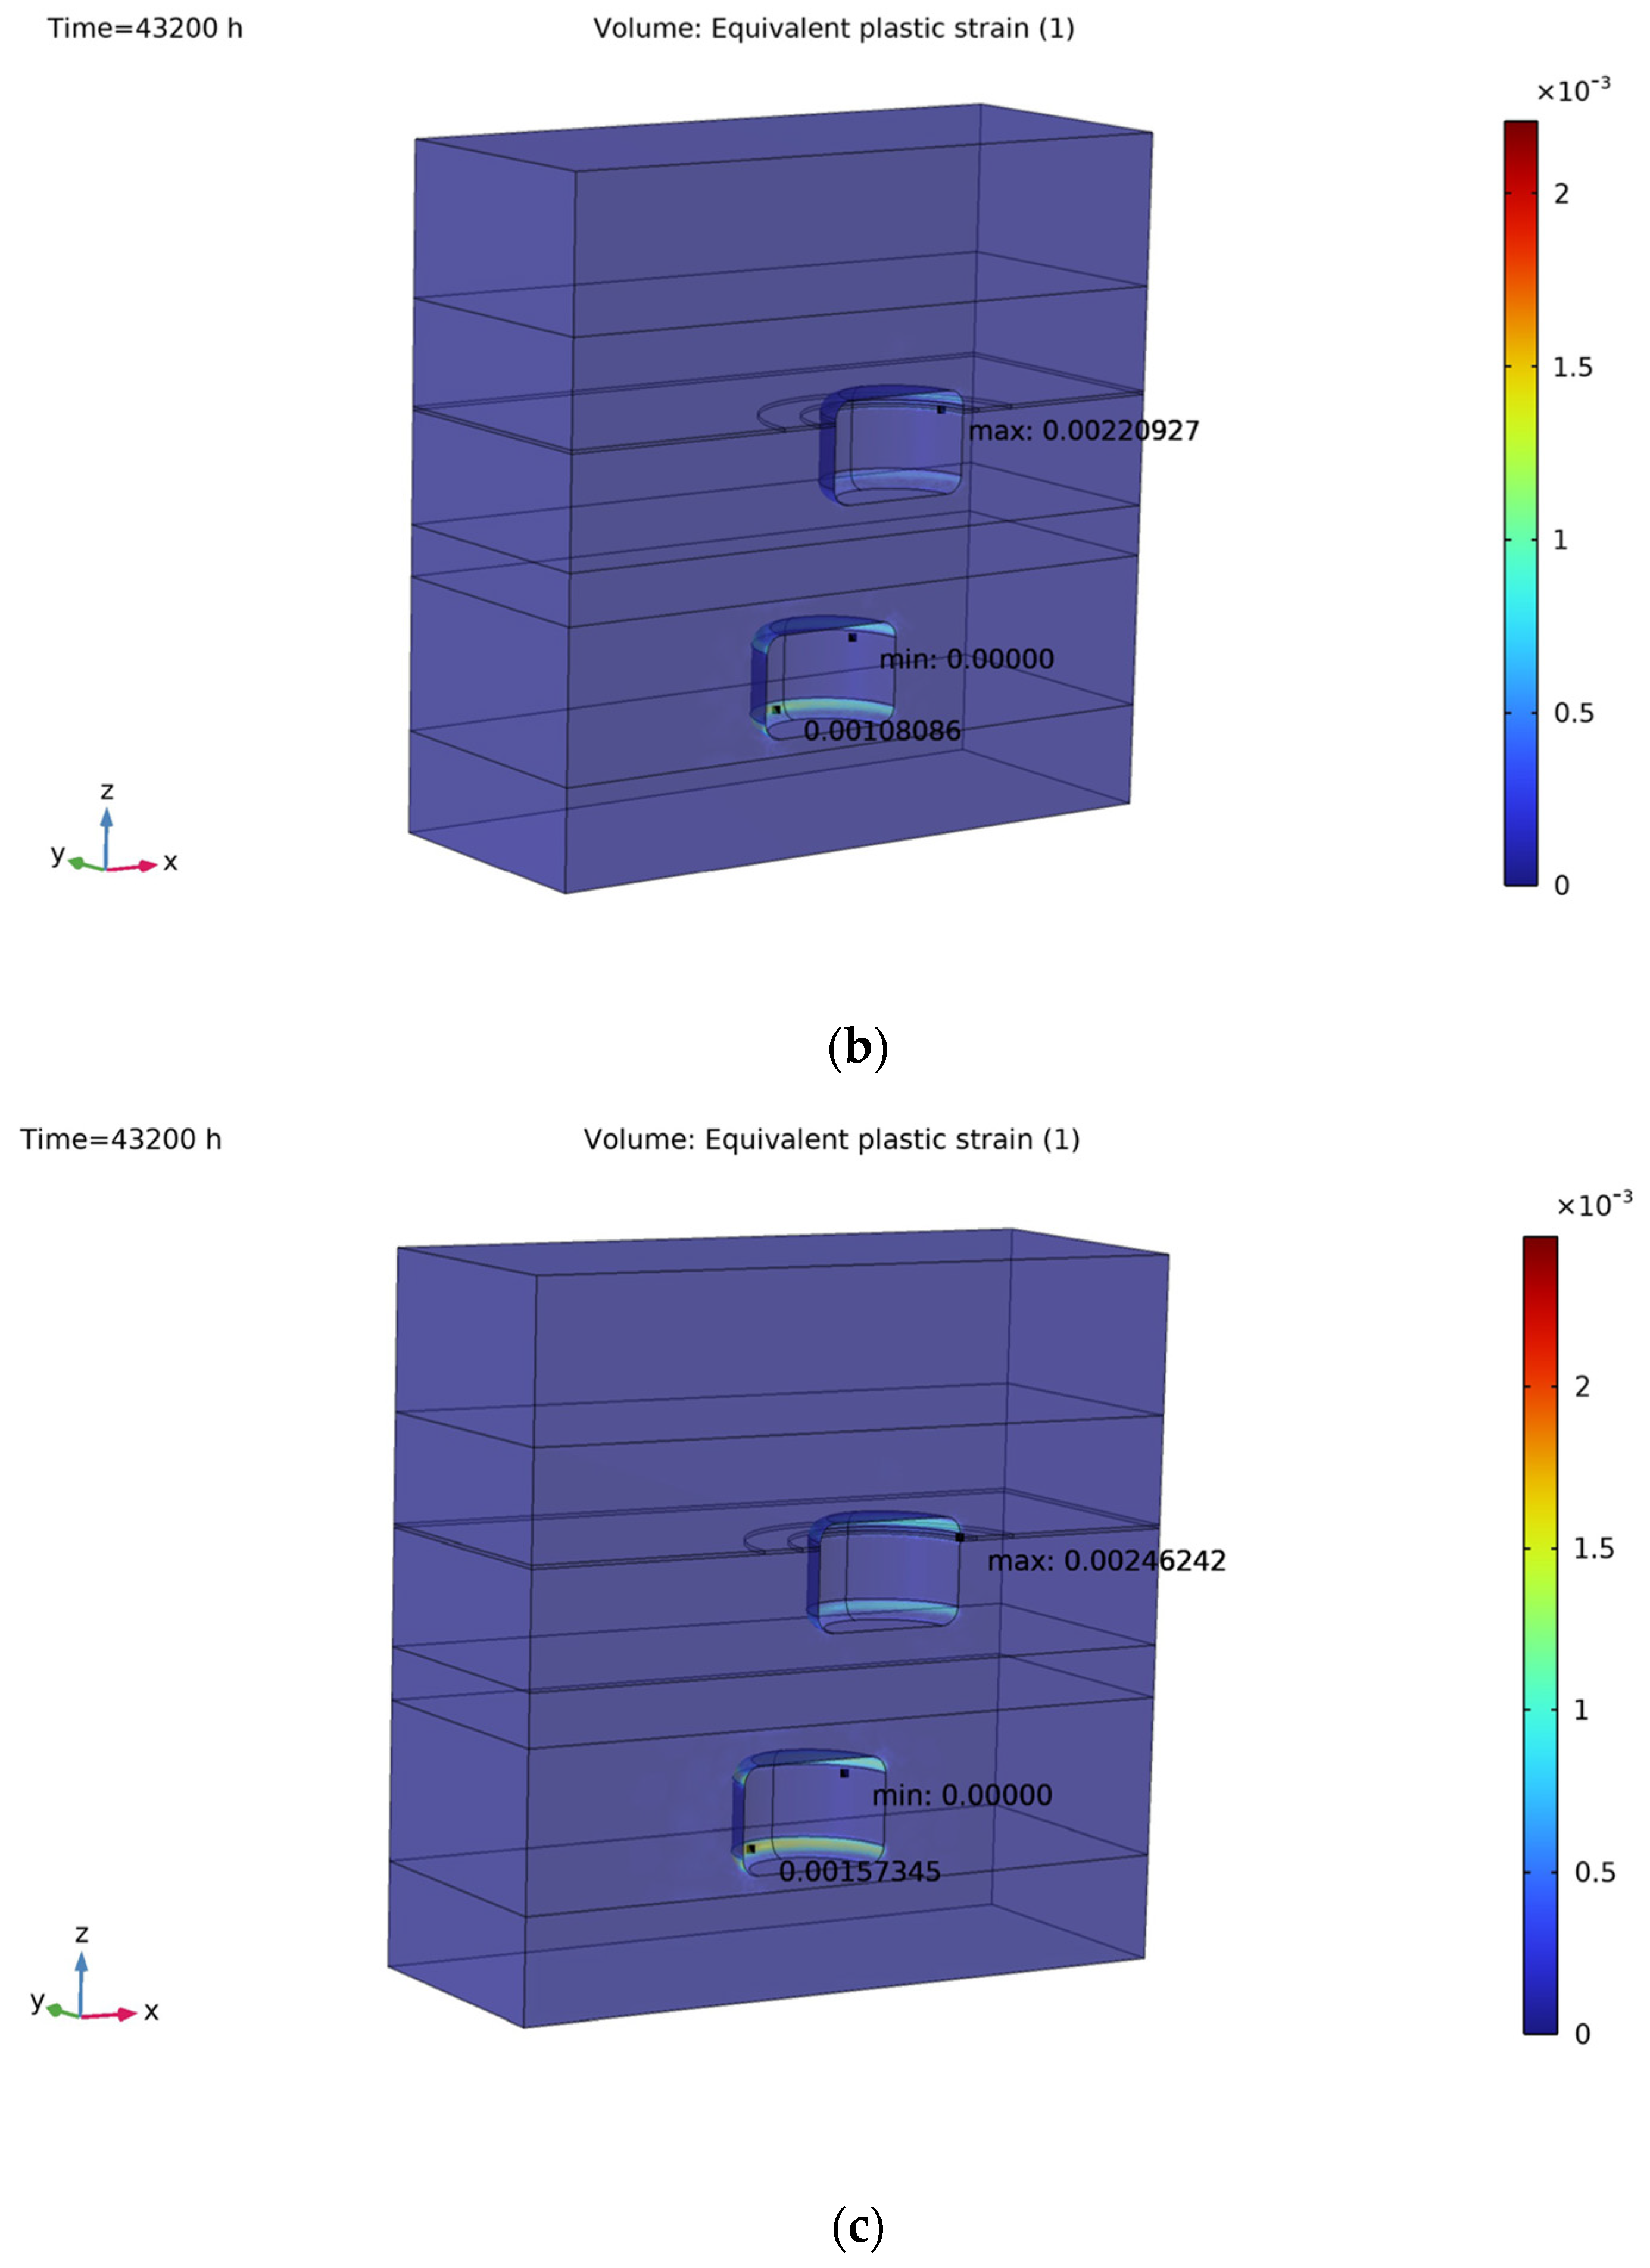
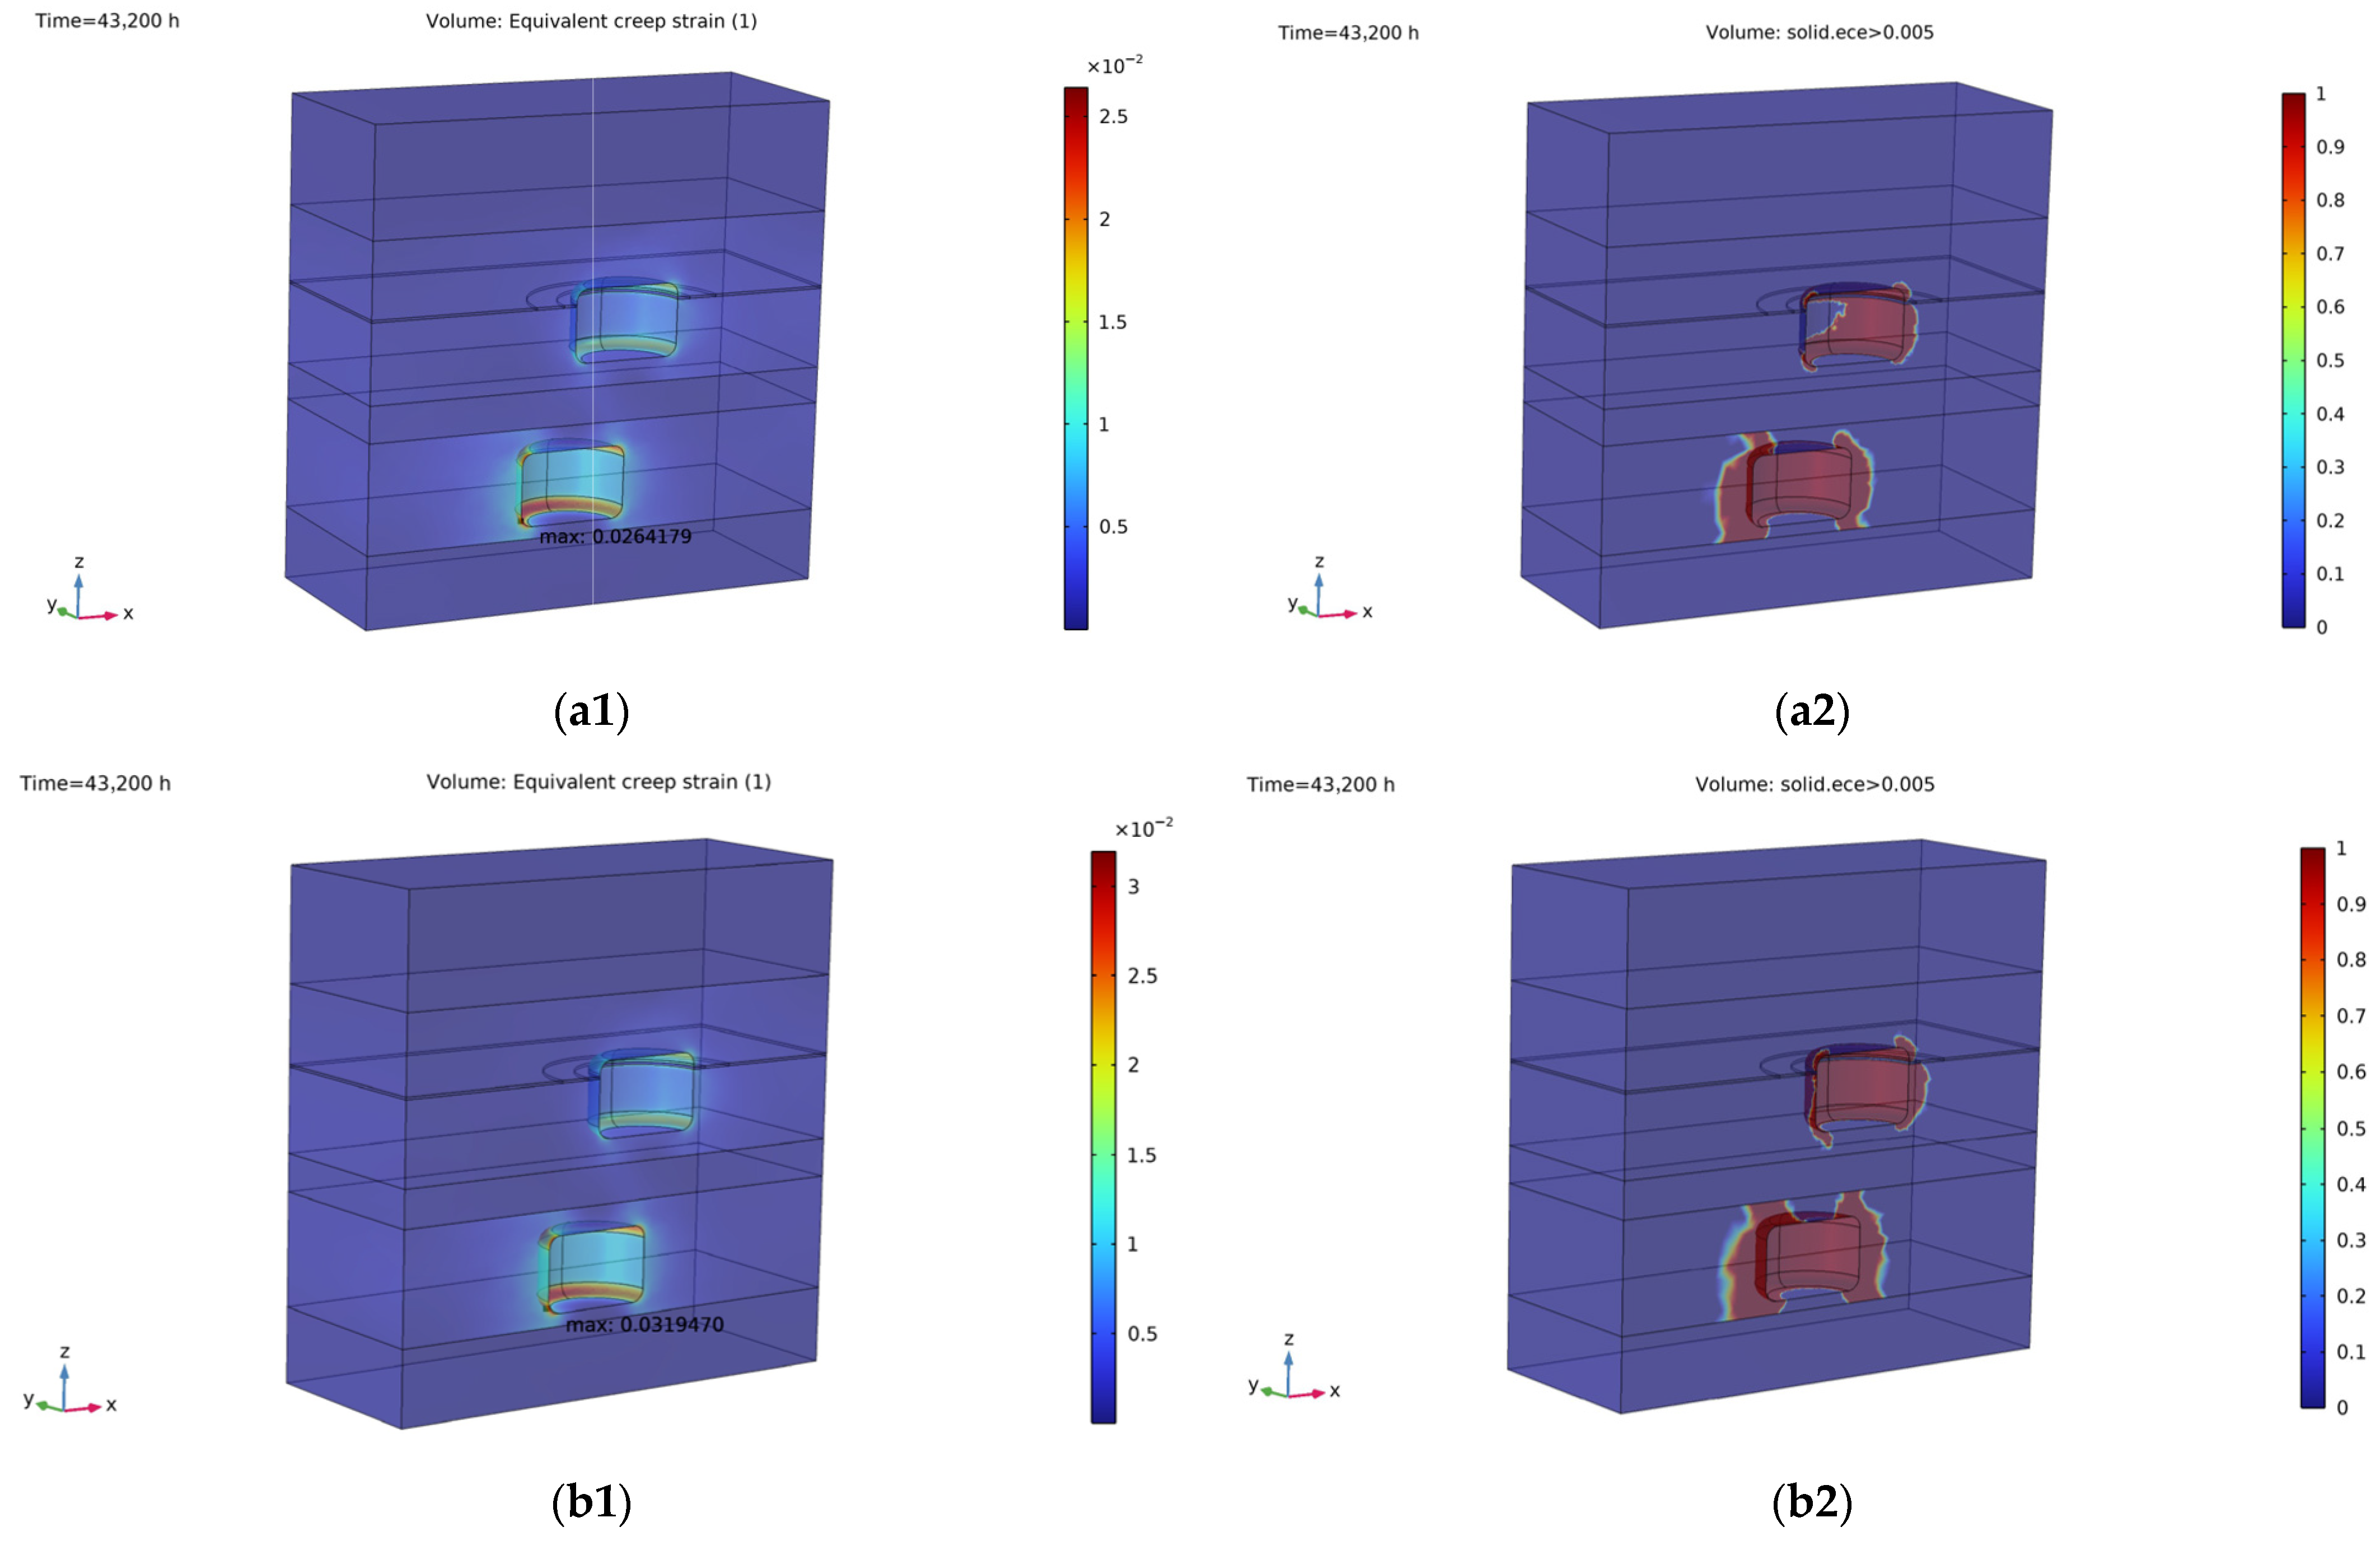
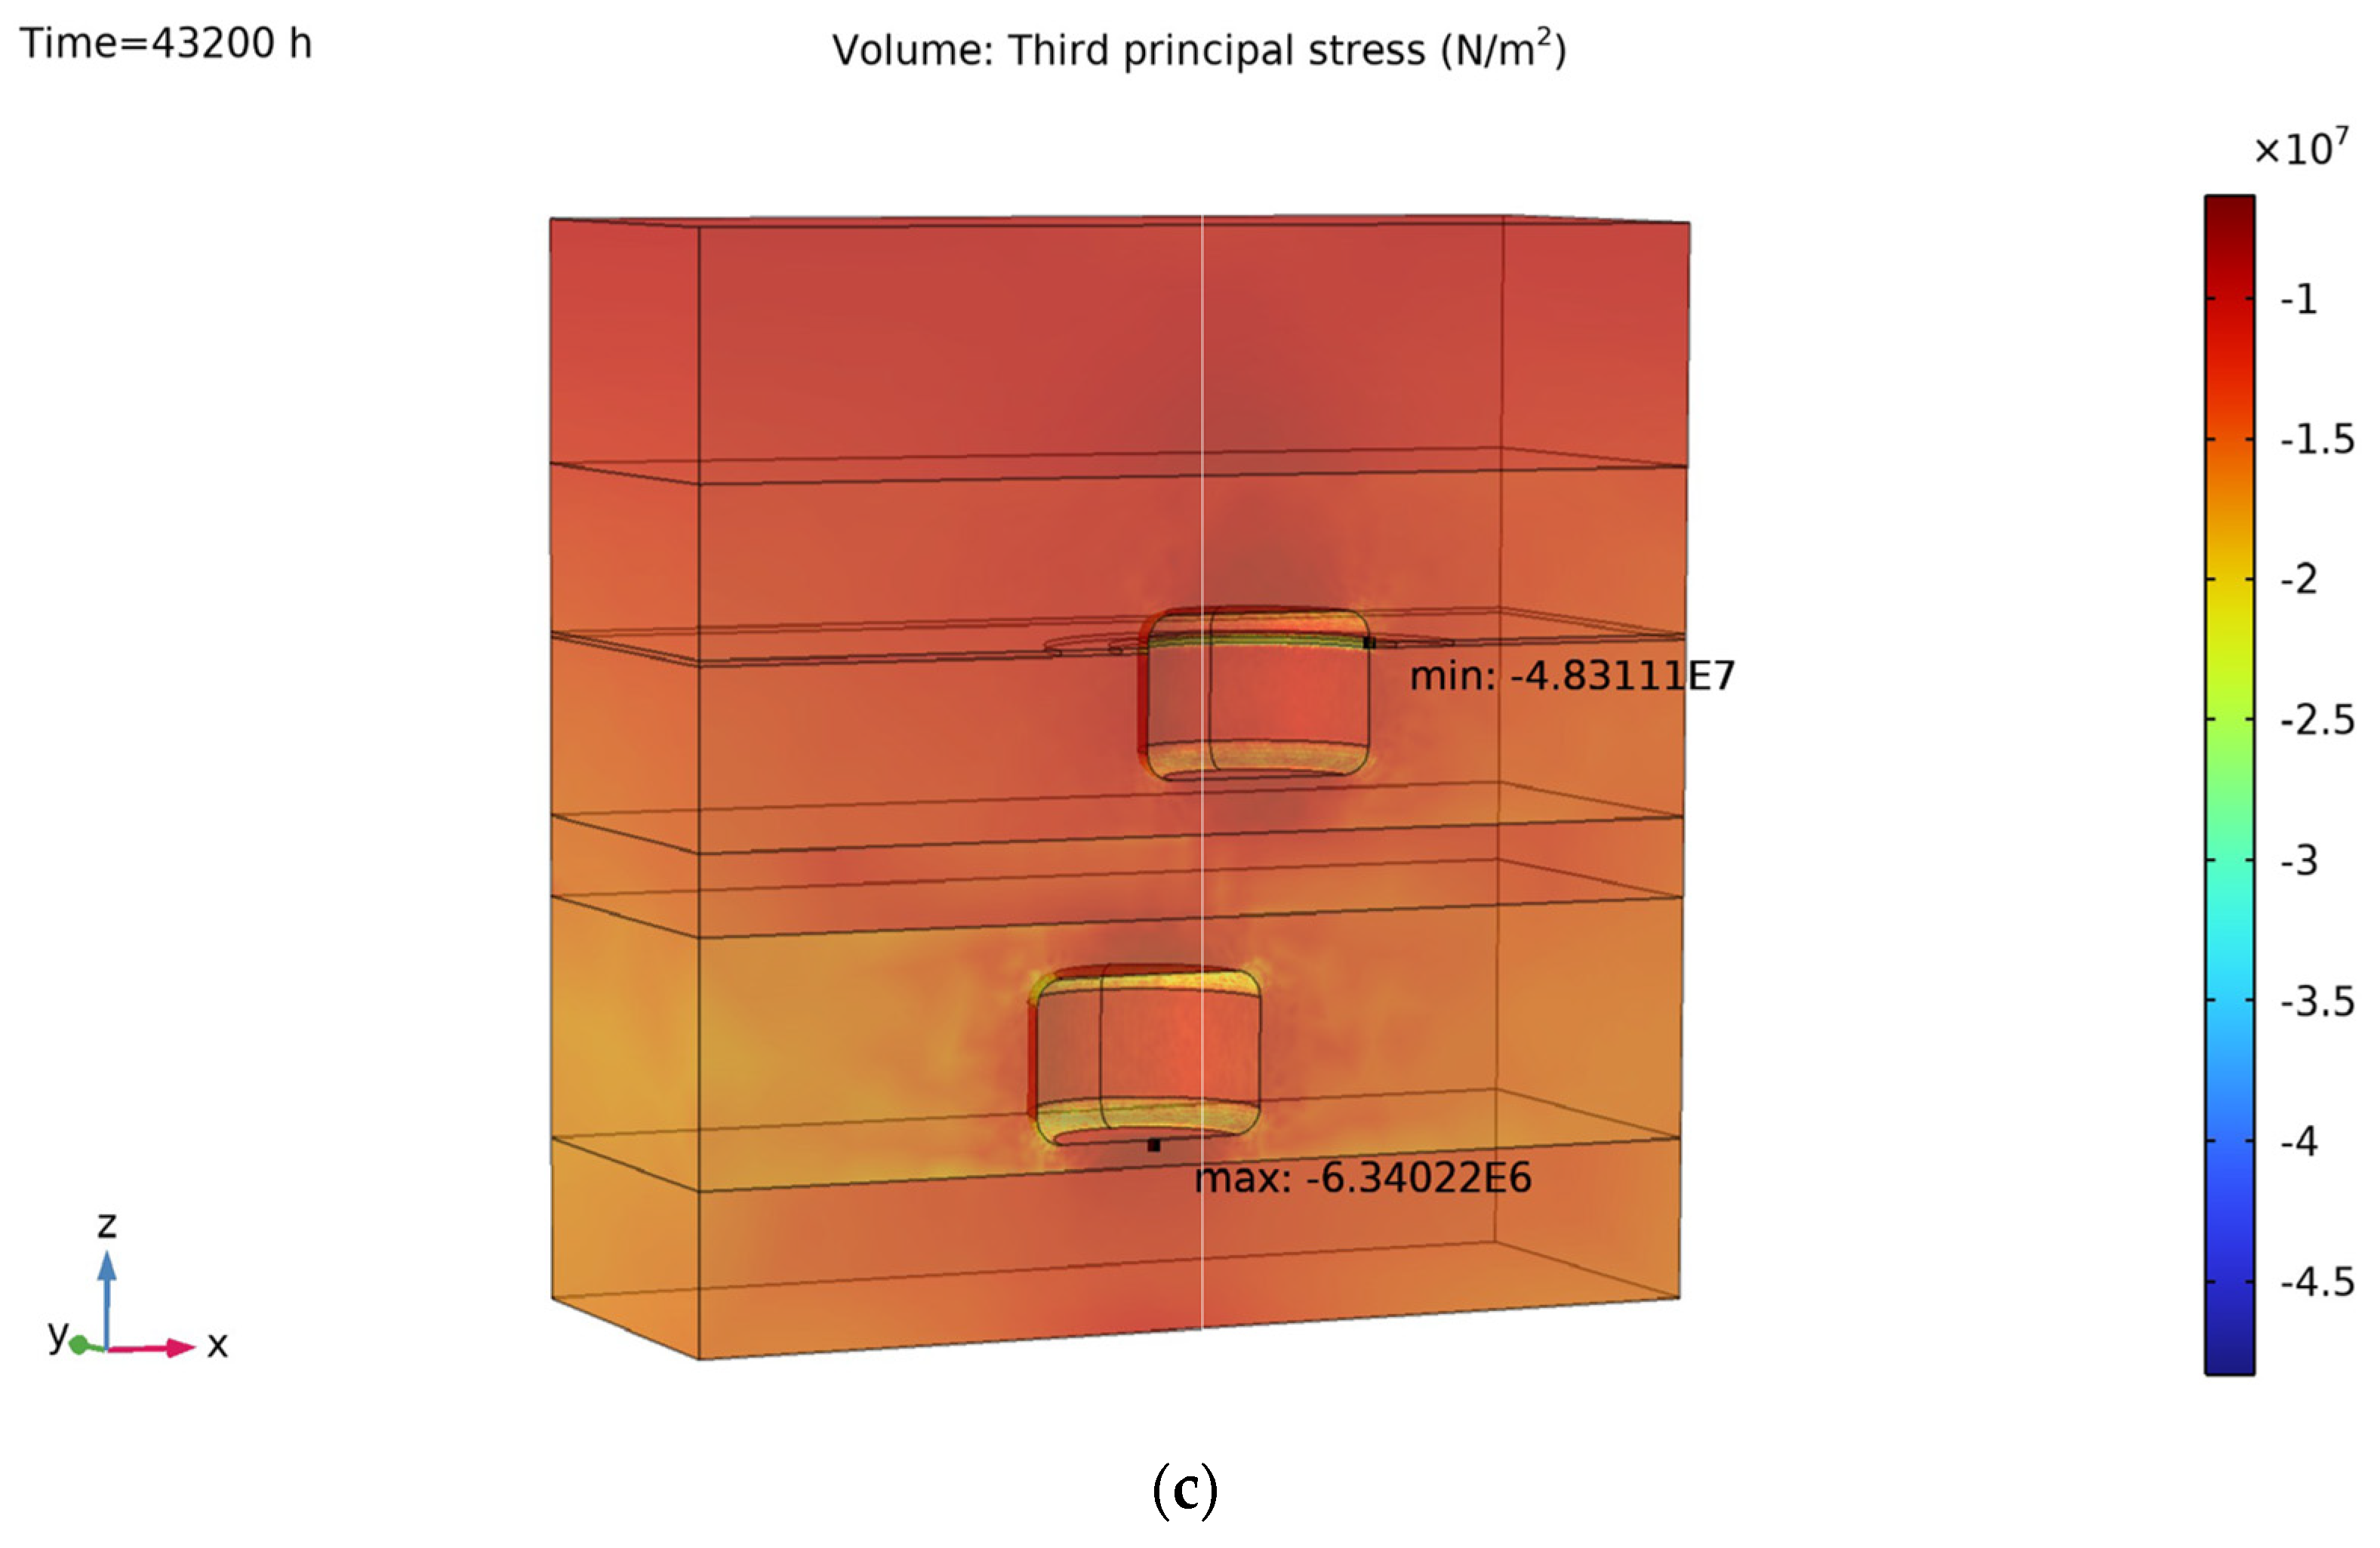
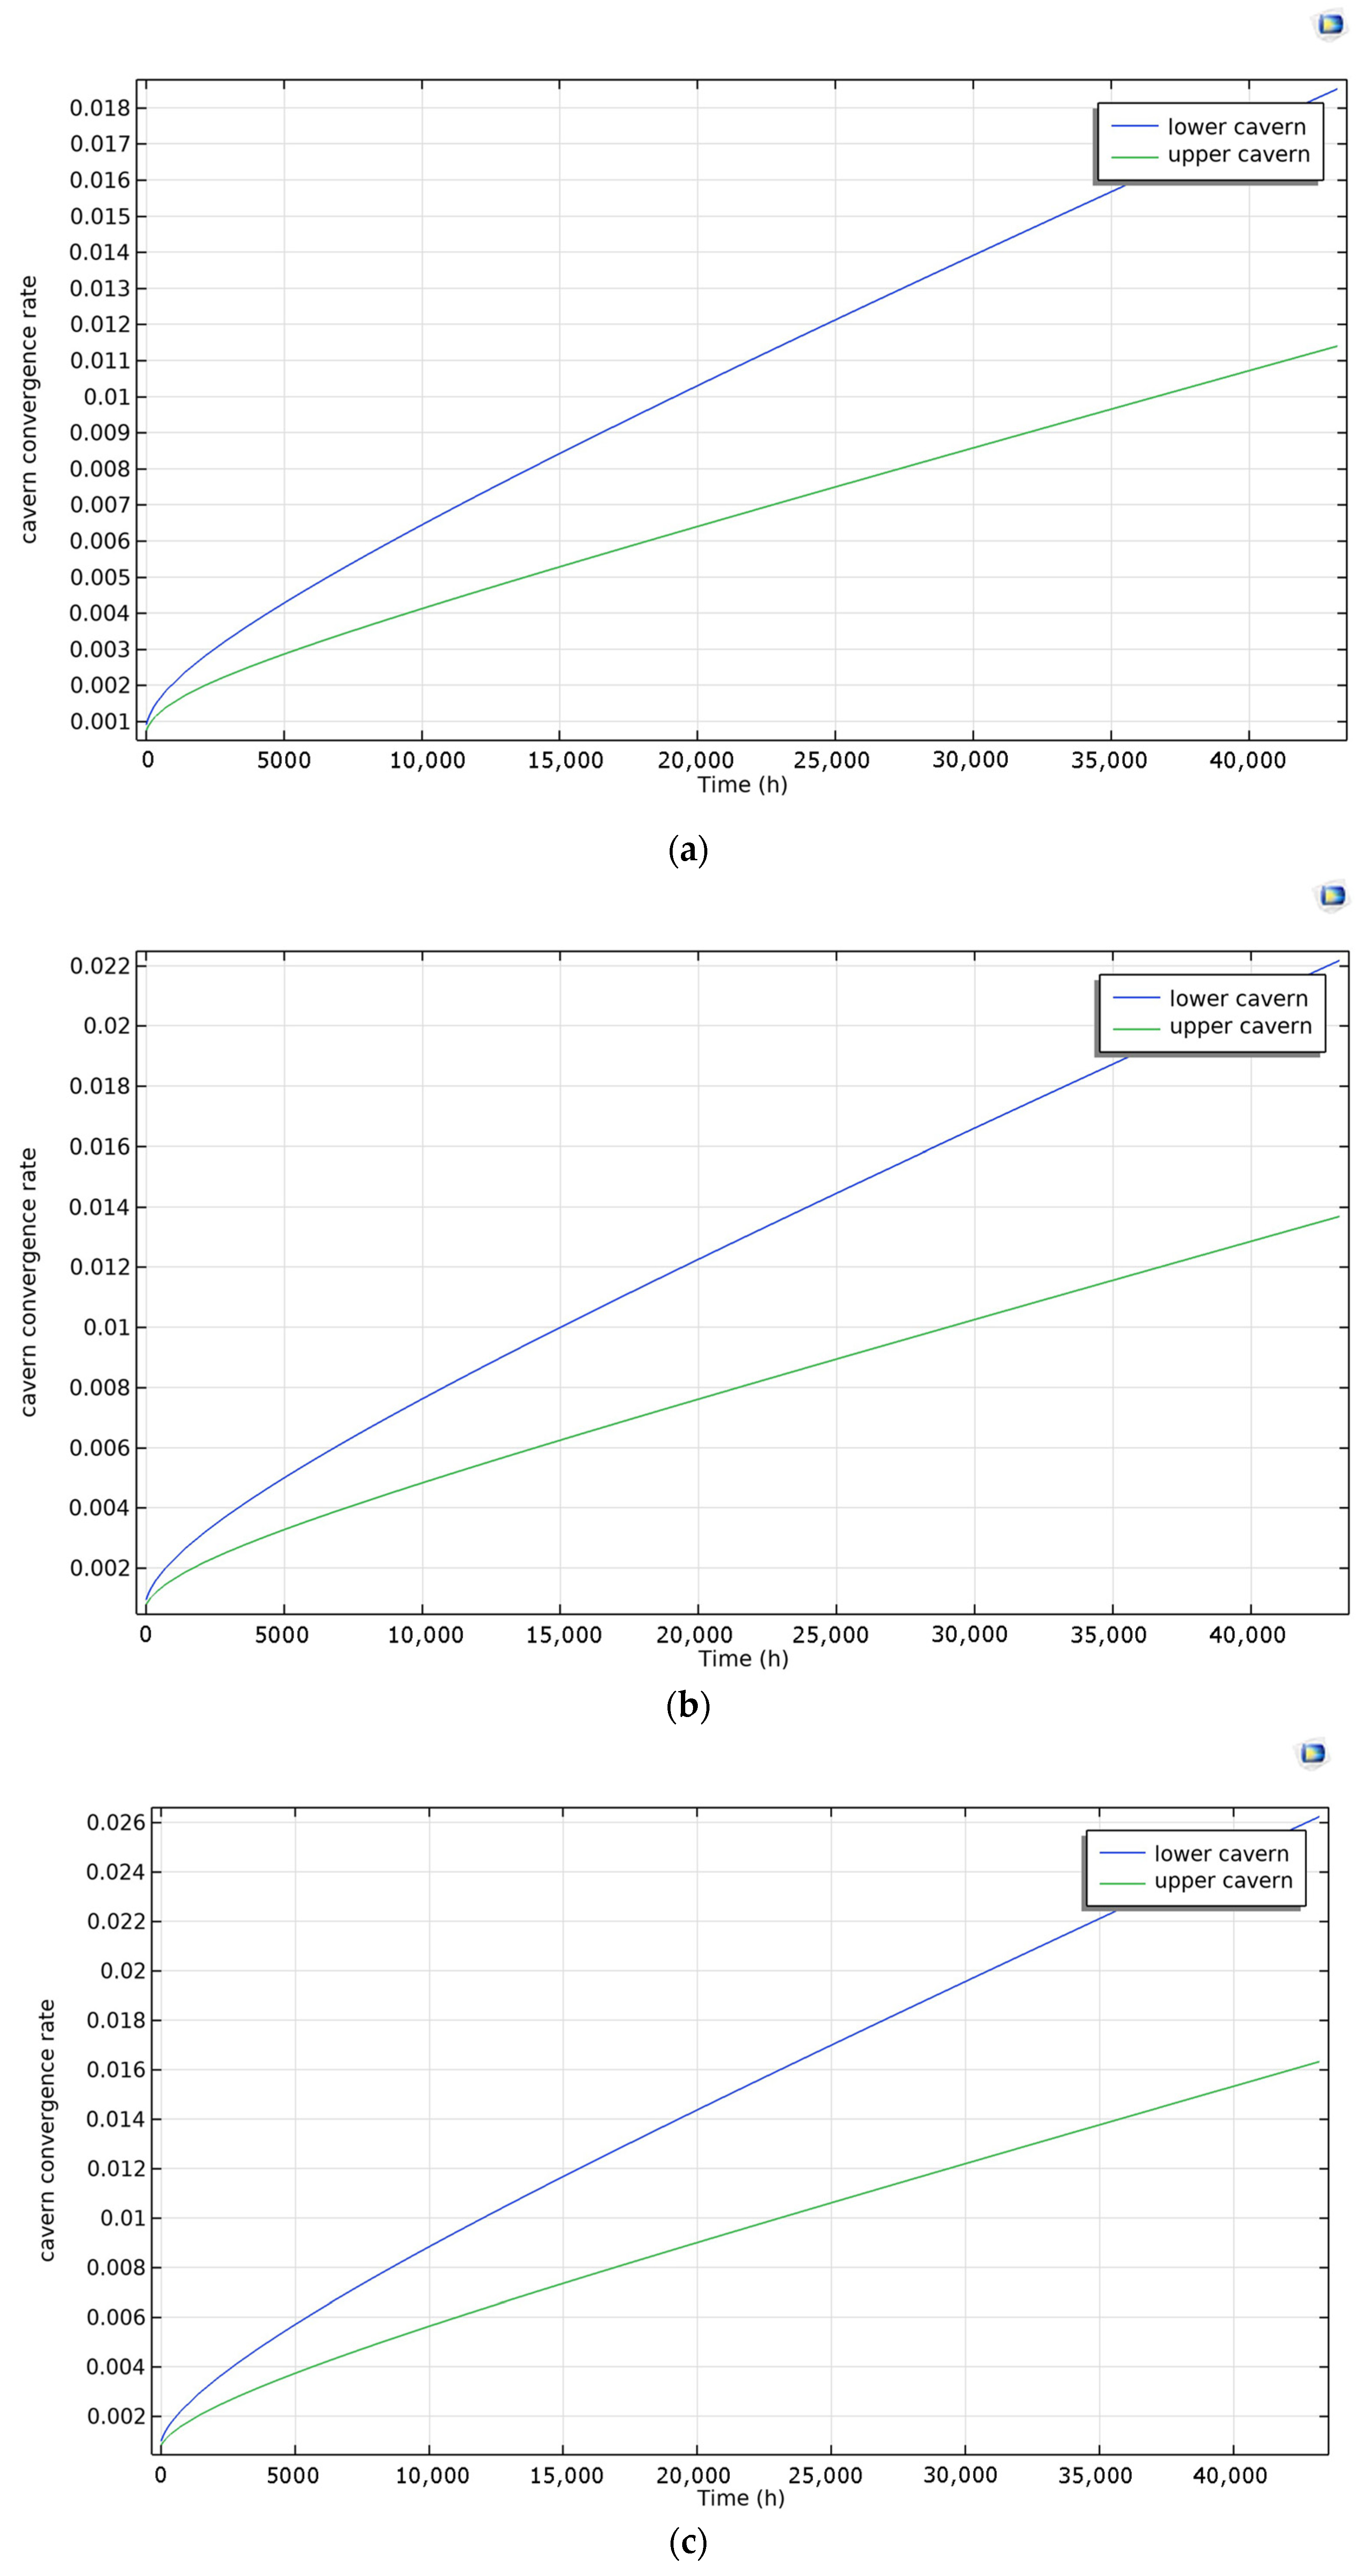
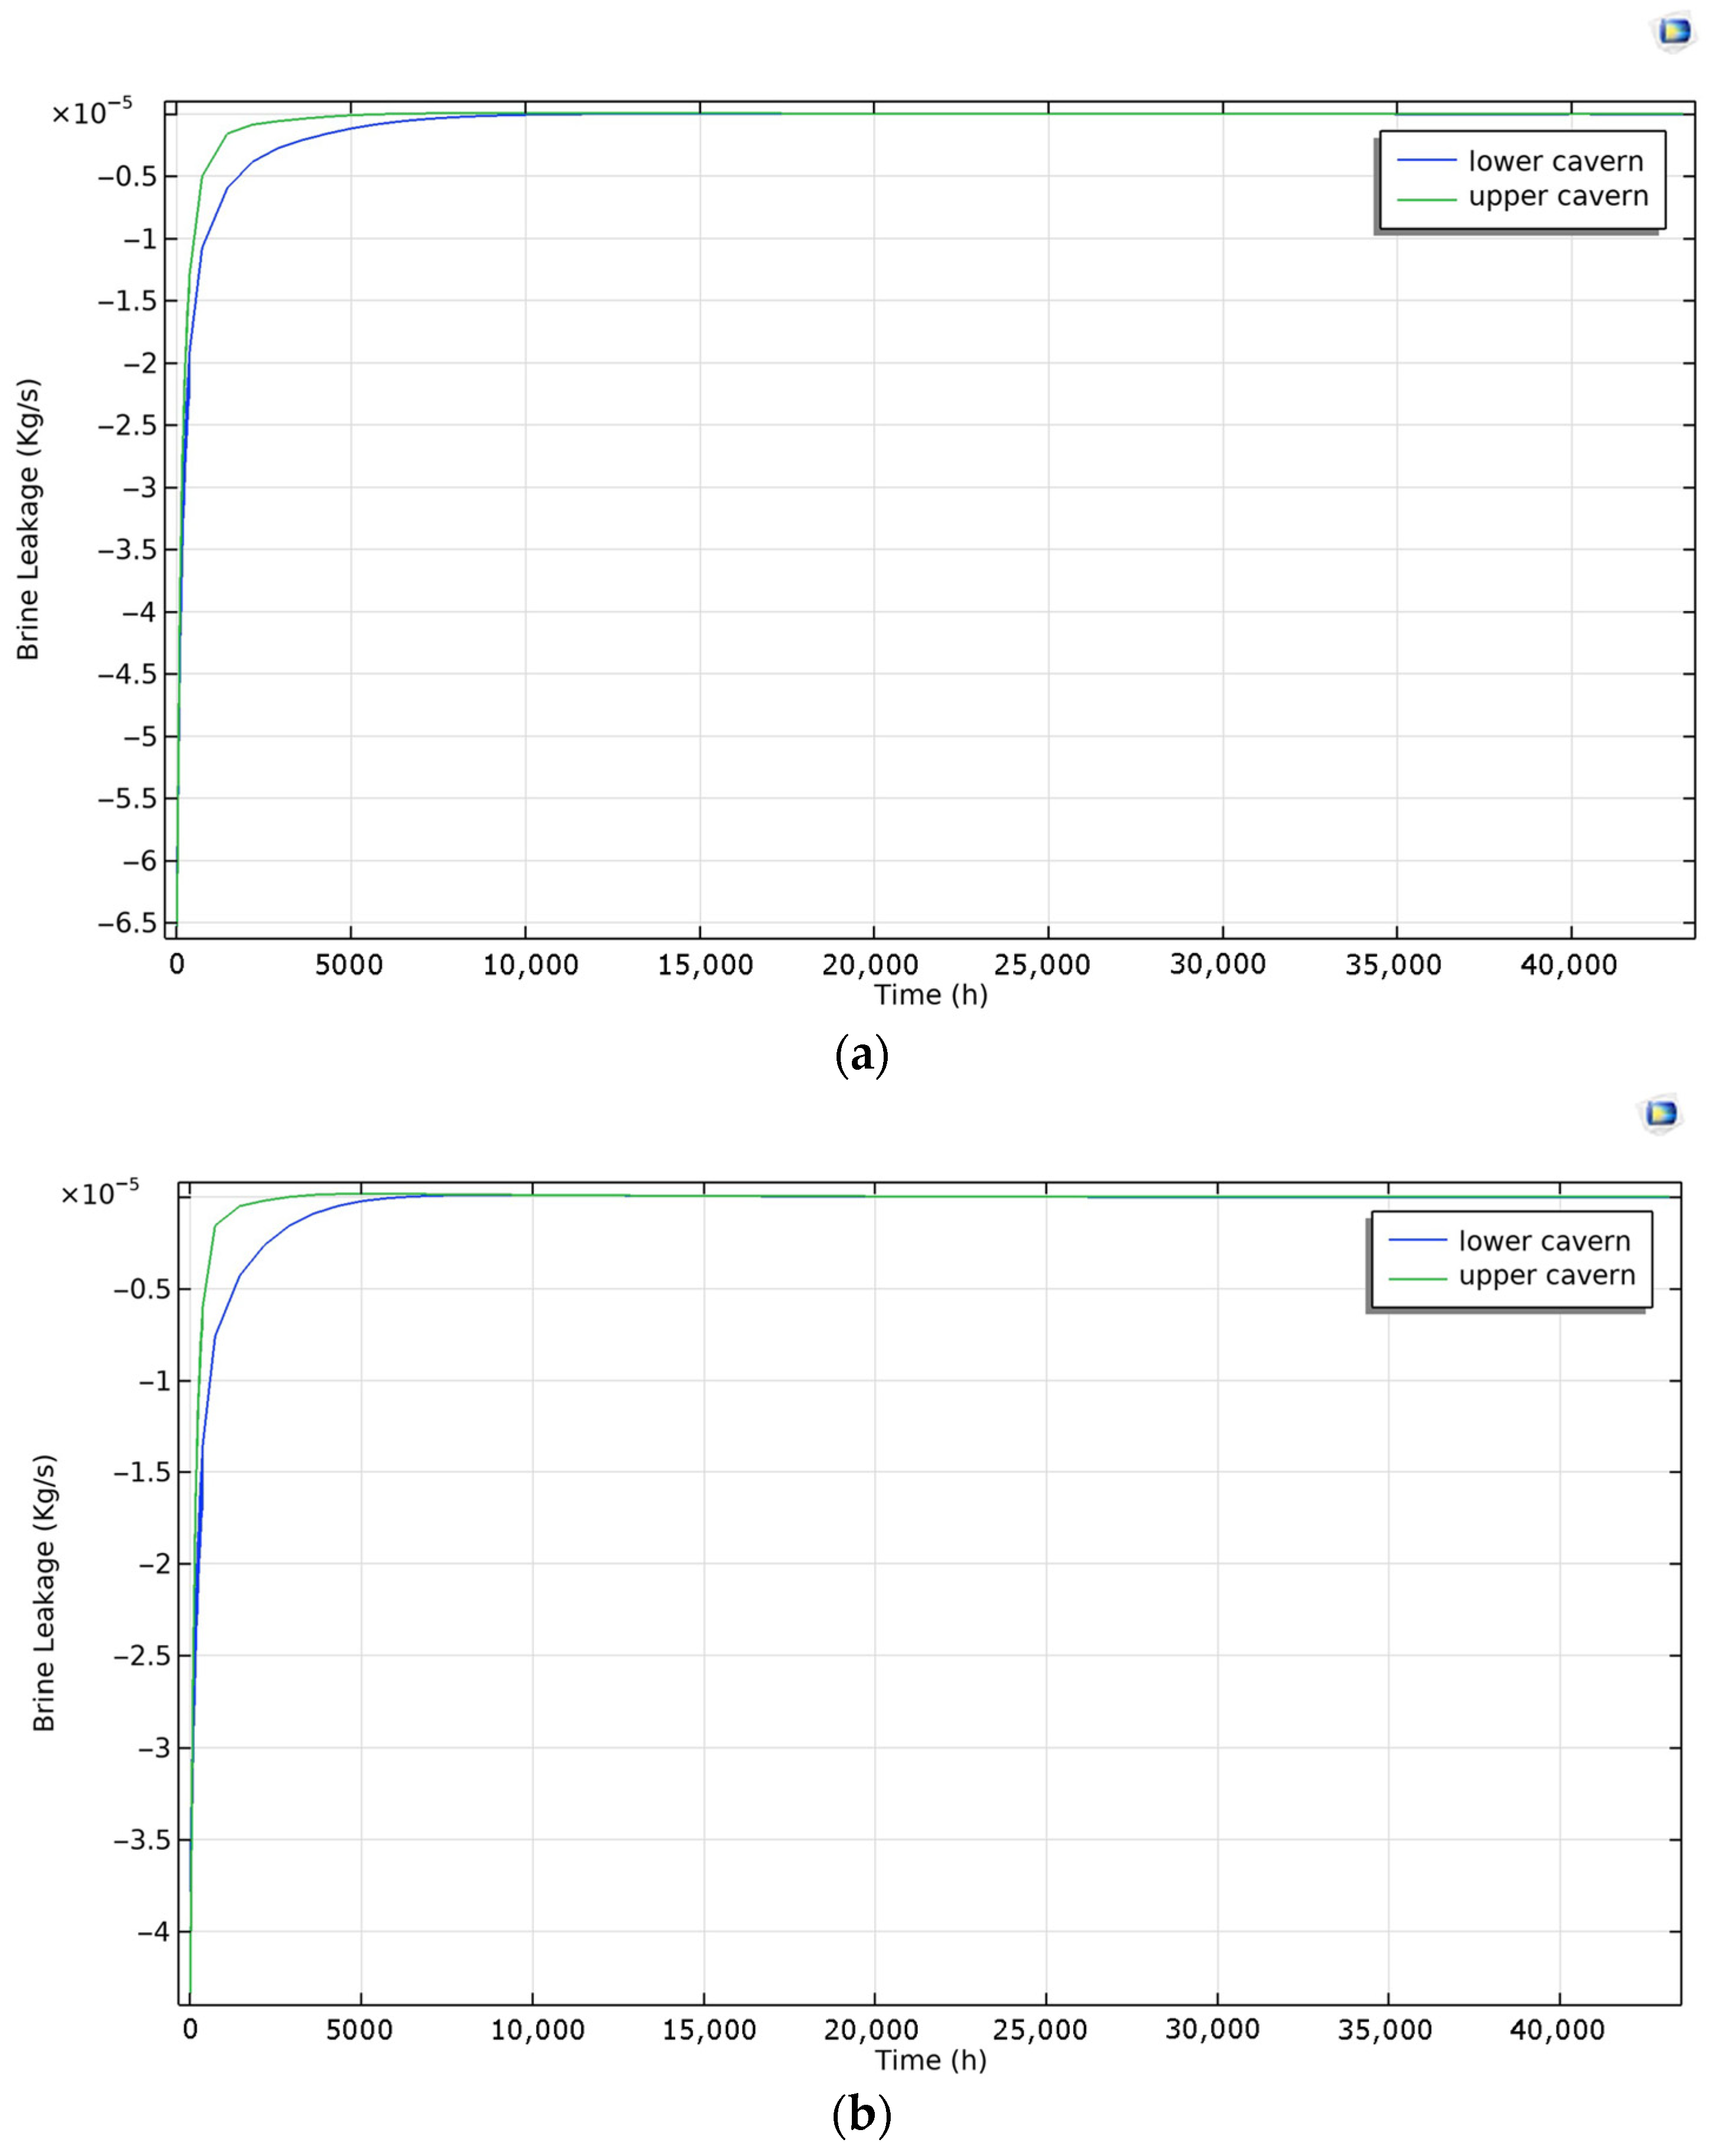
This study presents the first fully coupled thermo-hydro-mechanical simulation of a two-cavern UPHS system within the Salina Group of Southern Ontario, providing a quantitative foundation for assessing the feasibility of large-scale energy storage in bedded salt formations. The results demonstrate that the salt caverns can maintain long-term mechanical integrity under cyclic brine injection and withdrawal, with plastic deformation develops only in thin and localized zones at the salt–shale interfaces, reflecting the mechanical contrast between lithologies, yet it does not propagate into extensive shear bands or lead to tensile failure. The surrounding stress field remains entirely compressive, further indicating that cavern collapse or roof instability is unlikely during the modeled operation. Creep deformation is clearly temperature dependent: higher operating temperatures accelerate cavern convergence, but the cumulative closure over five years remains below 3% at 15 °C, well within accepted engineering safety thresholds. This predicted below 3% cavern closure over five years indicates that long-term deformation remains within safe operational limits, corresponding to a service life of several decades before significant capacity loss would occur, assuming similar stress and temperature conditions. Brine migration predominantly follows the intervening limestone beds, while shale interlayers act only as local discharge pathways due to their limited thickness and continuity. Although elevated temperatures promote leakage by reducing brine viscosity and enhancing plume connectivity, the cumulative leakage volumes are negligible, confirming the excellent sealing capacity of bedded salt. From an engineering perspective, operation within the common temperature range of 10–20 °C should preferentially adopt the lower end of this interval, as lower temperatures minimize long-term deformation and leakage while preserving sufficient storage capacity. The recommended operating range of 10–15 °C represents a practical compromise between geomechanical stability and energy efficiency. At lower temperatures, salt creep and brine leakage are minimized, ensuring long-term cavern integrity; however, excessively low temperatures increase fluid viscosity and reduce pumping efficiency. Conversely, higher temperatures improve hydraulic performance but accelerate creep deformation and enlarge leakage pathways. The 10–15 °C interval therefore offers a balanced regime where thermal effects remain mild enough to preserve stability while still allowing efficient energy transfer during cyclic operation.
Although this study provides valuable insights into the mechanical feasibility of underground pumped hydro storage in salt caverns, several limitations should be acknowledged. The numerical model assumes laterally uniform and isotropic formations, whereas the Salina Group is known to exhibit heterogeneity, mechanical anisotropy, and minor fracturing that could influence deformation and leakage pathways. Unmodeled local heterogeneities such as minor faults, dissolution channels, or lateral thickness variations could locally perturb the stress field and fluid pathways around the caverns, and lead to enhanced deformation or localized leakage if connected to interbeds or high-permeability zones. Such effects are highly site-specific and would require detailed geological and geophysical characterization to quantify. Moreover, the assumptions of isotropy and lateral uniformity may affect leakage predictions, as permeability anisotropy or interbed heterogeneity could create preferential flow paths or barriers that locally modify leakage behavior. Future investigations should therefore integrate 3D heterogeneity maps and field-scale hydro-mechanical measurements to better constrain their influence on cavern stability and sealing performance. Furthermore, the present work focuses primarily on geomechanical feasibility and does not incorporate an economic assessment of UPHS deployment in Southern Ontario, such as construction cost, operation and maintenance expenses, and market competitiveness relative to other energy storage technologies. Addressing these aspects will be essential to move from technical feasibility toward practical implementation.
Future research should therefore focus on reducing these uncertainties by integrating site-specific geological data—such as core testing, in situ stress measurements, and permeability characterization—with advanced numerical models that explicitly capture anisotropy and heterogeneity. Such work will be crucial for translating the present technical feasibility into practical, economically viable implementation.

