Article

High-Resolution UAV-Based Fuzzy Logic Mapping of Iron Oxide Alteration for Porphyry Copper Exploration: A Case Study from the Kyzylkiya Copper Prospect in Eastern Kazakhstan

by
Elmira Orynbassarova
1,
Hemayatullah Ahmadi
2,3,4,*,
Bakhberde Adebiyet
1,
Amin Beiranvand Pour
5,
Alma Bekbotayeva
4 and
Nurmakhambet Sydyk
6
1
Geomatics Innovation Center, Satbayev University, Almaty 050013, Kazakhstan
2
Department of Geological Engineering and Exploration of Mines, Faculty of Geology and Mines, Kabul Polytechnic University, Kabul 1001, Afghanistan
3
Department of Water Resources, Wood Rodgers, Inc., Orange, CA 92866, USA
4
Department of Geological Survey, Search and Exploration of Mineral Deposits, Geology and Oil-Gas Business Institute, Satbayev University, Almaty 050013, Kazakhstan
5
Institute of Oceanography and Environment (INOS), Higher Institution Center of Excellence (HICoE) in Marine Science, Universiti Malaysia Terengganu (UMT), Kuala Nerus 21030, Malaysia
6
Institute of Ionosphere, Almaty 050000, Kazakhstan
*
Author to whom correspondence should be addressed.
Mining 2025, 5(3), 52; https://doi.org/10.3390/mining5030052
Submission received: 3 July 2025 / Revised: 11 August 2025 / Accepted: 13 August 2025 / Published: 18 August 2025

Abstract

Detecting surface mineral indicators with high spatial precision remains a significant challenge in mineral exploration, particularly in remote or geologically complex regions such as Eastern Kazakhstan. This study addresses this challenge by integrating high-resolution multispectral imagery from Unmanned Aerial Vehicles (UAVs) to map iron oxide distributions, key indicators of ore mineralization such as copper porphyry at the Kyzylkiya mining site in Eastern Kazakhstan. The novelty of this study is the development of a statistical fuzzy logic model that integrates UAV-derived spectral indices, including the Normalized Difference Vegetation Index (NDVI) and targeted band ratios, to generate probabilistic maps of iron oxide presence at a fine spatial resolution of 5.29 cm. This approach enhances prediction accuracy by incorporating uncertainty and variability in spectral responses. The model’s output was validated through a multi-stage process involving independent multispectral datasets and ground-truth sampling, achieving an overall accuracy of 80%. The results reveal concentrated iron oxide anomalies in the northeast and northwest of the study area, underscoring the method’s effectiveness. This integrated UAV-fuzzy logic framework demonstrates a scalable and cost-effective solution for early-stage mineral exploration and can be adapted to similar geological settings globally.

1. Introduction

The use of remote sensing satellite imagery substantially increases the effectiveness of mineral exploration by identifying numerous new potential areas for investigation [1,2,3]. This technology allows geologists to quickly cover large and remote regions and provide valuable preliminary data on geological formations, mineral compositions and structural features [4]. By targeting promising targets using satellite imagery, exploration teams can prioritize their efforts and resources, reducing the need for extensive and costly fieldwork [5,6,7]. This approach not only saves time and money, but also minimizes environmental impact by focusing on the most promising areas for detailed investigations [8,9,10].
Iron oxide is of critical importance in mineral exploration as it often indicates the presence of ore mineralization and is frequently associated with valuable deposits such as porphyry copper and iron oxide copper–gold (IOCG) systems. The trace element composition of iron oxides provides valuable information on hydrothermal activity and the nature of associated ore mineralization, with certain trace elements indicating the potential presence of precious and critical metals [11]. Mapping iron oxide-rich zones is critical for the discovery of economically significant mineral deposits and plays a key role in streamlining exploration efforts and optimizing discovery and extraction strategies [12,13].
Advances in image processing techniques have improved the detection of indicator alteration minerals and favored the mapping of iron oxide by specialized methods [14,15,16,17,18,19]. However, challenges remain due to the inherent characteristics of iron oxide, such as their association with certain alteration types, which can vary significantly. Most remote sensing studies dealing with alteration mapping use conventional techniques such as False Color Composite (FCC), Band Ratio (BR) analysis, Principal Component Analysis (PCA) and classifications [2,20]. Newer approaches have incorporated machine learning algorithms that provide higher accuracy and greater potential for discrimination of lithological units with iron oxide, especially when data from multiple sensors are combined [21,22]. However, due to the relatively low spatial resolution of most freely available remote sensing datasets compared to the extent of iron oxide, direct detection of such mineralization remains a challenging task.
With the advent of Unmanned Aerial Vehicles (UAVs) in the geology and mining industry, numerous applications have been established to improve geological mapping and mineral exploration [23,24]. UAV photogrammetry has proven to be an efficient tool for precise mapping of geological features, including the detection of iron oxide [25,26]. This technology facilitates detailed geological mapping, semi-automated characterization of rock masses, supervised lithological classification, structural analysis and semi-automated extraction of lineaments. The ultra-high-resolution orthomosaics (typically 3–5 cm) obtained using UAV mapping allow geologists to manually delineate lithological boundaries, identify hydrothermally altered areas, and map structural features with unprecedented accuracy [25,27,28].
The application of remote sensing datasets, including UAV imagery, in mineral exploration studies is often limited by the influence of various external factors. These factors can significantly affect the accuracy and effectiveness of mapping results. However, when these influencing factors are considered, more reliable results can be obtained. To improve the accuracy of mineral exploration and lithological mapping, a number of advanced statistical methods can be used. Techniques such as Analytic Hierarchy Process (AHP), fuzzy logic, Frequency Ratio (FR), Boolean Logic and Simple Additive Weighting (SAW) are commonly used to create probabilistic spatial distribution maps. These methods help integrate multiple data sources and account for the uncertainties inherent in geological data, improving the overall reliability and accuracy of exploration results [29,30,31,32,33,34,35]. The application of fuzzy logic in mineral exploration allows for the incorporation of expert knowledge and the handling of uncertainties in geological data, leading to more nuanced and accurate predictions [36,37,38].
The use of remote sensing, especially UAV dataset, for sustainable mineral exploration in Kazakhstan, which has a large number of ore deposits, remains limited. Despite the significant potential of these technologies, few studies have used satellite imagery for this purpose [39]. The vast and diverse geological landscape of Kazakhstan offers numerous opportunities for mineral exploration, but the application of advanced remote sensing techniques has not yet been fully exploited. UAVs, with their ability to capture high-resolution data and create detailed geological maps, could revolutionize the exploration process by identifying mineral deposits more efficiently and accurately. However, the current state of research is scant, highlighting the need for more comprehensive studies to fully exploit the potential of UAV imagery in this region.
Consequently, this study is the first attempt to determine the spatial distribution of iron oxide associated with porphyry copper deposits in Kazakhstan, focusing on the distinct test areas, in particular the Kyzylkiya porphyry copper deposit in Eastern Kazakhstan (Figure 1a,b). With the help of multispectral images acquired by UAVs and the application of the fuzzy logic method, an innovative technique for the exploration of porphyry copper deposits in Kazakhstan is being improved. The results of this study are not only relevant for Kazakhstan, but also have the potential to make a significant contribution to UAVs-based exploration of iron, copper and other ore mineralization associated with hydrothermal alteration systems.

2. Geology and Mineralization of the Study Area

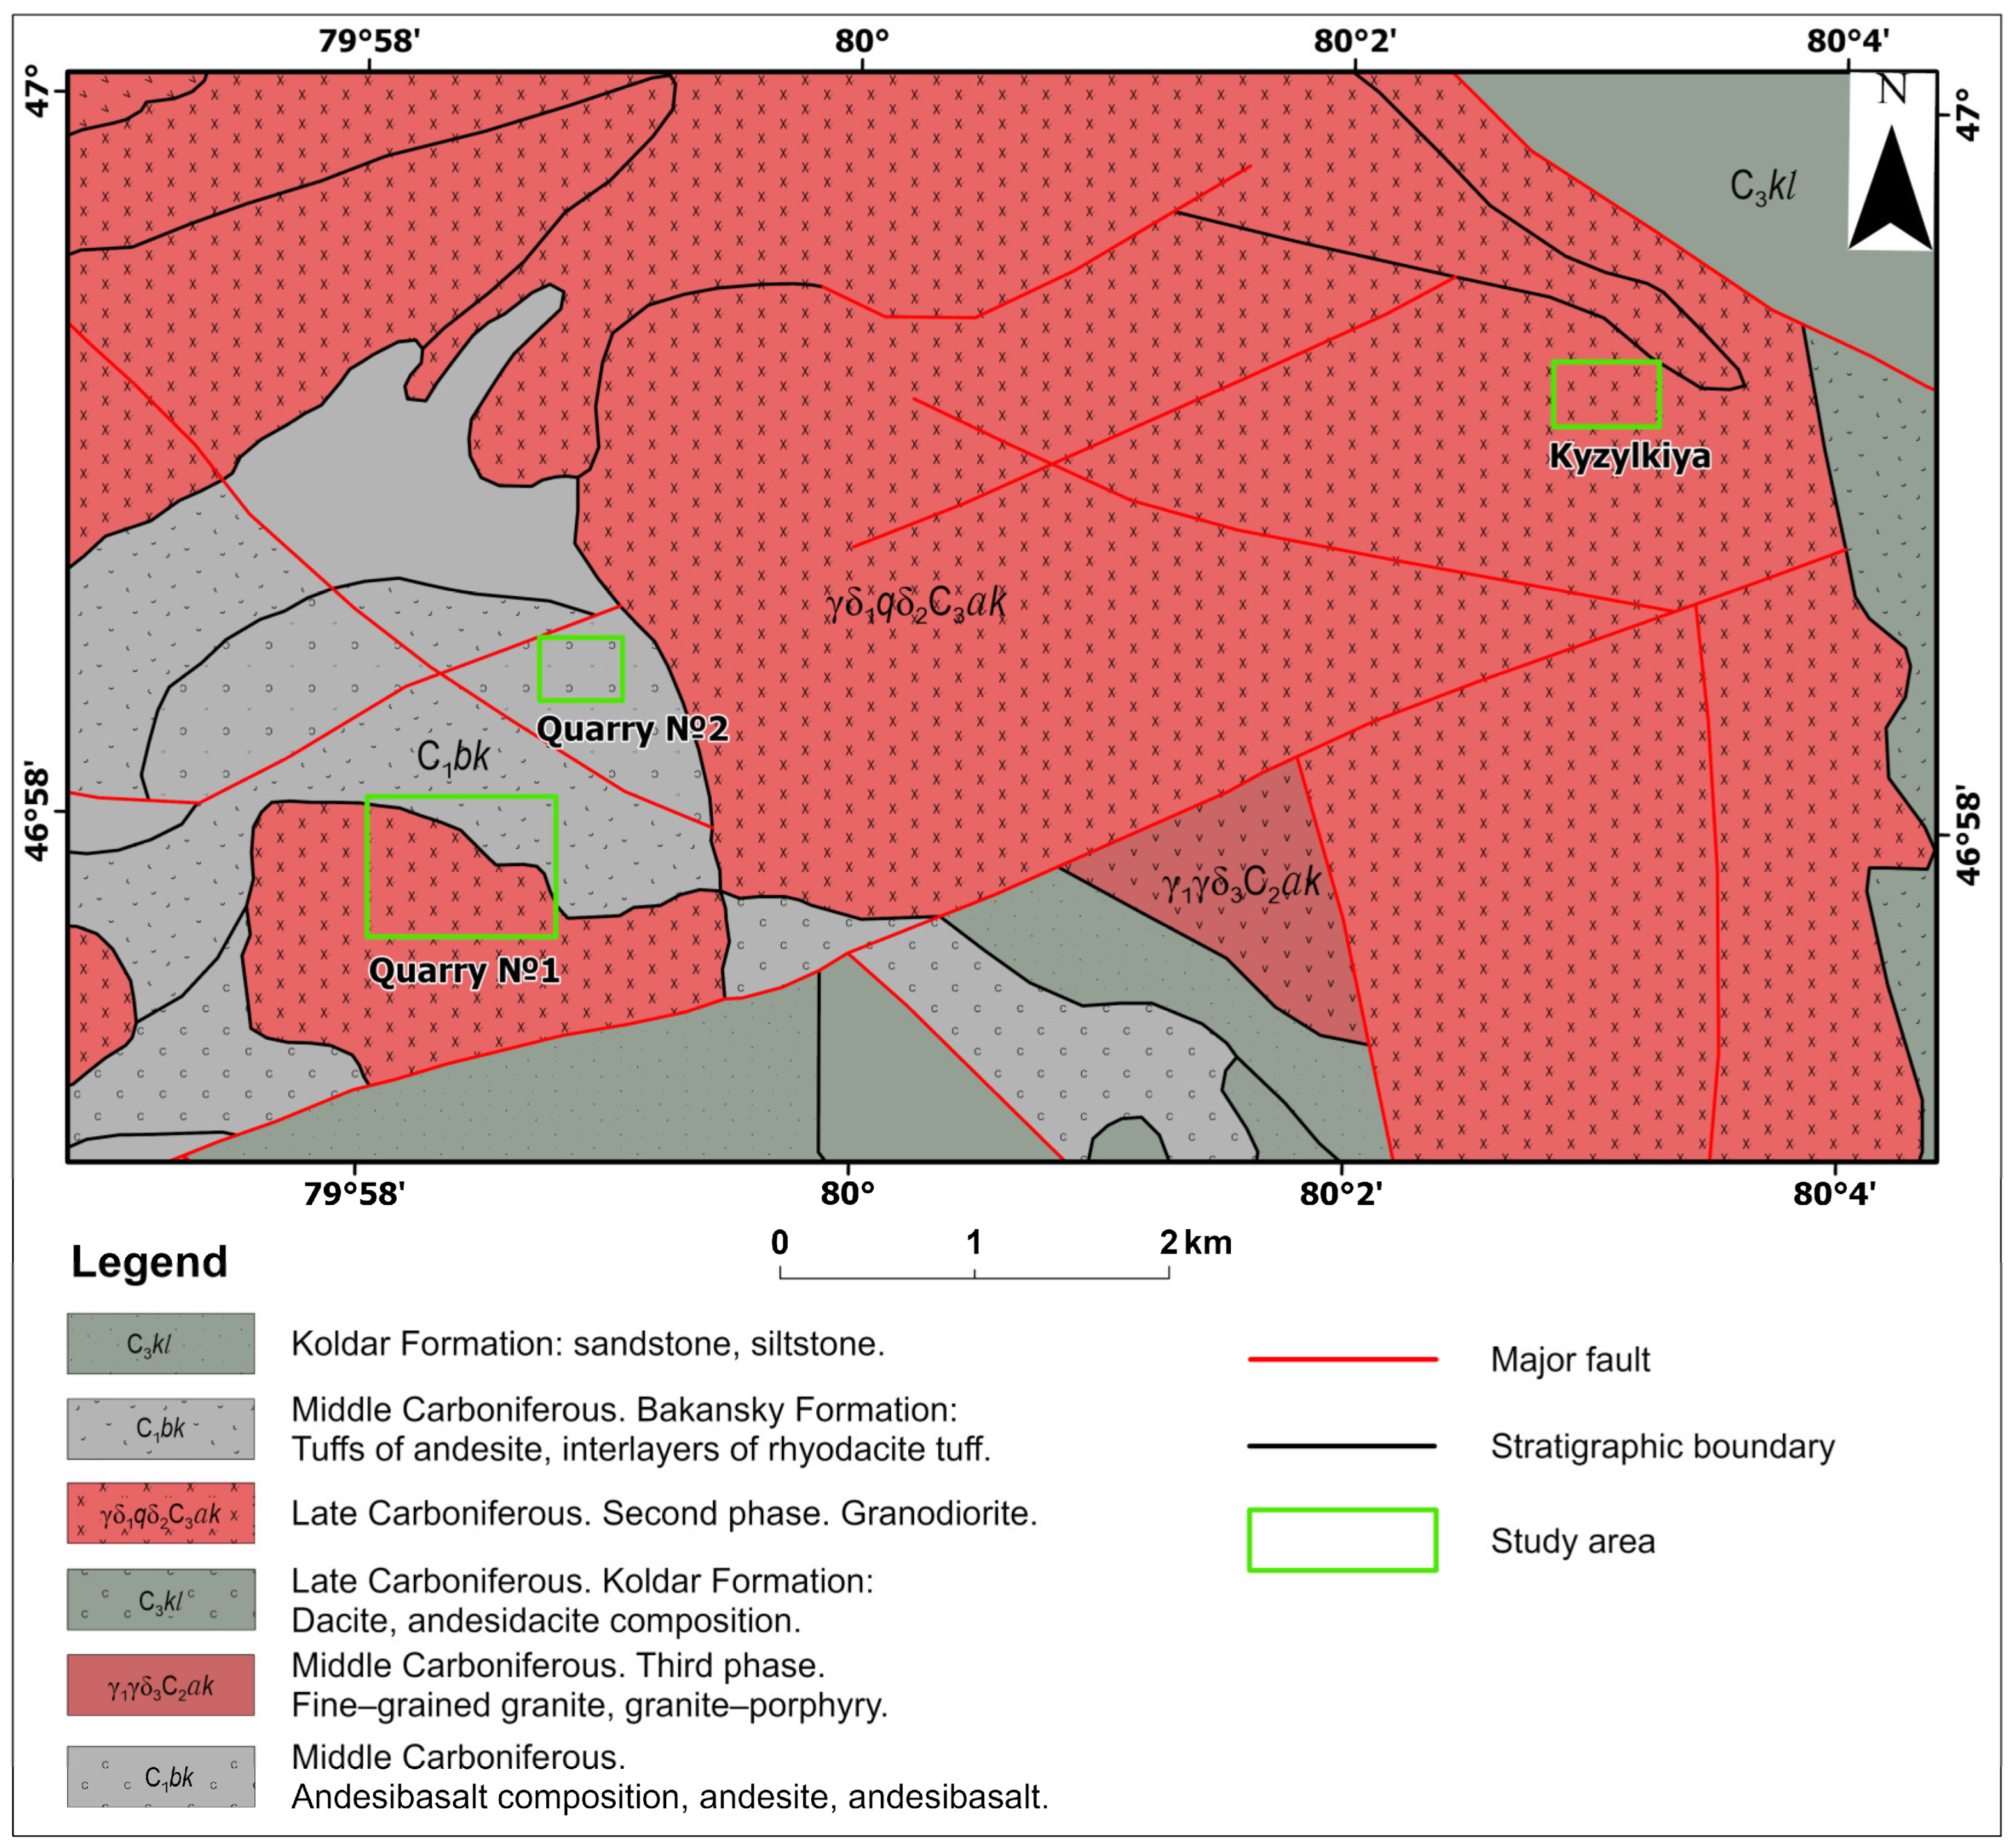
Geologically, the Abay region lies within the western sector of the Central Asian Orogenic Belt (CAOB), a geodynamically active zone renowned for its complex tectonic evolution and extensive magmatic processes. The lithological composition of the mineralized area is predominantly magmatic, comprising a suite of porphyritic intrusions and volcanic units that reflect multiple phases of igneous activity associated with arc-related and post-collisional settings [40,41]. The Aktogay copper deposit, along with its adjacent terrain, Kyzylkiya, is entirely hosted within the Koldar granitic pluton, an expansive, compositionally heterogeneous intrusive complex emplaced at depth during magmatic crystallization. The plutonic assemblage is dominated by granodiorite and granite, accompanied by subordinate lithologies including gabbro, diorite, and quartz diorite, indicative of a multiphase magmatic evolution and variable melt differentiation processes. The Koldar pluton is intruded into the older Keregetas volcanic series, suggesting that copper mineralization, typically associated with magmatic processes, occurred after these volcanic formations. The Kyzylkia deposit, located about 4 km east of Aktogay, also belongs to the same geological setting. It appears to have experienced deeper erosion compared to Aktogay and Aidarly, indicating different levels of erosion in the Aktogay district [42,43,44] (Figure 2).
Copper mineralization within the Aktogay deposit is typified by the predominance of chalcopyrite, a primary copper-bearing sulfide phase commonly associated with hydrothermal systems and magmatic-hydrothermal ore formation. Chalcopyrite occurs in two distinct forms: as isolated, early-stage crystals (phenocrysts) embedded in the host rock, and in a network of interconnected fractures known as stockwork veins filled with quartz and carbonate minerals. This mineralization indicates a hydrothermal process in which mineral-bearing fluids circulated through the rock and precipitated copper sulfide along fractures and within the rock matrix. Similarly, the copper mineralization in the Kyzylkia deposit also has chalcopyrite as the primary sulfide mineral. The deposit has a similar hydrothermal genesis, with copper sulfides filling veins and fissures, and the presence of disseminated chalcopyrite in the host rock. The geological similarities between Aktogay and Kyzylkia emphasize the role of hydrothermal systems in the formation of copper deposits in the region [45]. Mineralization in the Aktogay copper deposit occurs in the first intrusive phase rocks and volcano-sedimentary rocks of the Keregetas Formation. This mineralization is spatially associated with small stocks and dikes of porphyritic granodiorite and later granodiorite porphyries. Tectonic structures, notably fault systems, exerted a significant control on the spatial distribution and emplacement of copper and associated molybdenum mineralization. Approximately 70% of the ore is hosted within intrusive lithologies, whereas the remaining 30% is localized within volcano-sedimentary units, reflecting structural compartmentalization and lithological influences on mineral deposition [41,45,46,47] (Figure 2).
In this study, three sites in the Abay region were selected for detailed study: two in Aktogay and one in Kyzylkiya, with Kyzylkiya being the focus. Both Aktogay and Kyzylkiya are important open-pit porphyry copper deposits located in the Ayagoz district in south-eastern Kazakhstan. These deposits are strategically located about 470 km northeast of Almaty, 250 km west of the Chinese border and 22 km east of the Aktogay railroad station (see Figure 1b).

3. Materials and Methods

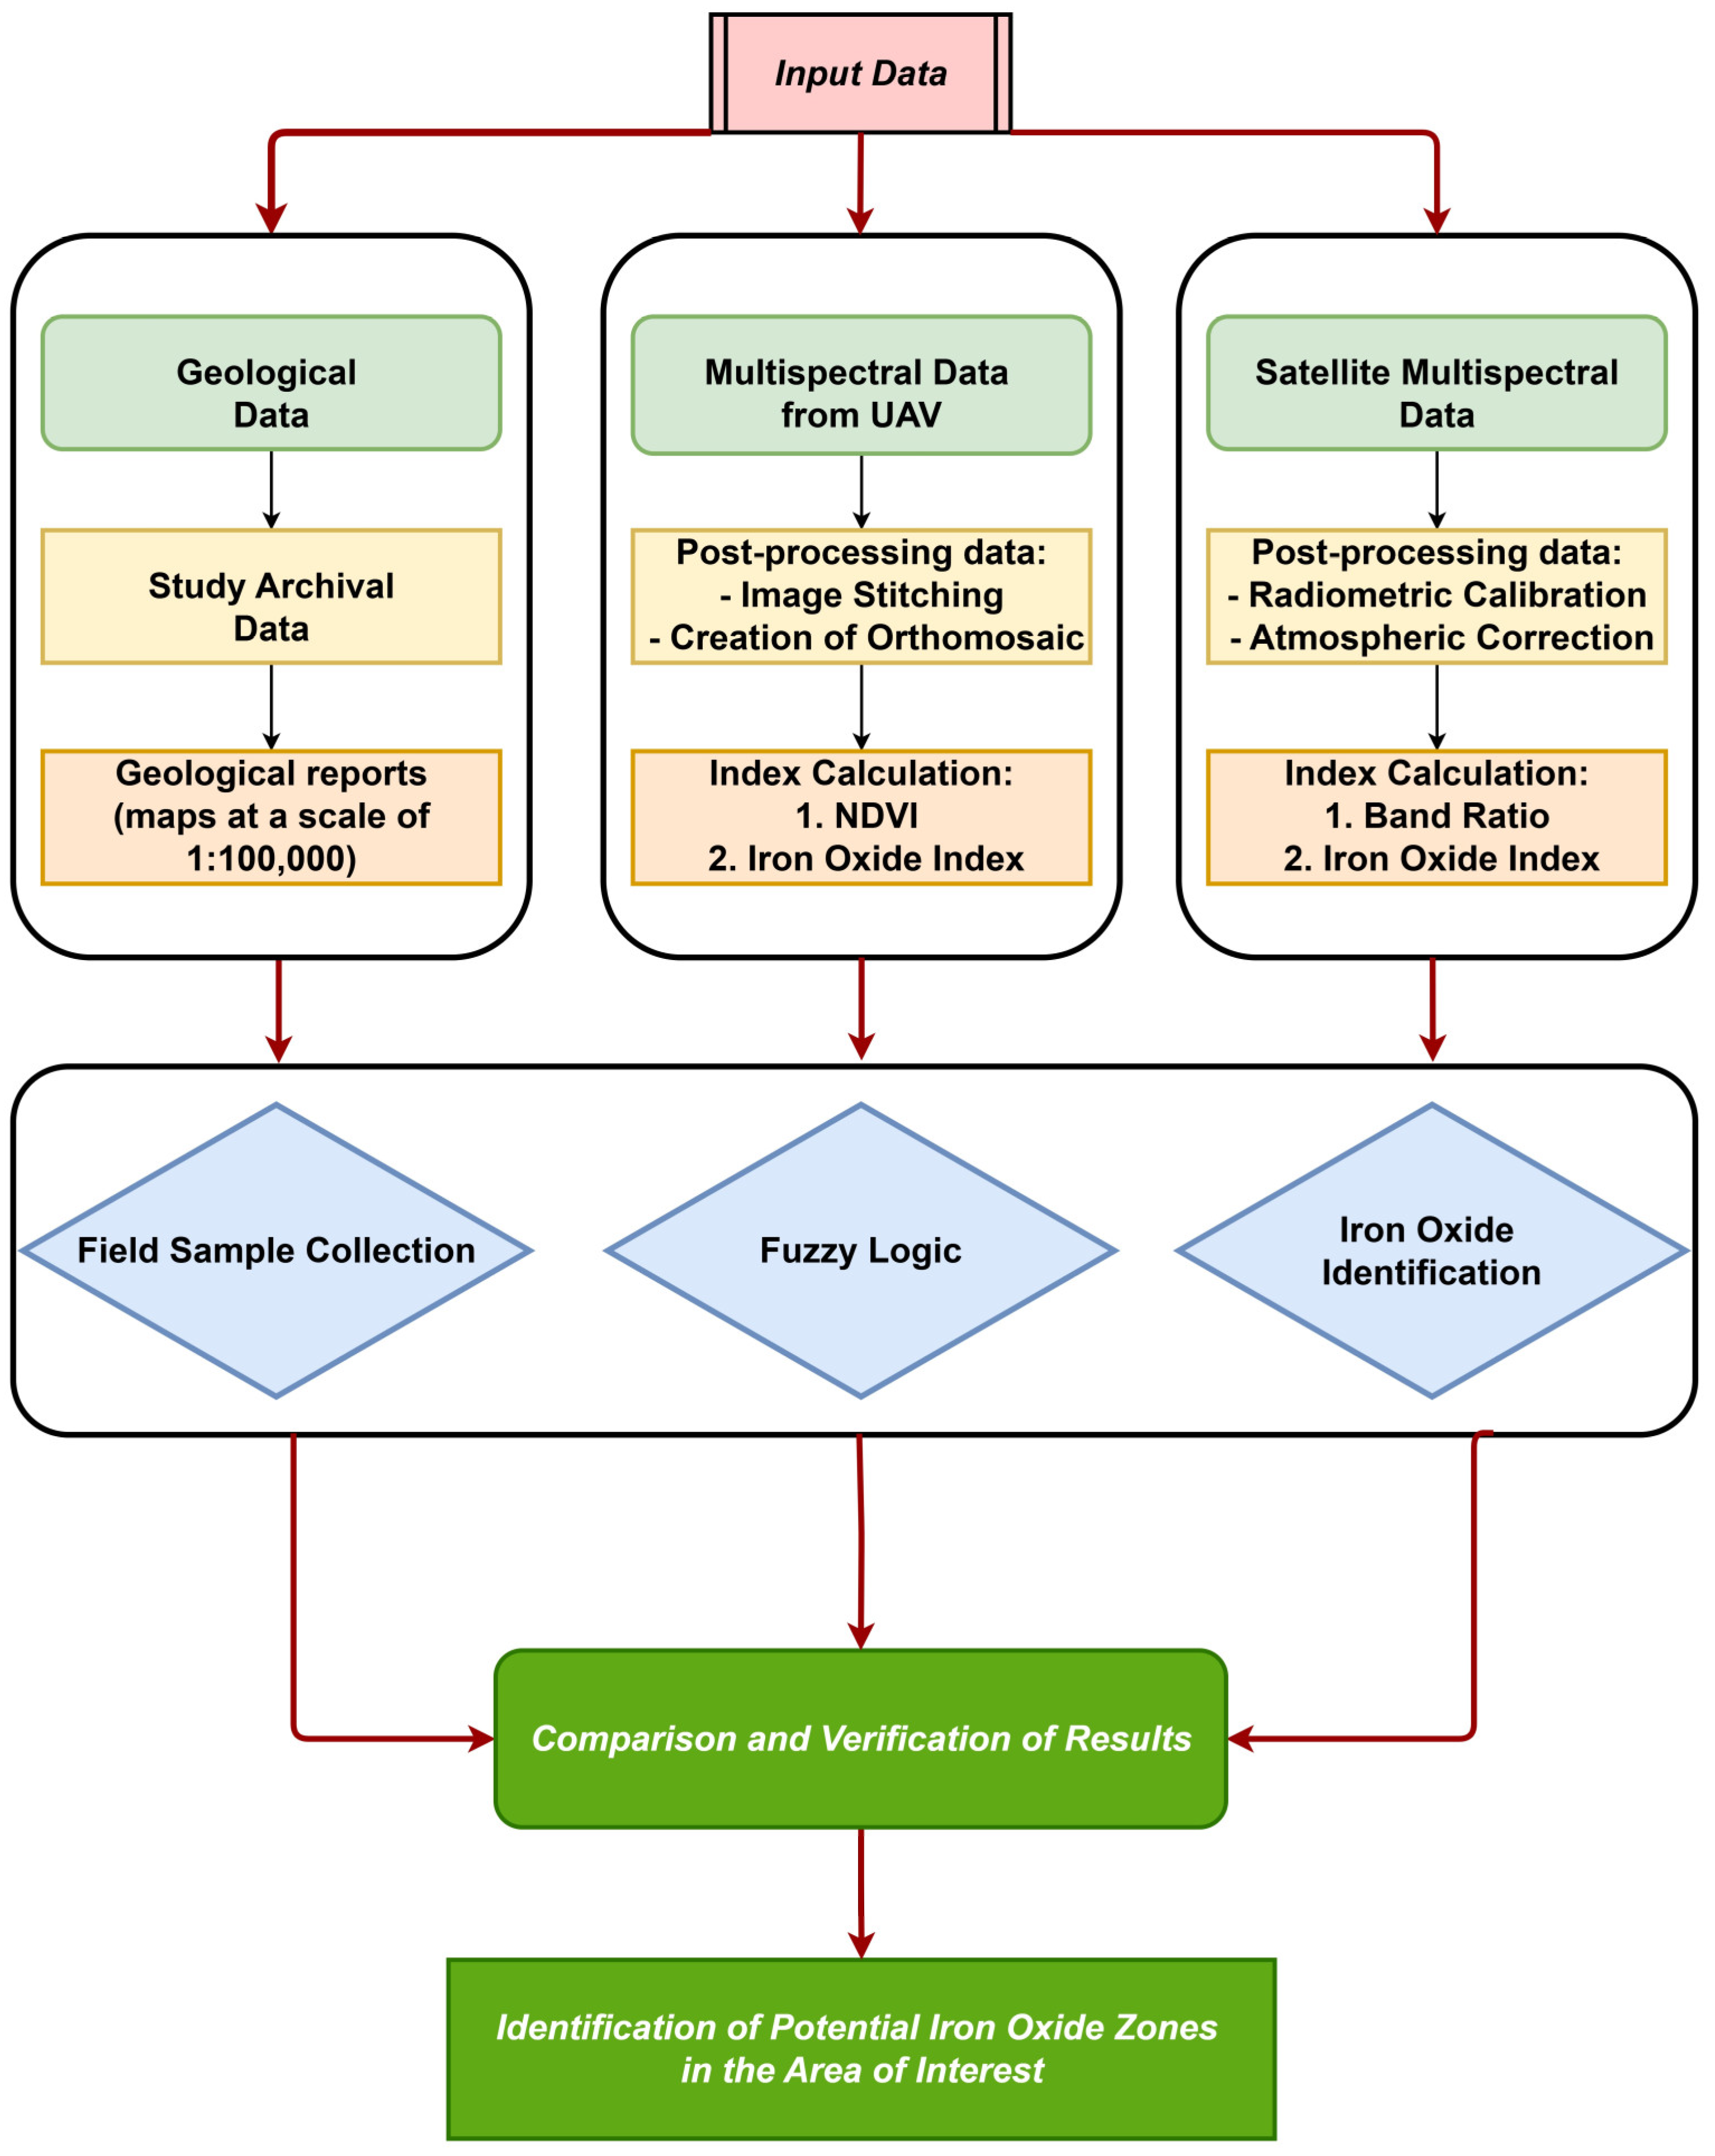
In accordance with the main objective of this study, high-resolution UAV imagery was used to detect the iron oxide-bearing bodies associated with porphyry copper and investigated in the Kyzylkiya area and surroundings in the eastern part of Kazakhstan. The overall methodology consisted of three main phases, including (i) conducting a systematic literature review to find gaps and define a new methodology, (ii) multispectral analysis of airborne UAV-generated imagery, and (iii) verification of results (Figure 3).
All available scientific sources, including journal articles, conference proceedings, dissertations and official websites, were reviewed to verify the studies conducted in Kazakhstan and the methods used worldwide. This phase led to defining the existing problem and developing a novel and optimistic approach to address the current global trend in the use of geospatial technology in mineral exploration.
In this study, a DJI Phantom 4 Multispectral Unmanned Aerial Vehicle (UAV) was used to collect multispectral data with the characteristics described in Table 1. This UAV is equipped with a multispectral camera that has six independent sensors. The camera captures data in five spectral bands, including blue, green, red, RedEdge, and near-infrared (NIR). In addition, the camera supports the standard visible spectrum (RGB), enabling the simultaneous capture of visible images and data to calculate various indices. The device is also equipped with a sunlight sensor that measures light intensity during flight [48]. This helps to compensate for changes in lighting during post-processing, improving the accuracy of the results, especially when calculating vegetation indices and other parameters that depend on light intensity. The Phantom 4 Multispectral supports RTK (Real-Time Kinematic) and PPK (Post-Processed Kinematic) modes, which enable centimeter-level accuracy. This makes the UAV indispensable for geodetic and technical tasks where high-precision spatial data is required [49,50].
The final phase was to verify the results through field sampling and comparison with the ASTER data results. During the spectral analysis for detecting iron oxide, fuzzy logic statistical model was utilized. The multispectral results obtained from the UAVs, in particular the band ratios and vegetation cover, were subjected to the fuzzy logic model to obtain the final spatial distribution of iron oxide in the study areas.

3.1. Multispectral Arial Survey by UAV-Mounted DJI Phantom Sensor

Prior to conducting the aerial survey with the DJI Phantom 4 UAV, key environmental and operational parameters were carefully evaluated to minimize spatial and spectral errors and ensure data quality. In order to achieve high-quality data capture, the following considerations were made during flight planning:
Weather Conditions: Surveys were conducted on sunny, cloudless days to ensure uniform lighting across the study area and reduce spectral variability.
Timing: The surveys were carried out in the first half of the day, avoiding early morning hours to prevent harsh shadows and low light levels.
Wind Speed: A maximum wind speed of 5 m/s was maintained to ensure flight stability and reduce UAV deviations from the planned route. Gusty winds were avoided to prevent compromised image quality.
For the multispectral survey using the DJI Phantom 4 Multispectral, flight and survey parameters were optimized to balance spatial resolution, georeferencing accuracy, and coverage efficiency. These parameters enabled the acquisition of detailed imagery suitable for analyzing soil conditions, vegetation, and mineral composition in the study area.
The flight altitude was set at 100 m, achieving a spatial resolution of 5.29 cm/pixel, meaning each pixel represents an area of 5.29 cm on the ground. This resolution is a critical parameter that determines the level of detail in the collected data. A lower spatial resolution (smaller pixel size) provides more detailed data but reduces the coverage area per flight. The relationship between spatial resolution and flight altitude can be described by the formula [51]:
G S D = H × s e n s o r   w i d t h F × i m a g e   w i d t h
where
  • H—flight altitude (meters), sensor width—width of the camera sensor (millimeters),
  • F—camera focal length (millimeters), image width—width of the image in pixels.
This formula underpins the design of UAV-based surveys, as it enables optimization of flight altitude to balance spatial resolution and survey area coverage.
Image overlap is another key factor in ensuring data reliability and the generation of high-quality orthophotos and 3D terrain models. The following overlap values were applied:
Forward overlap: 70%, ensuring a sufficient number of common points between consecutive images along the flight path.
Side overlap: 60%, providing dense coverage and minimizing gaps between image rows.
These overlap values were specifically selected to enhance the accuracy of photogrammetric processing. Insufficient overlap can lead to data gaps and lower-quality image stitching, especially in areas with complex terrain. Conversely, the chosen 70%/60% overlap configuration ensures robust stitching accuracy and reliable data integration, particularly in regions requiring high-precision mapping.
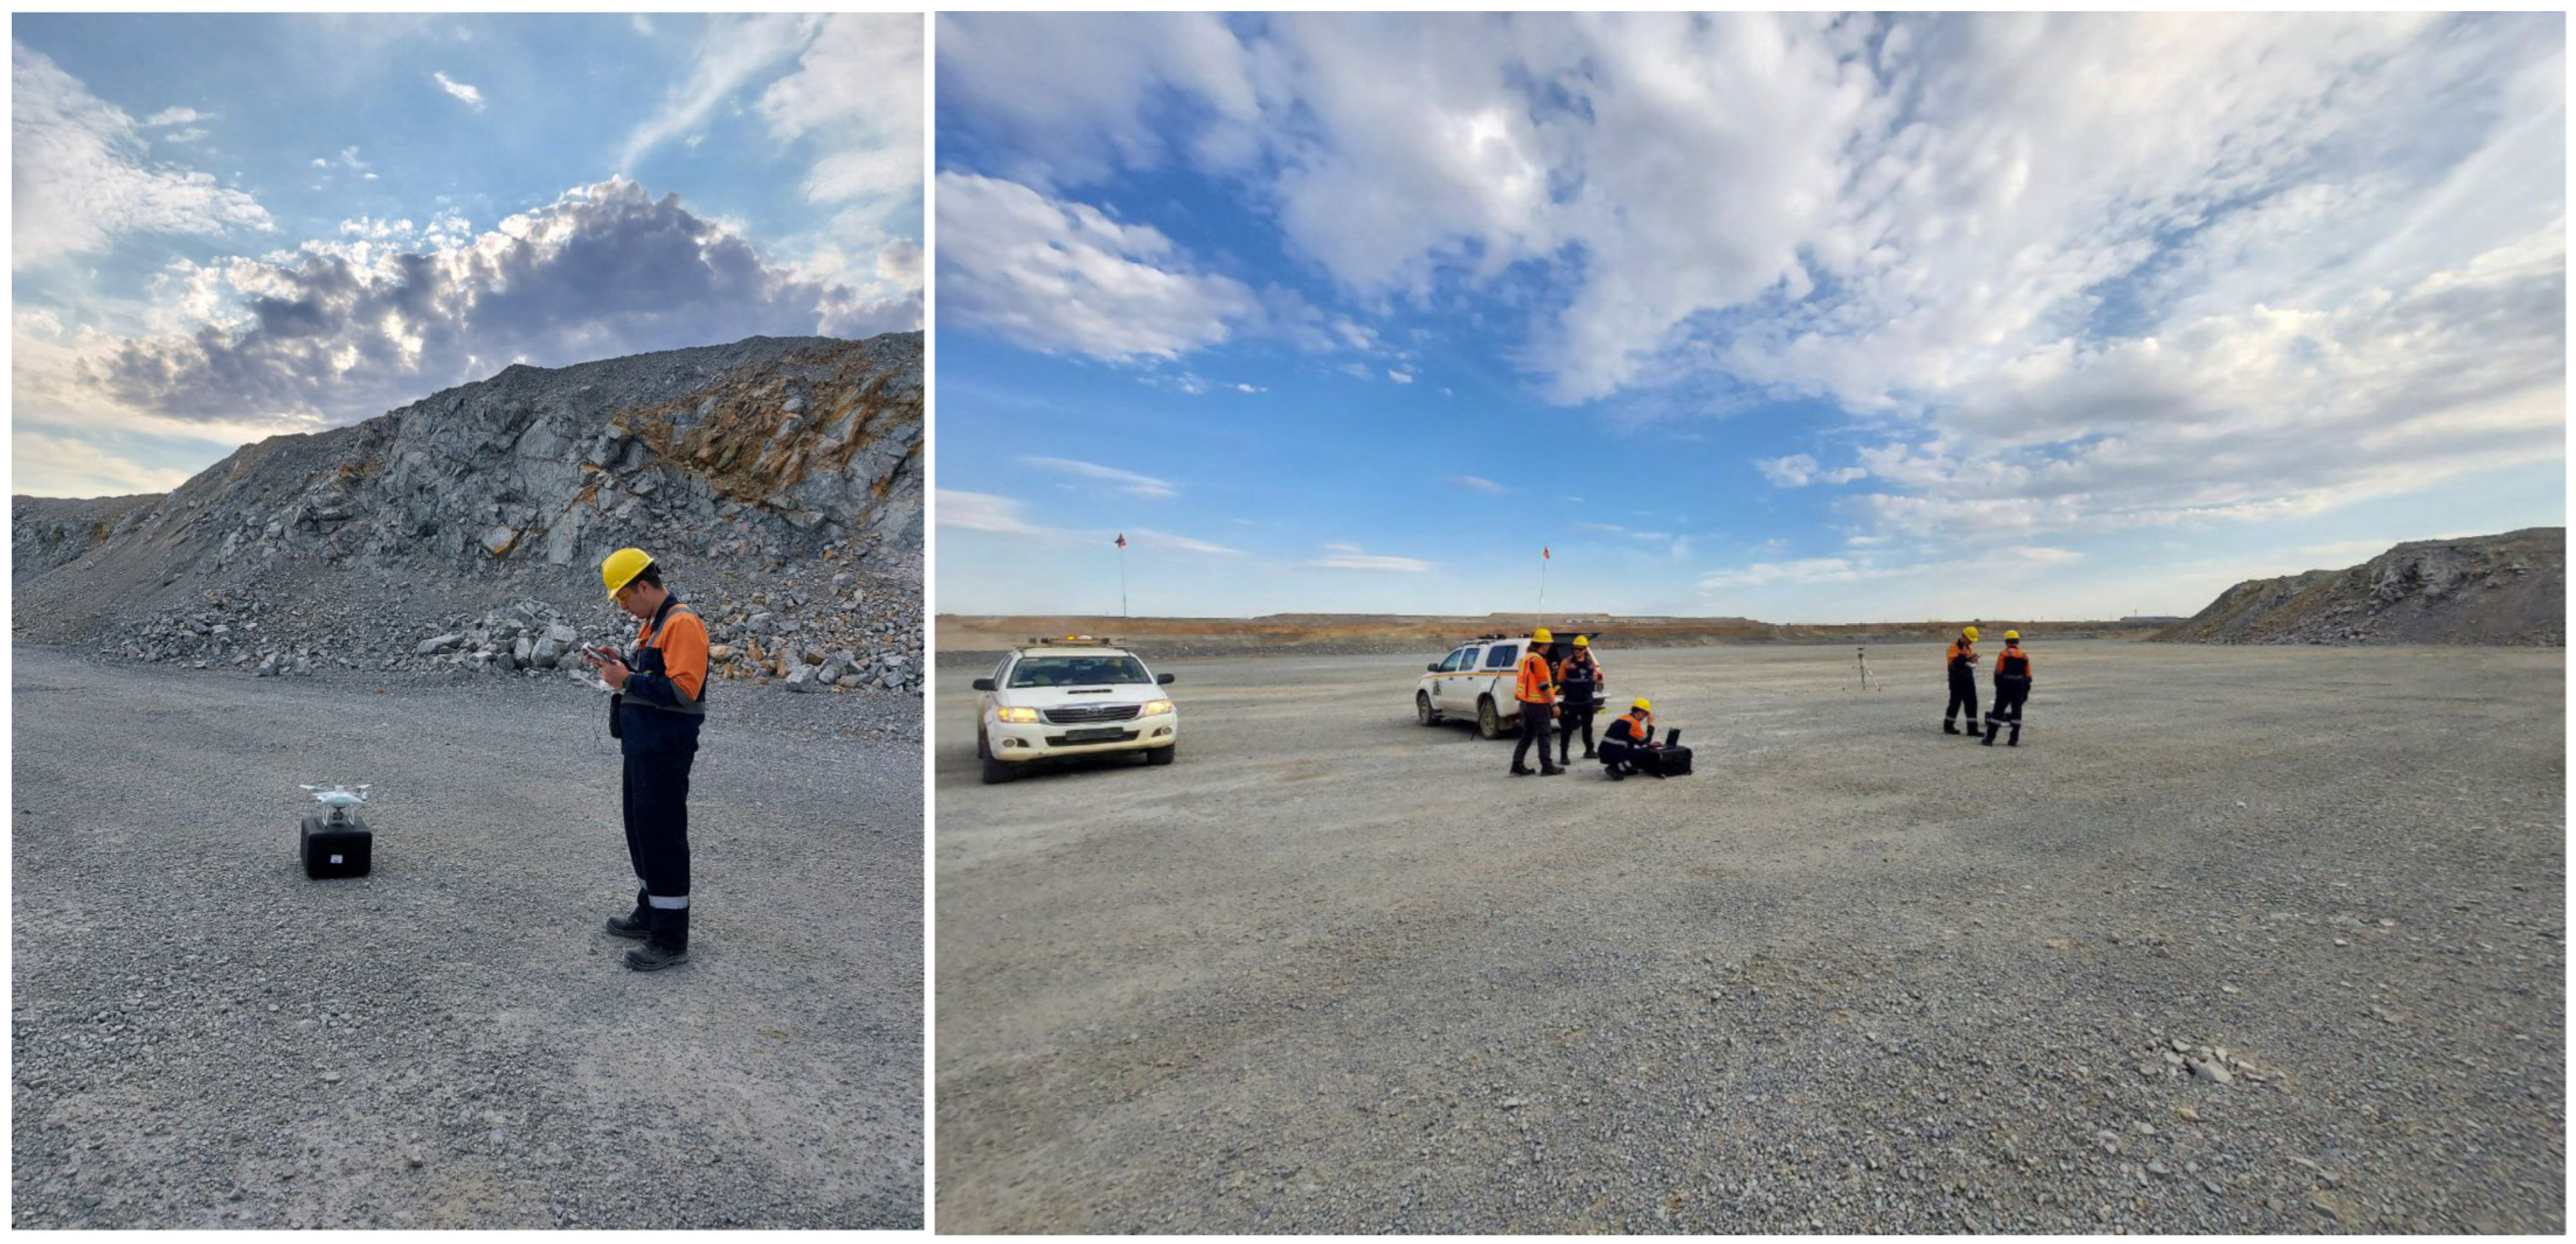
The aerial surveys were conducted from 26 July 2024, to 29 July 2024 (Figure 4). During this period, all flights were executed in strict adherence to established criteria for multispectral data acquisition to ensure the integrity and quality of the collected data. Special emphasis was placed on flight safety and operational conditions, including continuous monitoring of weather variables. Flights were conducted under optimal conditions, ensuring the absence of strong winds and consistent sunlight for uniform image illumination. These measures minimized the risk of data inconsistencies due to environmental factors. Pre-planned flight routes were meticulously followed to maximize study area coverage and achieve the required image overlap for reliable data processing. This approach ensured adherence to the overlap parameters necessary for generating high-quality orthophotos and accurate photogrammetric models, thus facilitating robust spatial analysis and interpretation.
To optimize flight efficiency and maximize the coverage area per flight, the continuous shooting mode was employed, enabling the UAV to capture images at regular intervals without pausing at specific points. This approach increased the coverage area to 14 hectares per flight while maintaining high data accuracy and minimizing operational time. The UAV’s positional accuracy during the survey was initially achieved through its integrated GNSS receiver, which provided baseline precision. However, to enhance accuracy to up to 5 cm, the post-processed kinematic (PPK) method was applied, allowing for corrections to the GNSS data during post-processing and ensuring precise determination of photo centers. PPK applies corrections to raw satellite positioning data post-flight, mitigating errors from signal loss or communication interruptions [52,53]. Ground control points (GCPs) were utilized as a critical step to correct positional errors, significantly improving georeferencing and ensuring the creation of highly accurate orthophotos and 3D terrain models. Flight planning and route configuration for the multispectral survey were conducted using DJI GS Pro software (ver. 2.0.17), which enabled precise route design and parameter adjustments to meet the required overlap, coverage, and resolution standards.
Unlike Real-Time Kinematic (RTK), it does not require a constant connection to a base station, making it ideal for remote areas without GSM coverage or reference stations. A Leica GS16 geodetic-grade GNSS unit served as the base station, recording static data at 1 Hz with a 10-degree elevation mask, matching the UAV’s GNSS system frequency. This synchronization ensured accurate post-flight corrections and high georeferencing precision.
During the post-processing phase, raw static data recorded by the local base station, data from the UAV’s onboard GNSS system, and photo markers captured during the survey were integrated. Corrections were applied to the UAV’s flight trajectory to eliminate potential positioning errors. This process resulted in the precise calculation of the UAV’s flight path and camera positions (Table 2), significantly enhancing the georeferencing accuracy of the images. Post-processing achieved a positioning accuracy of up to 5 cm, ensuring high reliability and precision for subsequent image analysis and the generation of orthophotos. This level of accuracy was critical for producing geospatial products with minimal positional error, meeting the demands of high-resolution mapping and analysis.
Ground Control Points (GCPs) are essential for ensuring georeferencing accuracy and minimizing positioning errors in UAV surveying. Research indicates that using 5 to 10 GCPs per survey area provides optimal accuracy, with their even distribution across the area being critical for maximizing precision. It is important to note that increasing the number of GCPs beyond this range offers diminishing returns in accuracy while increasing costs and logistical complexity [54,55]. The optimal placement of GCPs involves positioning them at the corners and the central region of the survey area to ensure uniform spatial coverage. Additionally, in areas with significant terrain variations, GCPs should be placed at different elevations to minimize distortions caused by height differences.
In the Aktogay and Kyzylkiya areas, 5 to 7 GCPs were installed at each site. High-precision dual-frequency GNSS equipment, the Leica GS16, was used in Real-Time Kinematic (RTK) mode to coordinate the GCPs, achieving a positioning accuracy of 2–5 cm. This level of accuracy is crucial for high-precision geodetic applications and ensures reliable results for subsequent analysis and mapping.

3.2. Processing of Multispectral Data

Processing of multispectral data collected via UAVs was conducted using Agisoft Metashape Professional (version 2.1.2), a specialized software for generating geospatial products. This step is essential for converting raw images into final outputs, including a dense point cloud, a digital terrain model (DTM), a digital elevation model (DEM), and a multispectral orthophoto. In addition, ENVI 5.6 was employed for the spectral analysis, while ArcMap was used for the vectorization and other plotting purposes.
The first stage involved reflectance calibration using the integrated “Sun Sensor”. This calibration is critical for compensating for variations in sunlight intensity during data acquisition, ensuring the accuracy of spectral analyses. The Sun Sensor measures solar radiation intensity in real-time, enabling the correction of reflectance values to account for changes in lighting conditions throughout the flight [56].
Once reflectance calibration was completed, the next step was image alignment, a key process for unifying all multispectral images within a single geospatial coordinate system. The image alignment stage includes Georeferencing, which integrates GNSS data and Ground Control Points (GCPs) to reduce positional shifts and errors, ensuring precise stitching of images into a seamless model, and Automatic alignment of images using key-point matching algorithms, which establishes the foundation for generating accurate terrain models and orthophotos.
Following data alignment, a dense point cloud was generated. This point cloud, derived from the spatial alignment of multiple images, serves as the foundation for constructing the Digital Terrain Model (DTM) and Digital Elevation Model (DEM). The dense point cloud captures detailed information on elevations, terrain, and surface textures. From the multispectral survey data, a high-quality dense point cloud comprising 38,367,725 points was produced, achieving an overall accuracy of 2.69 cm.
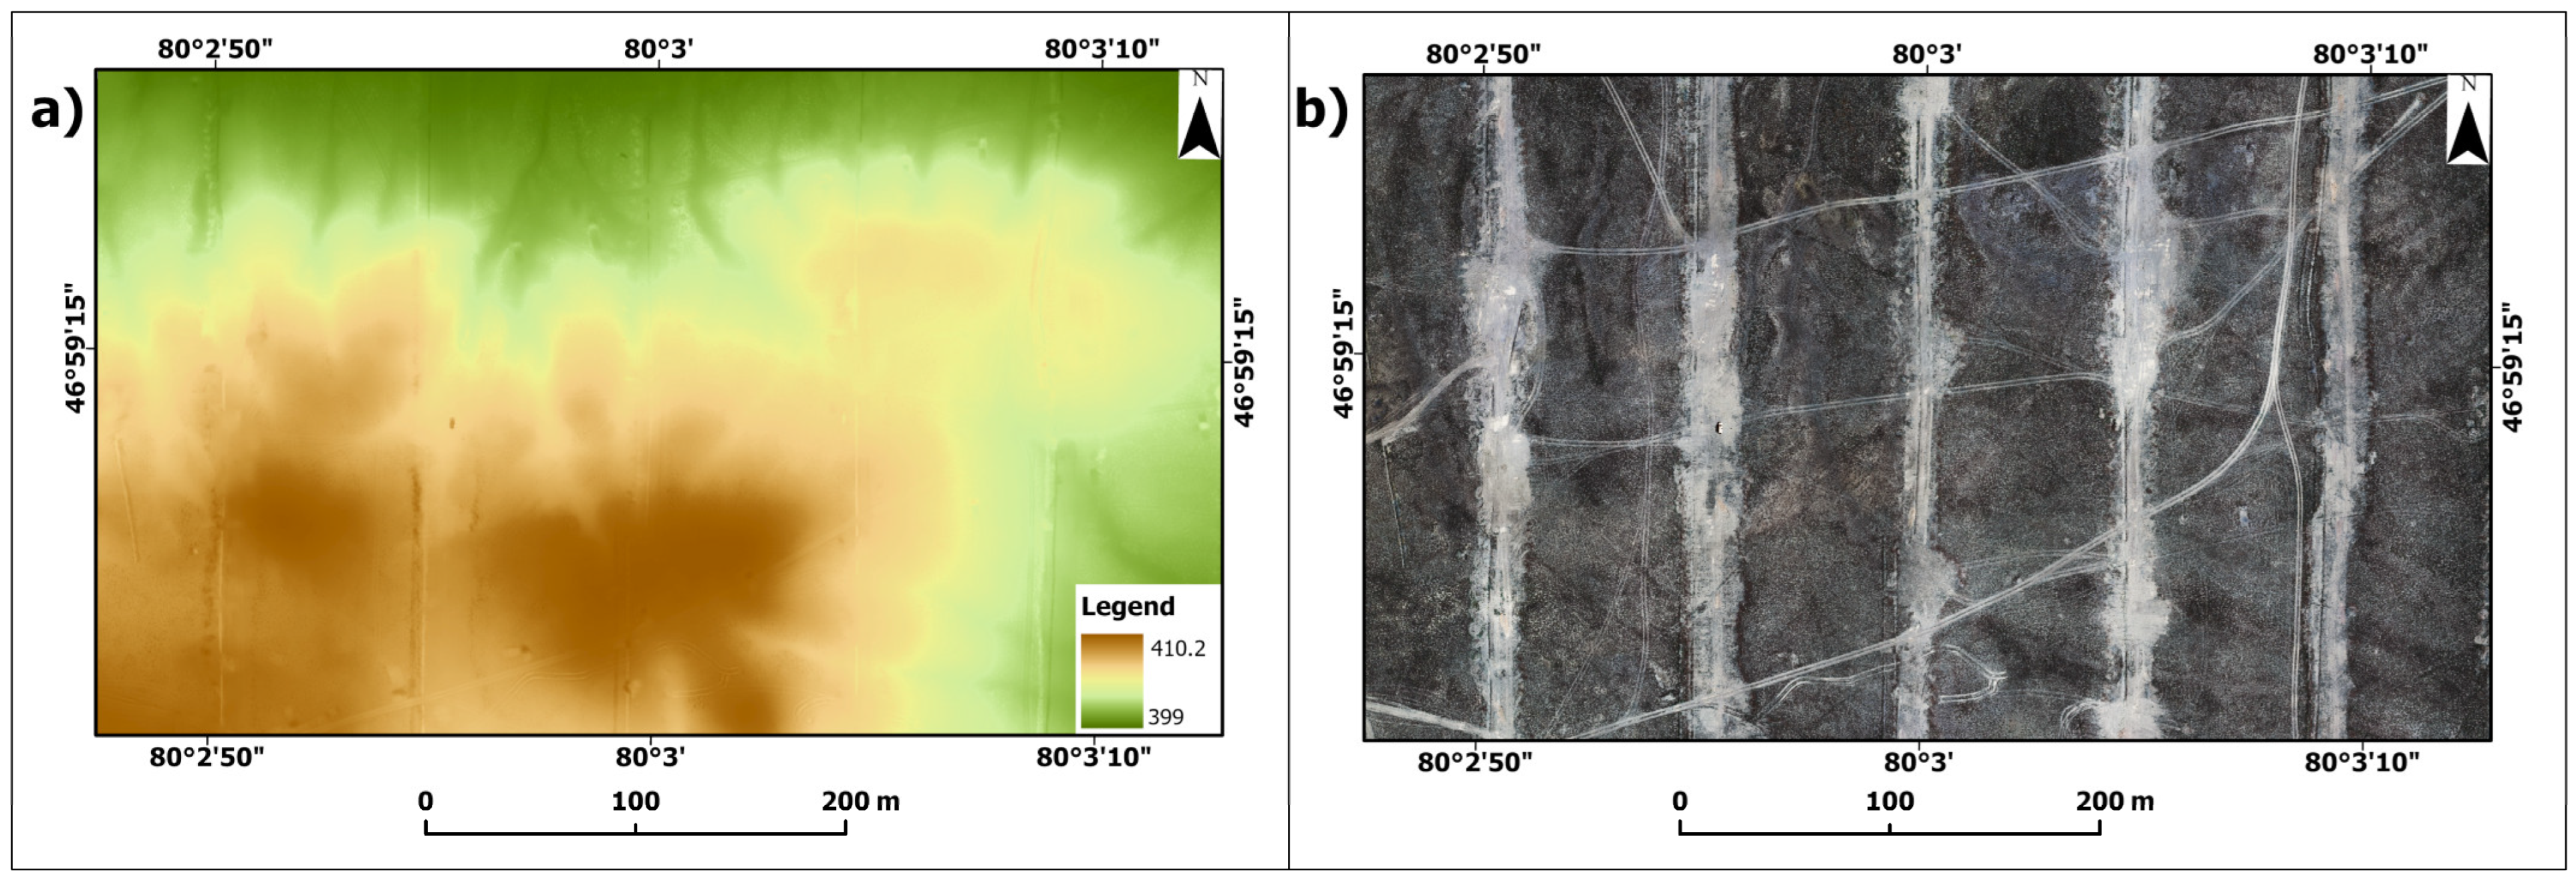
The generation of the DTM from the dense point cloud involved semi-automatic terrain classification. This process categorized points into “ground” and “other objects”, enabling the isolation of terrain features from surface objects such as vegetation and buildings. Using the classified point cloud, a DTM with a resolution of 10.7 cm/pixel and a density of 87.3 points/m2 was created (Figure 5a). The resulting DTM provides a terrain-only representation, excluding non-terrain features, such as buildings and vegetation, ensuring high accuracy and precision for further analysis and applications [57].
In the final stage of data processing, an orthophoto was generated (Figure 5b) with a spatial resolution of 5.35 cm/pixel. The orthophoto is a geometrically corrected image that integrates data from five spectral bands: blue, green, red, RedEdge, and near-infrared (NIR). These spectral channels enable detailed analysis, making the orthophoto highly valuable for applications such as vegetation classification, soil condition assessment, and mineral detection. The high resolution and spectral diversity ensure precise identification and mapping of features within the surveyed area.

3.3. Spectral Analysis of UAV Data

Spectral analysis is a fundamental method for studying the Earth’s surface through remote sensing data. It enables the examination of the reflectance properties of materials across different ranges of the electromagnetic spectrum, allowing classification based on their unique spectral signatures [2,58]. Each mineral exhibits distinct spectral characteristics, defined by specific absorption and reflection patterns at varying wavelengths [59]. These characteristics facilitate the identification of minerals, the analysis of their composition, and the development of geological maps of mineral deposits [60]. Spectral methods are particularly valuable for analyzing large areas, enabling accurate and detailed detection of changes in surface composition. The primary objectives of spectral analysis include identifying minerals by combining their unique spectral characteristics, monitoring dynamic changes in surface composition to detect hydrothermal zones or alterations in ore bodies, and producing mineral distribution maps to support exploration and deposit evaluation. In this study, special emphasis is placed on identifying iron oxide minerals, such as hematite, limonite, and goethite. The focus on these minerals is justified by several factors, including the capabilities of the equipment and the geological characteristics of the study areas, which underscore the significance of iron oxide-bearing rocks in achieving the research objectives.
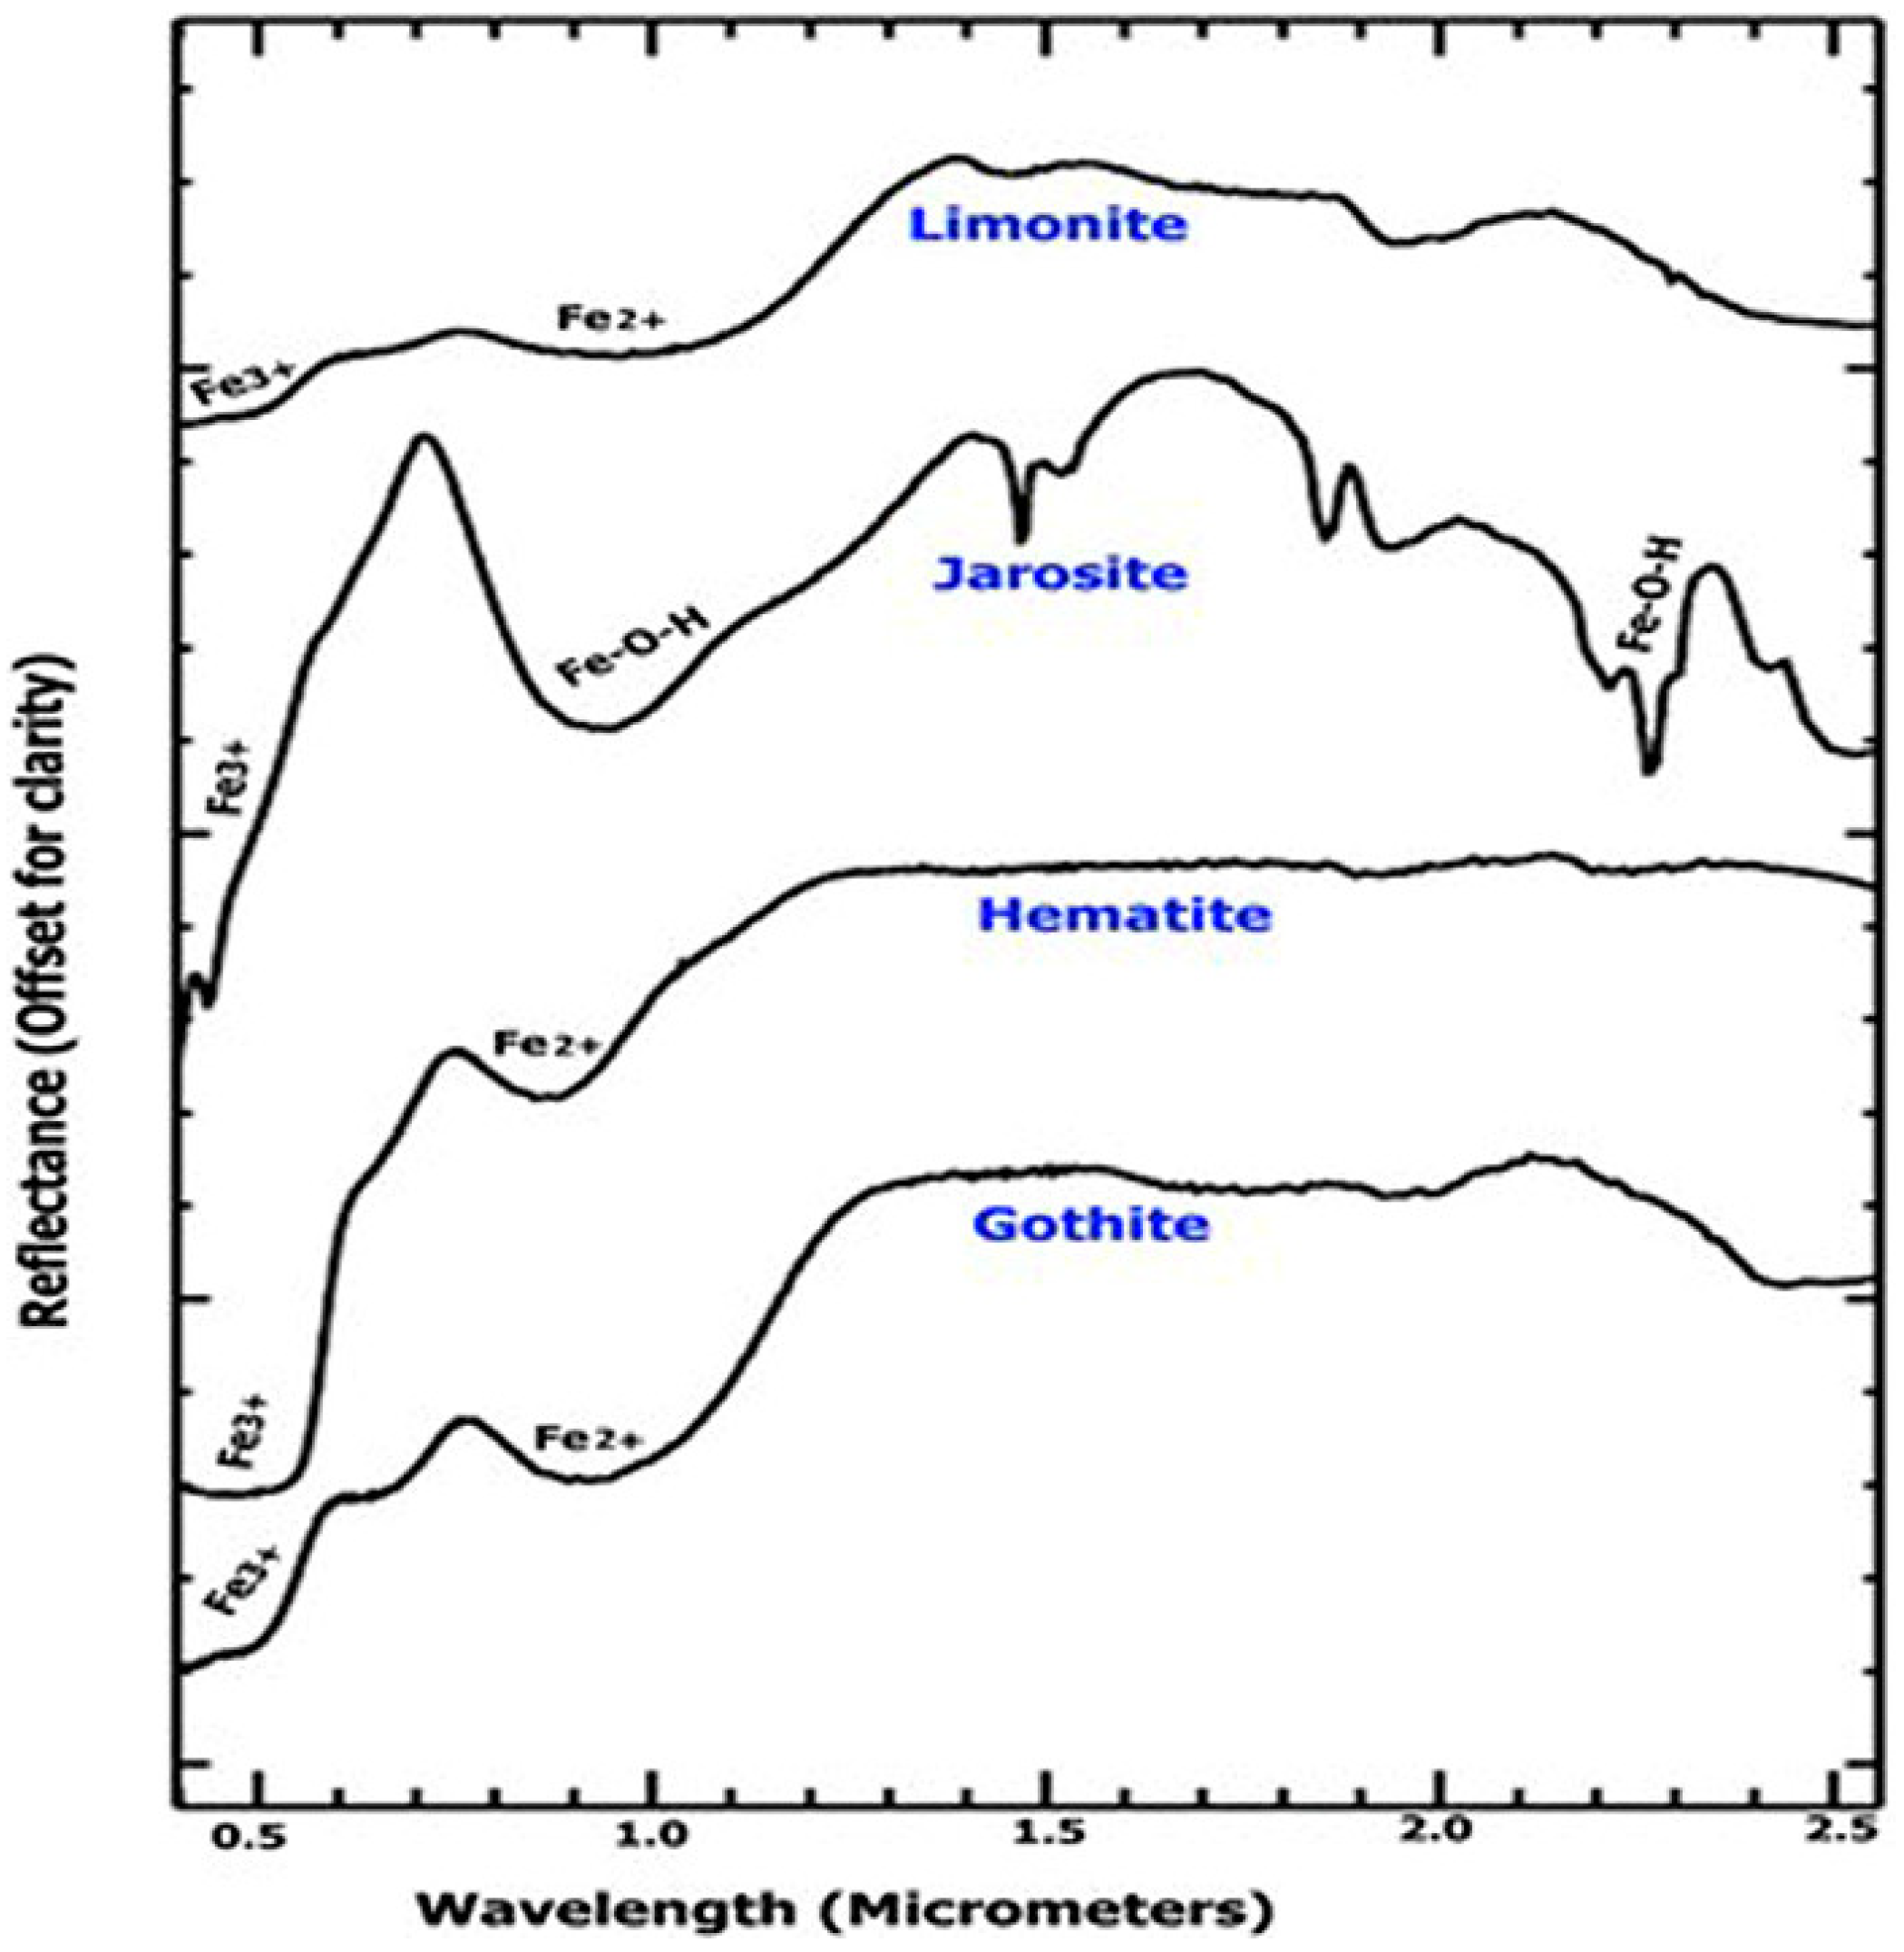
The selection of iron oxide-containing rocks was primarily driven by the suitability of UAV-mounted multispectral cameras for their detection. The camera used in this project operates within the visible to near-infrared (VNIR) range, up to 900 nanometers, making it particularly effective for analyzing iron oxides (Figure 6). These minerals exhibit distinct spectral signatures in the near-infrared region, allowing for their precise identification through multispectral imaging [61]. In addition, the spectral features of iron oxide group minerals are formed due to electronic transitions in the crystal structure of the minerals, where Fe2+ and Fe3+ play a key role in determining the spectral characteristics [62]. This capability enables accurate and efficient assessment of the spatial distribution of iron-associated minerals across the study area, providing valuable insights for geological exploration and analysis.
Porphyry copper deposits often consist of distinct sulfide and oxide zones, each with significant implications for extraction and processing [63,64]. In these deposits, processing plants are typically divided into sections specialized for treating either sulfide or oxide ores. Identifying iron oxide zones is therefore critical, as they often serve as indicators of the oxide zones within the deposit. High-resolution multispectral UAV data provides an effective solution for spatially distinguishing these zones, enhancing the precision of deposit characterization, planning, and development [65,66].
The selection of iron oxide-containing rocks is guided by the capabilities of the UAV multispectral camera, the geological characteristics of porphyry copper deposits, and the benefits of high-resolution imaging. This approach ensures high accuracy in identifying mineralized zones, enabling more effective planning for resource extraction and processing. Iron oxides exhibit distinct spectral features within the 400 to 840 nm range, making them ideal targets for UAV-based multispectral analysis. Laboratory spectra of iron oxides provided by [59] serve as a reference for identifying these minerals in the field (Figure 6). These spectra reveal characteristic absorption features in the visible and near-infrared ranges, which are essential for validating and interpreting remote sensing data. By comparing UAV-acquired spectral data with these laboratory spectra, the identification of iron oxides can be confirmed with greater precision, enhancing the reliability of mineral detection and mapping.
For identifying minerals such as iron oxides, spectral band ratio methods are particularly effective, as they enable the detection of subtle differences in spectral characteristics. Spectral band ratios involve calculating the ratio of reflectance values at specific wavelengths, which enhances the visibility of distinct surface features that may not be discernible through individual spectral bands [67]. The iron oxide minerals exhibit strong absorption in specific spectral bands, allowing them to be reliably distinguished based on their reflectance properties. The selected spectral bands are not only sensitive to chlorophyll absorption but are also optimized for detecting spectral features associated with iron-containing minerals, making them well-suited for this analysis [68,69].
Based on the analysis, two primary spectral band ratios were identified as the most effective for detecting iron oxides using UAV-acquired multispectral data. The first ratio, 650/560 nm (Red/Green), is optimized for identifying iron oxides such as hematite and goethite. These minerals exhibit characteristic spectral features, with higher reflectance in the red range and strong absorption in the green range, making this ratio effective for distinguishing areas with high concentrations of iron-containing minerals. The second ratio, 730/840 nm (RedEdge/NIR), is used to detect hydrothermal alterations and evaluate surface conditions. Iron-containing minerals often display distinctive reflectance patterns in the RedEdge and near-infrared ranges, enabling this ratio to enhance the detection of areas influenced by hydrothermal processes or surface composition changes caused by ore bodies. These spectral band ratios provide a robust framework for accurately identifying and mapping iron oxide minerals and related geological features, improving the precision of mineral exploration efforts.

3.4. Application of Fuzzy Logic

Fuzzy logic modeling is an advanced computational approach that extends traditional binary logic to handle the concept of partial truth. Unlike classical logic, where variables must be either 0 (false) or 1 (true), fuzzy logic allows variables to take on any real number value between 0 and 1 [37,70].
Our methodology is distinguished by the innovative application of a fuzzy logic approach to enhance the integration and interpretation of the acquired data. This method effectively addresses uncertainties and inherent natural variations within the dataset, resulting in more precise identification of zones with a high likelihood of iron oxide occurrence. By incorporating fuzzy logic, we significantly augmented the capabilities of the Band Ratio method, enabling a more nuanced and adaptable interpretation of the results. Consequently, the data processing yielded detailed probability maps delineating the potential distribution of iron oxide content within the study area. This approach to detecting iron oxides through multispectral data analysis utilizes a three-stage process grounded in fuzzy logic (Figure 7). In the first stage, data transformation and input datasets are converted into fuzzy values using membership functions to capture uncertainties and natural variability. This is followed by the data integration stage, where fuzzy values are synthesized using fuzzy logic rules and operators to construct a comprehensive mineralization model. Finally, in the result transformation stage, the fuzzy values are translated into specific numerical outputs, generating probability maps that highlight areas with potential iron oxide mineralization. This systematic methodology ensures accurate and reliable detection by addressing data ambiguities effectively.
The proposed technique for decoding multispectral UAV data incorporates three types of input data, each addressing a specific factor in evaluating the likelihood of iron-containing minerals. First, the NDVI (Normalized Difference Vegetation Index) was used to assess vegetation density, as dense vegetation can obscure surface minerals. Based on established literature and empirical studies, NDVI values ranging from 0 to 0.4 were classified as areas with sparse vegetation, making them suitable for further analysis, while values above 0.4 indicated densely vegetated regions that mask signs of mineralization and were excluded. This threshold aligns with prior studies that associate NDVI < 0.4 with low biomass or exposed soil conditions), thereby enhancing the reliability and reproducibility of the fuzzy logic model [71,72]. Second, two band ratios were employed to enhance detection accuracy. For each band ratio, the minimum, mean, maximum values, and deviations from the mean were calculated to establish threshold values representing the highest probability of mineral presence. Areas with values exceeding these thresholds were identified as having a high potential for iron-containing minerals. This comprehensive approach integrates vegetation metrics and spectral thresholds to ensure precise detection and analysis of mineral-rich zones.
After classifying the input data, value ranges were defined for transformation into the fuzzy logic model (Table 3). For NDVI, a range of 0 to 0.4 was used, with an NDVI of 0 assigned a weight of 1, indicating the highest likelihood of mineral detection, and an NDVI of 0.4 assigned a weight of 0.5 due to increased vegetation density. This approach allowed moderate vegetation areas to be included in the analysis, preserving potential mineral information (Table 3). For band ratios, threshold values were calculated based on minimum, maximum, mean, and deviation values, forming a critical input for the fuzzy logic model [73].
T; = μ + σ
where
-
T is the threshold value,
-
μ is the average value,
-
σ is the standard deviation.
The assignment of weights was determined using a triangular membership function, which is widely used in fuzzy logic due to its simplicity and computational efficiency. This function maps input values to degrees of membership within the range of [0, 1], with linear increases and decreases between defined thresholds. This approach accounted not only for the presence of minerals but also for the probability of their occurrence, enabling a more detailed and probabilistic assessment (Table 3).
Table 3. Transformation of input data.
Input DataThreshold ValueRange of DeterminationMembership Functions
NDVI0.4[0.4, 0][0.5, 1]
Band Ratio No. 11.073[1.073, 2.006][0.5, 1]
Band Ratio No. 11.136[1.136, 2.202][0.5, 1]
The membership functions (μA(x)) for each index quantify the degree of membership within a specific probability category (low, medium, or high) based on the established threshold values [74]. These functions were applied to interpolate the data values using the formula provided below.
μ A x = 0 , 0.5 1 , + 0.5 · x T 1 T m a x T 1 , i f   x T 1 i f   T 1 < x < T m a x i f   x T m a x
where
-
T1 is the threshold value,
-
Tmax is the maximum value of the index.
This function specifies that when the index value is below the threshold T1, the probability of belonging to the iron-containing mineral class is zero. For values exceeding T1, the probability is gradually interpolated between 0.5 and 1, reflecting an increasing likelihood of mineral presence.
The next stage of the methodology involves integrating all input data, converted into fuzzy values, to construct a comprehensive model for evaluating the probability of mineralization. This stage focuses on combining vegetation data (NDVI) with mineralogical indices using fuzzy logic operators and rules to achieve an accurate assessment. In the fuzzy logic framework, the “and” conjunction operator was applied, ensuring that all input conditions must indicate a high probability to yield a positive result. The fuzzy logic rules define the criteria for data integration, enabling a systematic evaluation of the likelihood of mineral presence. The operator is expressed mathematically as follows:
μ A B x = m i n ( μ A x , μ B x )
where
-
μA(x) and μB(x) are the membership functions for two input datasets,
-
μA ∩ B(x) is the result of applying the “and” operator.
This method is particularly crucial for assessing the probability of mineralization, as a high likelihood necessitates elevated values for both the vegetation index (NDVI) and the two mineralogical indices. If any indicator falls below the threshold, the overall probability is diminished, effectively reducing the risk of false positives while ensuring that all essential conditions are considered.
After selecting the appropriate fuzzy logic operator, conditions were defined to align with the data characteristics and research objectives. These conditions were implemented as a series of “if-then” rules applied to each data point on the map. Designed to incorporate both vegetation (NDVI) and mineralogical indices, the rules leverage the “and” operator to integrate the data effectively. This approach ensures a more precise evaluation of mineralization probability by enforcing stringent criteria for each parameter, thereby minimizing errors. The detailed fuzzy logic rules are summarized in Table 4.
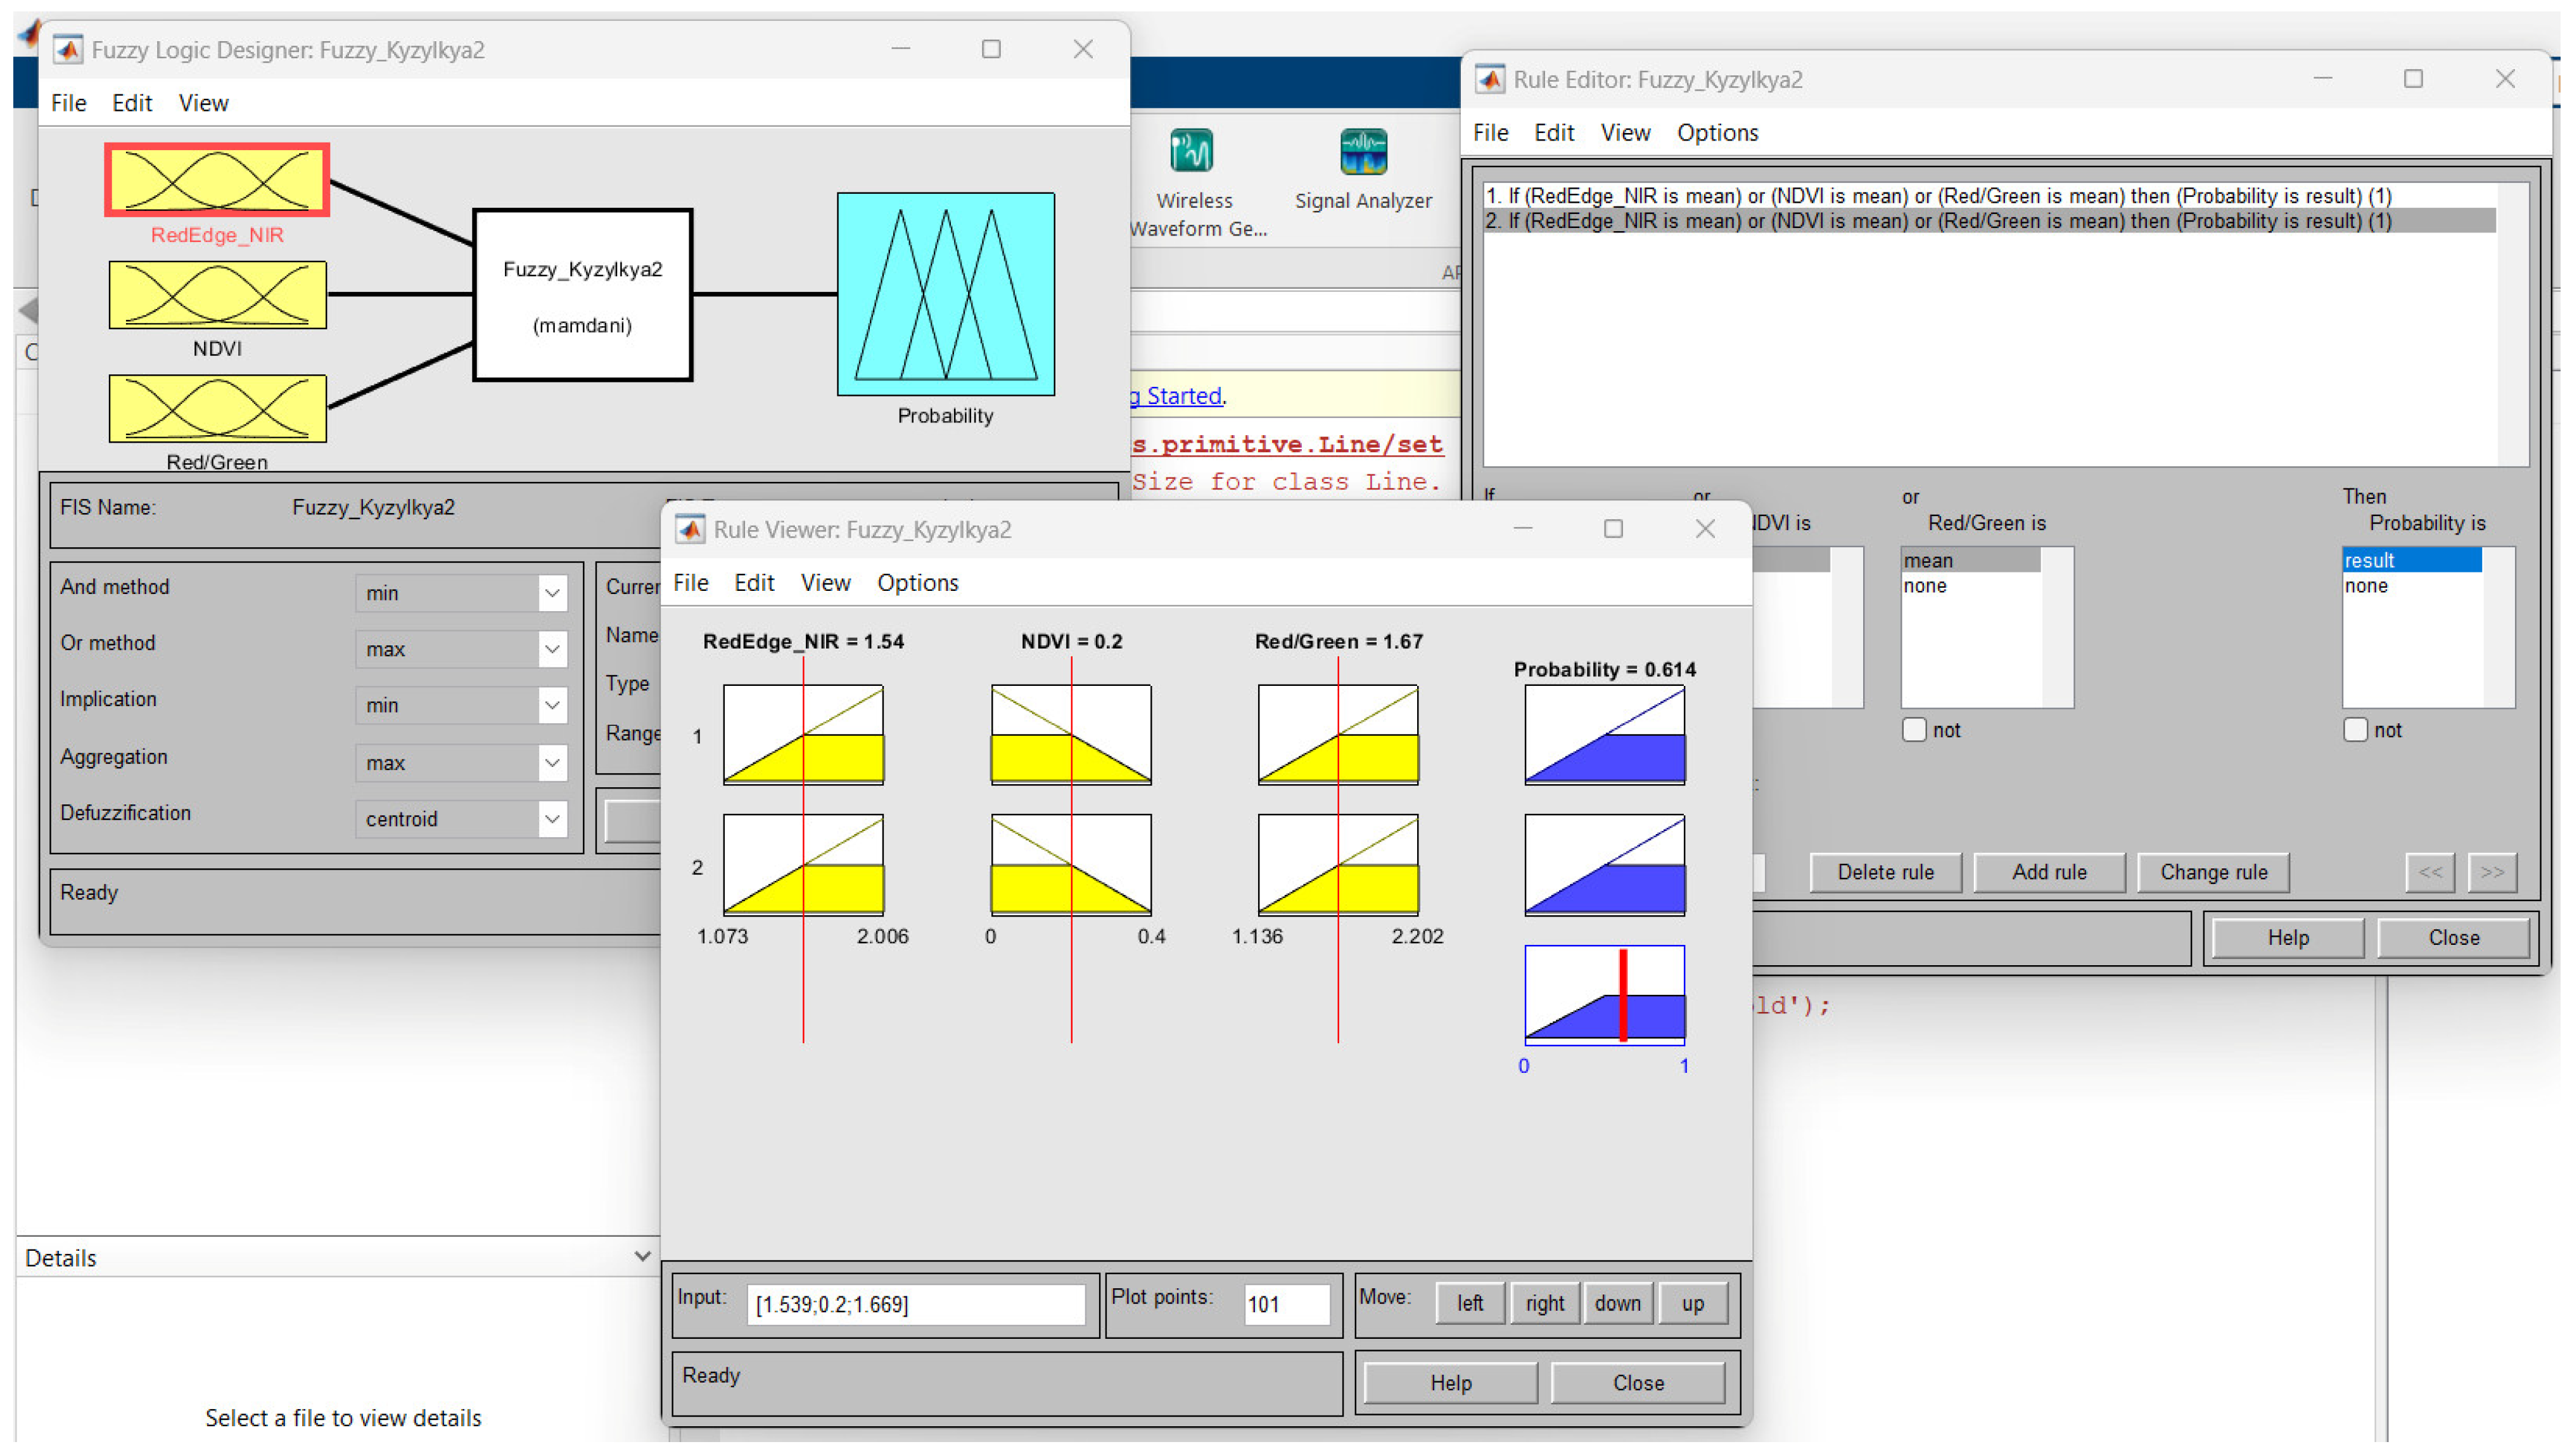
Following the definition of input data, operators, and key rules, a fuzzy logic model was developed using the MATLAB R2024 based fuzzy logic toolbox (Figure 8).
The final stage of the methodology involves converting the fuzzy values generated during the logical integration process into specific numerical outputs. This transformation is crucial for converting the intermediate results, represented as fuzzy membership functions, into precise probability values for each pixel in the study area. These values enable the generation of probability maps of mineralization, which are both intuitive and practical for further analysis. To achieve this, the center of gravity method was employed. This approach weights all possible values of the fuzzy function and computes their weighted average, providing the definitive probability for each pixel. By considering all potential probability values and their relative significance, this method ensures an accurate and adaptable output. It calculates the weighted average across the entire range of outcomes from the fuzzy function:
Z = z · μ z d z μ z d z
where
-
Z is the crisp value (in our case, the probability of mineralization),
-
μ(z) is the membership function describing the degree of probability for each value of z,
-
the numerator is the integral of the weighted fuzzy values,
-
the denominator is the integral of the membership function.

4. Results and Data Analysis

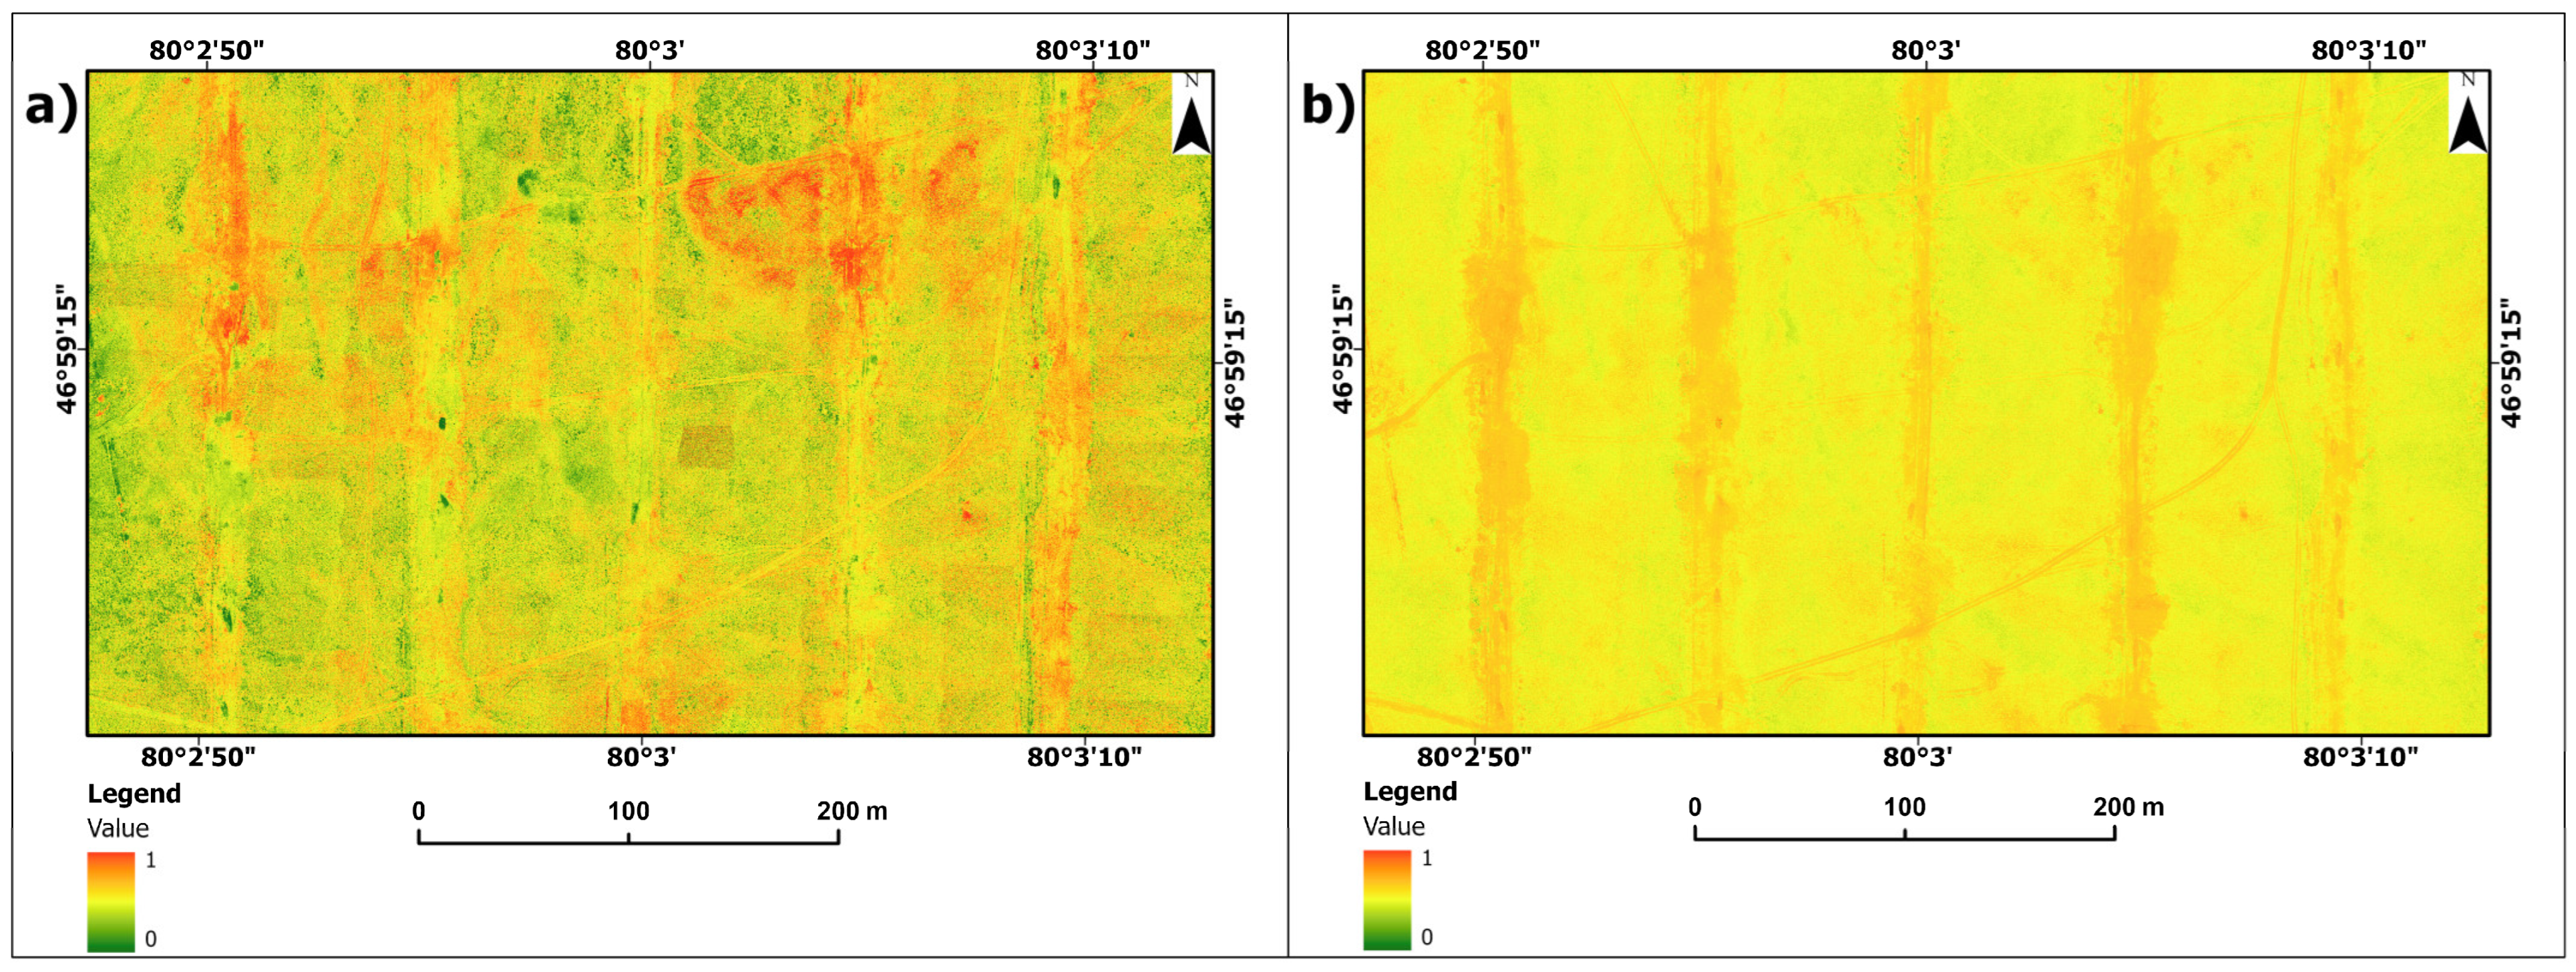
The variables selected as inputs for the fuzzy logic model included the NDVI and two specific band ratios designed to detect the presence of iron oxides. These parameters were selected due to their proven effectiveness in highlighting geological features associated with mineralization. Analysis of band ratio results derived from UAV-based multispectral data revealed that elevated values of these indices are strongly indicative of the presence of iron oxide, which is often associated with hydrothermal alteration zones (Figure 9a,b). These zones are of great interest in mineral exploration as they can indicate the potential for valuable ore deposits.
By incorporating fuzzy logic to seamlessly integrate spectral indices and vegetation data, this method provides a comprehensive and systematic framework for mineral mapping. It is particularly valuable in areas with challenging geological and environmental conditions where conventional techniques may be less effective. The results confirm the potential of this method to improve mineral exploration by producing accurate, reliable and interpretable probability maps that can guide further exploration activities with greater confidence.
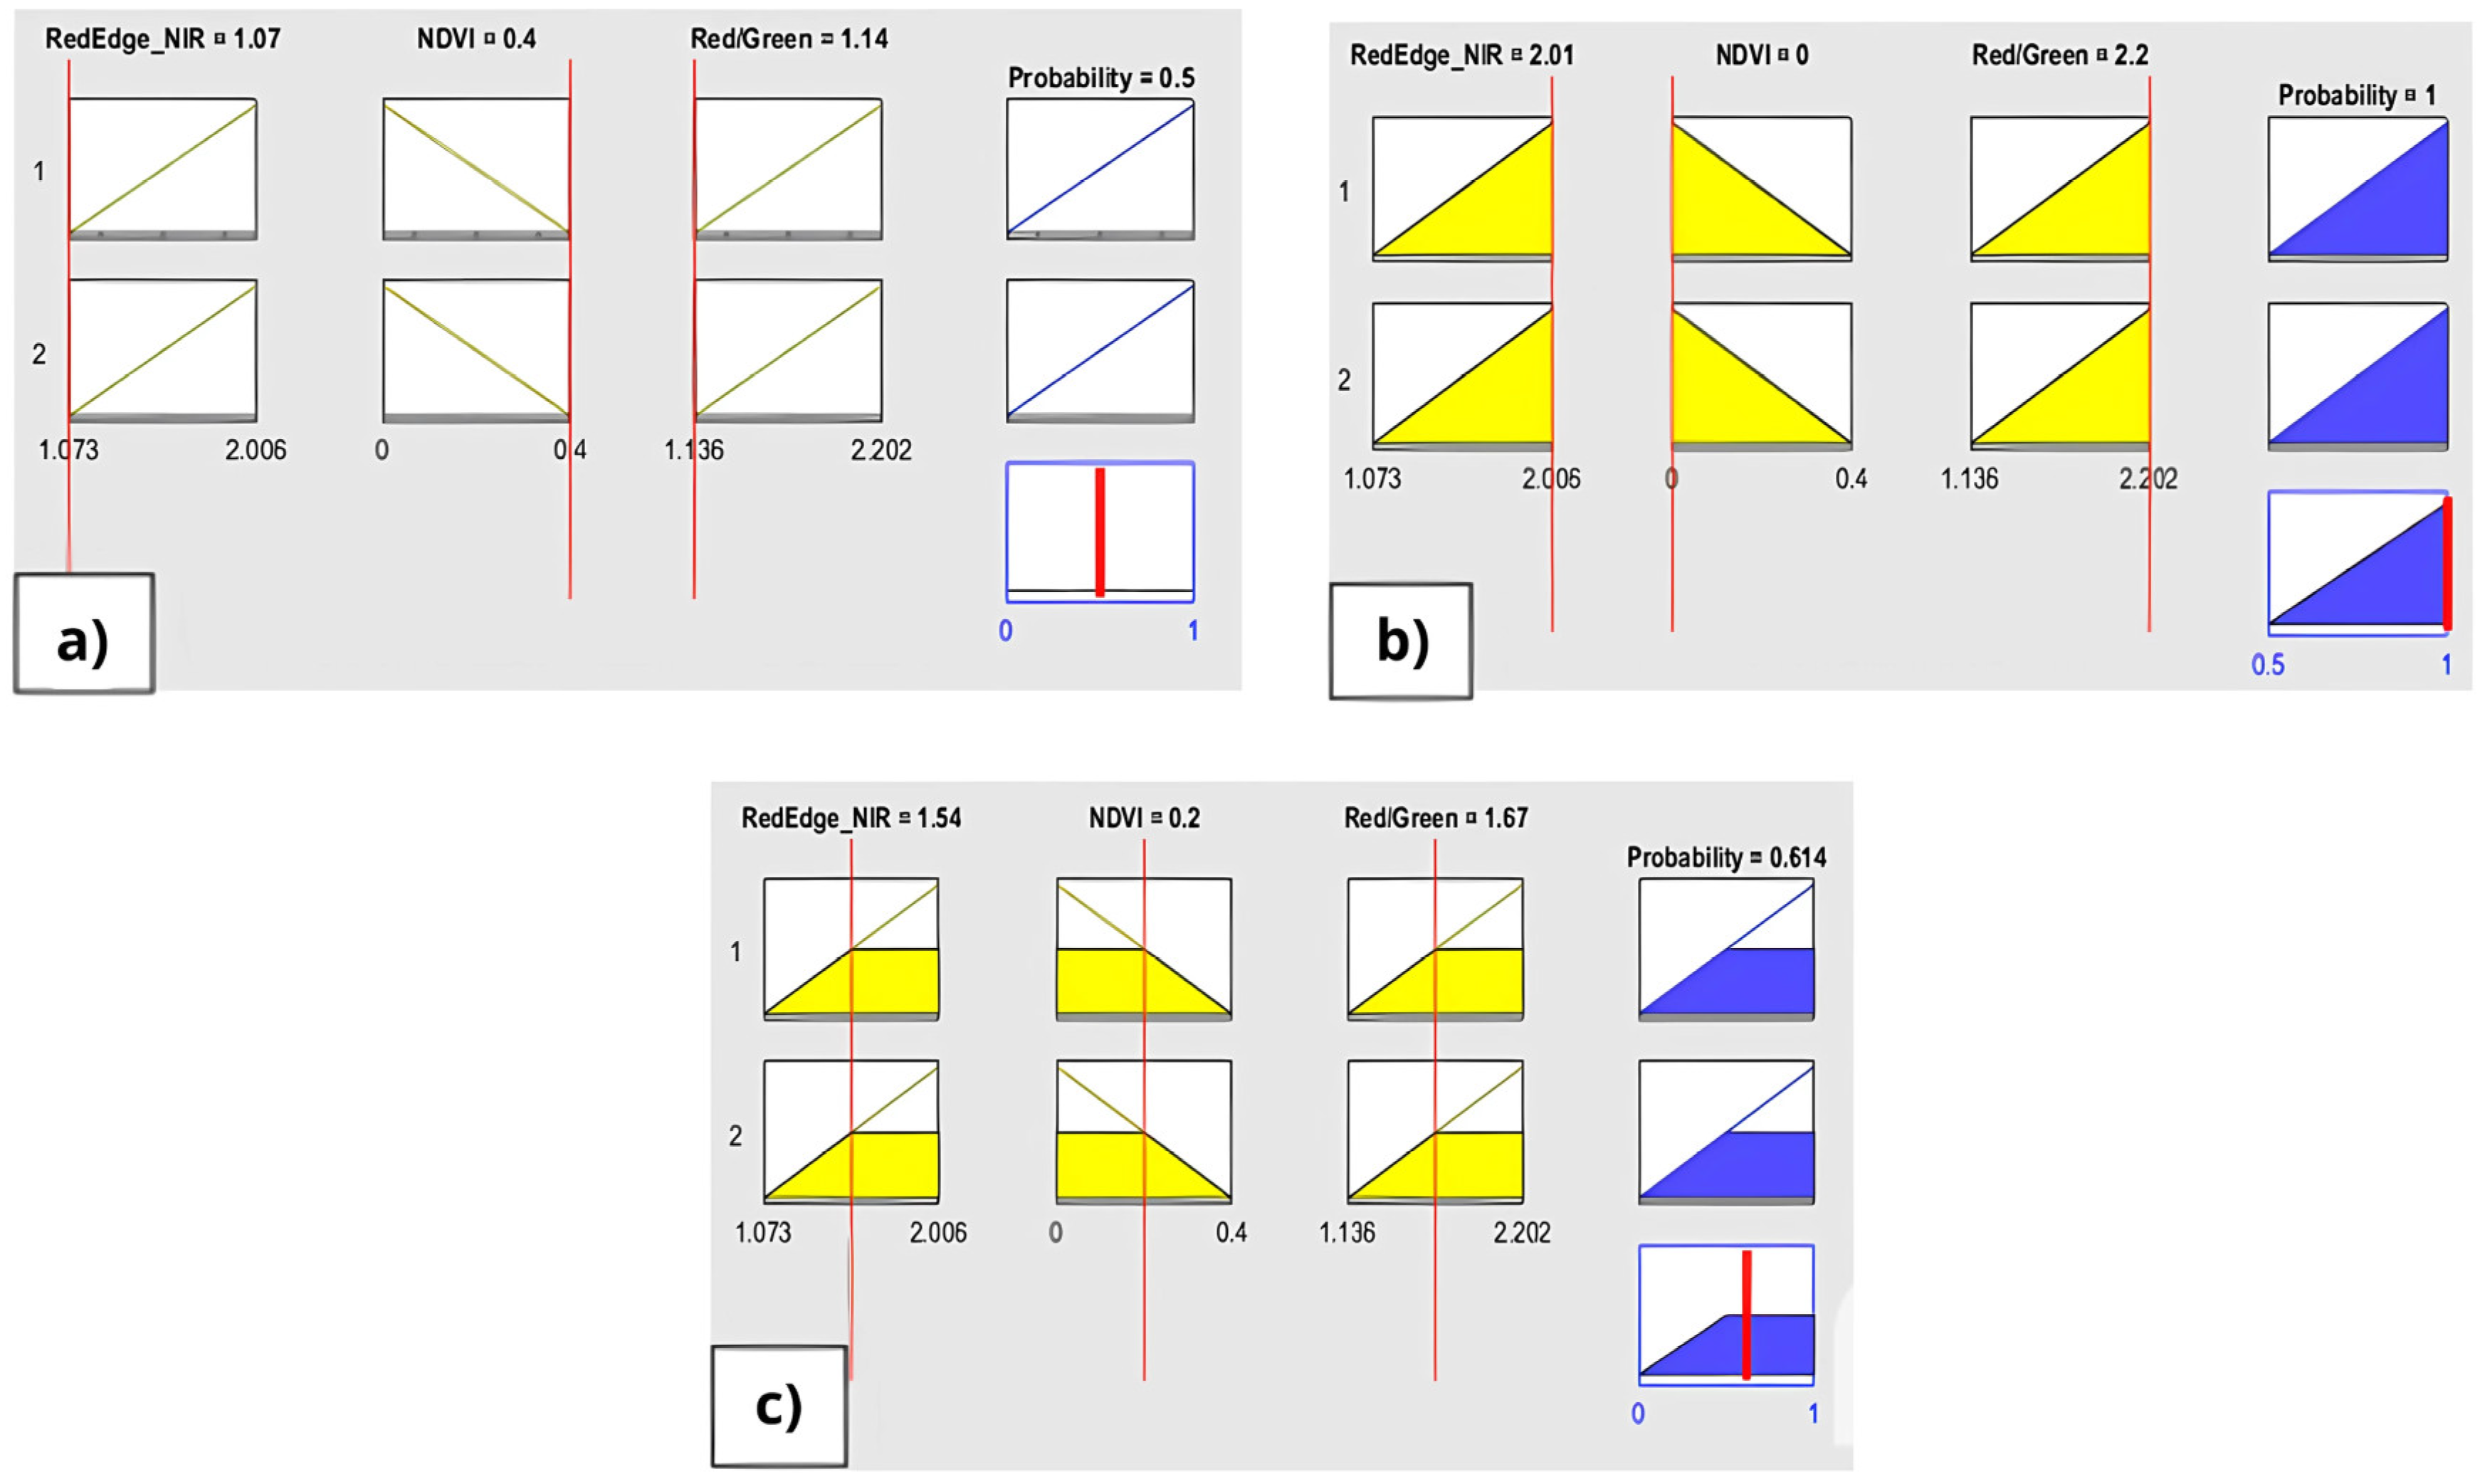
Once the weights and conditions for the input variables were assigned, the fuzzy logic model was executed, verified, and tested within the MATLAB ver. R2024 environment. This step was essential to ensure the accuracy and validity of the model settings. The verification process involved analyzing how each input parameter influenced the final mineralization probability, taking into account the established parameters and fuzzy logic rules. The results are presented in Figure 10. This graph, developed in MATLAB ver. R2024, provides a visual representation of the three input variables—NDVI, Red/Green Band Ratio, and RedEdge/NIR Band Ratio—and their respective impacts on the probability of mineralization. Each input variable is represented by triangular membership functions, which depict the progression of probabilities as the input values shift from their minimum to maximum. These triangular functions demonstrate how probability increases with input values, allowing a clear assessment of the range where the membership function begins to rise and reaches its peak. The graph also directly indicates the range of input values where the probability of mineral presence is highest.
The axes of the graph display the probability scale for each input variable along with the corresponding range of data values, enabling a comprehensive understanding of the relationship between inputs and mineralization likelihood. The verification process included:
Evaluating the model’s response to variations in input data, including minimum, average, and maximum values.
Assessing the relative influence of each input variable on the final mineralization probability.
Visualizing the results for each parameter to confirm the proper functioning of the fuzzy logic rules and operators.
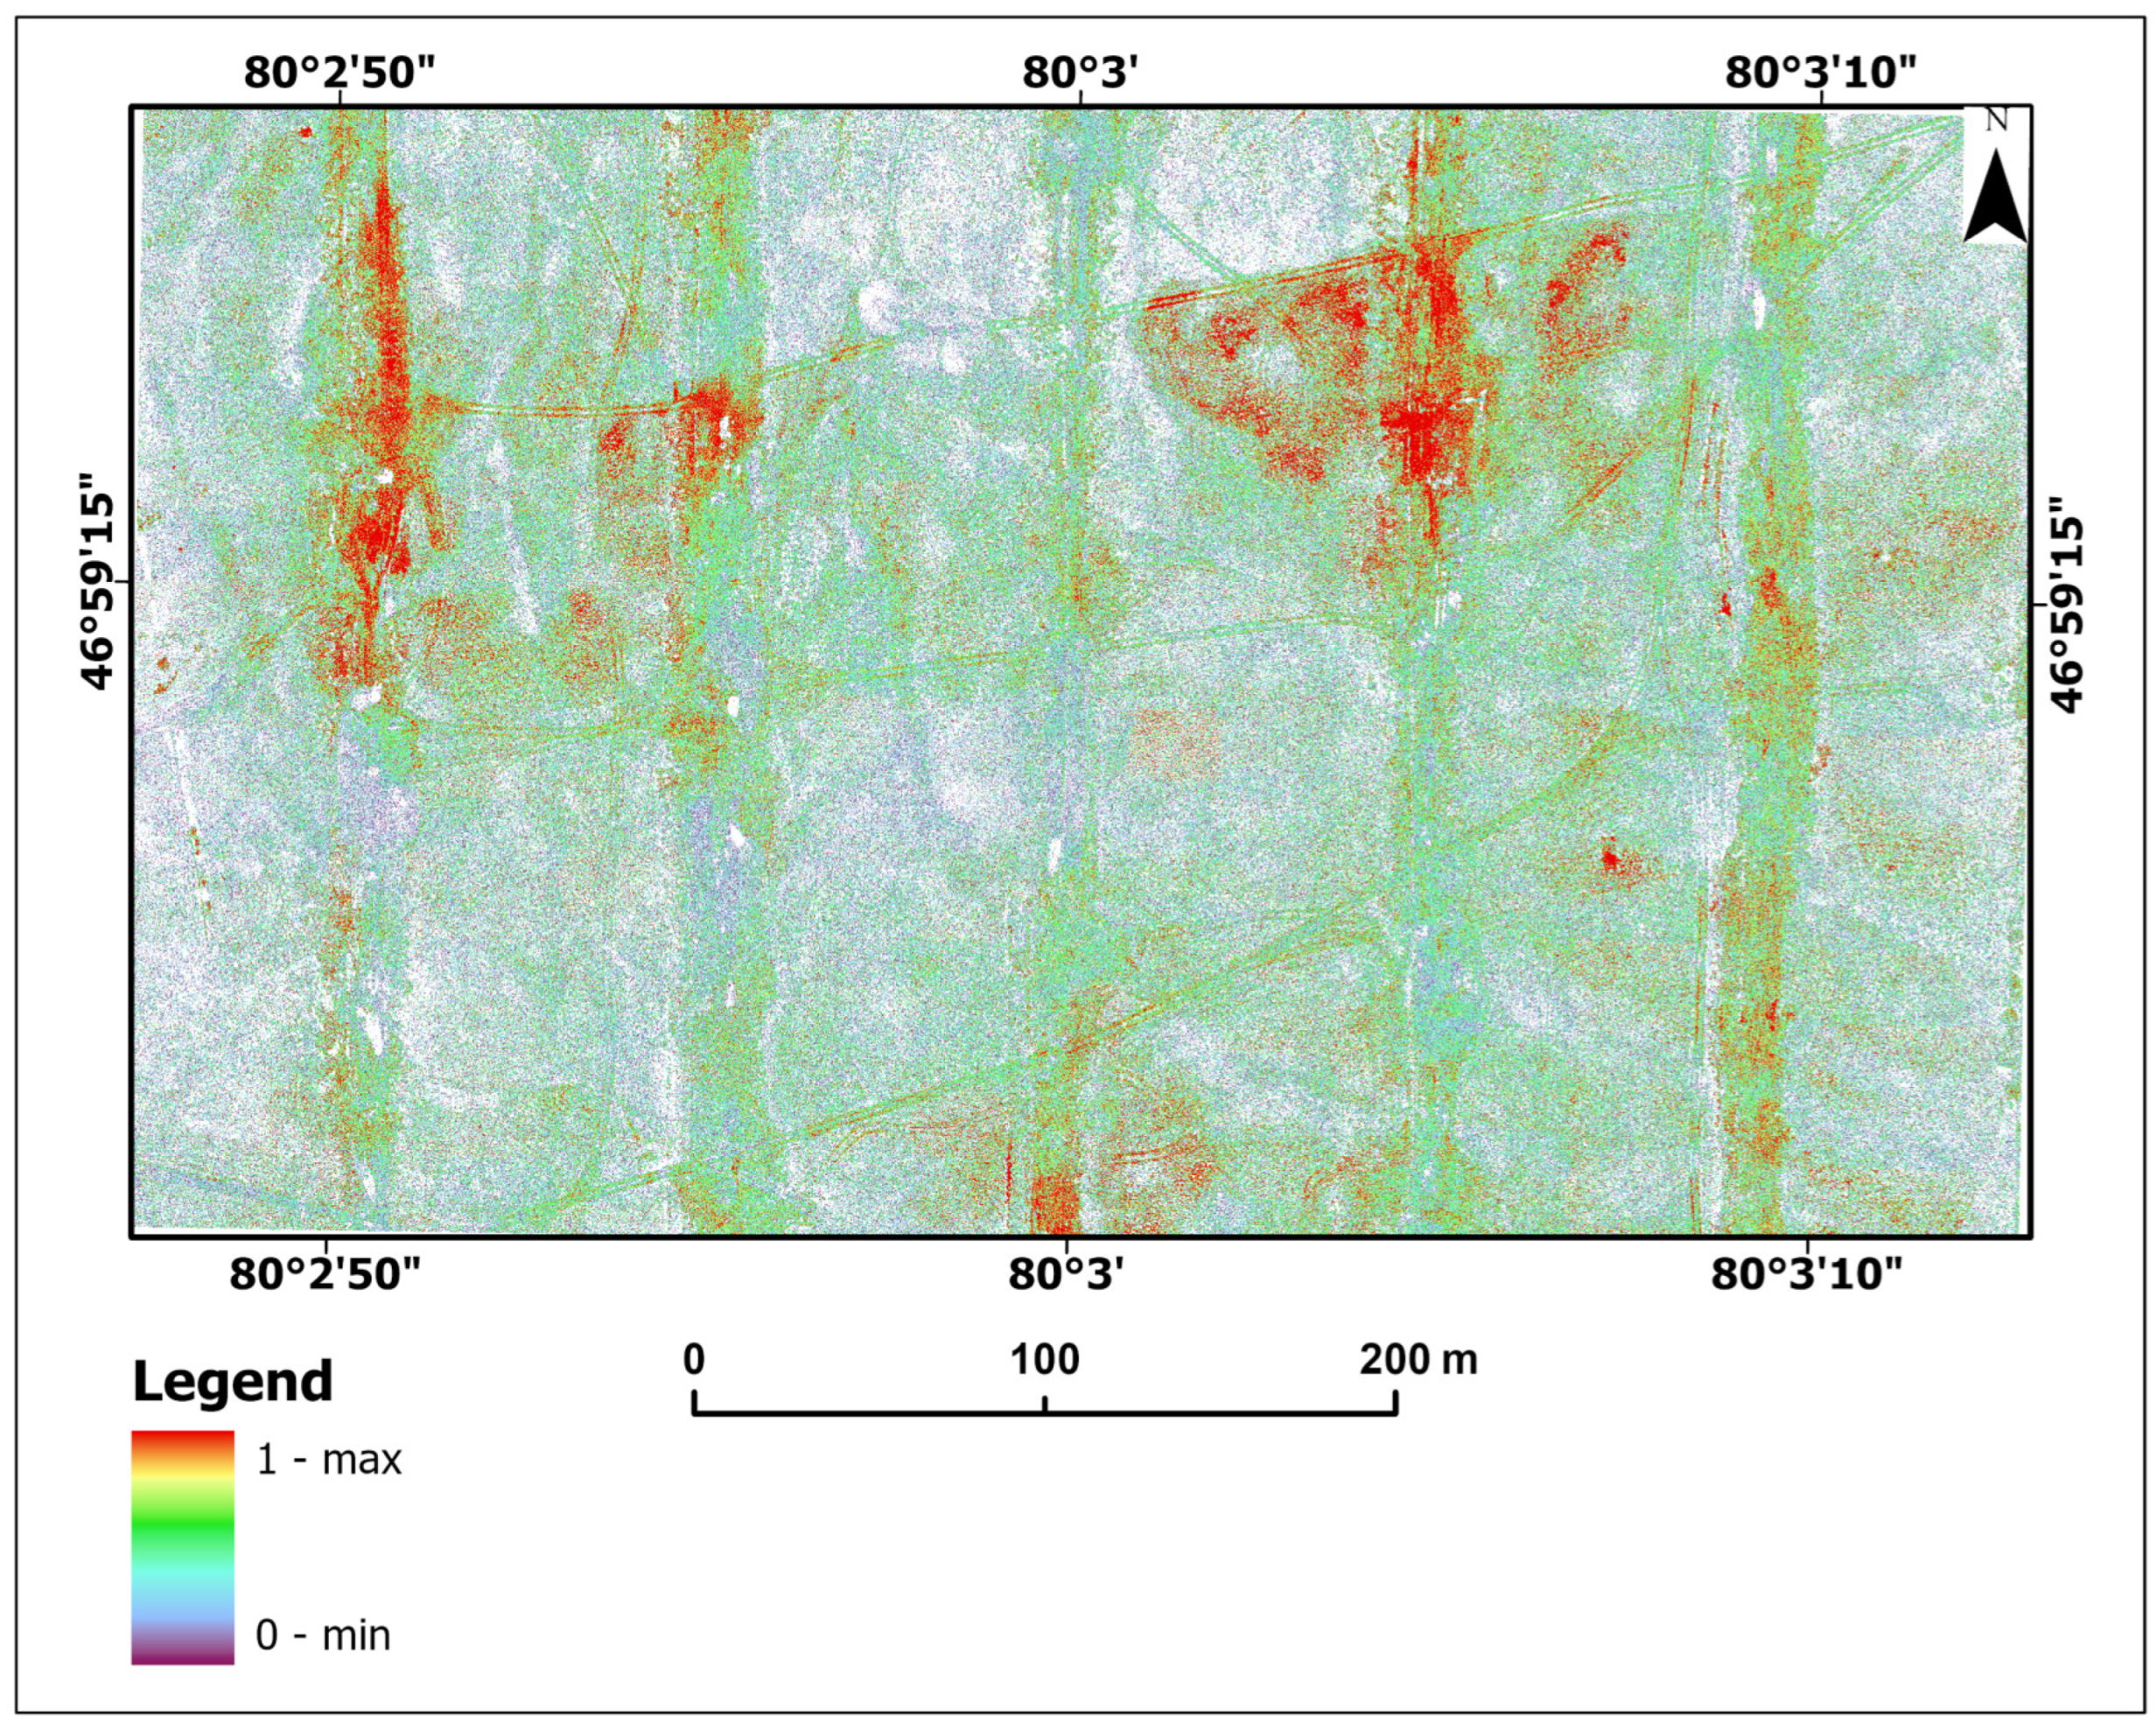
Once this phase was completed, each calculated probability value for individual surface pixels was converted into a specific numerical output. This conversion resulted in a detailed probability map (Figure 11), where each pixel is assigned a numerical value corresponding to the probability of the presence of iron oxide minerals. This map serves as an important tool for visualizing and quantifying the spatial distribution of the probability of mineralization throughout the study area. As shown in Figure 11, the anomalies indicative of iron oxide mineralization is predominantly concentrated in the northeastern and northwestern regions of the study area, suggesting that these areas are key zones for further exploration.
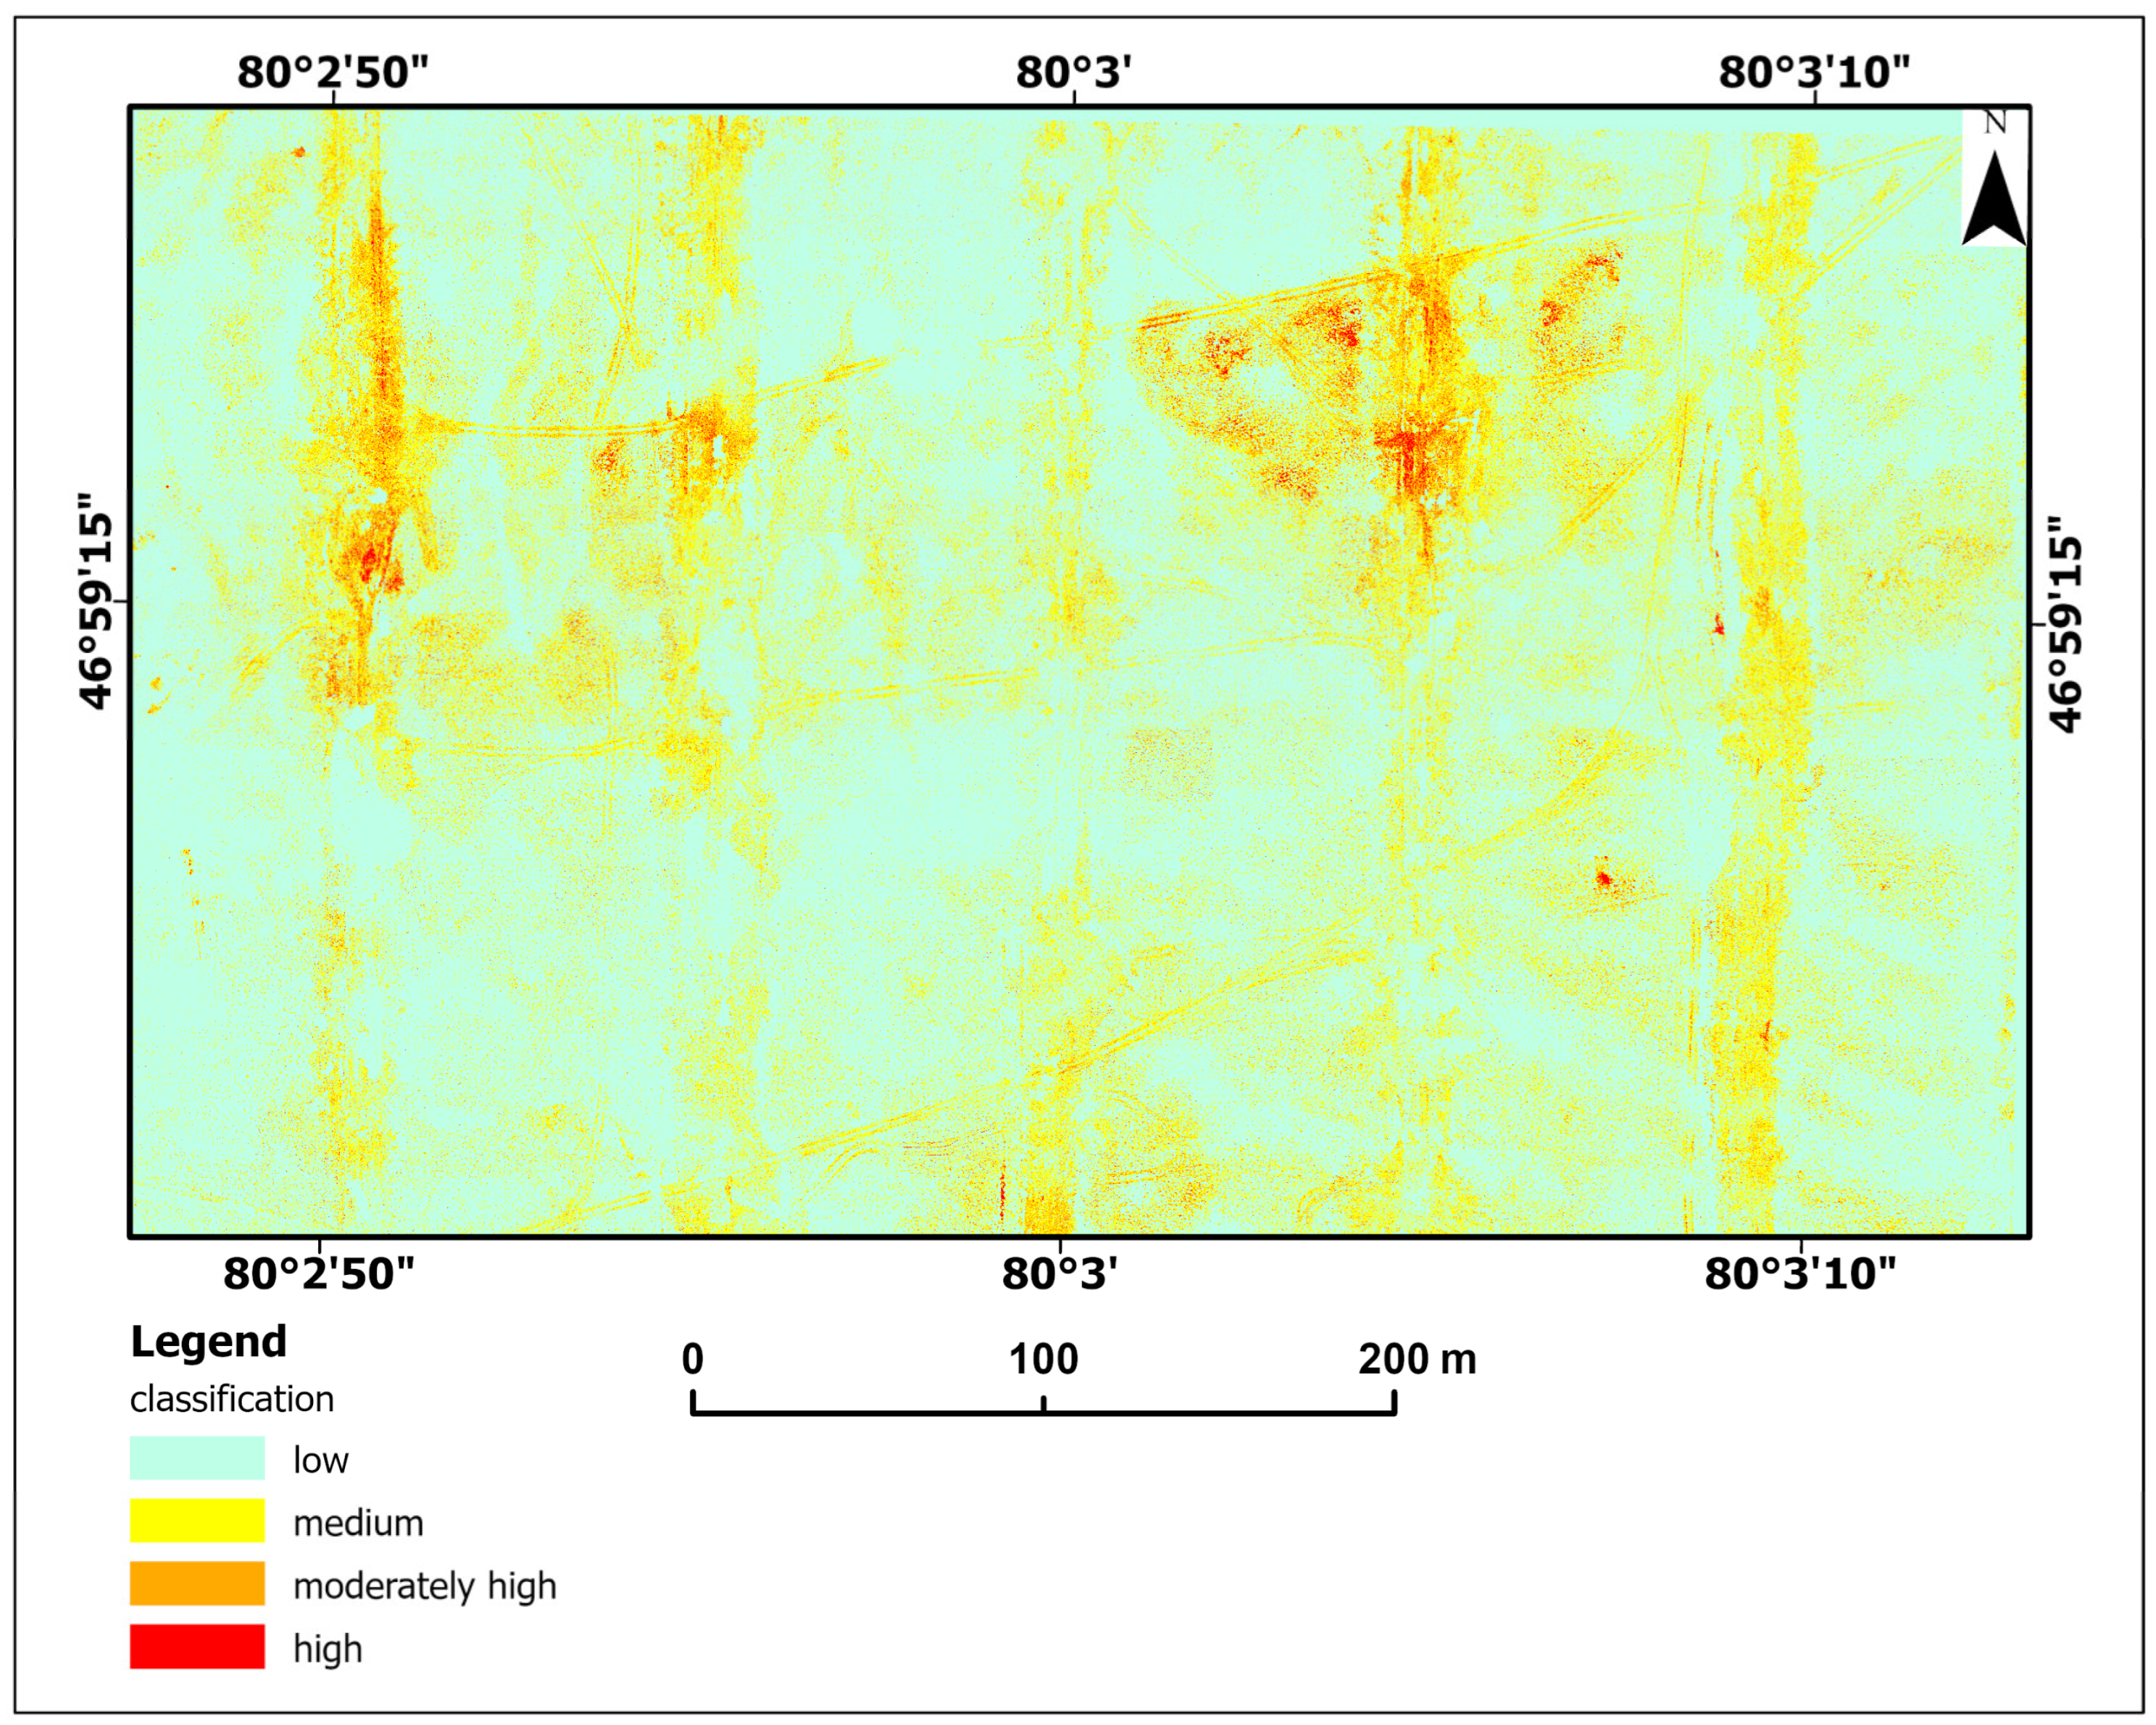
To improve the interpretability and usability of the results, the probability map was reclassified into four distinct categories: low, medium, moderately high, and high probability classes (Figure 12). This classification enables clearer visualization and targeted evaluation of regions with different mineralization probabilities.
A detailed analysis of the fuzzy logic results show that the northeastern and northwestern parts have the highest probabilities for the presence of iron oxide. Zones with moderately high and medium probabilities are mainly located in the southeastern region and in the areas surrounding the high probability zones, reflecting transitional regions with significant but somewhat lower potential. These spatial patterns, highlighted in Figure 12, are consistent with geological trends and are summarized quantitatively in Table 5.

5. Discussion

The main objective of this study was to apply multispectral data acquired by UAVs in combination with fuzzy logic to detect the spatial distribution of iron oxides associated with copper porphyry deposits in the Kyzylkiya area around the Aktogay copper deposit in East Kazakhstan. The results obtained demonstrate the effectiveness of this method and represent the first application of such an approach in this region. This study highlights the potential of UAV-based remote sensing and the integration of fuzzy logic for mineral exploration in complex geological environments. The accuracy and reliability of mineral exploration with multispectral and hyperspectral data is highly dependent on image resolution, especially spatial and spectral resolution. The ability to detect mineral distributions, especially at finer scales, is often constrained by the spatial resolution of the images, which is a major challenge in geological remote sensing. Despite this limitation, researchers have successfully addressed this problem by using advanced statistical and computational models, with fuzzy logic being particularly effective. These models enable the integration of different datasets, compensate for resolution limitations and improve the detection of mineral anomalies.
This study contributes to the advancement of these methods and emphasizes the importance of high-resolution UAV imagery and robust analytical techniques for modern mineral exploration [6,35,36,37,38]. In studies using multispectral or hyperspectral data, spatial resolution poses a major challenge for the accurate identification and highlighting of specific minerals. To address this limitation, this study combined multispectral UAV data with an exceptional spatial resolution of 5.29 cm with a fuzzy logic model to delineate the spatial distribution of iron oxide. The results of this approach proved to be highly effective and showed a strong correlation with the geological features of the study area (see Figure 11 and Figure 12). While the fuzzy logic model effectively integrates expert knowledge and handles uncertainty in geoscientific datasets, its performance and interpretability can be further contextualized by comparison with data-driven machine learning approaches. For instance, Support Vector Machines (SVM) and Random Forest (RF) have demonstrated strong classification capabilities in mineral prospectivity mapping, particularly when sufficient training data are available [75,76]. In addition, fuzzy logic offers a transparent, rule-based framework that is particularly advantageous when expert knowledge is available but training data are sparse or heterogeneous. Thus, while machine learning models may offer higher predictive power under ideal conditions, fuzzy logic remains a valuable tool for integrating qualitative geological insights and managing epistemic uncertainty.
The accuracy and reliability of remote sensing studies, especially in mineral exploration, depends on rigorous validation processes in which the data is checked in the field. Such validation ensures the robustness of the methodology and strengthens confidence in the interpretability of the results. The integration of high-resolution UAV imagery with fuzzy logic in this study illustrates the potential of advanced remote sensing techniques for overcoming spatial resolution challenges and improving mineral exploration results [73]. In this study, verifications and accuracy assessments were conducted using multiple data sources, including airborne data such as ASTER, high-resolution aerial imagery such as WorldView-3 multispectral data, and fieldwork samples from the discovered iron oxide zones. These combined approaches ensured the reliability of the results and provided a comprehensive validation of the methodology.
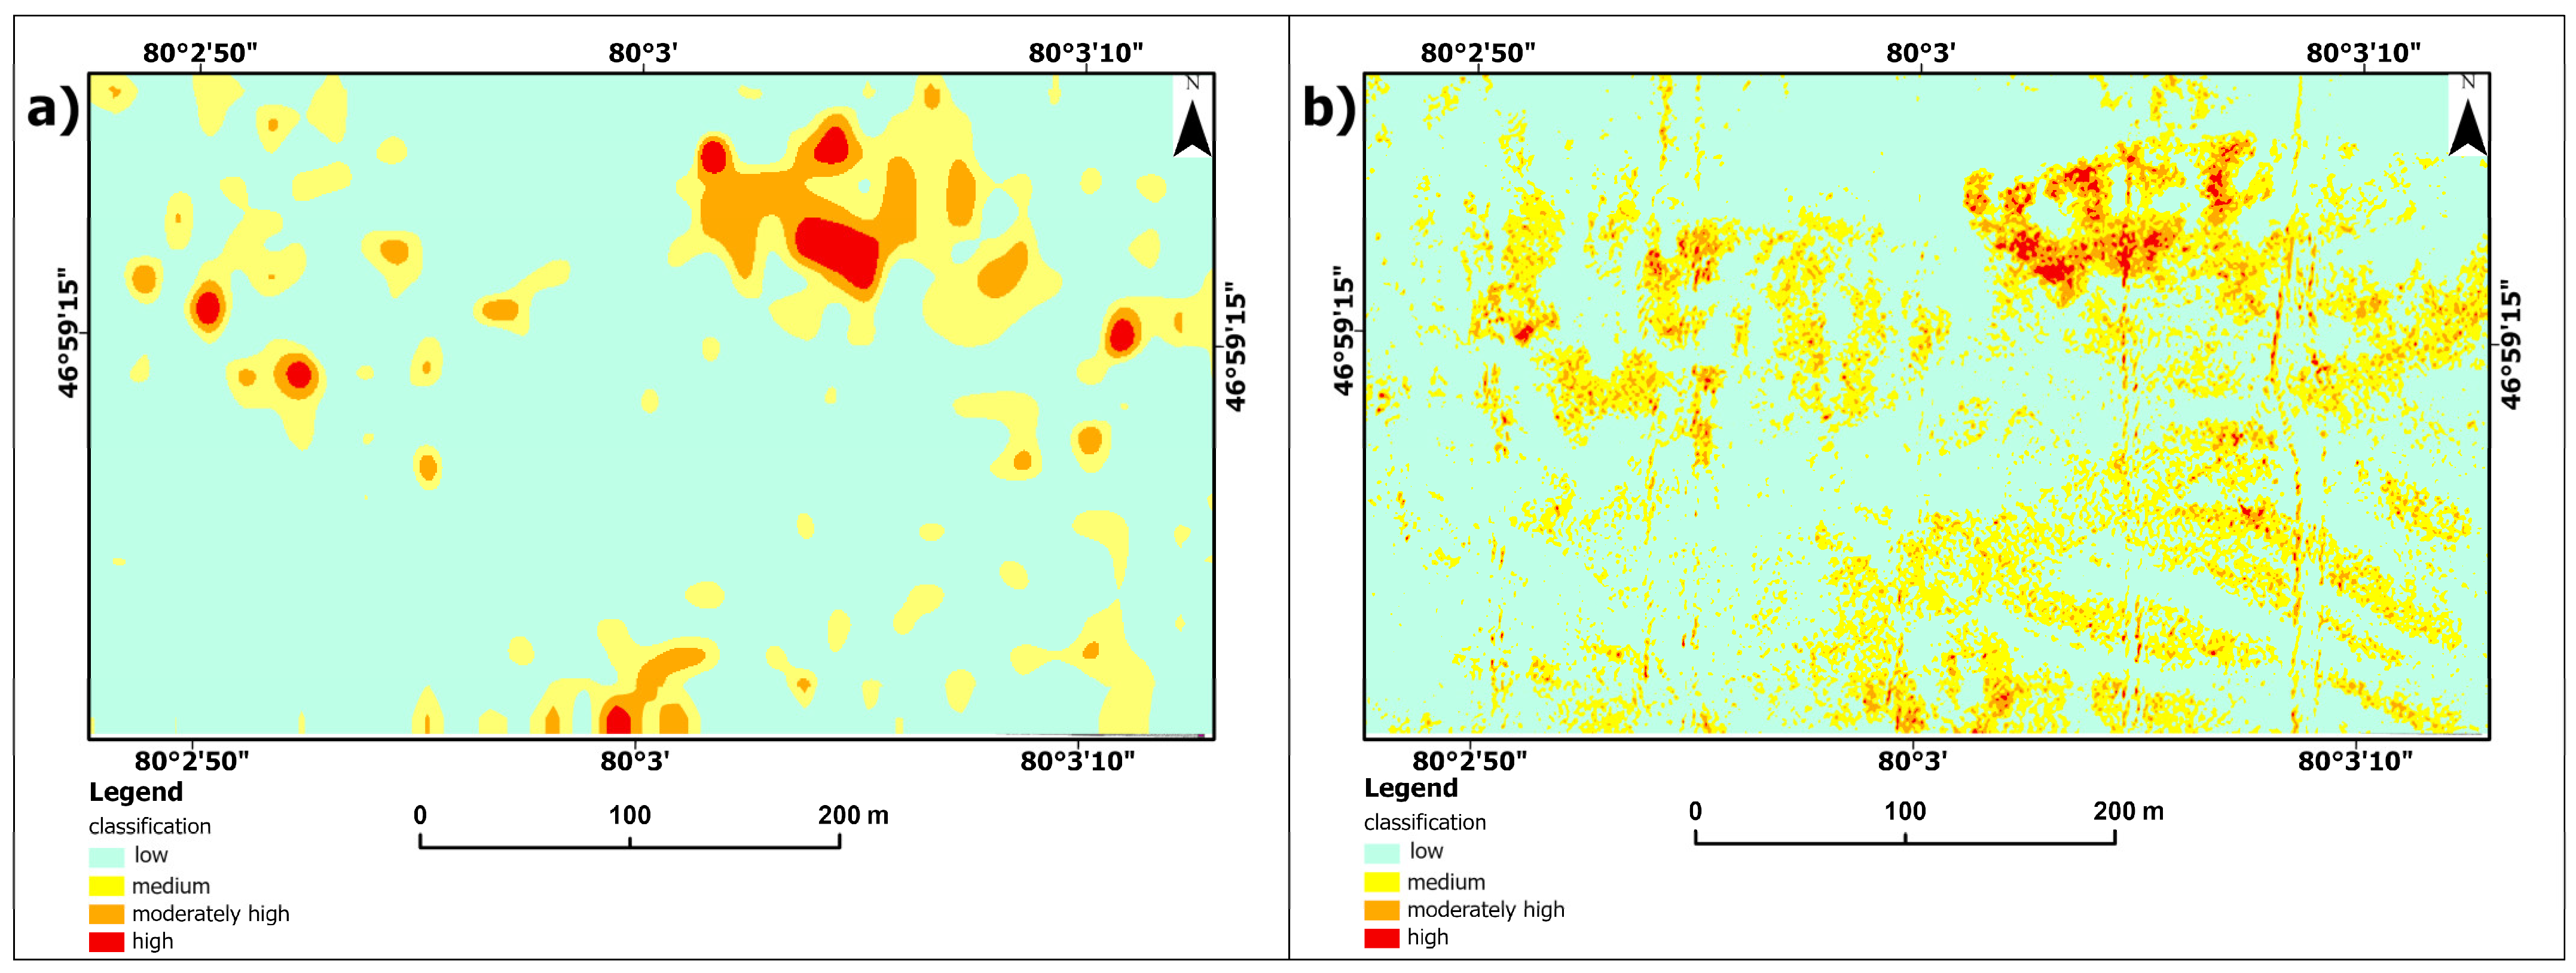
Iron oxide mineral detection maps derived from ASTER (15 m spatial resolution) and WorldView-3 multispectral satellite data (1.2 m spatial resolution) were used for accuracy assessment and comparison (Figure 13). These maps were generated using iron oxide indices and classified probability categories calculated in the same way to those derived from UAV data by applying thresholds. The comparison was carried out using a Geographic Information System (GIS), which facilitated the precise alignment of spatial datasets from different sources and enabled the visual identification of zones of high probability of mineralization. The area coverage for each probability class was also calculated during the analysis and is presented in Table 6.
The map generated using the developed technique provided a highly detailed distribution of the probability of mineralization using the superior spatial resolution of the UAV data. The integration of GIS technology proved invaluable for synthesizing data from different platforms and performing spatial correlation analysis. This process enabled a more robust evaluation of the probability maps and underlined the reliability and precision of the developed method in delineating mineral-rich zones. The comparison also confirmed the ability of the UAV-based approach to complement and enhance traditional satellite-based methods in mineral exploration.
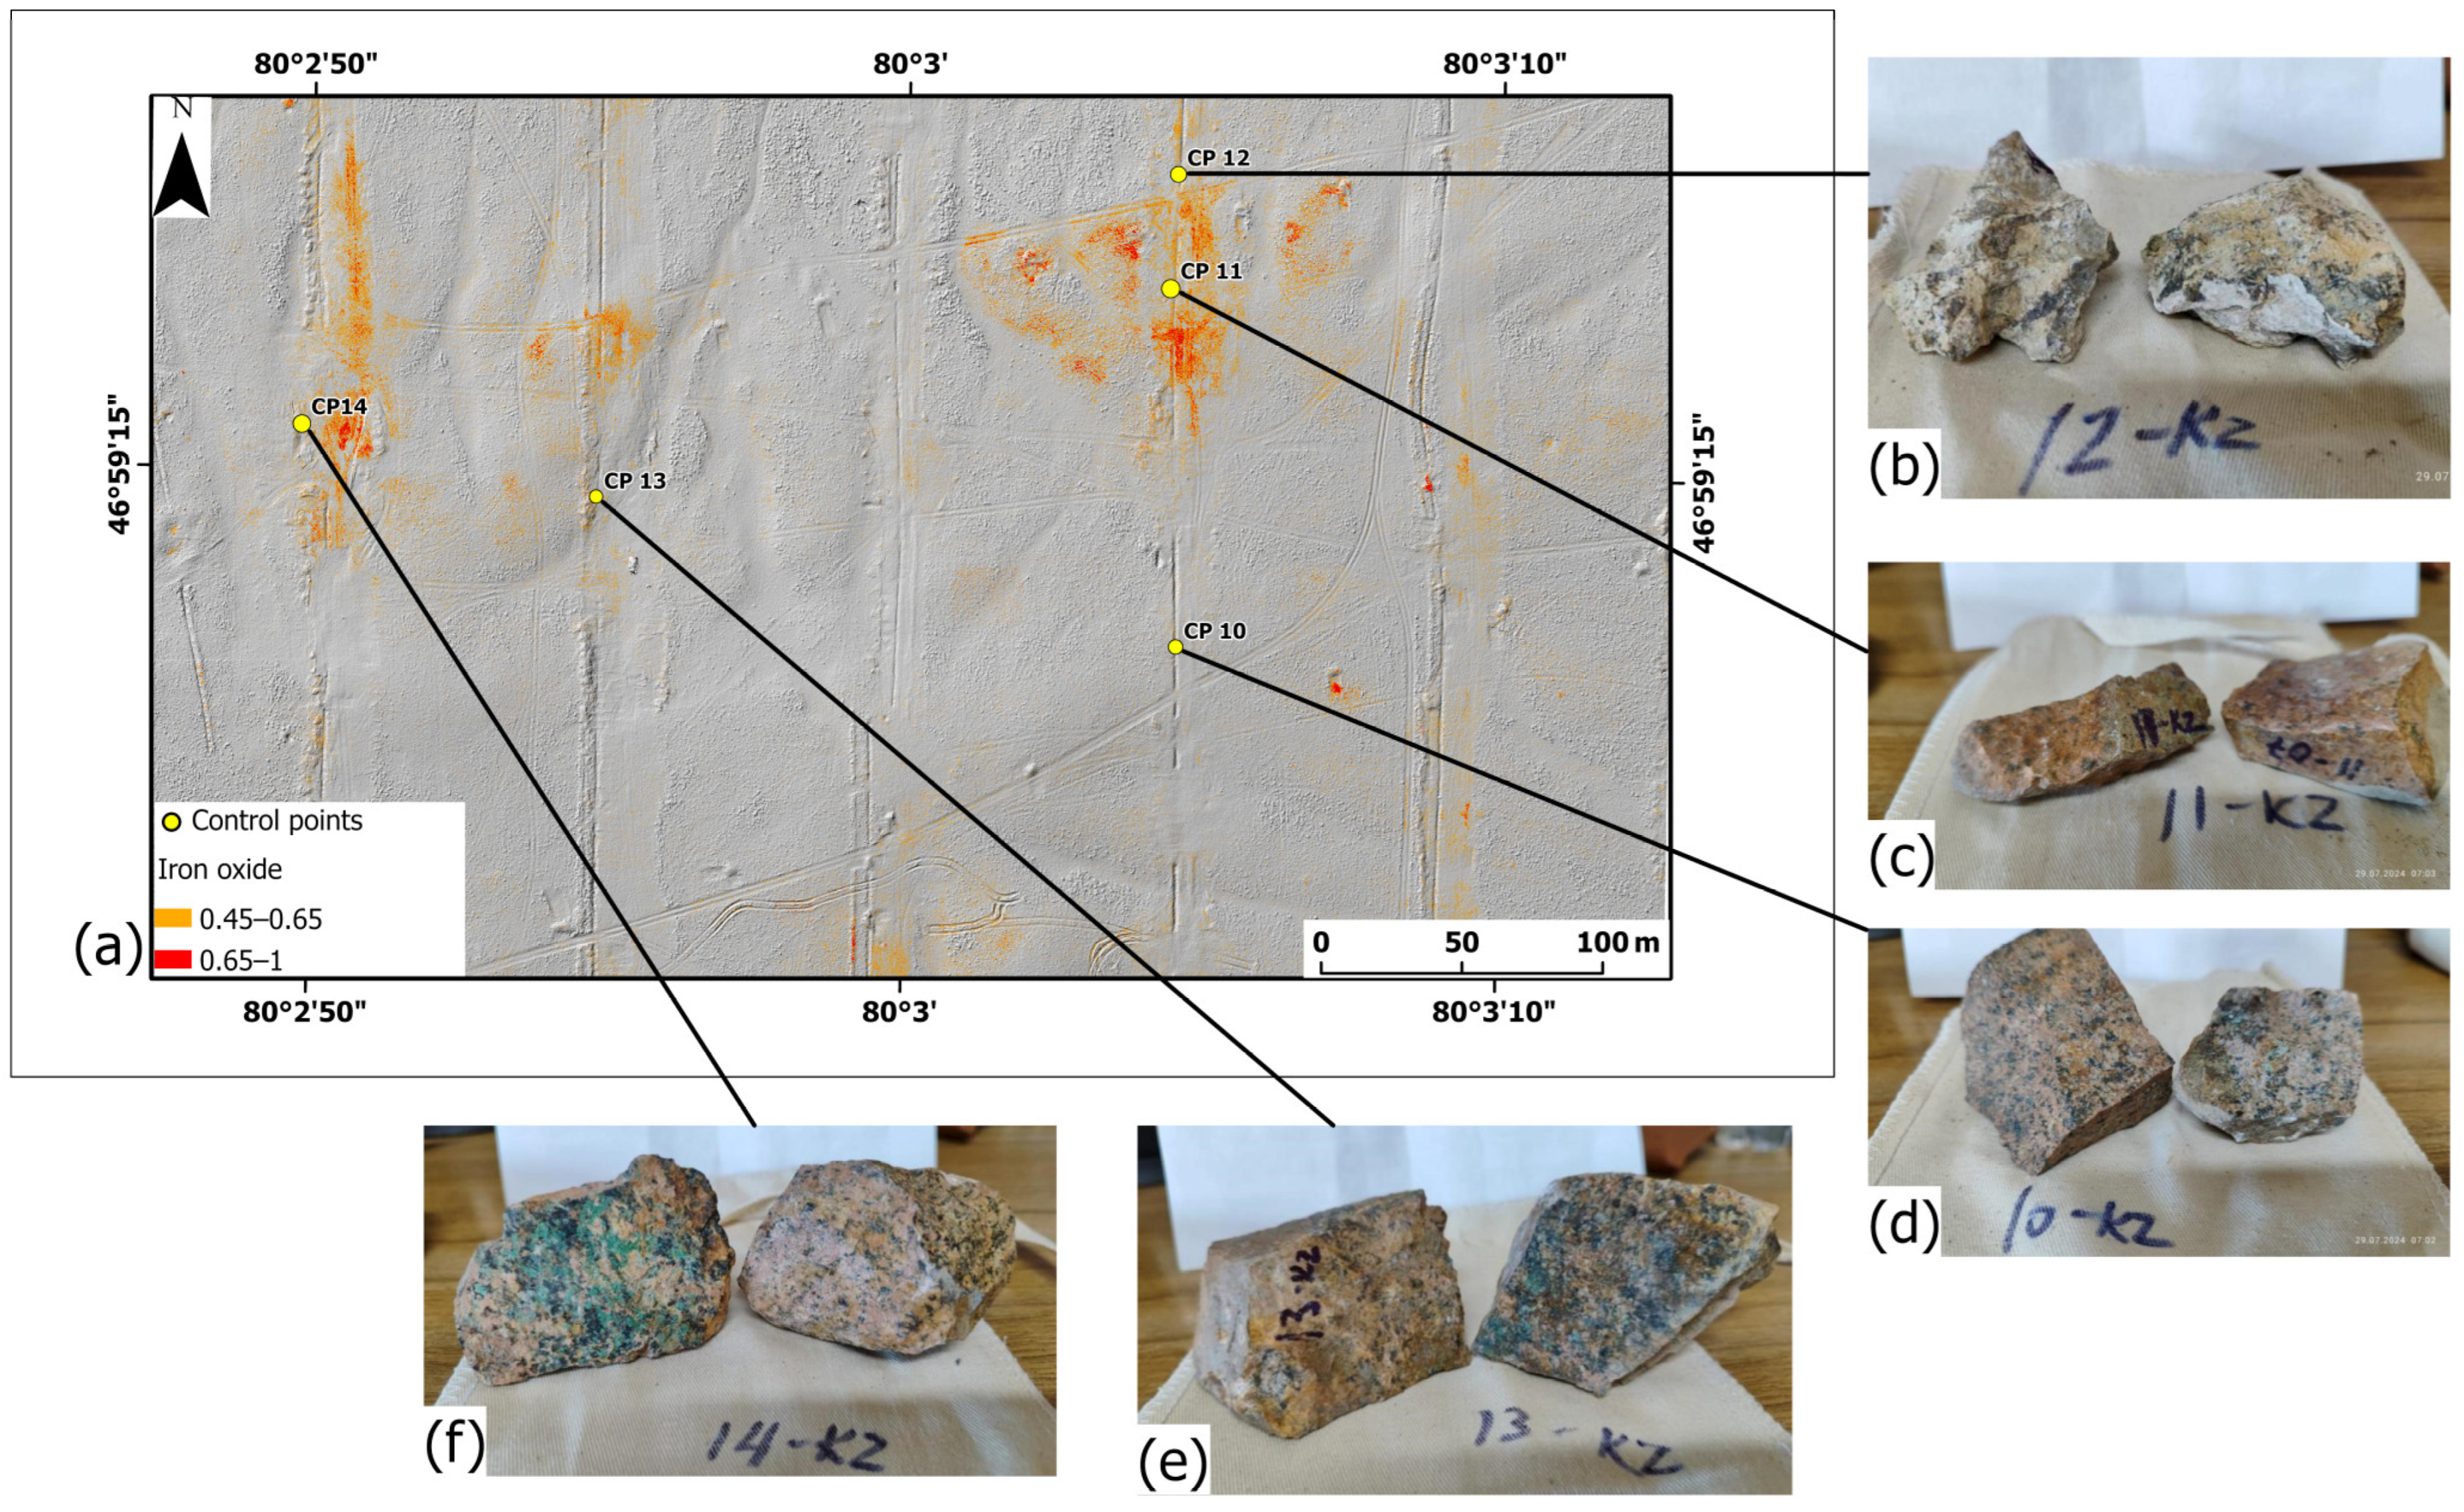
To further verify the reliability of the technique, five ground control points (GCPs) were used within the study area (see Table 7). These points were pre-coordinated during the sampling phase using GNSS equipment to confirm the presence of iron oxide (Figure 14). The results of the verification were as follows: Four points were classified as zones with a high probability of mineral content. Three of these points were confirmed by laboratory analysis, confirming the accuracy of the model’s predictions for high probability zones. One point was classified as a moderately high probability zone and its prediction was also confirmed, demonstrating the effectiveness of the model in accurately predicting mineral content for this probability class (Figure 14). The model showed an overall accuracy of 80% for the high probability class and 100% for the moderate probability class, indicating strong performance in predicting the probability of mineralization in these categories.

6. Conclusions

In this study, an integrated technique for decoding UAV-based multispectral data using fuzzy logic was developed and rigorously tested to identify zones with a high probability of iron oxide mineralization associated with the Aktogay and Kyzylkiya porphyry copper deposits, with a focus on the Kyzylkiya site in Eastern Kazakhstan. Validation against ground control points demonstrated the robustness and accuracy of the method and established it as a reliable tool for preliminary mineral exploration and evaluation. These results underline the potential of the technique as a basis for advanced applications in remote sensing-based mineral exploration. Further refinements and developments are planned to maximize the utility and precision of the technique. One focus will be the integration of hyperspectral data. Hyperspectral imaging provides a more comprehensive spectral dataset that allows for more accurate differentiation of mineralogical features. By incorporating this detailed information, the method will be able to detect subtle variations in mineral composition, thereby improving its resolution and analytical performance.
The versatility of the technique will also be assessed through its application in different geological environments, including sites with complex geological structures, heterogeneous landscapes and varying degrees of vegetation cover. These tests will evaluate the technique’s adaptability and ensure reliable performance in challenging and multi-layered environments, extending its applicability to a wider range of exploration scenarios. In addition to these improvements, the method will also incorporate advanced data processing techniques. The expansion of the database with ground control points will improve the statistical reliability and accuracy of the results while reducing bias. Furthermore, the use of next-generation remote sensing algorithms, such as machine learning and deep learning approaches, will improve classification accuracy and minimize interpretation errors, especially for noisy or ambiguous datasets. Finally, the technique will account for environmental variability by refining its ability to account for natural conditions such as atmospheric effects, changing lighting, and seasonal vegetation cover. These improvements will ensure consistent performance across different temporal and spatial scales. Overall, these advances will significantly improve the accuracy, adaptability and overall utility of the technique, making it a highly flexible and robust tool for cutting-edge mineral exploration.

Author Contributions

Conceptualization, E.O., H.A. and B.A.; methodology, B.A. and H.A.; software, B.A. and H.A.; validation, E.O., H.A. and A.B.; formal analysis, B.A. and N.S.; investigation, H.A.; resources, E.O. and N.S.; data curation, H.A. and A.B.P.; writing—original draft preparation, H.A.; writing—review and editing, H.A. and A.B.P.; visualization, B.A. and H.A.; supervision, E.O. and H.A.; project administration, A.B. and E.O.; funding acquisition, E.O. All authors have read and agreed to the published version of the manuscript.

Funding

The research is funded by the Committee of Science of the Ministry of Science and Higher Education of the Republic of Kazakhstan (Grant No. BR21882179).

Data Availability Statement

All data associated with the results are presented in the paper.

Acknowledgments

We thank University Malaysia Terengganu (UMT) for providing the facilities for editing this manuscript.

Conflicts of Interest

Author Hemayatullah Ahmadi was employed by the company Wood Rodgers, Inc. The remaining authors declare that the research was conducted in the absence of any commercial or financial relationships that could be construed as a potential conflict of interest.

References

  1. Alarifi, S.S.; Abdelkareem, M.; Abdalla, F.; Abdelsadek, I.S.; Gahlan, H.; Al-Saleh, A.M.; Alotaibi, M. Fusion of Multispectral Remote-Sensing Data through GIS-Based Overlay Method for Revealing Potential Areas of Hydrothermal Mineral Resources. Minerals 2022, 12, 1577. [Google Scholar] [CrossRef]
  2. Rahmani, N.R.; Ahmadi, H.; Rahimy, F.; Yousufi, A. Automated detection of granitic complexes in NW Parwan, NE Afghanistan using Sentinel-2B/MSI and ASTER data. Discov. Geosci. 2024, 2, 86. [Google Scholar] [CrossRef]
  3. Jain, R.; Bhu, H.; Pandey, A.K.; Pour, A.B. Base-metal exploration by using remote sensing, geological, geophysical, and geochemical datasets with clues from ancient mining: A comprehensive review on Aravalli-Delhi Fold Belt, Rajasthan, India. Adv. Space Res. 2025, 75, 277–315. [Google Scholar] [CrossRef]
  4. Fallah, M.; Jamali, H.; Alaminia, Z.; Pour, A.B. ASTER remote sensing data for detecting porphyry copper type alteration patterns in West Zafarghand Cu±Mo deposit, Iran. Int. J. Image Data Fusion 2024, 1–31. [Google Scholar] [CrossRef]
  5. Ousmanou, S.; Martial, F.E.; Jules, T.K.; Ludovic, A.M.; Agnès Blandine, K.T.; Sufinatu, A.; Mohamed, R.; Maurice, K. Mapping and discrimination of the mineralization potential in granitoids from Banyo area (Adamawa, Cameroon), using Landsat 9 OLI, ASTER images and field observations. Geosyst. Geoenviron. 2024, 3, 100239. [Google Scholar] [CrossRef]
  6. Traore, M.; Takodjou Wambo, J.D.; Ndepete, C.P.; Tekin, S.; Pour, A.B.; Muslim, A.M. Lithological and alteration mineral mapping for alluvial gold exploration in the south east of Birao area, Central African Republic using Landsat-8 Operational Land Imager (OLI) data. J. Afr. Earth Sci. 2020, 170, 103933. [Google Scholar] [CrossRef]
  7. Saremi, M.; Hoseinzade, Z.; Mirzabozorg, S.A.A.S.; Pour, A.B.; Zoheir, B.; Almasi, A. Integrated remote sensing and geochemical studies for enhanced prospectivity mapping of porphyry copper deposits: A case study from the Pariz district, Urmia-Dokhtar metallogenic belt, southern Iran. Remote Sens. Appl. Soc. Environ. 2024, 36, 101343. [Google Scholar] [CrossRef]
  8. Cudahy, T.; Caccetta, M.; Thomas, M.; Hewson, R.; Abrams, M.; Kato, M.; Kashimura, O.; Ninomiya, Y.; Yamaguchi, Y.; Collings, S.; et al. Satellite-derived mineral mapping and monitoring of weathering, deposition and erosion. Sci. Rep. 2016, 6, 23702. [Google Scholar] [CrossRef]
  9. Kruse, F.A.; Boardman, J.W.; Huntington, J.F. Comparison of airborne hyperspectral data and eo-1 hyperion for mineral mapping. IEEE Trans. Geosci. Remote Sens. 2003, 41, 1388–1400. [Google Scholar] [CrossRef]
  10. van der Meer, F.D.; van der Werff, H.M.A.; van Ruitenbeek, F.J.A. Potential of ESA’s Sentinel-2 for geological applications. Remote Sens. Environ. 2014, 148, 124–133. [Google Scholar] [CrossRef]
  11. Groves, D.I.; Bierlein, F.P.; Meinert, L.D.; Hitzman, M.W. Iron Oxide Copper-Gold (IOCG) Deposits through Earth History: Implications for Origin, Lithospheric Setting, and Distinction from Other Epigenetic Iron Oxide Deposits. Econ. Geol. 2010, 105, 641–654. [Google Scholar] [CrossRef]
  12. Sun, X.-L.; Wang, Y.; Xiong, H.-Q.; Wu, F.; Lv, T.-X.; Fang, Y.-C.; Xiang, H. The Role of Surface Functional Groups of Iron Oxide, Organic Matter, and Clay Mineral Complexes in Sediments on the Adsorption of Copper Ions. Sustainability 2023, 15, 6711. [Google Scholar] [CrossRef]
  13. Huang, X.-W.; Boutroy, É.; Makvandi, S.; Beaudoin, G.; Corriveau, L.; De Toni, A.F. Trace element composition of iron oxides from IOCG and IOA deposits: Relationship to hydrothermal alteration and deposit subtypes. Miner. Depos. 2019, 54, 525–552. [Google Scholar] [CrossRef]
  14. Orynbassarova, E.O.; Adebiyet, B.; Iliuf, F.A.; Sydyk, N.K. Analysis of mineral indices from remote sensing: A case-study of the Tokrau river. Eurasian Min. 2024, 1, 71–76. [Google Scholar] [CrossRef]
  15. Cardoso-Fernandes, J.; Teodoro, A.C.; Lima, A.; Perrotta, M.; Roda-Robles, E. Detecting Lithium (Li) mineralizations from space: Current research and future perspectives. Appl. Sci. 2020, 10, 1785. [Google Scholar] [CrossRef]
  16. Chen, Y.; Wang, Y.; Zhang, F.; Dong, Y.; Song, Z.; Liu, G. Remote Sensing for Lithology Mapping in Vegetation-Covered Regions: Methods, Challenges, and Opportunities. Minerals 2023, 13, 1153. [Google Scholar] [CrossRef]
  17. Gürsoy, Ö.; Kaya, Ş.; Çakir, Z.; Tatar, O.; Canbaz, O. Determining lateral offsets of rocks along the eastern part of the North Anatolian Fault Zone (Turkey) using spectral classification of satellite images and field measurements. Geomat. Nat. Hazards Risk 2017, 8, 1276–1288. [Google Scholar] [CrossRef]
  18. Rajan Girija, R.; Mayappan, S. Mapping of mineral resources and lithological units: A review of remote sensing techniques. Int. J. Image Data Fusion 2019, 10, 79–106. [Google Scholar] [CrossRef]
  19. Rowan, L.C.; Mars, J.C.; Simpson, C.J. Lithologic mapping of the Mordor, NT, Australia ultramafic complex by using the Advanced Spaceborne Thermal Emission and Reflection Radiometer (ASTER). Remote Sens. Environ. 2005, 99, 105–126. [Google Scholar] [CrossRef]
  20. Seifi, A.; Esmaeily, A.; Mokhtari, Z. A new hybrid method for epithermal gold exploration using multi-sensor satellite data in Sistan and Baluchestan Province (Iran). Ore Geol. Rev. 2021, 138, 104357. [Google Scholar] [CrossRef]
  21. Abay, H.H.; Legesse, D.; Venkata Suryabhagavan, K.; Atnafu, B. Mapping of ferric (Fe3+) and ferrous (Fe2+) iron oxides distribution using ASTER and Landsat 8 OLI data, in Negash Lateritic iron deposit, Northern Ethiopia. Geol. Ecol. Landsc. 2024, 8, 223–240. [Google Scholar] [CrossRef]
  22. Kumar, C.; Chatterjee, S.; Oommen, T.; Guha, A. Automated lithological mapping by integrating spectral enhancement techniques and machine learning algorithms using AVIRIS-NG hyperspectral data in Gold-bearing granite-greenstone rocks in Hutti, India. Int. J. Appl. Earth Obs. Geoinf. 2020, 86, 102006. [Google Scholar] [CrossRef]
  23. Park, S.; Choi, Y. Applications of Unmanned Aerial Vehicles in Mining from Exploration to Reclamation: A Review. Minerals 2020, 10, 663. [Google Scholar] [CrossRef]
  24. Choi, Y. Applications of Unmanned Aerial Vehicle and Artificial Intelligence Technologies in Mining from Exploration to Reclamation. Minerals 2023, 13, 382. [Google Scholar] [CrossRef]
  25. Honarmand, M.; Shahriari, H. Geological Mapping Using Drone-Based Photogrammetry: An Application for Exploration of Vein-Type Cu Mineralization. Minerals 2021, 11, 585. [Google Scholar] [CrossRef]
  26. Shahsavani, H.; Smith, R.S. Aeromagnetic gradiometry with UAV, a case study on small iron ore deposit. Drone Syst. Appl. 2024, 12, 1–9. [Google Scholar] [CrossRef]
  27. Uniyal, A.; Gond, A.; Tiwari, T.; Pandit, S.; Gupta, C.; Saikhom, V.; Dinkar, G. UAV/Drone-Based Identification of Geomorphic and Structural Anomalies as Probable Indicators of Economic Mineral Deposits in Girar Area of Lalitpur District, U.P., (India). J. Indian Soc. Remote Sens. 2022, 50, 937–947. [Google Scholar] [CrossRef]
  28. Sang, X.; Xue, L.; Ran, X.; Li, X.; Liu, J.; Liu, Z. Intelligent High-Resolution Geological Mapping Based on SLIC-CNN. ISPRS Int. J. Geo-Inf. 2020, 9, 99. [Google Scholar] [CrossRef]
  29. Abubakar, F.; Alao, J.O.; Ogah, A.J.; Ayuba, R.; Lekdukun, M.O.; Baba, Y.; Sadiq, F.K.; Samson, E.E.; Aliyu, A. Evaluation of gold mineralisation potential using AHP systems and weighted overlay analysis. Sci. Rep. 2024, 14, 21263. [Google Scholar] [CrossRef]
  30. Biswas, A. Methods and applications in petroleum and mineral exploration and engineering geology (1st edn). J. Earth Syst. Sci. 2021, 130, 231. [Google Scholar] [CrossRef]
  31. Grunsky, E.C.; Caritat, P. de State-of-the-art analysis of geochemical data for mineral exploration. Geochem. Explor. Environ. Anal. 2020, 20, 217–232. [Google Scholar] [CrossRef]
  32. Liu, Y.; Carranza, E.J.M.; Xia, Q. Developments in Quantitative Assessment and Modeling of Mineral Resource Potential: An Overview. Nat. Resour. Res. 2022, 31, 1825–1840. [Google Scholar] [CrossRef]
  33. Moon, W.M. Integration and fusion of geological exploration data: A theoretical review of fuzzy logic approach. Geosci. J. 1998, 2, 175–183. [Google Scholar] [CrossRef]
  34. Pazand, K.; Hezarkhani, A. Porphyry Cu potential area selection using the combine AHP-TOPSIS methods: A case study in Siahrud area (NW, Iran). Earth Sci. Inform. 2015, 8, 207–220. [Google Scholar] [CrossRef]
  35. Peixoto, S.F.; Coimbra Horbe, A.M.; Soares, T.M.; Freitas, C.A.; Dalat de Sousa, E.M.; Herrera de Figueiredo Iza, E.R. Boolean and fuzzy logic operators and multivariate linear regression applied to airborne gamma-ray spectrometry data for regolith mapping in granite-greenstone terrain in Midwest Brazil. J. S. Am. Earth Sci. 2021, 112, 103562. [Google Scholar] [CrossRef]
  36. Khosravi, V.; Shirazi, A.; Shirazy, A.; Hezarkhani, A.; Pour, A.B. Hybrid Fuzzy-Analytic Hierarchy Process (AHP) Model for Porphyry Copper Prospecting in Simorgh Area, Eastern Lut Block of Iran. Mining 2021, 2, 1–12. [Google Scholar] [CrossRef]
  37. Ousmanou, S.; Fodoue, Y.; Wadjou, J.W.; Kepnamou, A.D.; Fozing, E.M.; Kwékam, M.; Ikfi, M. Fuzzy-logic technique for gold mineralization prospecting using Landsat 9 OLI processing and fieldwork data in the Bibemi goldfield, north Cameroon. Heliyon 2024, 10, e23334. [Google Scholar] [CrossRef]
  38. Shirazi, A.; Hezarkhani, A.; Beiranvand Pour, A.; Shirazy, A.; Hashim, M. Neuro-Fuzzy-AHP (NFAHP) Technique for Copper Exploration Using Advanced Spaceborne Thermal Emission and Reflection Radiometer (ASTER) and Geological Datasets in the Sahlabad Mining Area, East Iran. Remote Sens. 2022, 14, 5562. [Google Scholar] [CrossRef]
  39. Alpysbay, M.A.; Orynbassarova, E.O.; Sydyk, N.K.; Adebiyet, B.; Kamza, A.T. Mining mapping and exploration using remote sensing data in Kazakhstan: A review. Eng. J. Satbayev Univ. 2024, 146, 37–46. [Google Scholar] [CrossRef]
  40. Zvezdov, V.S.; Migachev, I.F.; Girfanov, M.M. Porphyry copper deposits of the CIS and the models of their formation. Ore Geol. Rev. 1993, 7, 511–549. [Google Scholar] [CrossRef]
  41. Li, C.; Shen, P.; Pan, H.; Cao, C.; Seitmuratova, E. Geology and ore-forming fluid evolution of the Aktogai giant porphyry Cu deposit, Kazakhstan. J. Asian Earth Sci. 2018, 165, 192–209. [Google Scholar] [CrossRef]
  42. Chen, X.; Seitmuratova, E.; Wang, Z.; Chen, Z.; Han, S.; Li, Y.; Yang, Y.; Ye, B.; Shi, W. SHRIMP U–Pb and Ar–Ar geochronology of major porphyry and skarn Cu deposits in the Balkhash Metallogenic Belt, Central Asia, and geological implications. J. Asian Earth Sci. 2014, 79, 723–740. [Google Scholar] [CrossRef]
  43. Cao, M.; Li, G.; Qin, K.; Seitmuratova, E.Y.; Liu, Y. Major and Trace Element Characteristics of Apatites in Granitoids from Central Kazakhstan: Implications for Petrogenesis and Mineralization. Resour. Geol. 2012, 62, 63–83. [Google Scholar] [CrossRef]
  44. Shen, P.; Pan, H.; Hattori, K.; Cooke, D.R.; Seitmuratova, E. Large Paleozoic and Mesozoic porphyry deposits in the Central Asian Orogenic Belt: Geodynamic settings, magmatic sources, and genetic models. Gondwana Res. 2018, 58, 161–194. [Google Scholar] [CrossRef]
  45. Li, C.; Shen, P.; Pan, H. Mineralogy of the Aktogai giant porphyry Cu deposit in Kazakhstan: Insights into the fluid composition and oxygen fugacity evolution. Ore Geol. Rev. 2018, 95, 899–916. [Google Scholar] [CrossRef]
  46. Cao, M.-J.; Li, G.-M.; Qin, K.-Z.; Evans, N.J.; Seitmuratova, E.Y. Assessing the magmatic affinity and petrogenesis of granitoids at the giant Aktogai porphyry Cu deposit, Central Kazakhstan. Am. J. Sci. 2016, 316, 614–668. [Google Scholar] [CrossRef]
  47. Li, C.; Shen, P.; Zhao, Y.; Li, P.; Zhang, L.; Pan, H. Mineral chemistry of chlorite in different geologic environments and its implications for porphyry Cu ± Au ± Mo deposits. Ore Geol. Rev. 2022, 149, 105112. [Google Scholar] [CrossRef]
  48. Gallardo-Salazar, J.L.; Pompa-García, M. Detecting Individual Tree Attributes and Multispectral Indices Using Unmanned Aerial Vehicles: Applications in a Pine Clonal Orchard. Remote Sens. 2020, 12, 4144. [Google Scholar] [CrossRef]
  49. Akhmetov, R.; Makhmetova, G.; Orynbassarova, E.; Baltiyeva, A.; Togaibekov, A.; Roberts, K.; Yerzhankyzy, A. The study of kinematic gnss surveying for BIM georeferencing. Int. Arch. Photogramm. Remote Sens. Spat. Inf. Sci. 2022, 46, 7–14. [Google Scholar] [CrossRef]
  50. Van Canh, L.; Xuan Cuong, C.; Quoc Long, N.; Thi Thu Ha, L.; Trung Anh, T.; Bui, X.-N. Experimental Investigation on the Performance of DJI Phantom 4 RTK in the PPK Mode for 3D Mapping Open-Pit Mines. Inżynieria Miner. 2020, 1, 65–74. [Google Scholar] [CrossRef]
  51. Kovanič, Ľ.; Topitzer, B.; Peťovský, P.; Blišťan, P.; Gergeľová, M.B.; Blišťanová, M. Review of Photogrammetric and Lidar Applications of UAV. Appl. Sci. 2023, 13, 6732. [Google Scholar] [CrossRef]
  52. Fazeli, H.; Samadzadegan, F.; Dadrasjavan, F. Evaluating the potential of RTK-UAV for automatic point cloud generation in 3D rapid mapping. Int. Arch. Photogramm. Remote Sens. Spat. Inf. Sci. 2016, 41, 221–226. [Google Scholar] [CrossRef]
  53. Martínez-Carricondo, P.; Agüera-Vega, F.; Carvajal-Ramírez, F. Accuracy assessment of RTK/PPK UAV-photogrammetry projects using differential corrections from multiple GNSS fixed base stations. Geocarto Int. 2023, 38, 2197507. [Google Scholar] [CrossRef]
  54. Shylesh, D.; Manikandan, N.; Sivasankar, S.; Surendran, D.; Jaganathan, R.; Mohan, G. Influence of quantity, quality, horizontal and vertical distribution of ground control points on the positional accuracy of UAV survey. Appl. Geomat. 2023, 15, 897–917. [Google Scholar] [CrossRef]
  55. Park, J.W.; Yeom, D.J. Method for establishing ground control points to realize UAV-based precision digital maps of earthwork sites. J. Asian Archit. Build. Eng. 2022, 21, 110–119. [Google Scholar] [CrossRef]
  56. Olsson, P.-O.; Vivekar, A.; Adler, K.; Garcia Millan, V.E.; Koc, A.; Alamrani, M.; Eklundh, L. Radiometric Correction of Multispectral UAS Images: Evaluating the Accuracy of the Parrot Sequoia Camera and Sunshine Sensor. Remote Sens. 2021, 13, 577. [Google Scholar] [CrossRef]
  57. Uysal, M.; Toprak, A.S.; Polat, N. DEM generation with UAV Photogrammetry and accuracy analysis in Sahitler hill. Measurement 2015, 73, 539–543. [Google Scholar] [CrossRef]
  58. Abdelmalik, K.W.; Abd-Allah, A.M.A. Integration of remote sensing technique and field data in geologic mapping of an ophiolitic suture zone in western Arabian Shield. J. Afr. Earth Sci. 2018, 146, 180–190. [Google Scholar] [CrossRef]
  59. Clark, R.N. Spectroscopy of Rocks Andminerals, and Principles of Spectrocopy; USGS Spectroscopy Lab: Denver, CO, USA, 1999. [Google Scholar]
  60. Yang, C.; Jia, H.; Dong, L.; Zhao, H.; Zhao, M. Selection of Landsat-8 Operational Land Imager (OLI) Optimal Band Combinations for Mapping Alteration Zones. Remote Sens. 2024, 16, 392. [Google Scholar] [CrossRef]
  61. Ahmadi, H.; Uygucgil, H. Targeting iron prospective within the Kabul Block (SE Afghanistan) via hydrothermal alteration mapping using remote sensing techniques. Arab. J. Geosci. 2021, 14, 183. [Google Scholar] [CrossRef]
  62. Sabins, F.F. Remote sensing for mineral exploration. Ore Geol. Rev. 1999, 14, 157–183. [Google Scholar] [CrossRef]
  63. Chávez, W.X. Supergene Oxidation of Copper Deposits: Zoning and Distribution of Copper Oxide Minerals. SEG Discov. 2000, 41, 1–21. [Google Scholar] [CrossRef]
  64. Heinrich, C.A. The Chain of Processes Forming Porphyry Copper Deposits—An Invited Paper. Econ. Geol. 2024, 119, 741–769. [Google Scholar] [CrossRef]
  65. Yang, Y.; Meng, Z.; Zu, J.; Cai, W.; Wang, J.; Su, H.; Yang, J. Fine-Scale Mangrove Species Classification Based on UAV Multispectral and Hyperspectral Remote Sensing Using Machine Learning. Remote Sens. 2024, 16, 3093. [Google Scholar] [CrossRef]
  66. Zeng, C.; King, D.J.; Richardson, M.; Shan, B. Fusion of Multispectral Imagery and Spectrometer Data in UAV Remote Sensing. Remote Sens. 2017, 9, 696. [Google Scholar] [CrossRef]
  67. Deshpande, S.; Subeesh, A.; Saini, A. Analysis of Most Significant Bands and Band Ratios for Discrimination of Hydrothermal Alteration Minerals. In Proceedings of the 2019 10th Workshop on Hyperspectral Imaging and Signal Processing: Evolution in Remote Sensing (WHISPERS), Amsterdam, The Netherlands, 24–26 September 2019; IEEE: Piscataway, NJ, USA, 2019; pp. 1–5. [Google Scholar]
  68. Jackisch, R.; Lorenz, S.; Zimmermann, R.; Möckel, R.; Gloaguen, R. Drone-Borne Hyperspectral Monitoring of Acid Mine Drainage: An Example from the Sokolov Lignite District. Remote Sens. 2018, 10, 385. [Google Scholar] [CrossRef]
  69. Wan, Y.; Fan, Y.; Jin, M. Application of hyperspectral remote sensing for supplementary investigation of polymetallic deposits in Huaniushan ore region, northwestern China. Sci. Rep. 2021, 11, 440. [Google Scholar] [CrossRef]
  70. Sekandari, M.; Beiranvand Pour, A. Fuzzy Logic Modeling for Integrating the Thematic Layers Derived from Remote Sensing Imagery: A Mineral Exploration Technique. In Proceedings of the 2nd International Electronic Conference on Mineral Science, Online, 1–15 March 2021; MDPI: Basel, Switzerland, 2021; p. 8. [Google Scholar]
  71. Ekaputri, R.Z.; Hidayat, T.; Surtikanti, H.K.; Surakusumah, W. Modeling vegetation density with remote sensing, normalized difference vegetation index and biodiversity plants in watershed area. Glob. J. Environ. Sci. Manag. 2024, 10, 4. [Google Scholar] [CrossRef]
  72. Huang, S.; Tang, L.; Hupy, J.P.; Wang, Y.; Shao, G. A commentary review on the use of normalized difference vegetation index (NDVI) in the era of popular remote sensing. J. For. Res. 2021, 32, 2719. [Google Scholar] [CrossRef]
  73. Orynbassarova, E.; Ahmadi, H.; Adebiyet, B.; Bekbotayeva, A.; Abdullayeva, T.; Beiranvand Pour, A.; Ilyassova, A.; Serikbayeva, E.; Talgarbayeva, D.; Bermukhanova, A. Mapping Alteration Minerals Associated with Aktogay Porphyry Copper Mineralization in Eastern Kazakhstan Using Landsat-8 and ASTER Satellite Sensors. Minerals 2025, 15, 277. [Google Scholar] [CrossRef]
  74. Melin, P.; Castillo, O.; Kacprzyk, J.; Reformat, M.; Melek, W. Fuzzy Logic in Intelligent System Design; Advances in Intelligent Systems and Computing; Springer International Publishing: Cham, Switzerland, 2017; Volume 648, ISBN 978-3-319-67136-9. [Google Scholar]
  75. Lachaud, A.; Adam, M.; Mišković, I. Comparative Study of Random Forest and Support Vector Machine Algorithms in Mineral Prospectivity Mapping with Limited Training Data. Minerals 2023, 13, 1073. [Google Scholar] [CrossRef]
  76. Ghezelbash, R.; Maghsoudi, A.; Bigdeli, A.; Carranza, E.J.M. Regional-Scale Mineral Prospectivity Mapping: Support Vector Machines and an Improved Data-Driven Multi-criteria Decision-Making Technique. Nat. Resour. Res. 2021, 30, 1977–2005. [Google Scholar] [CrossRef]
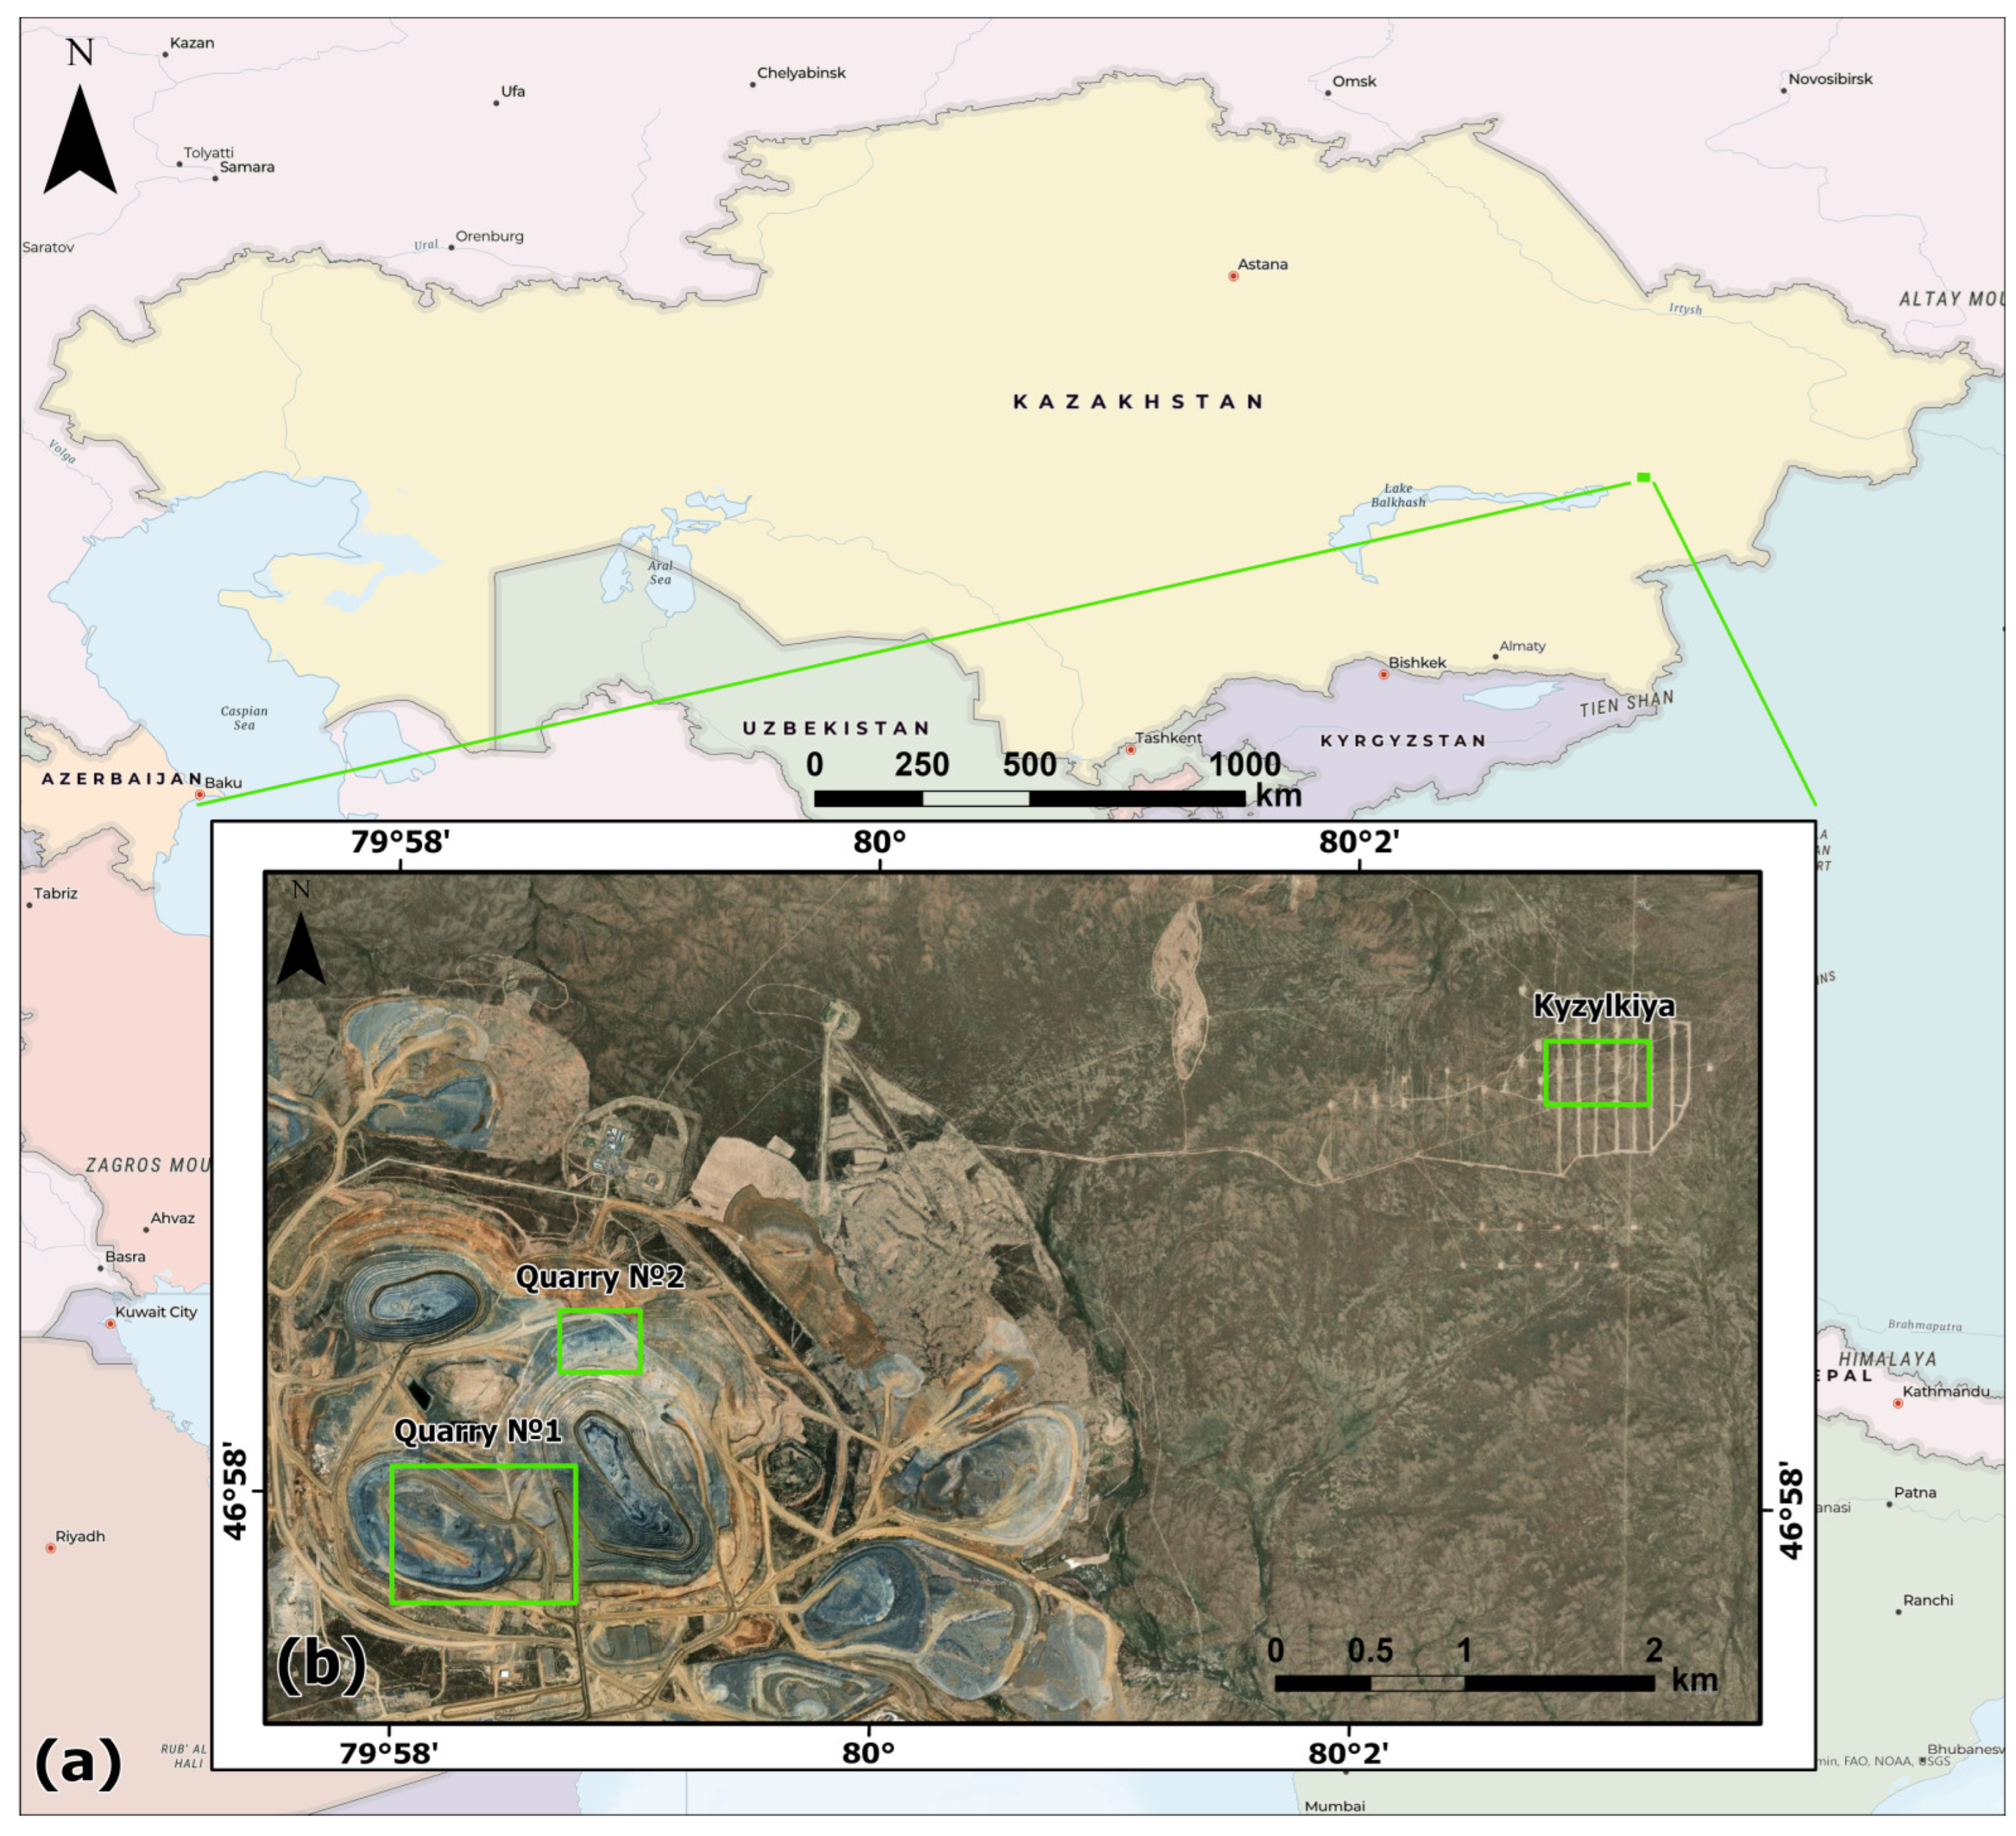
Figure 1. Overall extent of the study area. (a) Regional location of the study area and surrounding regions compiled from ArcMap basemaps, (b) Overview of the selected sites surveyed with an unmanned aerial vehicle (UAV), highlighted by demarcated green boundary lines in Google Earth.
Mining 05 00052 g001
Figure 2. Simplified geological map of study area modified from RGF Report 45,219 by V. M. Mertenov, “Geological re-examination at a scale of 1:200,000 for the territory of the Bakanas syncline (sheets L-44-I, II, III)”, Almaty, 1997.
Mining 05 00052 g002
Figure 3. An overview of the methodological flow chart.
Mining 05 00052 g003
Figure 4. Multispectral survey using UAV-Mounted DJI Phantom Sensor in the field.
Mining 05 00052 g004
Figure 5. Outputs generated from the processing of multispectral data surveyed by UAV-Mounted DJI Phantom Sensor of Kyzylkiya site: (a) Digital Terrain Model (b) Orthophoto imagery.
Mining 05 00052 g005
Figure 6. Spectral signature of iron oxide minerals modified from [59,61].
Mining 05 00052 g006
Figure 7. Key stages of fuzzy logic application in this study.
Mining 05 00052 g007
Figure 8. Development of the fuzzy logic model in the MATLAB environment.
Mining 05 00052 g008
Figure 9. Spatial distribution of iron oxide acquired from multispectral data by UAV-Mounted DJI Phantom Sensor of Kyzylkiya site (a) Band Ratio 650/560 nm (Red/Green) and (b) Band Ratio 730/840 nm (RedEdge/NIR).
Mining 05 00052 g009
Figure 10. Illustration showing the relationships between input data and fuzzy logic rules: (a) At minimum input values; (b) At maximum input values; and (c) At average input values.
Mining 05 00052 g010
Figure 11. Spatial distribution of iron oxide using fuzzy logic by the multispectral data obtained from the UAV survey.
Mining 05 00052 g011
Figure 12. Classified distribution of iron oxide highlighted by the applied fuzzy logic model in this study.
Mining 05 00052 g012
Figure 13. (a) Spatial distribution of iron oxide using ASTER data (15 m/pixel); (b) Spatial distribution iron oxide obtained from WorldView-3 data (1.2 m/pixel).
Mining 05 00052 g013
Figure 14. Thematic map showing the spatial distribution of iron oxides detected in this study and field collection sample photos: (a) Thematic map showing the spatial distribution of iron oxides; (b) Control point 12—dacitic tuff; (cf) Field samples at Control Points 10, 11, 13, and 14—granodiorite.
Mining 05 00052 g014
Table 1. Characteristics of UAV mounted multispectral sensor used in this study.
DJI Phantom 4 Multispectral
ParametersDescription
CMOS sensor resolution2 MΠ
Field of view62.7
Flight altitude100 m.
Spatial resolution5.29 cm/pixel
Forward overlap70%
Side overlap60%
Flight durationup to 25 min
Coverage area per flight~14 ha
Table 2. Results of the calculation of camera positions.
No. of ImageLatitudeLongitudeHeightAccuracy (M)SolutionNumber of Satellites
DJI_0010.JPG46.9616285479.97667615467.758130.0292Fix12
DJI_0011.TIF46.9616284979.97667579467.732580.0294Fix12
DJI_0012.TIF46.9616285479.97667561467.74580.0294Fix12
DJI_0013.TIF46.9616285279.97667558467.727920.0294Fix12
DJI_0015.TIF46.961628479.97667592467.738790.0294Fix12
Table 4. Developed fuzzy logic rules.
NoConditionActionDescription
1Low NDVI and high Band Ratio 1 and high Band Ratio 2High probability of mineralizationThis rule indicates that if vegetation is low and both indices show high values, the probability of mineral presence is high.
2High NDVI and one of the indices (Band Ratio_1 or Band Ratio_2) is lowLow probability of mineralizationIf vegetation is dense and at least one mineralization index is low, the probability of mineral presence decreases.
3Medium NDVI and both Band Ratio_1 and Band Ratio_2 are above the thresholdModerate probability of mineralizationIf NDVI is medium, but both indices indicate the presence of minerals, the probability will be moderate.
4Low NDVI and one of the indices is highHigh probability, assuming low vegetationIf vegetation is minimal, even one high mineralization index can indicate a high probability of mineral presence.
Table 5. Description of divided classes for iron oxide distribution by the developed technique.
ClassProbability
Percentage
Area (m2)Percentage of Total Area (%)
Class 1 (low)0.0–0.25133,780.9273.47
Class 2 (medium)0.25–0.4538,473.5521.13
Class 3 (moderately high)0.45–0.658867.054.87
Class 4 (high)0.65–1971.030.53
Table 6. Comparison of defined iron oxide mineral distribution classes obtained from UAV, WV-3, and ASTER data.
ClassArea (m2)—UAVArea (m2)—WV-3Area (m2)—ASTER
Class 1 (low)133,780.92134,657.28141,975
Class 2 (medium)38,473.5538,175.8430,150
Class 3 (moderately high)8867.057656.488775
Class 4 (high)971.031255.682250
Table 7. Description of ground control points.
No.LatitudeLongitudeClassification
CP No. 1046.98695980.051269High
CP No. 1146.98810180.051226High
CP No. 1246.98846680.051256High
CP No. 1346.98741680.048553High
CP No. 1446.98763780.047174Moderately high
Disclaimer/Publisher’s Note: The statements, opinions and data contained in all publications are solely those of the individual author(s) and contributor(s) and not of MDPI and/or the editor(s). MDPI and/or the editor(s) disclaim responsibility for any injury to people or property resulting from any ideas, methods, instructions or products referred to in the content.