Abstract
This study presents a constitutive model for simulating the behavior of weak rock masses under various stress conditions, including the effects of pore pressure and temperature. Addressing the limitations of existing models in accurately representing the complex anisotropic response of these materials, the model utilizes Monte Carlo simulations to integrate stress anisotropy, pore pressure effects, and deviatoric stress states. This approach aims to capture the impact of geological factors such as foliation and jointing on the mechanical behavior of weak rock masses, which are often characterized by low strength and high deformability. Five rock types (claystone, mudstone, sandstone, shale, and siltstone) were simulated, generating 1000 cases per type with variability modeled using Weibull distributions. Statistical validation, employing the Kolmogorov–Smirnov test and Q–Q plots, demonstrated a strong agreement between simulated and experimental data. The results suggest that the proposed model can effectively predict deformation patterns in weak rock masses, offering potential applications in mining, geothermal energy extraction, and other engineering projects involving these challenging geological formations.
1. Introduction
The stability and mechanical behavior of weak rock masses are pivotal to numerous engineering applications, particularly in a field such as mining engineering. These formations are often characterized by low strength and high deformability, posing significant challenges due to their complex response to environmental and operational stresses. Weak rock masses commonly exhibit anisotropic behavior, where mechanical properties vary with directional dependencies linked to geological features like foliation, bedding planes, and joints. Consequently, simulating these formations accurately requires advanced constitutive models that capture the interplay of stress anisotropy, pore pressure, deviatoric stress, and temperature fluctuations. Previous research has established models primarily for stronger rock formations; however, such models often lack the adaptability to replicate the nonlinear and probabilistic responses of weak rock masses under field conditions. For instance, ref. [1] emphasized the importance of incorporating deviatoric stress to predict deformation in weak formations accurately, while Ref. [2] demonstrated the significance of stress anisotropy on weak rock mass behavior. Similarly, ref. [3] introduced mechanisms to account for pore pressure effects in fluid-saturated environments which critical for formations like aquifers and geothermal fields, where pore pressure significantly influences deformation and failure [4].
This study addresses these limitations by presenting a comprehensive constitutive model for weak rock mass behavior, incorporating anisotropic stress components, pore pressure effects, and environmental factors like temperature changes. To validate this model, a Monte Carlo simulation approach was employed, allowing for an in-depth probabilistic analysis that reflects the inherent variability in geological properties through Weibull distributions. This approach aligns with recent methodologies that aim to bridge the gap between experimental and synthetic data by enhancing model sensitivity and specificity to weak rock mass conditions.
Through this research, we aim to advance predictive capabilities in geomechanical modeling, facilitating safer and more efficient designs in projects involving weak rock formations. The findings provide a practical tool for applications in mining, geothermal energy, oil reservoirs, and aquifer management, aligning with the growing need for models that can accurately simulate weak rock mass responses under diverse environmental and operational conditions.
2. Materials and Methods
2.1. Constitutive Model Development
The constitutive model presented in this paper aims to simulate the behavior of weak rock masses characterized by their low strength, high deformability, and significant sensitivity to environmental factors such as stress anisotropy, pore pressure, and temperatures changes. The theoretical foundation of this model is based on classical rock mechanic principles, with additional parameters to enhance the sensitivity and accuracy in simulating weak rock masses.
The general form of the constitutive model equation is expressed as follows:
This formula is a combination of multiple components, each derived from fundamental rock mechanics concepts.
2.1.1. Incorporation of Stress Anisotropy and Pore Pressure Effects
The first term of the constitutive model accounts for the combined influence of vertical stress () and pore pressure (P) on the material response. Given that weak rock masses often exhibit a significant reduction in strength due to pore pressure, this term introduces a scaling factor () to modulate the effect of pore pressure on deformation. Additionally, a reference stress () is included to normalize stress-dependent variations, while a material-dependent coefficient () is used to account for directional dependencies in stress response. This formulation ensures that the model can represent how weak rock masses behave under in situ stress conditions where pore pressure significantly influences failure mechanisms [2,4].
2.1.2. Stress Deviator and Yield Criteria
The second component of the model introduces the concept of stress deviators, a fundamental parameter in many failure criteria, such as Von Mises and Mohr–Coulomb models. This term incorporates the mean stress (), which is defined as the average of the three principal stresses, and the maximum and minimum principal stresses (), which play a crucial role in determining the onset of plastic deformation. The stress ratio is normalized by yield stress (), allowing the model to differentiate between elastic and plastic behavior. This approach enhances the model’s ability to simulate failure mechanisms, including plastic yielding and brittle failure, making it suitable for applications in mining, tunneling, and geotechnical engineering [3,5].
This term is crucial in simulating the behavior of weak rock masses in the fields with aquifer, oil reservoirs, and geothermal fields. Fluid pressures can significantly influence deformation and failure mechanism of weak rock masses [6].
2.1.3. Directional Dependence of Deformation
Weak rock masses often exhibit anisotropic behavior due to geological features such as bedding planes, joints, and foliation. The model accounts for this by introducing a cosine function ( where represents the direction of applied stress and denotes the intrinsic orientation of the rock fabric. This term allows the model to simulate preferred failure directions, accurately representing how weak rock formations deform under external loads. By capturing the angular dependence of stress interactions, the model provides a more realistic representation of deformation patterns observed in weak rock masses [7,8].
2.1.4. Stress-Dependent Cyclic Behavior and Fatigue Effects
The fourth component of the model incorporates stress-dependent cyclic behavior, capturing the nonlinearity of strain accumulation under repeated loading conditions. This is achieved using a sinusoidal function (δ, where (δ) represents an amplitude parameter, and the exponent controls the degree of cyclic hardening or softening. This formulation enables the model to simulate time-dependent effects, including cyclic hardening/softening, where rock stiffness evolves over repeated loading cycles, and fatigue behavior, where progressive damage accumulates under fluctuating stress conditions leads to eventual failure. The latter component is particularly relevant in cases where weak rock masses are subjected to vibrations, seismic activity, or repeated mechanical loading [9].
2.1.5. Stress-Dependent Softening and Hardening
The final term in the model introduces an exponential function to account for stress-dependent softening and hardening behaviors. This term is expressed as follows:
where (λ) is a material-dependent constant that dictates the magnitude of stress-related softening. This formulation is widely used in modeling viscoelastic relaxation, strain localization, and compaction behaviors observed in weak rock formations. The exponential decay function allows the model to capture long-term material behavior, ensuring that deformation responses remain realistic even under extreme loading conditions [8,10].
2.1.6. Thermal Effect
Temperature fluctuations can cause thermal expansion or contraction within the rock mass. The model includes a term to account for thermal strains induced by temperature changes (ΔT), which are particularly relevant in geothermal environments and deep underground engineering. However, in practical applications, temperature effects on rock behavior extend beyond uniform expansion and contraction. The model will be further enhanced by incorporating the following parameters: (1) temperature gradients during heat conduction, which affect the rate and depth of thermal diffusion; (2) temperature-dependent variations in the coefficient of thermal expansion (CTE) of different rock types, which influence stress redistribution and deformation; and (3) thermo-mechanical coupling effects, where thermal fluctuations alter stress anisotropy and mechanical response. Future model refinements will integrate transient heat conduction equations (Fourier’s Law) and advanced constitutive relationships to capture these temperature-related complexities more accurately [11]. Thermal stimulation techniques have also been investigated to enhance fluid flow and permeability in such reservoirs, as seen in the case study of Krafla volcano in Iceland [12]. Moreover, testing has shown how heat conduction and thermal expansion affect rock fracturing and deformation in these dynamic environments [13]. Finally, the role of heating and quenching cycles in altering rock mass permeability has been a significant focus in thermal-mechanical studies [14].
2.2. Monte Carlo Simulation
To capture the probabilistic behavior of weak rock masses under varying conditions, a Monte Carlo simulation was employed. This approach allows for the assessment of how uncertain parameters, such as stress components and environmental factors, influence rock mass response. The application of Monte Carlo methods has been shown to effectively model rock mass variability and tunnel squeezing problems, providing insights into potential deformations under different scenarios [15]. Additionally, research has demonstrated how correlative recognition of rock mass parameters can be used to analyze tunnel displacements probabilistically [16]. Spatial variability considerations have also been incorporated into slope stability assessments for weak rock masses, enhancing the reliability of such simulations [17].
- 1.
- Simulation setup
A total of 1000 simulations were conducted for each rock type, providing statistically significant results. Key input variables, including vertical stress (σv), pore pressure (P), and temperature change (ΔT), were treated as random variables and modeled using Weibull distributions to represent the inherent variability and uncertainty in the rock properties.
- 2.
- Parameter distributions
Parameters were sampled from predefined ranges based on geological data and existing literature. Weibull distributions, characterized by shape and scale parameters, were employed for each variable to reflect the natural variability in rock properties. Additionally, the angular distribution of structural planes (θi) was modeled using a uniform distribution to capture the randomness in the orientation of rock material [18].
- 3.
- Rock types simulated
Five different rock types were simulated: claystone, mudstone, sandstone, shale, and siltstone. For each type, the model incorporated factors such as stress anisotropy, pore pressure, deviatoric stress, and temperature effects, with the total strain calculated using the constitutive model developed in Section 2.1. The model equation is expressed as follows: is the vertical stress, is the pore pressure, and are the maximum and minimum horizontal stresses, is the orientation angle, is the temperature change, is the mean stress, is the mean yield stress, and is the initial mean stress.
2.3. Weibull Distribution Application
The application of the Weibull distribution allowed for capturing the heterogeneity and variability in the geological properties of each rock type. The shape and scale parameters of the distribution were chosen based on available geological data and were tailored for each rock type to accurately reflect their unique characteristics. This method enabled realistic modeling of mechanical behaviors across various conditions.
2.3.1. Over-Simplification of Variability
The Weibull distribution is commonly used to represent the variability in rock properties due to its flexibility and ability to model a wide range of failure probabilities. However, relying solely on Weibull distributions can oversimplify the inherent heterogeneity of geological materials. In complex rock formations where non-Weibull behavior is observed, this can lead to inaccurate predictions of rock failure or deformation. Consequently, engineers might under- or overestimate the stability of slopes or underground excavations, impacting safety and project costs.
2.3.2. Failure to Capture Complex Geological Features
Weak rock masses often exhibit anisotropic and nonlinear behavior due to structural features like joints and bedding planes. While Weibull distributions can model variability to some extent, they may not fully capture these complex directional dependencies. For example, in scenarios like tunnel construction in anisotropic rock formations, this limitation could result in models that inadequately predict deformation patterns, leading to design failures or unforeseen structural reinforcements.
Impact on Monte Carlo Simulations: The Monte Carlo simulations in the paper use Weibull distributions to incorporate variability in stress conditions and material properties. If the underlying assumption of Weibull-distributed parameters does not hold true, the probabilistic outcomes of these simulations could misrepresent reality. This is critical for high-stakes engineering projects, such as the development of geothermal reservoirs or mining operations, where precise prediction of rock behavior under stress is essential for safety and efficiency.
Statistical Uncertainty in Predictions: The paper mentions that the model’s statistical validation showed high congruence between simulated and experimental data. However, reliance on Weibull distributions might still introduce biases or errors in predictions, especially under extreme conditions or when simulating rare events. In risk-sensitive scenarios, like assessing the potential for catastrophic rock bursts or collapse in mines, this statistical uncertainty could have significant ramifications.
Limited Applicability Across Rock Types: Since rock properties vary widely among different geological formations, the Weibull distribution parameters must be carefully calibrated for each rock type. Failure to do so could make the model less generalizable, limiting its usefulness in regions with diverse geological settings. This could restrict the model’s application and require additional testing and recalibration, which may be time-consuming and resource-intensive.
3. Results and Discussion
The constitutive model developed in this study was applied to different rock masses including siltstone, claystone, mudstone, sandstone, and shale. The simulations were conducted using Monte Carlo methods, incorporating Weibull, log-normal, and normal distributions to account for variability in material properties. To ensure the reliability of the proposed model, a thorough comparison between the generated data from simulations and experimental data was performed. The primary goal of this validation process is to assess whether the simulated data, which are derived from three different distributions, accurately represent the experimental outcomes for each rock type. In this regard, both statistical and visual analyses were performed to evaluate the congruence between the two datasets.
3.1. Validation Methodology
The validation was conducted using both statistical and visual methods. First, the Weibull distribution was fitted to the experimental data to estimate its shape and scale parameters. The synthesized data were then generated for each rock type. Furthermore, to statistically assess the similarity between generated and experimental data, we employed the Kolmogorov–Smirnov test, a non-parametric statistical test used to determine whether two datasets differ significantly. In this test, a high p-value (higher than 0.05) was considered to indicate no significant difference between the two distributions.
Additionally, we employed histograms and quantile–quantile (Q–Q) plots to visually compare the distributions of the experimental and generated data.
3.2. Statistical Validation and Distribution Analysis
The comparison between generated and experimental data using different statistical distributions has provided new insights into the behavior of rock masses. By using the Kolmogorov–Smirnov test and analyzing quantile–quantile (Q–Q) plots and histograms, we can obtain a more refined evaluation of the model’s performance for each rock type.
The Kolmogorov–Smirnov test revealed no statistically significant difference between the empirical and simulated deformation distributions for all rock types. The high p-values obtained from the test indicate a failure to reject the null hypothesis (Table 1). This implies that the observed differences between the experimental and simulated data could have arisen by chance alone. Therefore, the statistical analysis supports the conclusion that the model accurately represents the deformation behavior of the tested rock types. While the Kolmogorov–Smirnov (KS) test is a useful non-parametric method for comparing distributions, its sensitivity can be limited when applied to large datasets (n > 5000) or distributions with heavy tails. In such cases, the KS test may fail to detect subtle yet important differences. Therefore, for a more robust assessment, particularly when dealing with large sample sizes or heavy-tailed distributions, the Anderson–Darling test is recommended. This test offers increased sensitivity to discrepancies in the tails of the distributions, providing a more comprehensive evaluation of the goodness of fit.

Table 1.
Kolmogorov–Smirnov test results for three different distributions [19].
Table 2, Table 3 and Table 4 show the mean and standard deviation of the simulated data were also closely aligned with those of the experimental data, further supporting the robustness of the model [20].
Table 2.
Mean deformation and standard deviation for experimental and synthetic data for normal distribution for Weibull distribution [19].
Table 3.
Mean deformation and standard deviation for experimental and synthetic data for normal distribution [19].
Table 4.
Mean deformation and standard deviation for experimental and synthetic data for log-normal distribution [19].
The statistical analysis showed that the Weibull distribution generated the most reliable results. The Kolmogorov–Smirnov (KS) test demonstrated consistently high p-values across all rock types (e.g., claystone: 0.60, shale: 0.91), indicating that the Weibull distribution effectively captures the variability and heterogeneity inherent in weak rock masses.
In comparison, the log-normal distribution exhibited intermediate performance. It produced reasonably high p-values for some rock types, such as claystone (0.81), but demonstrated poorer alignment for others, like siltstone, where the p-value decreased to 0.12. This suggests that while the log-normal distribution is adequate for certain cases, it is less universally applicable than the Weibull distribution.
On the other hand, the normal distribution showed the least consistent performance, with lower p-values for several rock types (e.g., claystone: 0.019), indicating a poor fit in many scenarios. This highlights the limitations of using the normal distribution for modeling the complex behavior of weak, heterogeneous rock masses.
The observed high standard deviations in the deformation measurements could be attributed to several factors inherent to both the experimental methodology and the intrinsic properties of the rock samples:
3.3. Material Heterogeneity
Rock types such as sandstone and mudstone exhibit significant heterogeneity in their physical and mechanical properties, including porosity, grain size, and mineral composition. This inherent variability, even within the same lithological classification, leads to a wide range of deformation behaviors under stress, contributing to the observed high standard deviations.
3.4. Variable Uniaxial Compressive Strength (UCS)
The wide range of UCS values for each rock type (e.g., 20–100 MPa for sandstone) further contributes to the variability in deformation response. The inherent strength variability within each rock type influences how individual samples deform under load, resulting in a broader distribution of measured deformation values [19].
3.5. Experimental Uncertainties
Experimental measurements on natural materials like rocks are inherently subject to variability. Factors such as sample preparation techniques, testing conditions, and measurement errors can all contribute to the observed standard deviations. For instance, the high standard deviation (7.65) in the experimental deformation values for sandstone likely reflects the unpredictable behavior of real rock samples under stress.
3.6. Simulation-Induced Variability
In the synthetic data generated by Monte Carlo simulation using the Weibull distribution, the variability in input parameters, such as UCS and other rock properties, propagates through the simulation, leading to variability in the output deformation values. This effect is amplified when input parameters have wide distributions or significant uncertainty. For example, the high standard deviation in the simulated deformation of sandstone can be attributed to the wide range of UCS values and the inherent variability of this rock type.
Sandstone: Exhibits the highest standard deviation due to a combination of factors, including a wide range of porosities, grain structures, and UCS values. These factors contribute to different deformation behaviors in different sandstone samples.
Mudstone: While exhibiting lower variability compared to sandstone, mudstone still shows a relatively high standard deviation, likely due to its fine-grained structure and variations in clay content.
Siltstone and Shale: These rock types have lower standard deviations compared to sandstone. However, variability in their structure and mineral content remains notable, contributing to the observed spread in deformation measurements.
In summary, the high standard deviations, particularly in the experimental data collected from the literature, are a consequence of the natural heterogeneity of the rock types (including the effect of microfractures, grain boundaries, and pore spaces), the wide range of UCS values, potential experimental uncertainties. The synthetic data, while exhibiting lower standard deviations due to controlled simulation environments, still reflect the inherent variability in rock properties and their influence on deformation behavior.
3.7. Visual Analysis
The histograms in Figure 1 provide a visual comparison of the density distributions for the simulated and experimental data for different rock masses using three different distributions. As observed, the histograms for both datasets generated by Weibull distribution overlap significantly, indicating that the generated data mirror the experimental results for each rock type, whereas normal and log normal distributed data often showed discrepancies. The y-axis represents probability density, normalized for comparative analysis. A higher density at a given deformation value (x-axis) indicates that it occurs more frequently in the dataset. The Weibull distribution shows the best fit, as it captures the extreme values and skewed nature of weak rock mass deformation, while the normal distribution fails to represent the asymmetric nature of failure mechanisms.
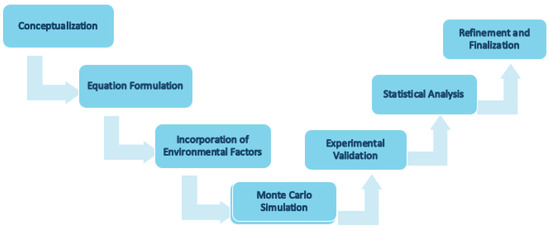
Figure 1.
Rock mass simulation workflow.
Furthermore, the Q–Q plots show that the quantiles of the data generated by the Weibull distribution align closely with the quantiles of the experimental data illustrated in Figure 2. This visual alignment confirms that the simulated data follow the same distribution as the experimental data, further validating the accuracy of the model. However, the normal distribution showed the most divergence, reinforcing the need for alternative distributions when modeling a weak, anisotropic rock.
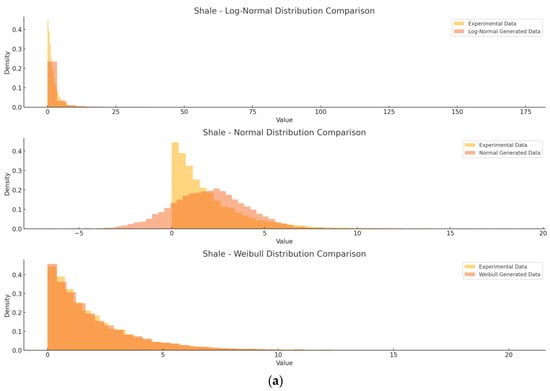
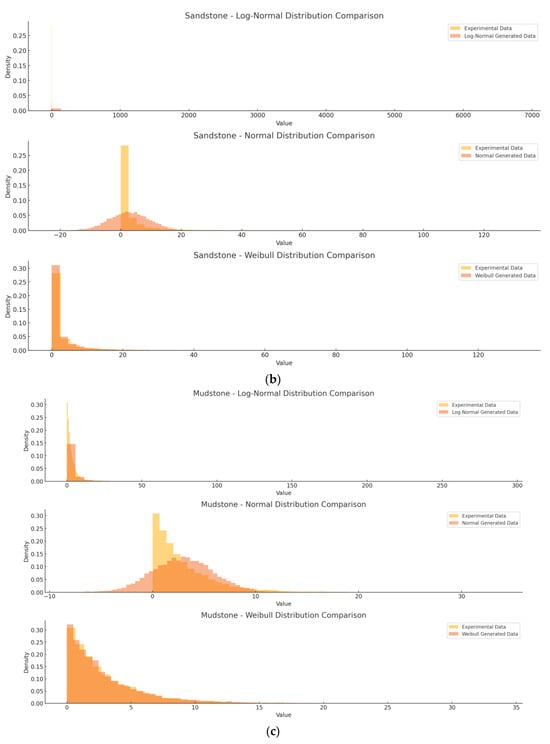
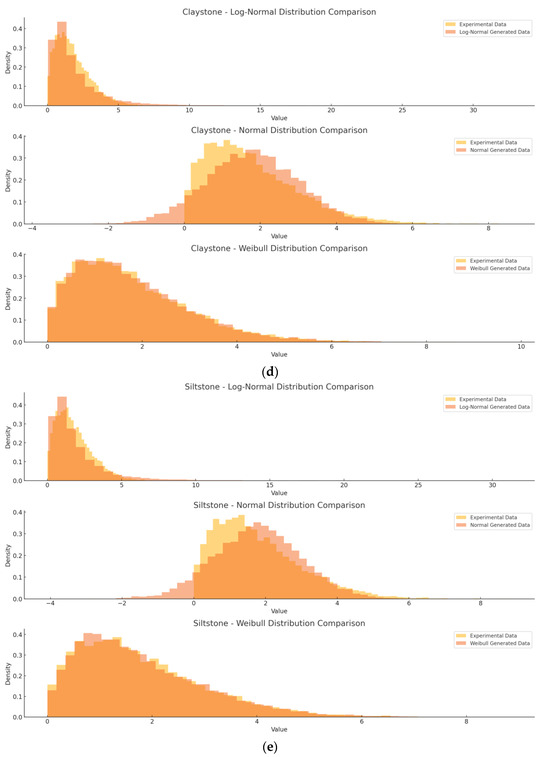
Figure 2.
Comparison of experimental and generated data for different weak rock types using three different distributions. (a) Shale; (b) Sandstone; (c) Mudstone; (d) Claystone; (e) Siltstone.
In Figure 3, the consistent alignment between the experimental and Weibull distribution-generated data, as indicated by both statistical tests and visual analysis, provides strong evidence for the reliability of the proposed constitutive model. The high p-value from the Kolmogorov–Smirnov test and the close agreement between the histograms and Q–Q plots suggest that the model accurately replicates the behavior of the experimental data across various rock types. These findings suggest that the model can be reliably used for predicting the strain behavior of rock formations under given conditions.
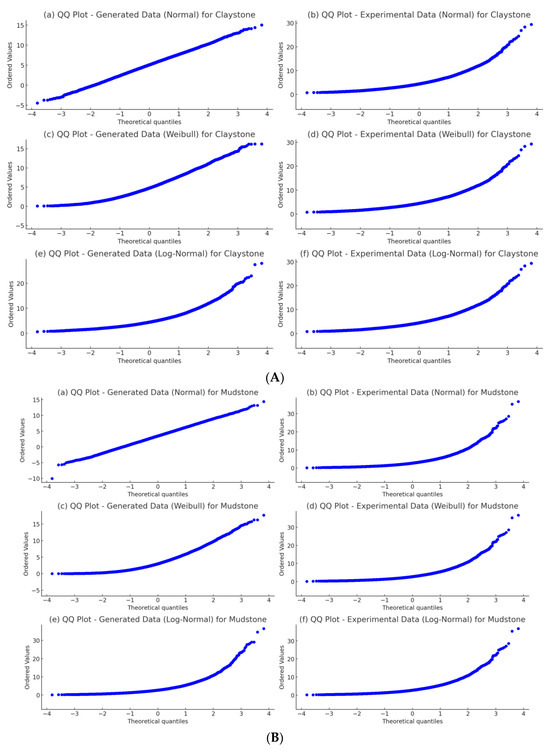
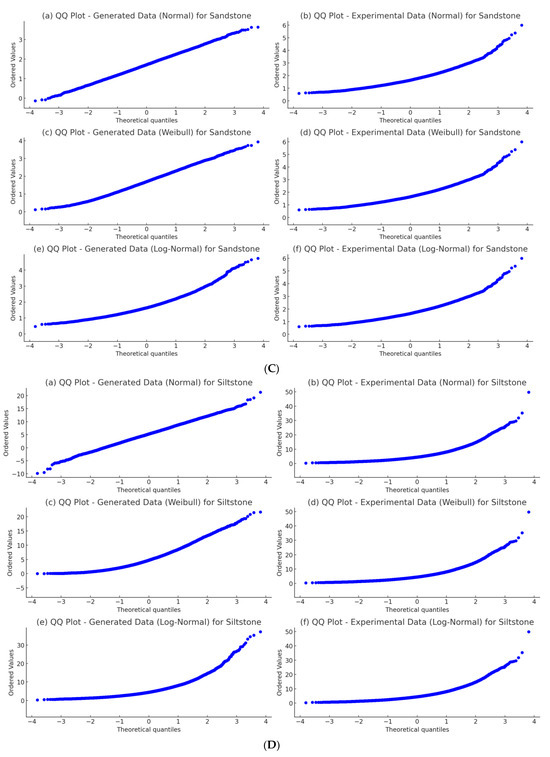
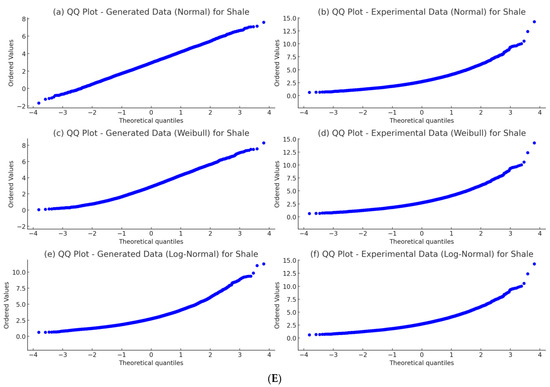
Figure 3.
Q–Q plot for generated data (a,c,e); Q–Q plot for experimental data (b,d,f). (A) Claystone; (B) Mudstone; (C) Sandstone; (D) Siltstone; (E) Shale.
3.8. Practical Applications and Advantages
The newly developed constitutive model provides a significant advancement over existing approaches. By integrating stress anisotropy, pore pressure, and environmental factors, it offers a more holistic simulation that is crucial for weak rock masses. Previous research has often fallen short of addressing these interactions comprehensively. For instance, Hajiabdolmajid (2020) [2] and Nguyen (2022) [5] provided insights into stress anisotropy and pore pressure effects, respectively, but did not integrate these factors with temperature changes and probabilistic variability as comprehensively as our model does.
Our model’s predictive strength is demonstrated through high congruence between simulated and experimental data and supported by statistical validation methods, such as the Mann–Whitney U test. The absence of significant differences between datasets emphasizes the reliability of our approach, making it a valuable tool for engineers who require robust predictions under variable field conditions. Additionally, the model’s capacity to handle high variability, especially for hard rock types with extensive ranges of unconfined compressive strength (UCS), further enhances its utility across a broader spectrum of geological scenarios.
3.9. Enhanced Constitutive Model for Simulating Thermomechanical Behavior of Weak Rock Masses
This constitutive model presents several key advancements over existing approaches for simulating the behavior of weak rock masses:
Incorporation of Thermal Effects: Unlike previous models, such as that proposed by Bruning et al. (2018) [1], which focused primarily on the influence of deviatoric stress, this model explicitly incorporates thermal strain effects. This enhancement is crucial for accurately representing the thermomechanical behavior of rock masses in geothermal reservoirs and other high-temperature environments. While the model effectively simulates stress anisotropy, pore pressure effects, and temperature-induced deformations in weak rock masses, further refinements are required to enhance its thermal modeling capabilities. The model currently assumes uniform temperature variations, but real-world scenarios involve non-uniform temperature gradients, variations in thermal properties across rock formations, and heat transfer effects. The role of heat conduction localized thermal expansion, and thermo-mechanical interactions will be studied in future research. Incorporating these factors will improve the accuracy of the model in applications such as geothermal energy extraction, deep underground tunneling, and high-temperature rock mechanics.
Probabilistic Framework: Recognizing the inherent heterogeneity and variability in rock mass properties, this model employs a Monte Carlo simulation framework. This approach, absent in previous studies such as those by Zhao et al. (2016) [8], enables a more realistic and statistically grounded representation of rock mass behavior by capturing the uncertainty associated with material properties and their impact on deformation.
Balance of Complexity and Usability: This model strikes a balance between capturing the complex thermomechanical behavior of weak rock masses and maintaining practicality for engineering applications. While incorporating advanced constitutive relationships and probabilistic methods, the model remains computationally tractable and accessible to practitioners. This balance ensures that the model can be readily employed for reliable predictions of weak rock mass deformation in a variety of engineering scenarios.
Limitations of the Model
Despite its strengths, our model does have limitations. The reliance on Weibull distributions to represent variability may not capture all the nuances of geological heterogeneity, particularly in cases where rock properties exhibit non-Weibull behavior. Additionally, while the model includes anisotropy and temperature effects, it does not yet consider chemical weathering or the long-term aging of rock masses, which could influence mechanical properties over time. Further research is needed to refine these aspects and explore the impact of these additional factors on rock behavior.
It is important to note that while our model excels in simulating weak rock masses, it is not suitable for hard rock scenarios. The underlying assumptions and parameters, optimized for low-strength and high-deformability conditions, may not capture the mechanical behavior of hard rocks with high unconfined compressive strengths. This limitation is intentional, reflecting our model’s purpose of providing the best possible predictive capabilities for weak rock masses. Engineers dealing with hard rock formations should consider alternative models specifically designed for those conditions.
Future Work
Based on the findings of this study, several areas of future research are identified to further enhance the applicability and accuracy of the proposed constitutive model for weak rock masses:
Expand Distributions Tested: Incorporate additional statistical models such as the Gamma and generalized Pareto distributions to better capture the variability in rock properties and improve the accuracy of probabilistic simulations.
Time-Dependent Analysis: Extend the model to include creep behavior and chemical weathering effects, which are critical for long-term deformation predictions in weak rock masses.
Sensitivity Studies: Conduct sensitivity analyses to determine the most influential parameters affecting the mechanical behavior of weak rock formations and refine the model accordingly.
Validation with Diverse Rock Types: Apply the constitutive model to a wider range of weak and strong rock formations to evaluate its robustness across different geological conditions.
Particle Size Effects: Investigate the role of particle size distribution in weak rock mass behavior, particularly in relation to fracture propagation and failure mechanisms.
Applying Finite Element Method (FEM): Implement FEM-based simulations to improve model precision and validate results with numerical approaches commonly used in geotechnical engineering.
Investigate the Effect of Coupled Parameters: Study the interaction between stress anisotropy, pore pressure, temperature effects, and strain localization to develop a more comprehensive model that captures complex geological behaviors.
These future directions will significantly enhance the predictive capability, reliability, and practical implementation of the model in geomechanical applications such as mining, tunneling, and geothermal energy projects.
Improving Thermal Simulation in Weak Rock Masses:
Temperature Gradients: Future research will integrate transient heat conduction models to simulate spatial temperature variations and heat transfer within rock masses.
Variable Thermal Expansion Coefficients: Different rock types exhibit nonlinear changes in thermal expansion coefficients at elevated temperatures. The model will be refined to capture these variations based on experimental data.
Thermo-Mechanical Coupling: Studies will focus on how temperature changes affect stress anisotropy, deformation mechanisms, and failure behavior.
Experimental Validation: Laboratory experiments will be conducted to measure rock deformation under controlled heating and cooling cycles, improving model calibration for geothermal and deep mining applications.
Parameter Sensitivity Analysis for Model Optimization:
Global Sensitivity Analysis: Future studies will employ variance-based methods such as Sobol’ indices and Morris screening to quantify parameter influence on model outputs.
Local Sensitivity Analysis: Small perturbations will be applied to stress anisotropy, pore pressure, and material variability parameters to assess their impact on deformation behavior.
Machine Learning-Based Sensitivity Assessment: SHAP values and feature importance analysis from random forest models will be explored to understand nonlinear parameter interactions.
Experimental Validation: Sensitivity rankings will be compared with laboratory and field data to ensure that the most critical parameters are correctly weighted in model calibration.
4. Conclusions
The constitutive model developed in this study, coupled with Monte Carlo simulation techniques, provides a robust framework for simulating the behavior of weak rock masses. By incorporating key factors such as stress anisotropy, pore pressure effects, deviatoric stress, and temperature changes, the model effectively captures the complex mechanical responses of various rock types.
The model was validated through both statistical and visual methods. While the Weibull-generated data demonstrate strong alignment with experimental observations, deviations in the normal and log-normal fits suggest that weak rock mass deformation exhibits non-Gaussian characteristics. The Kolmogorov–Smirnov test confirms that the Weibull distribution provides the best statistical fit; however, additional calibration may be required to improve alignment with the extreme values observed in the experimental data. High p-values from the Kolmogorov–Smirnov test and close alignment in histograms and Q–Q plots suggest that the model can accurately replicate the observed behavior of rock masses. Furthermore, the incorporation of Weibull distributions for parameter variability ensures that the model accounts for the inherent heterogeneity in rock properties, making it a reliable tool for predicting the behavior of weak rock formations. The results obtained from this model have significant implications for engineering applications, particularly in fields such as oil reservoir development, geothermal energy, and the management of aquifers, where the accurate simulation of weak rock behavior is critical.
Author Contributions
A.A. conducted the literature review and wrote the initial draft of the manuscript. M.M. revised and edited the manuscript. All authors have read and agreed to the published version of the manuscript.
Funding
This research received no external funding.
Data Availability Statement
The data presented in this study are available in [J. Jeagers], reference number [18].
Conflicts of Interest
The authors declare no conflicts of interest.
References
- Bruning, T.; Karakus, M.; Akdag, S.; Nguyen, G.D.; Goodchild, D. Influence of deviatoric stress on rockburst occurrence: An experimental study. Int. J. Min. Sci. Technol. 2018, 28, 763–766. [Google Scholar] [CrossRef]
- Hajiabdolmajid, V.; Kaiser, P.; Martin, C. Modelling brittle failure of rock. Int. J. Rock Mech. Min. Sci. 2002, 39, 731–741. [Google Scholar] [CrossRef]
- Wang, S.Y.; Sloan, S.W.; Fityus, S.G.; Griffiths, D.V.; Tang, C.A. Numerical Modeling of Pore Pressure Influence on Fracture Evolution in Brittle Heterogeneous Rocks. Rock Mech. Rock Eng. 2012, 46, 1165–1182. [Google Scholar] [CrossRef]
- Azadi, A.; Momayez, M. Review on Constitutive Model for Simulation of Weak Rock Mass. Geotechnics 2024, 4, 872–892. [Google Scholar] [CrossRef]
- Nguyen, N.T. Analysis of Permeability Evolution due to Compaction Localisation in Porous Reservoir Rocks. Master’s Thesis, The University of Adelaide South Australia, Adelaide, SA, Australia, 2021. [Google Scholar]
- Zhang, S.; Ma, X. How Does In Situ Stress Rotate Within a Fault Zone: Insights from Explicit Modeling of the Frictional, Fractured Rock Mass. J. Geophys. Res. Solid Earth 2021, 126, e2021JB022348. [Google Scholar] [CrossRef]
- Zhu, B.; Wu, Q.; Yang, J.; Cui, T. Study of pore pressure change during mining and its application on water inrush prevention: A numerical simulation case in Zhaogezhuang coalmine, China. Environ. Earth Sci. 2014, 71, 2115–2132. [Google Scholar] [CrossRef]
- Tiwari, R.P.; Rao, K.S. Response of an Anisotropic Rock Mass Under Polyaxial Stress State. J. Mater. Civ. Eng. 2007, 19, 393–403. [Google Scholar] [CrossRef]
- Zhao, N.; Jiang, H. Mathematical methods to unloading creep constitutive model of rock mass under high stress and hydraulic pressure. Alex. Eng. J. 2021, 60, 25–38. [Google Scholar] [CrossRef]
- Wu, F.; Wu, J.; Bao, H.; Li, B.; Shan, Z.; Kong, D. Advances in statistical mechanics of rock masses and its engineering applications. J. Rock Mech. Geotech. Eng. 2021, 13, 22–45. [Google Scholar] [CrossRef]
- Li, X.; Gong, F.; Tao, M.; Dong, L.; Du, K.; Ma, C.; Zhou, Z.; Yin, T. Failure mechanism and coupled static-dynamic loading theory in deep hard rock mining: A review. J. Rock Mech. Geotech. Eng. 2017, 9, 767–782. [Google Scholar] [CrossRef]
- Parsokhonov, A. Renewable Energy Source from Natural Thermal Expansion and Contraction of Matters. Am. Sci. Res. J. Eng. Technol. Sci. 2016, 23, 121–130. [Google Scholar]
- Eggertsson, G.; Lavallée, Y.; Kendrick, J.; Markússon, S. Improving fluid flow in geothermal reservoirs by thermal and mechanical stimulation: The case of Krafla volcano, Iceland. J. Volcanol Geotherm. Res. 2020, 391, 106351. [Google Scholar] [CrossRef]
- Zhao, J. Geothermal testing and measurements of rock and rock fractures. Geothermics 1994, 23, 215–231. [Google Scholar] [CrossRef]
- Siratovich, P.A.; Villeneuve, M.C.; Cole, J.W.; Kennedy, B.M.; Bégué, F. Saturated heating and quenching of three crustal rocks and implications for thermal stimulation of permeability in geothermal reservoirs. Int. J. Rock Mech. Min. Sci. 2015, 80, 265–280. [Google Scholar] [CrossRef]
- Hoek, E.; Marinos, P. Predicting tunnel squeezing problems in weak heterogeneous rock masses. Tunn. Tunn. Int. 2006, 32, 45–51. [Google Scholar]
- Zheng, M.; Li, S.; Zhao, H.; Huang, X.; Qiu, S. Probabilistic analysis of tunnel displacements based on correlative recognition of rock mass parameters. Geosci. Front. 2021, 12, 101136. [Google Scholar] [CrossRef]
- Jaeger, J.C.; Cook, N.G.W.; Zimmerman, R.W. Fundamentals of Rock Mechanics, 4th ed.; Blackwell Publishers: Maiden, MA, USA, 2007. [Google Scholar]
- Zhang, L. Engineering Properties of Rocks; Butterworth-Heinemann: Oxford, UK, 2016. [Google Scholar]
- Hsu, S.-C.; Nelson, P.P. Material Spatial Variability and Slope Stability for Weak Rock Masses. J. Geotech. Geoenviron. Eng. 2006, 132, 183–193. [Google Scholar] [CrossRef]
Disclaimer/Publisher’s Note: The statements, opinions and data contained in all publications are solely those of the individual author(s) and contributor(s) and not of MDPI and/or the editor(s). MDPI and/or the editor(s) disclaim responsibility for any injury to people or property resulting from any ideas, methods, instructions or products referred to in the content. |
© 2025 by the authors. Licensee MDPI, Basel, Switzerland. This article is an open access article distributed under the terms and conditions of the Creative Commons Attribution (CC BY) license (https://creativecommons.org/licenses/by/4.0/).