Article

Finite-Difference Analysis of Influence of Borehole Diameter and Spacing on Reduction in Rockburst Potential of Burst-Prone Coal Seams

Institute of Strength Physics and Materials Science of Siberian Branch of Russian Academy of Sciences, Laboratory of Mechanics of Heterogeneous Media, 8/2 Akademicheskii Pr., Tomsk 634055, Russia
*
Author to whom correspondence should be addressed.
Mining 2024, 4(4), 1058-1074; https://doi.org/10.3390/mining4040058
Submission received: 8 October 2024 / Revised: 25 November 2024 / Accepted: 29 November 2024 / Published: 2 December 2024

Abstract

Decreasing the rockburst potential in longwall mining of burst-prone coal seams has been a longstanding challenge for geotechnical engineering worldwide. One of the effective approaches is drilling of relief boreholes in front of the coal seam face from the airways. This work presents a novel approach based on the integral rockburst factor ( K I r b ) taking account of the length of the dynamic abutment stress influence zone and the ratio of the vertical stress to the remote field virgin stress. The geotechnical conditions of seam 3 of the Alardinskaya mine (Kuznetsky basin, Russia) are taken as a study site. An approach of the finite-difference continuum damage mechanics is employed to describe the processes of deformation and fracture of coal and host rocks using an in-house software. The results indicate that the abutment stress maximum shifts deep into the seam after drilling and that the stress distribution along the coal seam horizon is a superposition of the solutions similar to those of the elastoplastic Kirsch problem. The results also indicate that the curves of K I r b dependence on spacing between the boreholes and their diameter are nonlinear and non-monotonic functions, which allows for optimizing of the drilling technology.

1. Introduction

The depletion of shallow coal reserves has led to an annual increase in mining depths over the past 10–15 years. The mining operations at great depths are clearly associated with a higher probability of rock and gas bursts [1]. For instance, in the mines of the Kuznetsky coal basin, Russia, Siberia (Kuzbass), most of the developed seams, starting from a depth of 300 m, are classified as rockburst-prone sites due to sudden bursts of coal and gas [2]. At the same time, the statistics in mines and tunnels indicate that these dangerous dynamic phenomena obey the power laws [3], which makes it hardly possible to predict the exact time of their occurrence.
For this reason, methods are being developed for safer mining operations in the seams prone to rockbursts and sudden gas bursts (e.g., [4]). As part of ensuring the geodynamic safety of mining operations, measures are taken to relieve the accumulated energy and provide timely degassing on an ongoing basis. For example, drilling of relief and degassing boreholes is one of the local measures to prevent dynamic phenomena (DP) in mines [5]. Despite a number of problems associated with the use of the method, for example, a deviation of the actual borehole trajectory from its design path [6] or an excessive stress relief effect, leading to a significant loss of strength of the surrounding rocks [7], etc., this method is used in mines around the world. This is evidenced by the growing number of works on the analysis of stress and strain variations around boreholes and their redistribution in the vicinity of the workings. For instance, Zhang et al. [8] proposed a new method for while-drilling monitoring of the drilling depth, abutment pressure distribution, and pressure relief effect. The system is based on the microseismic monitoring of the vibration signals. Clustering of vibration signals is useful for the supervision of the drilling workload. Meanwhile, the number of coal vibration events reflect the pressure relief effect.
Gao et al. [1] studied the influence of rock mass joints on displacements and redistribution of stress around the borehole based on the boundary element model. Authors demonstrated the maximum displacement shifting from the boundary of the borehole to the far field, revealing several regularities of the von Mises stress redistribution with respect to joint orientation. Chen et al. [9] studied the influence of drilling depth and borehole position on the destressing of the rock massif surrounding a rectangular cavern. Relying on the comprehensive numerical study, optimal drilling regimes were proposed, which ensure the drilling technology effectiveness—a lower abutment stress and shifting of the damage zone to the borehole periphery. Quite similar results were obtained by Cui et al. [10], who also demonstrated the efficiency of destressing the coal seam using the borehole technology. The authors also analyzed the optimal spacing between the boreholes, relying on the analysis of stress, strain, stored energy and displacement. It was found that first, the borehole diameter should be increased, and then, the spacing should be adjusted. Gu et al. [7] considered the segmented enlarged-diameter borehole destressing technology. Based on the FLAC 3D numerical study, they found the optimal length of the boreholes and the spacing between them which ensures the necessary pressure relief effect and prevents an excessive strength loss of the surrounding rocks. Chen et al. [11] presented the results of a laboratory study of the sample failures under the condition of borehole reaming. Based on the experimental study of biaxial compression of the samples, they illustrated the influence of a large-diameter reaming part of the borehole on the pressure relief behavior. The reaming part of the borehole enhances the stress redistribution in the sample bulk and the pressure relief effect. Nian et al. [12] presented the results of a numerical study of the pressure relief effect, shape of the damage zone and permeability enhancement around the large-diameter boreholes (100–350 mm). Authors demonstrated an expansion of failure zone around the boreholes with large diameters which positively correlated with the permeability enhancement.
The majority of studies of spacing and borehole diameter effect, reviewed in this work, focus on the local stress relief field and fracture network. Fewer studies provide an integral qualitative and quantitative characteristic of the technology [13]. In this regard, we focused on a numerical analysis of the spacing and borehole diameter influence on the stress relief effect using an example of the Alardinskaya mine, Kondomsky deposit (Kuznetsky basin, Russia). The new integral rockburst factor was proposed relying on the results of the finite-difference continuum damage mechanics approach in plain strain formulation.

2. Site Geology and Method

Seam 3 of the Alardinskaya mine was taken as a study site. According to the data reported elsewhere [14], seam 3 is rock- and gas-burst-prone below 300 m depth. The average depths of mining operations are about 520–640 m, i.e., almost 300 m deeper than the rockburst-prone horizon of seam 3. The seam in the considered part of the deposit exhibits dipping in the range of 2–12 degrees and is classified as a flat-dipping bed. Figure 1 illustrates the location and a simplified stratigraphy of the study site [15]. The roof and floor of the seam in question are mainly composed of siltstones and sandstones.
The in-situ observations of seismicity performed in 2011–2012 [2,16] revealed two strong rockbursts that resulted in protective pillar failure with methane emission into the airways. As a result of this failure, a decision was taken to drill the relief boreholes 115 m ahead of the face to decrease the abutment stress in the edge parts of the rock massif [2].
Figure 1. Study site [17] and simplified stratigraphy of coal-bearing strata in the vicinity of seams 1–6 of the Kondomsky deposit [15].
Mining 04 00058 g001
The finite-difference method was applied to solve the boundary-value problem [18]. Numerical modeling was performed using in-house software written in FORTRAN language incorporated by the MPI high-performance computing technology. A workstation based on a 64-core AMD Threadripper 3990 processor was used.

3. Math

For governing equations, the reader is referred to our earlier reported results [16,19,20,21].
Based on the simplified stratigraphy of the study site (Figure 1), one of the model assumptions was that the rocks are taken to be isotropic between the bedding planes. As an advantage, this model allows for the use of only two constants, namely the bulk and shear moduli, in the equation of state to determine the stress increments in each time step of the numerical integration. On the other hand, this assumption appears to be a model limitation, since natural rock mass discontinuities are quite common in underground mining, leading to a non-homogenous stress distribution. Therefore, the conclusions drawn below might need a certain correction if the natural discontinuities are included in the model.
In the next subsection, we focus on the equations for inelastic strains and fracture criterion. A discussion of equations applied to describe the inelastic behavior of rocks is necessary due to the fact that host rocks and coal seams generally exhibit quite large inelastic deformation and tend to fail during mining operations. The problem of formulation of constitutive equations for the rock behavior beyond the elastic limit is complex due to the non-holonomicity of the system of equations describing the inelastic deformations and the continuum fracture [22]. For this reason, we employ an incremental approach based on the theory of plasticity to describe the change in the strength properties of rocks in the course of inelastic deformation development.

3.1. Inelastic Deformation and Fracture

It is assumed that the total strain rate is a sum of elastic and inelastic strain rates
ε ˙ i j T = ε ˙ i j E + ε ˙ i j P
A slightly modified version (Equations (2) and (3)) of an original Drucker–Prager (DP) criterion [23] is employed as part of the constitutive response limiting the elastic behavior of rocks. An evolution of cohesion depends on the accumulated damage D according to Equation (4)
f ( σ i j , D ) = α P + τ Y
τ = J 2 = 1 2 S i j S i j
Y = Y 0 1 D .
Parameters α and Y in Equation (2) are expressed through the rock cohesion c and the internal friction angle ϕ of an original Mohr–Coulomb criterion [24]. For simplicity, we further refer to α as the internal friction factor and Y as the cohesion. P is the hydrostatic pressure.
The inelastic strain rate tensor components (Equation (5)) are defined based on the non-associated flow rule with a plastic potential (Equation (6)):
ε ˙ ij P = λ ˙ g σ i j
g ( σ i j ) = τ Λ P + c o n s t ,
wherein Λ is the dilatancy factor, c o n s t is the integration constant assuming that the plastic potential function might be plotted in any point of the yield surface containing the τ and P values.
The theory of continuum damage mechanics (CDM) was applied in this work to describe the rock fracture process [25,26,27]. Here, we used the following kinetic equation for the damage measure time derivative D ( σ i j , t ) :
d D d t = f 2 ( σ i j , D ) σ * 2 t * ,
wherein σ * is the constant stress level equal to the tensile strength for a negative pressure semi-space and to the compressive strength for a positive pressure semi-space, and t * is the model parameter controlling the damage accumulation rate, having the physical meaning of the characteristic time of the fracture incubation process. For further details of the model, the reader is referred elsewhere [16,28].
Let us turn to a geometrical interpretation of the yield envelope employed in this work. A review of the intact rock behavior [29] of more than 1000 samples revealed that the strength envelope (in σ 1 σ 3 stress space) generally has a parabolic shape cut (tensile cut-off) in the region of the negative minor principal stress. The Drucker–Prager conical surface has a single slope in the whole range of hydrostatic pressures. Therefore, we were unable to describe the rock behavior for certain stress state cases [24]. Consequently, we used here a piece-wise linear function having different slopes under negative and positive hydrostatic pressures (see Figure 2).
The stress paths in the elastic deformation stage are illustrated in Figure 2 by red, green and blue dashed lines. In the case of stress path No. 1, spalling takes place and the element is thought to be instantaneously fractured (D = 1). In the case of stress paths No. 2 and 3, inelastic deformation of a material point is initiated, in which case criterion (2) is met for the negative and positive semi-spaces, respectively. In the residual state, a distinct mesh element continues resisting the compressive stresses with a local strength of τ = α 2 P , but it does not resist the tensile stresses. The model parameters are summarized in Table 1; they were validated against the field data in the previous studies [16,19].
In Table 1, σt denotes the uniaxial tensile strength, σc stands for the uniaxial compressive strength, Y0 is the initial value of cohesion, ρ is density, K is bulk modulus, and μ is shear modulus.

3.2. Boundary and Initial Conditions

The following boundary conditions were applied to the computational domain:
(a)
normal displacements were restricted on the left, bottom and right boundaries;
(b)
σ y y stress tensor component was assigned a value of an overburden weight not considered explicitly in the structural model.
Figure 3 illustrates the designed structural models of the rock mass with an explicit consideration of the host rock bedding character. A red box points out the initial mining chamber location. The stope face moves towards the right side of the computational domain. The dimensions are also illustrated in Figure 3. The regular finite-difference mesh with a step of ≈30 cm is used to discretize the domain. The total number of mesh elements is 560 × 410. The seam bedding depth is 600 m. Due to the domain size limitations, an overburden weight of 480 m was implicitly assigned as the boundary condition. The initial rock mass state of the first computational domain corresponds to the gravitational stress–strain state.
The mesh step in a large computational domain is approximately 30 cm, which makes it impossible to consider the boreholes with a diameter smaller than the mesh step. For this reason, we additionally considered the second computational domain cut from the larger one to describe more accurately the boreholes and their influence. The smaller computational domain is illustrated in Figure 3b. The mesh step in the second computational domain is 3.6 cm, which allows for considering the borehole diameters in the range of 10–60 cm. The total number of mesh elements is 4480 × 1190. A white rectangle stands for the goaf of seam 3. Due to the domain size limitations, an overburden weight of ≈550 m was implicitly assigned as the boundary condition. The initial rock mass state of the second computational domain corresponds to the stress–strain state after the first caving of the roof and the stress recovery behind the stope face. A free-of-stress boundary condition is maintained inside the boreholes, i.e., all stress-tensor components are nullified, once the borehole is drilled.

4. Results and Discussion

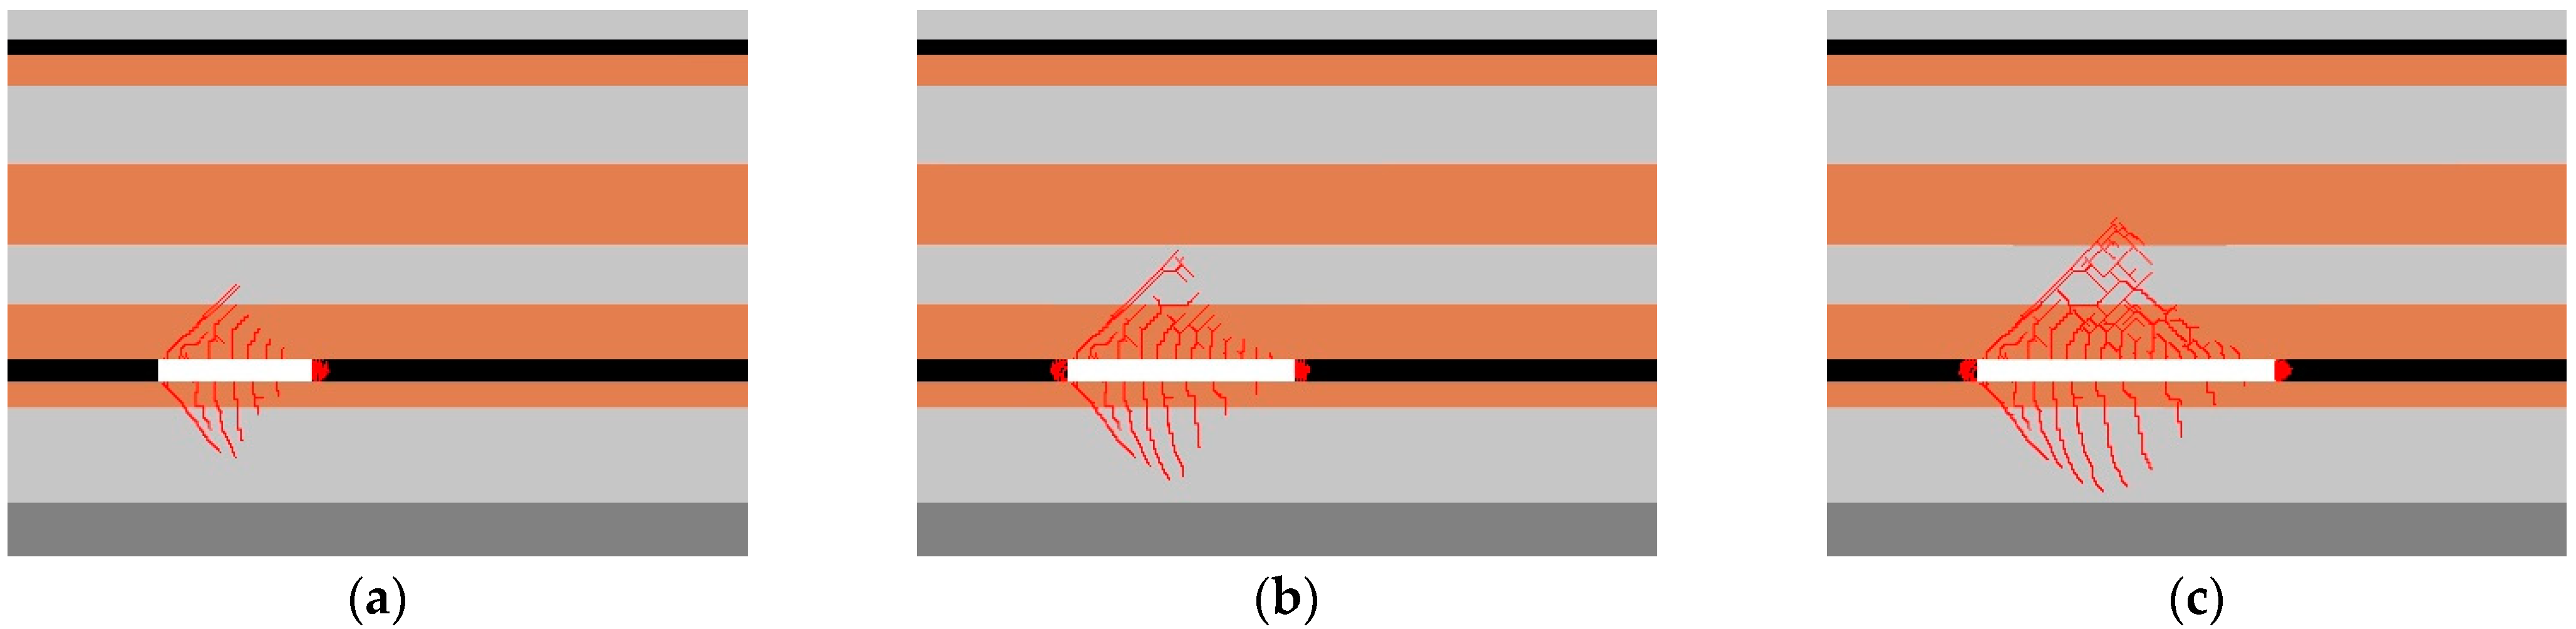
4.1. Common Patterns of Roof Damage Behavior

When modeling the methods for relieving the accumulated energy, the problem of the stress–strain evolution is solved in three stages. In the first stage, the problem of a roof collapse over the mined-out space is solved. Let us consider in more detail the damage accumulation evolution in the rock mass during the working face advancement along seam 3. The mined-out space is modeled by a successive increase in the free-of-stress region (white rectangular zone in Figure 4), i.e., all stress-tensor components in the elements belonging to this zone are nullified. A disturbance of the virgin stress of the rock mass surrounding the workings is accompanied by the formation of negative hydrostatic pressure zones both in the roof and the floor. At a certain moment, criterion (2) is met in some point of the roof or floor, which results in an inelastic strain development and a consequent damage accumulation in this point. As the mined-out space increases, criterion (2) is met in the next points of the roof or the floor, which leads to the formation of certain localized strain and accumulated damage patterns.
Figure 4 illustrates the patterns of accumulated damage in the roof and the floor of the rock mass combined with the structural model at different distances of the face advance. The damage zone height makes up about 0.6–0.7 of the first collapse step. Since the thickness of the mined seam is 3.6 m, the ratio of the height of the collapse dome to the thickness of the seam is approximately 10, which is in good agreement with many instrumental observations in mines worldwide [19,30,31,32].
Based on the obtained damage distributions in the roof of the seam, we can conclude that the roof collapse is caused by a mixed failure mechanism—there are both the subvertical cracks, mainly observed in the immediate roof, and the shear cracks—in the overlying layers. We can also observe that the first roof collapse occurs when the face advance distance is approximately 40 m, which correlates well with field observations for the Alardinskaya mine [16,19]. To sum up, the model adequacy is verified against the field data.

4.2. Modeling of the Goaf

Upon completion of the first stage of modeling, the obtained data are exported to the second step, where the problem of recovering the bearing capacity of rocks in the collapse area is solved. In this formulation, the key interest is the beginning of the overlying strata movement. After the initiation of the overlying strata movement behind the face, the bearing capacity is restored in the goaf due to the physical mechanism of compaction. The diagram of the abutment pressure development is shown in Figure 5a. Note that the strength recovery in the goaf was implicitly specified by means of the support pressure function, whose asymptote corresponds to the value of the remote vertical stress field observed at the computational domain boundary. The ratio of the vertical to the gravitational stress state of the virgin massif ahead of the face is ≈2. The accumulated damage distribution after the overburden subsidence and the strength recovery is illustrated in Figure 5b, the distribution of the von Mises stress is illustrated in Figure 5c, and the distribution of the displacement combined with the displacement vector field is illustrated in Figure 5d.

4.3. Pressure Relief Borehole Technology

In the next modeling stage, a sequential drilling of the relief boreholes is performed, with a space step determined by Formula (5), according to [4]. At least four relief boreholes are drilled from gateways into each side of the coal seam normal to its strike direction at a distance of no more than Cbhole:
Cbhole = K1 × K2 × K3,
where K1 is the coefficient taking into account the bursting category, K2 is the coefficient taking into account the relief borehole diameter, and K3 is the coefficient taking into account the coal seam thickness. Their values are given in Table 2, Table 3 and Table 4.
Since seam 3 is classified as dangerous and the formation thickness is more than 3 m, if the borehole diameter is 300 mm, then the distance between the drilled boreholes should be close to 2 m. As an example, Figure 6 illustrates the inelastic strain distribution of (Figure 6a) and the vertical stress diagram (Figure 6b) after drilling several relief boreholes. When analyzing the influence of relief boreholes on the abutment stress, the key parameter is the radius of the dynamic influence. According to the presented modeling data (Figure 6), the radius of one borehole influence is limited to its several diameters (≤4). Loosening of the rocks between the boreholes leads to a redistribution of the operating stresses. In fact, the stress concentration occurs similarly to the stress distribution obtained in the elastic–plastic boundary value problem for a plate with a circular hole (analogue of Kirsh problem with a reversal of the stress sign).
The distribution of vertical stress in front of the face suggests that the trend line after drilling falls below the abutment stress diagram prior to drilling. It also suggests that an efficient stress relief effect is observed within the initial 15–20 m in front of the stope face—both the stress relaxation and the abutment stress maximum shift deep into the seam (≈10 m). At a distance from the stope face exceeding 20 m, the effect of relief boreholes appears to be negative. Some stress peaks are above the abutment stress diagram prior to drilling, which makes it difficult to quantify the drilling result from the distributions.
According to [13], one of the effective ways to assess the bursting potential is a complex rockburst indicator, determined by formula (9):
K r b = 0.01 K τ F E M τ l i m
wherein K = 85% is the rockburst factor adopted in the mines of Kuzbass, τ l i m is the maximum equivalent stress determined by the strength certificate of rocks, and τ F E M is the equivalent stress obtained by the finite element analysis. According to this indicator, when the stress τ F E M exceeds 1.18 times τ l i m , the state of the rocks is classified as rockburst-hazardous [13].
Note that in the present form of Equation (9), it is impossible to use this indicator in calculations. The indicator is a static value comparing the static strength of a rock massif with an independently calculated equivalent stress. The rock strength is non-constant and changes during deformation [19]. Moreover, the equivalent stress acting in a rock massif is closely related to the changing rock strength.
To quantitatively assess the effectiveness of the measures applied to relieve stress in the coal seam ahead of the face, we propose an integral factor of the rockburst potential. This factor is calculated as the average ratio of vertical stress to the remote field stress at the computational domain boundary. However, the integration is carried out in an area limited by the zone of the dynamic abutment stress influence. The length of the influence zone of the abutment stress is defined as the distance from the face to the point where the ratio of the vertical stress to the remote field stress drops down to a value of 1.18. The formula of the proposed indicator and the scheme below (Figure 7) clarify this approach.
K I r b = 1 l d i 0 l d i σ v σ r f d x
wherein l d i is the length of the zone of the dynamic abutment stress influence, σ v is the vertical stress at the coal seam horizon in the point within the zone of the dynamic abutment stress influence, and σ r f is the remote field vertical stress.
Though Table 2 already provides the values of K2 factor corresponding to certain values of the borehole diameters [13], we performed a set of 49 numerical calculations. Since seam 3 was classified as rockburst-prone (dangerous) in the considered production segment and had an average height of 3.6 m, factors K1 and K3 were excluded from the analysis. Therefore, we analyzed the influence of K2 factor and borehole diameter.
Let us consider the inelastic strain and damage distributions around the boreholes in order to assess the damage degree. An example of K2 = 0.8 is analyzed below for different borehole diameters. Figure 8 illustrates the distributions of inelastic strain (on the left) and damage (on the right) obtained around the boreholes.
Relying on the obtained distributions of inelastic strain and damage, we can conclude that inelastic deformation around the boreholes manifests itself in the entire range of the diameters. However, for the diameters smaller than 20 cm, there is no significant damage of coal around the borehole, which might indicate a relatively lower effectiveness of the drilling technology. A criterion for the effectiveness of the applied technology for drilling the relief boreholes can be the formation of a connected system of interacting areas of localized inelastic deformation.
It can be seen that the area of deformation localization around the boreholes is a kind of a cross rotated relative to the axis of maximum compression due to the local influence of the stress state. Notably, the larger the borehole diameter, the stronger the interaction between the deformation localization regions and the wider the deformation localization regions would be. Moreover, a larger borehole diameter (d > 30 cm) results in a complete damage of the coal (D = 1, red color) around the boreholes. The latter, in fact, allows for formulating an important conclusion; an excessive damage of the rock around the borehole increases the effective borehole diameter, which has a negative effect in some cases.
Let us consider the increase in the effective borehole diameter due to the rock damage around the borehole. In order to evaluate this effect, we took a borehole located at a former peak of the abutment stress prior to drilling. An increase in the effective diameter was measured based on the distribution of damage parameter D, i.e., only those points, wherein D = 1 or the accumulated inelastic strain value was equal to γ P = 0.01 , to distinguish the points responsible for this process, were included in the analysis. In this case, the effective diameters coincided to a high accuracy. Figure 9 illustrates the results of effective diameter calculation. The values of K2 factor of 0.7, 1 and 1.6 were taken as examples. Firstly, it can be noted that all obtained dependences were increasing functions with a small nonlinearity; second, the difference between them was nearly negligible. Starting from boreholes of 20 cm diameter, the ratio of the effective diameter to the drilling diameter increases from ≈1.5 to ≈1.9.
When the spacing between the boreholes is small, the region of localized inelastic deformation is nearly continuous. As the distance between boreholes increases, this effect vanishes, since the greater the distance, the weaker the interaction between the neighboring localized deformation areas. The weakening interaction effect between the neighboring localized deformation areas is illustrated in Figure 10. An example of a 60 cm borehole diameter is taken for different values of K2 factor.
Let us also discuss the results of an integral rockburst factor calculation for a fixed K2 factor value and different borehole diameters. A set of parametric curves for each K2 value is presented in Figure 11. According to the obtained results, the curve of K I r b dependence on the borehole diameter has a negative slope for all values of the K2 factor. This indicates that an increase in the borehole diameter integrally results in a decrease in the coal seam stress. Accordingly, the rockburst potential also decreases. Since, qualitatively, the same results were obtained in a number of field and numerical studies [7,9,10,11], we can conclude that the proposed integral rockburst indicator is physically valid and adequate. However, the results presented in Figure 11 do not allow for obtaining an optimal spacing between the boreholes. For this reason, the curves of K I r b dependence on spacing (K2 factor) are analyzed below for fixed borehole diameters. These curves are illustrated in Figure 12a.
Relying on the results presented in Figure 12, several issues might be pointed out:
(i)
Boreholes with diameters less than 20 cm provide a stress relief effect, but a change in the spacing does not practically contribute to the change of K I r b .
(ii)
In the entire range of the borehole diameters, a non-monotonic change in the curve of dependence of K I r b on K2 factor might be observed. Notably, each curve has several extremums. The segments with local curve minimums might be found from the obtained results. These segments are indicated by dashed ellipses in Figure 12a. Therefore, an optimal spacing might be found for each borehole diameter. Note that this conclusion may seem unreliable at first glance, since the extremum formed in the vicinity of K2 = 1.6 could turn out to be a random outlier associated with numerical modeling. To exclude randomness from the analysis, additional calculations were performed for the intermediate K2 values for the two largest well diameters. The results are shown in a separate Figure 12b, which confirmed the earlier conclusion about the zones of local extremums.
(iiii)
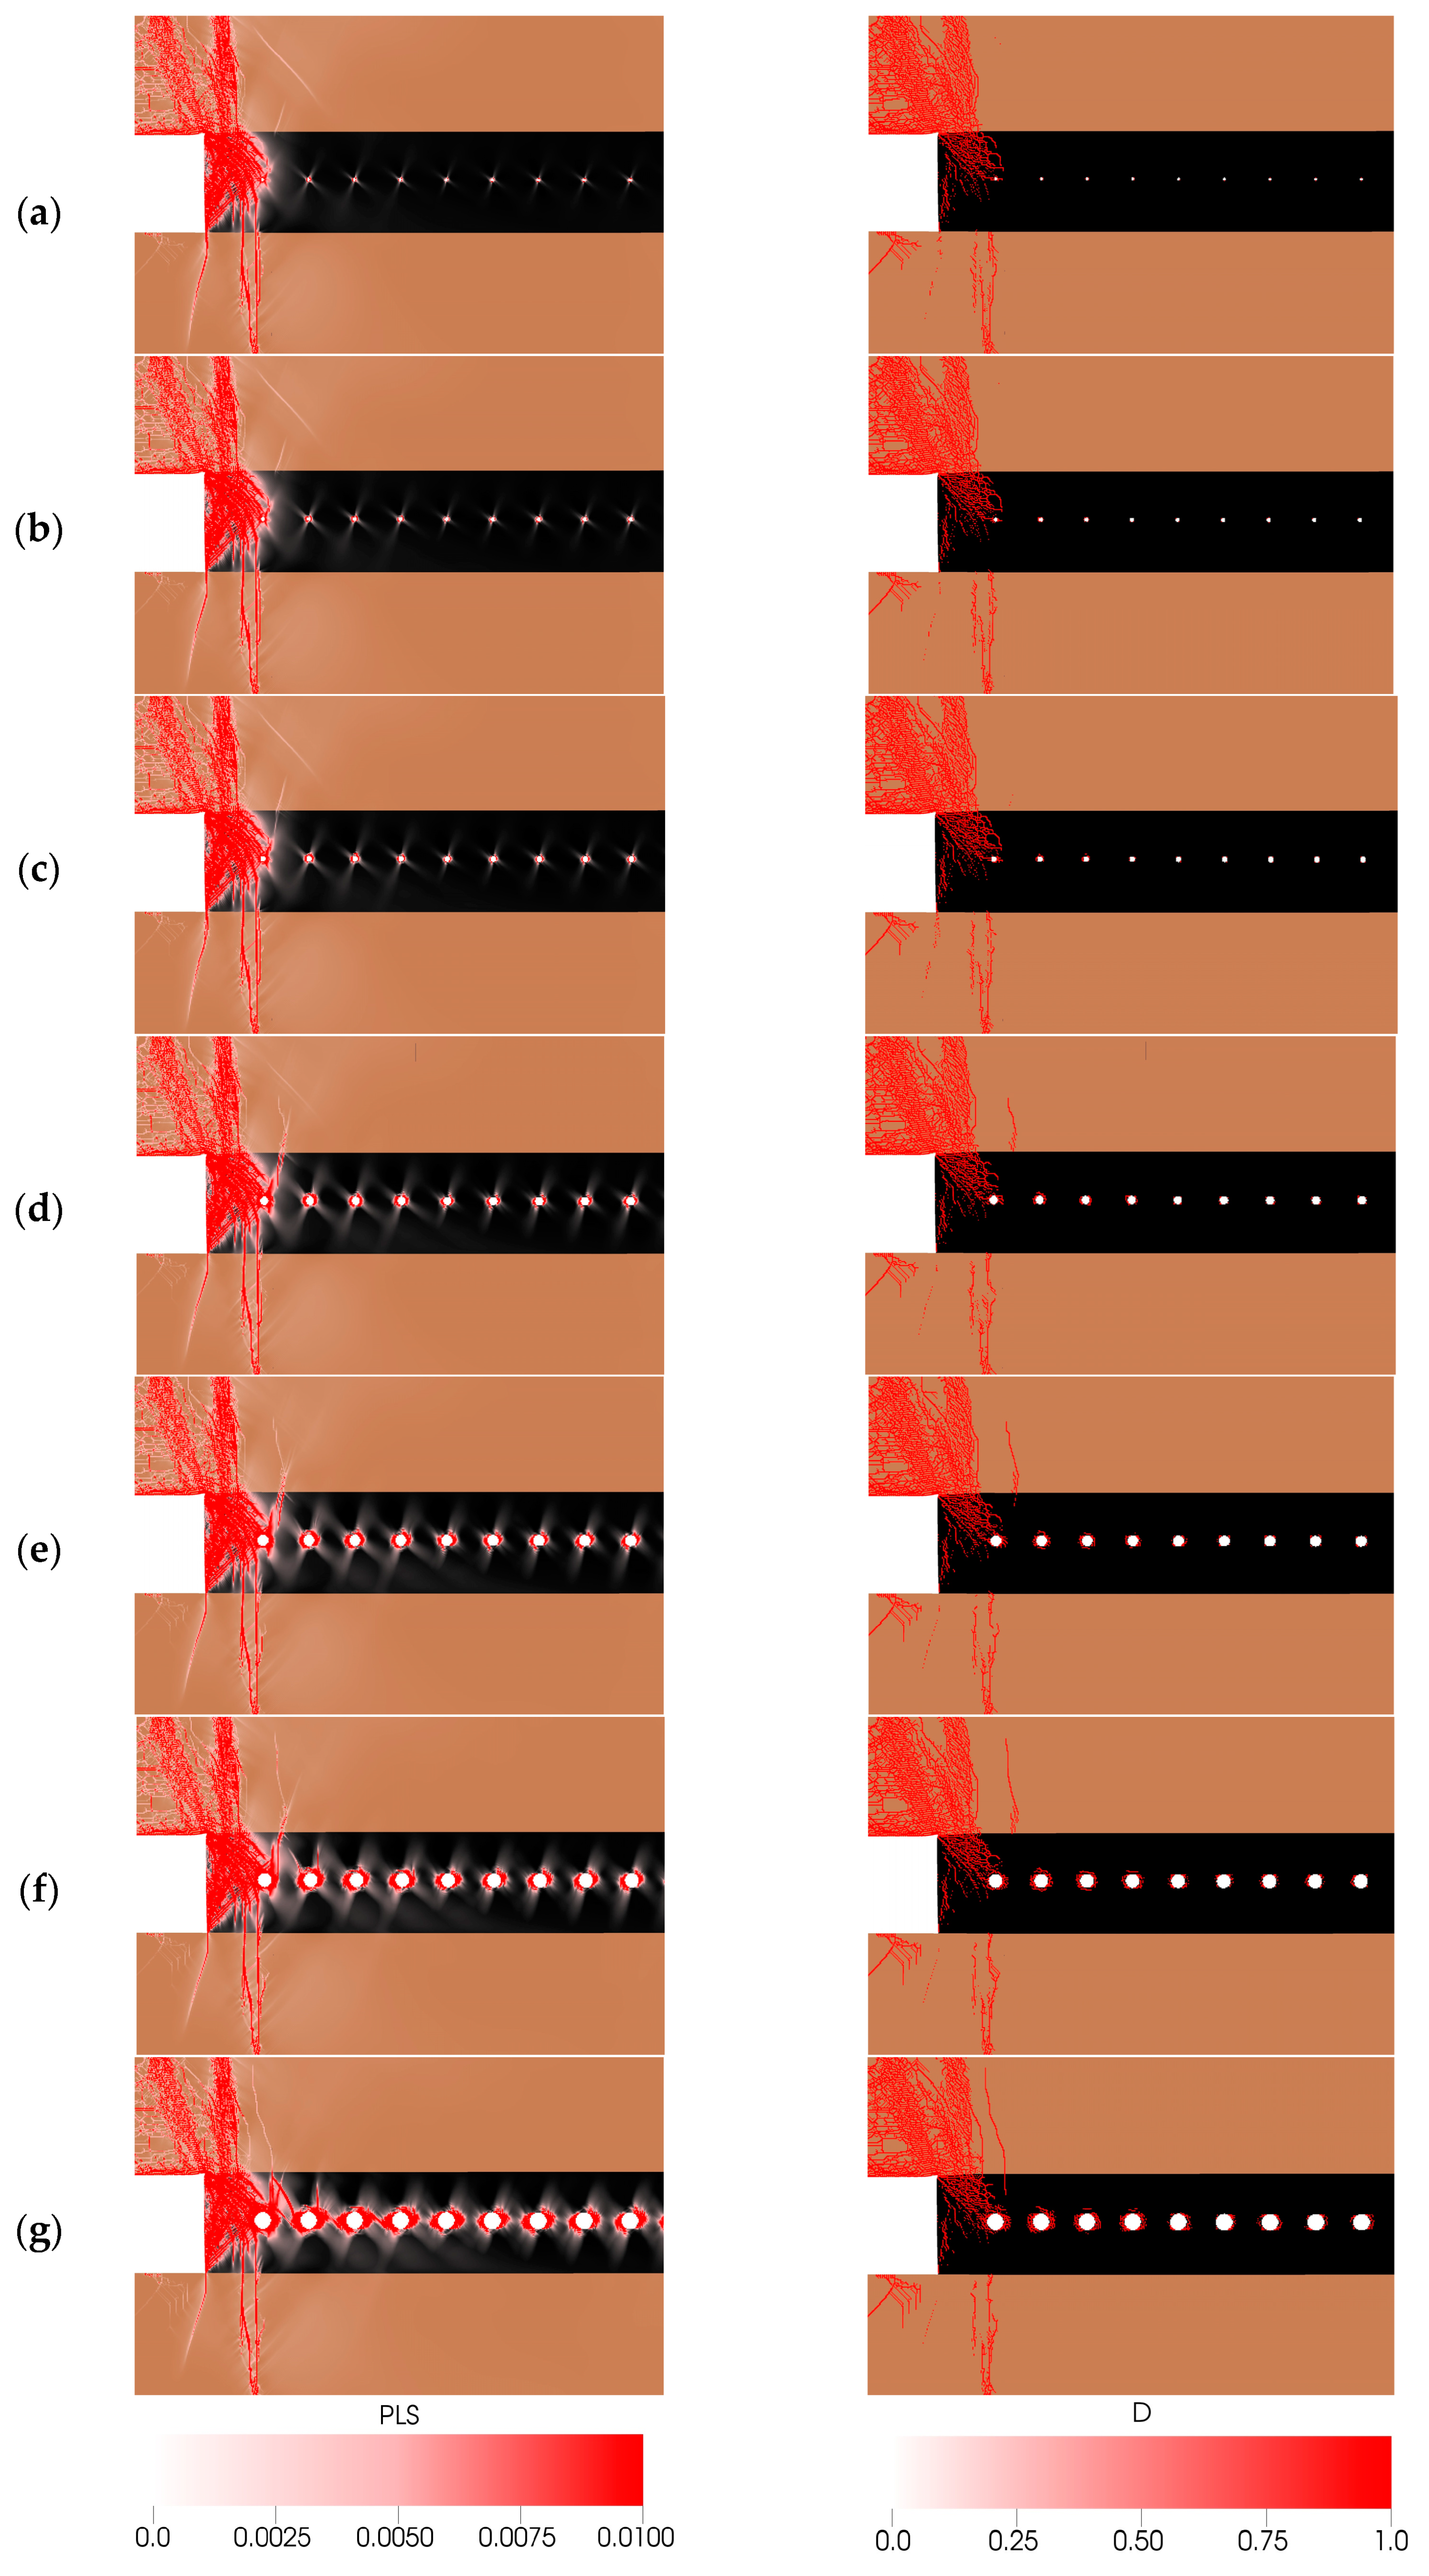
Small spacing (K2 = 0.6, 0.7) yields the lowest values of K I r b for 50 and 60 cm borehole diameters, apparently associated with the excessive relief effect due to a severe damage of the coal around the borehole (Figure 10). Similarly, an increase of K2 up to 1.8 yields a weaker stress relief effect due to the large spacing and the lack of a mutual influence of the boreholes in the entire range of diameters.
(iv)
Another issue to be kept in mind, when optimizing the borehole spacing, is the drilling cost. The first distribution minimum suggests that K2 = 0.7 seems to be optimal for all boreholes with the diameters larger than 20 cm. However, drilling of 40–60 cm diameter boreholes is rather expensive; furthermore, there is an excessive damage of the coal. The latter suggests that the spacing should be increased. Therefore, an optimal spacing is nonlinear and, relying on the performed analysis, might be roughly marked by a red dashed-dotted ellipse. Here, we have to mention that it is necessary to perform an additional cost–benefit analysis in order to determine the final optimal configuration of the drilling technology. However, this type of analysis is beyond the authors’ expertise.

5. Conclusions

An analysis of the technology for drilling the relief boreholes, based on numerical modeling, confirmed its effectiveness in reducing the bursting potential of a stressed coal seam. The stress distribution along the coal seam horizon represented a superposition of the solutions to the elastoplastic Kirsch problem, and a significant decrease in the support pressure was observed in the immediate vicinity of the face. The coal damage around the boreholes with large diameters in fact increased the effective borehole diameter, which might be harmful in some cases.
It was demonstrated that the integral rockburst factor proposed in this work nonlinearly and non-monotonically depends on the diameter of boreholes and the spacing between them, which makes it possible to optimize the drilling technology.
The numerical modeling data and their analysis based on the proposed integral rockburst factor were verified against the field observations in the Kuznetsky coal basin. From this point of view, its applicability for optimizing the relief borehole technology at other sites was not verified, although the proposed rockburst factor was based on the common patterns of the rockmass behavior.
Despite the complexity of the model presented in this study, it might be easily interpreted from the practical viewpoint. The major advantage of the approach is that we take account of the following:
(i)
structure, i.e., the rock bedding features, which play a crucial role in the stress–strain evolution behavior during loading and might be determined based on the well and seismic logs;
(ii)
progressive loss of strength by the rocks in the inelastic deformation case, i.e., the description of damage accumulation using a kinetic equation shows the strength degradation of rocks not as an instantaneous act (e.g., in contrast to the classical Mohr–Coulomb or Hoek–Brown approaches) but as a continuity-loss process, which is physically more valid; meanwhile, the model parameters can be determined based on the laboratory experiments and adapted to the mine conditions;
(iii)
easily measurable parameters included in the equation for calculation of the new integral rockburst factor for an optimization of the relief borehole technology.
In future works, we plan to create a three-dimensional model of the drilling process, and to include in it a possible influence of methane desorption from the coal seam, which would apparently yield some correction of the conclusions drawn in this study. Furthermore, an application of the proposed integral rockburst factor for investigating other forms of underground instability—gas outbursts, reactivation of faults, etc.—is of particular interest. In the current stage of research, however, we are unable to evaluate its applicability to the raised problems. This might also be the topic of future research.

Author Contributions

Conceptualization, M.O.E.; methodology, M.O.E.; software, A.O.C.; validation, A.P.; formal analysis, S.A.L.; investigation, D.V.C.; writing—original draft preparation, M.O.E.; writing—review and editing, M.O.E.; visualization, A.O.C. All authors have read and agreed to the published version of the manuscript.

Funding

Introduction and in-house software development were performed according to the Government research assignment for ISPMS SB RAS; Project no. FWRW-2021-0002. Other sections of the manuscript were performed due to the support from the Russian Science Foundation (Grant No. 21-71-10079).

Data Availability Statement

The raw data supporting the conclusions of this article will be made available by the authors on request.

Conflicts of Interest

The authors declare no conflict of interest.

References

  1. Gao, Y.N.; Zhang, Y.D.; Zhang, Z.T.; Li, M.; Sun, Y.; Lan, D.; Gao, F. Parametric study of the borehole drilling in jointed rock mass. Geofluids 2021, 2021, 8237199. [Google Scholar] [CrossRef]
  2. Klishin, V.I.; Opruk, G.Y.; Cherepov, A.A. Complex method of pressure burst hazard mitigation in coal mines. Ugol’—Russ. Coal J. 2018, 9, 56–62. [Google Scholar] [CrossRef]
  3. Makarov, P.V.; Eremin, M.O. Rock Mass as a Nonlinear Dynamic System. Mathematical Modeling of Stress-Strain State Evolution in the Rock Mass around a Mine Opening. Phys. Mesomech. 2018, 21, 283–296. [Google Scholar] [CrossRef]
  4. Ermak, G.P.; Skatov, V.V.; Guseva, N.V.; Krotov, N.V.; Potapov, P.V.; Vyunnikov, A.A.; Kulik, A.I.; Kolchin, G.I.; Smirnov, O.V.; Mulev, S.V.; et al. Recommendations on Safety of Undeground Mining of Rockburst-Prone Coal Seams. Moscow, ZAO Nauchno-Technicheskii Centr Issledovanii Problem Promyshlennoi Bezopasnosti. 2017. (In Russian). Available online: https://docs.cntd.ru/document/456089946 (accessed on 28 November 2024).
  5. Zhang, C.; Song, Z.; Bai, Q.; Zhang, L.; Chen, J. Intensive field measurements for characterizing the permeability and methane release with the treatment process of pressure-relief mining. Sci. Rep. 2022, 12, 14847. [Google Scholar] [CrossRef]
  6. Xu, Y.; Wang, L.; Chen, X.; Fan, Y. Improvement of drilling quality using precision directional drilling technology. J. Pet. Explor. Prod. Technol. 2022, 12, 3149–3164. [Google Scholar] [CrossRef]
  7. Gu, S.; Chen, C.; Jiang, B.; Ding, K.; Xiao, H. Study on the Pressure Relief Mechanism and Engineering Application of Segmented Enlarged-Diameter Boreholes. Sustainability 2022, 14, 5234. [Google Scholar] [CrossRef]
  8. Zhang, W.L.; Li, C.; Jin, J.X. A new monitoring-while-drilling method of large diameter drilling in underground coal mine and their application. Measurement 2021, 173, 108840. [Google Scholar] [CrossRef]
  9. Chen, Z.; Xu, T.; Dai, X.; Song, J. Effect of Borehole Positions and Depth on Pressure Relief of Cavern Surrounding Rock Mass. Geotech. Geol. Eng. 2021, 40, 237–248. [Google Scholar] [CrossRef]
  10. Cui, F.; Zhang, S.; Chen, J.; Jia, C. Numerical Study on the Pressure Relief Characteristics of a Large-Diameter Borehole. Appl. Sci. 2022, 12, 7967. [Google Scholar] [CrossRef]
  11. Chen, M.; Zhang, Y.; Zang, C.; Zhang, G.; Li, Q.; Jiang, B. Experimental Investigation on Pressure Relief Mechanism of Specimens with Prefabricated Reaming Boreholes. Rock. Mech. Rock. Eng. 2023, 56, 2949–2966. [Google Scholar] [CrossRef]
  12. Nian, J.; Zhao, B.; Zhang, W. Numerical simulation research on the pressure relief and permeability enhancement mechanism of large-diameter borehole in coal seam. Geofluids 2022, 2022, 2926213. [Google Scholar] [CrossRef]
  13. Cherepov, A.A. Geomechanical Justification of the Parameters of Room-and-Pillar Mining Systems for Thick Coal Seams Prone to Rockbursts. Ph.D. Thesis, Siberian State Industrial University, Novokuznetsk, Russia, 2018. (In Russian). [Google Scholar]
  14. Tyurnin, V.A. Justification of the Parameters of Technological Schemes for Mining Suites of Flat-Dipping Coal Seams Prone to Self-Combustion. Ph.D. Thesis, Saint Petersburg Mining University, St Petersburg, Russia, 2014. (In Russian). [Google Scholar]
  15. Yavorskii, V.I. Geology of coal deposits and oil shale of the USSR. In Kuznetsky, Gorlovsky Basins and Other Coal Deposits of Western Siberia; Nedra: Moscow, Russia, 1969; Volume 7. (In Russian) [Google Scholar]
  16. Eremin, M.; Peryshkin, A.; Esterhuizen, G.; Pavlova, L.; Fryanov, V. Numerical Analysis of Pillar Stability in Longwall Mining of Two Adjacent Panels of an Inclined Coal Seam. Appl. Sci. 2022, 12, 11028. [Google Scholar] [CrossRef]
  17. Jones, N.S. A Review of the AMM and CMM Resources in the Kuznetsk (Kuzbass) Coal Basin, Russia; British Geological Survey: London, UK, 2005. [Google Scholar]
  18. Wilkins, M.L. Computer Simulation of Dynamic Phenomena; Springer: Berlin/Heidelberg, Germany; New York, NY, USA, 1999. [Google Scholar]
  19. Eremin, M.; Esterhuizen, G.; Smolin, I. Numerical simulation of roof cavings in several Kuzbass mines using finite- difference continuum damage mechanics approach. Int. J. Min. Sci. Technol. 2020, 30, 157–166. [Google Scholar] [CrossRef] [PubMed]
  20. Balokhonov, R.R.; Romanova, V.A.; Buyakova, S.P.; Kulkov, A.S.; Bakeev, R.A.; Evtushenko, E.P.; Zemlyanov, A.V. Deformation and Fracture Behavior of Particle-Reinforced Metal Matrix Composites and Coatings. Phys. Mesomech. 2022, 25, 492–504. [Google Scholar] [CrossRef]
  21. Radchenko, P.A.; Batuev, S.P.; Radchenko, A.V. Effect of Projectile Rotation on High-Velocity Impact Fracture. Phys. Mesomech. 2022, 25, 119–128. [Google Scholar] [CrossRef]
  22. Garagash, I.A.; Nikolaevskii, V.N. Nonassociated flow rules and localization of plastic deformation. Adv. Mech. 1989, 12, 131–183. [Google Scholar]
  23. Drucker, D.C.; Prager, W. Soil Mechanics and plastic analysis or limit design. Q. Appl. Math. 1952, 10, 157–165. [Google Scholar] [CrossRef]
  24. Alejano, L.R.; Bobet, A. Drucker-prager criterion. Rock. Mech. Rock. Eng. 2014, 45, 995–999. [Google Scholar] [CrossRef]
  25. Rabotnov, Y.N. Kinetics of creep and creep rupture. In Irreversible Aspects of Continuum Mechanics and Transfer of Physical Characteristics in Moving Fluids; Springer: Vienna, Austria, 1966; pp. 326–334. [Google Scholar]
  26. Kachanov, L.M. Rupture time under creep conditions. Int. J. Fract. 1999, 97, 11–18. [Google Scholar] [CrossRef]
  27. Sahara, D.; Schoenball, M.; Gerolymatou, E.; Kohl, T. Analysis of borehole breakout development using continuum damage mechanics. Int. J. Rock. Mech. Min. Sci. 2017, 97, 134–143. [Google Scholar] [CrossRef]
  28. Eremin, M.O. Three-dimensional finite-difference analysis of deformation and failure of weak porous sandstones subjected to uniaxial compression. Int. J. Rock. Mech. Min. Sci. 2020, 133, 104412. [Google Scholar] [CrossRef]
  29. Hoek, E.; Martin, C.D. Fracture initiation and propagation in intact rock—A review. J. Rock. Mech. Geotech. Eng. 2014, 6, 287–300. [Google Scholar] [CrossRef]
  30. Meng, Z.; Shi, X.; Li, G. Deformation, failure and permeability of coal-bearing strata during longwall mining. Eng. Geol. 2016, 208, 69–80. [Google Scholar] [CrossRef]
  31. Islavath, S.R.; Deb, D.; Kumar, H. Numerical analysis of a longwall mining cycle and development of a composite longwall index. Int. J. Rock. Mech. Min. Sci. 2016, 89, 43–54. [Google Scholar] [CrossRef]
  32. Guo, H.; Yuan, L.; Shen, B.; Qu, Q.; Xue, J. Mining-induced strata stress changes, fractures and gas flow dynamics in multi-seam longwall mining. Int. J. Rock. Mech. Min. Sci. 2012, 54, 129–139. [Google Scholar] [CrossRef]
Figure 2. Yield/damage surface and possible stress paths in elastic stage of deformation.
Mining 04 00058 g002
Figure 3. Structural model of the rock mass, corresponding to the simplified stratigraphy in Figure 1, red box illustrates schematically the mining chamber (a), second computational domain cut from the larger one (corresponds to the region marked by green rectangle in (a)) (b).
Mining 04 00058 g003
Figure 4. Combined patterns of structure and accumulated damage in roof and floor for different stope face advancements: (a)—24 m, (b)—36 m, (c)—48 m.
Mining 04 00058 g004
Figure 5. Vertical stress distribution in the horizon of seam 3 after the gob stress recovery along the A-A profile (a), distribution of accumulated damage in the second computational domain after the goaf formation and prior to the borehole drilling (red color corresponds to D = 1) (b), distribution of the von Mises stress (c), distribution of the displacement combined with the displacement vector field (d).
Mining 04 00058 g005aMining 04 00058 g005b
Figure 6. Distribution of equivalent inelastic strain in the vicinity of relief boreholes (≈300 mm) with a distance of ≈2 m between them after drilling 45 boreholes (magnified inset corresponds to the region bounded by the green ellipse (a)) and diagram of the vertical stress along A-A profile after drilling (b).
Mining 04 00058 g006
Figure 7. Scheme for determination of abutment stress dynamic influence zone.
Mining 04 00058 g007
Figure 8. Distributions of equivalent inelastic strain (on the left) and damage (on the right) around the boreholes of different diameters combined with structural model: (a) 10 cm, (b) 15 cm, (c) 20 cm, (d) 30 cm, (e) 40 cm, (f) 50 cm, (g) 60 cm for K2 = 0.8.
Mining 04 00058 g008
Figure 9. Dependence of effective diameter on drilling diameter for K2 factor of 0.7, 1.0 and 1.6.
Mining 04 00058 g009
Figure 10. Distributions of equivalent inelastic strain (on the left) and damage (on the right) around the boreholes of 60 cm diameter combined with structural model for different K2 factor values: (a) 0.6, (b) 0.7, (c) 0.8, (d) 1.0, (e) 1.3, (f) 1.6, and (g) 1.8.
Mining 04 00058 g010
Figure 11. Dependence of K I r b on borehole diameter for different K2 factor values.
Mining 04 00058 g011
Figure 12. Dependence of K I r b on K2 factor for different borehole diameters (a), updated solution for the largest borehole diameters (b).
Mining 04 00058 g012
Table 1. Physical–mechanical properties of rocks used in modeling.
Rockσt, MPaσc, MPaY0, MPaα1α2Λρ, g/cm3K, GPaμ, GPa t * , s
Sandstone2.828.523.451.340.50.162.548.737.455 × 104
Siltstone1.895.593.031.320.480.212.559.416.55
Carb. mudst.1.54.532.11.330.550.211.938.45.4
Coal1.113.570.90.70.470.221.292.351.63
Table 2. Bursting categories.
Bursting CategoryNot DangerousDangerous
K11.31.7
Table 3. K2 dependence on borehole diameter.
Diameter of relief borehole, mm100150200300400500600
K20.60.70.81.01.31.61.8
Table 4. K3 dependence on seam height.
Seam height, m0.5–0.80.9–1.41.5–2.02.1–3.0>3.0
K30.80.91.01.11.2
Disclaimer/Publisher’s Note: The statements, opinions and data contained in all publications are solely those of the individual author(s) and contributor(s) and not of MDPI and/or the editor(s). MDPI and/or the editor(s) disclaim responsibility for any injury to people or property resulting from any ideas, methods, instructions or products referred to in the content.

