1. Introduction
Cave mining stands out as one of the most cost-effective methods for large-scale mineral extraction, renowned for its efficiency and economic benefits [
1,
2,
3]. The technique is particularly advantageous in extracting ore from deep underground deposits where other methods may be less feasible. However, optimizing cave mining operations requires a deep understanding of the caving mechanisms that influence the stability and productivity of the mining process. This research aims to advance the understanding of these mechanisms by employing sophisticated numerical simulations to explore the dynamic interactions between the caving rock mass and surrounding strata. Our work seeks to enhance the predictive accuracy of caving models, thereby improving the design and safety of longwall mining operations.
Longwall mining is the most widely utilized underground mining method in the coal industry, particularly effective for extracting thick, sub-horizontal, and uniform coal seams [
4]. As the longwall panel retreats, the roof strata above the mined zone collapse and cave in, resulting in the destressing of the mining area. With the continuous advancement of the longwall face, the immediate roof falls and caves into the goaf region, extending the fractured zone above the mined-out area. In longwall mining, three distinct zones are typically identified [
5]: the caved zone, the fractured zone, and the continuous deformation zone. The extent of each zone is influenced by various geological and geotechnical factors, including the mechanical properties of the rock, in situ stress, the thickness of the coal seam and immediate strata, and the type and nature of the overlying strata [
4]. Characterizing the failure and fracturing mechanisms of the caving process is crucial for mine design layout, roadway stability assessment, ground support design, and predicting ground subsidence.
Hydraulic fracturing has become one of the most effective methods in recent years for inducing artificial fractures in lithological units, including conglomerates, where natural fracturing due to seam extraction does not occur. Jeffrey and Mills (2000) [
6] described the successful application of hydraulic fracturing to control caving behavior, with hydraulic fractures initiated at 7 to 10 m above the bottom of a conglomerate layer. He et al. (2016) [
7] presented state-of-the-art hydraulic fracturing as an effective preconditioning methodology for enhancing caving performance. The review in their paper reveals that the orientation of current cave mining hydraulic fractures is dictated by and is perpendicular to the minimum in situ stress orientation. There are a number of researchers focusing on the application of hydraulic fracturing for enhancing top coal caveability for longwall top coal caving [
8] and reactivating caving rock mass in the cave mining industry [
6,
9]. In the metalliferous mining industry, hydraulic fracturing is also an effective method for optimize the preconditioning process of underground block caving mines [
10].
Given the significant costs associated with hydraulic fracturing, it is crucial to evaluate the rock mass’s caveability and establish a sound rationale for determining whether hydraulic fracturing is necessary. In this context, numerical modeling offers a powerful tool for analyzing the caving mechanism, assessing the fracturing behavior, and determining the extent of the fractured zone required to ensure a stable and efficient caving process. By simulating the fracturing response of the lithological units, numerical modeling provides critical insights into whether the existing conditions are sufficient to facilitate natural caving, thereby negating the need for hydraulic intervention. Conversely, it can identify scenarios where hydraulic fracturing becomes essential—particularly when the height of the fractured zone is inadequate or the fracturing response of the rock mass is insufficient to maintain caving stability and safety.
Empirical methods are the most commonly used in the industry [
11]; however, they often suffer from oversimplifications, particularly when the overburden lithological configuration is complex [
4]. In contrast, numerical modeling provides an efficient tool for simulating the fracturing processes of various strata units due to progressive longwall retreat [
12,
13,
14,
15,
16]. The most common numerical approaches used in previous studies include the discrete element method (DEM) [
4,
17,
18,
19] and continuum methods such as the finite element method (FEM) and the boundary element method (BEM) [
16,
20,
21,
22]. The DEM explicitly simulates the fracturing response of rock, but designing a suitable cohesive contact model that accurately reproduces the cohesion weakening of pre-existing bedding planes, cleats, and rock mass joints is challenging. In DEM modeling (e.g., UDEC and 3DEC), model calibration demands substantial resources and numerous trials to achieve accurate contact properties that represent the rock mass effectively. Among the current numerical methods, BEM, exemplified by FLAC3D 9.0, is widely used in the mining industry for caving simulations [
20,
23,
24].
Augmented with the Itasca Model for Advanced Strain Softening (IMASS) [
17], FLAC3D 9.0 provides a robust numerical model that accurately represents the damage around excavations, slopes, or during the caving process. This model effectively accounts for the progressive failure and disintegration of the rock mass, transitioning from an intact or jointed condition to a bulked material state. The IMASS constitutive model [
25] has been developed to capture the rock mass response to stress changes, including rock mass yield, modulus softening, density adjustment, dilation, dilation shutoff, scaling of properties to zone size, cohesion weakening, tension weakening, and frictional strengthening. This model, developed using strain-softening material models, adjusts strain-dependent properties to reflect the impacts of dilation and bulking due to induced stress changes. This model is a promising tool for simulating the progressive caving behavior of overburden as it accounts for cohesion and tension weakening and progressive frictional strengthening during rock mass failure, allowing for realistic fracturing response simulation. As intact rock blocks fracture, separate, and rotate during the yielding and mobilization process, the rock mass increases in volume, a phenomenon known as bulking. Along with this bulking, a reduction in modulus is expected to occur.
FLAC3D 9.0 uses finite volume method equations, but its elastic material matrices are similar to those of finite element methods for constant-strain tetrahedra. It employs a “mixed discretization” scheme, which is more accurate than “reduced integration.” FLAC3D 9.0 also applies full dynamic equations even for static cases, enhancing its ability to model unstable processes [
17]. Its explicit solution scheme efficiently manages nonlinearity without needing matrix storage, saving memory and computation time. Moreover, FLAC3D 9.0 is versatile, handling any constitutive model without changing the solution algorithm, and its incremental formulation allows flexible adjustments without affecting the current stress state [
17].
Although the discrete element method (DEM) is capable of effectively simulating rock mass fracturing with promising characterization, the primary challenge lies in the uncertainty of fracture system generation, which relies on statistical analysis. This introduces variability that requires further analysis to quantify its impact [
26]. Additionally, in DEM models like the Bonded Block Model (BBM), the systematic calibration of micro-parameters is necessary, which can be both time-consuming and computationally demanding. This process is essential to accurately determine the set of parameters that represent the rock mass, adding complexity and increasing computational costs.
In this paper a numerical caving framework is developed in FLAC3D 9.0 that integrates the IMASS constitutive model with a caving algorithm proposed by [
16]. The proposed framework is used to simulate the progressive caving behavior of the overburden. The shield in the front of longwall is modeled and the fracturing response zone is assessed. The periodic weighting event potential is evaluated according to fracture behavior of the immediate roof and overburden.
2. Lithological Configuration and Mining Layout
The longwall caving performance and overburden fracturing response are simulated within FLAC3D 9.0 using an advanced strain-softening constitutive model (IMASS). Due to the plane strain nature of the longwall mining process, we performed a plane strain simulation in FLAC3D 9.0. The length of the model in the y direction was minimized to accurately represent the two-dimensional behavior of the system, ensuring that the simulation effectively captures the critical aspects of the longwall mining mechanics while maintaining computational efficiency. The FLAC3D 9.0 model is created based on the comprehensive database available from Blackrock Mining Solution Pty Ltd. Brisbane, Australia., ensuring accurate representation of geological and geotechnical conditions.
The numerical simulation of longwall caving aims to evaluate the following:
Predict the height of caving above the longwall extraction.
Approximate the length of coal extraction at which the caving process starts.
Evaluate the fracturing and deformation characteristics of the immediate roof.
Predict the deformation and fracturing process of the longwall floor.
Predict the characteristics of the damage zone formed at the shield face during longwall production.
To achieve these objectives, a section of the longwall panel was created in FLAC3D 9.0, and the shield support characteristics were imported into the model. The deformation and fracturing behavior of the model were then monitored and assessed accordingly. FLAC3D 9.0 simulates the rock mass by generating 3D hexahedral grids that can be adjusted to form the modeling requirements. To characterize the caving behavior of longwall mining, a zone size of 0.5 m was assumed for approximately 50 m above and 30 m below the seam. This ensured sufficient and accurate discretization of the FLAC3D 9.0 zones. Approximately 10 m behind the longwall kick-off, a zone size of 0.5 m was also used to discretize the model, eliminating any potential mesh dependency. The zone size of 0.5 m was chosen to ensure computational efficiency, as smaller zone sizes did not significantly impact the results of collapse modeling. After borehole analysis, the closest borehole to the longwall panel was chosen for creating the FLAC3D 9.0 model.
We initially assumed a zone size of 0.5 m for the caving behavior characterization, with the zone extending approximately 50 m above and 30 m below the seam. This choice was based on the following considerations:
Practical experience: The selected zone size is consistent with common practices in longwall mining simulations, where similar dimensions have been effectively used to model the caving process and capture relevant behavior in the surrounding rock mass.
Geological context: The dimensions were chosen to reflect the typical scale of caving behavior observed in the field and to ensure that the model adequately represents the interaction between the coal seam and the surrounding strata.
Sensitivity analysis: We conducted preliminary sensitivity analyses to confirm that the chosen zone size provides a balanced representation of the caving process without introducing excessive computational demands. We have now included a detailed discussion of these factors in the revised manuscript to provide a clearer justification for the selected zone size.
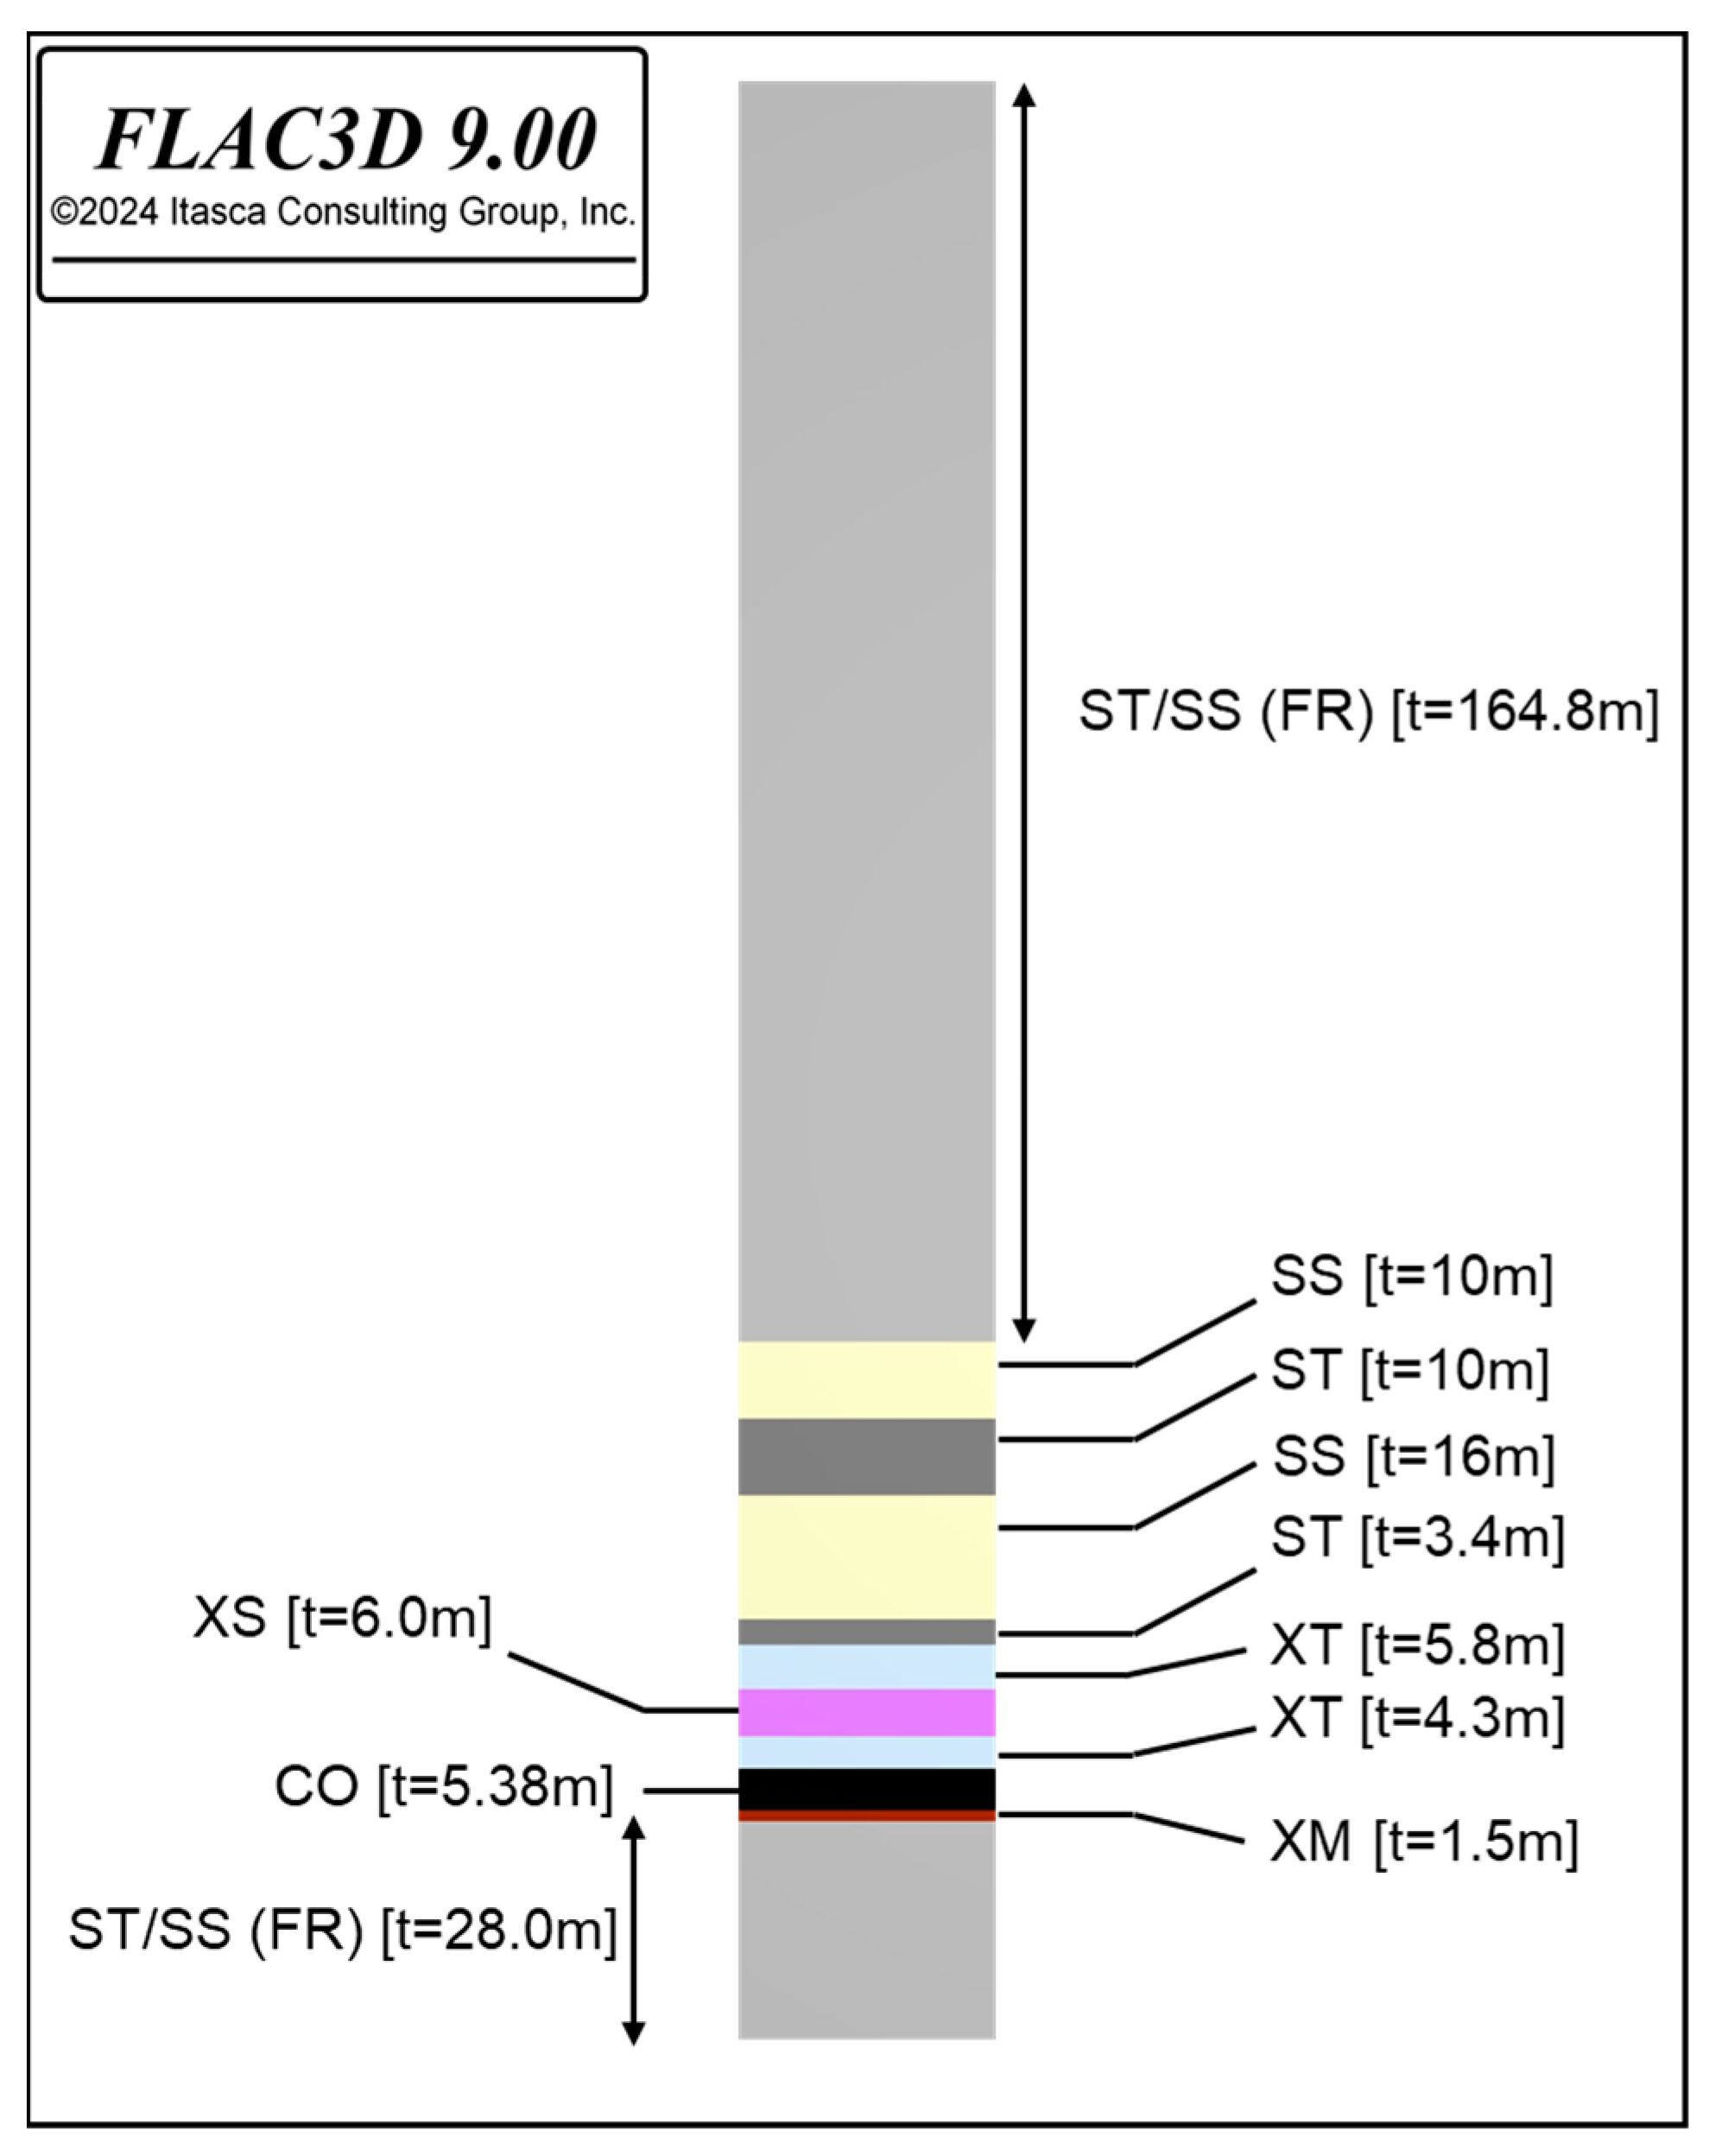
The lithological units from the borehole were imported into the FLAC3D 9.0 model. The seam thickness in this borehole is 5.38 m, with the immediate roof (LHD) at a depth of 220.29 m. In FLAC3D 9.0, it is important to create immediate roof units with a fine zone size to enhance the computational accuracy of LW caving. Therefore, approximately the first 50 m above the LHD seam roof was processed to identify the lithological sequence of the overburden. The remaining overburden was assumed to consist of ST/SS, designated as fresh Permian rock (FR) in the model, based on the borehole analysis. The immediate floor of the Leichhardt seam is XM with a thickness of 1.5 m, and the rest of the floor is FR.
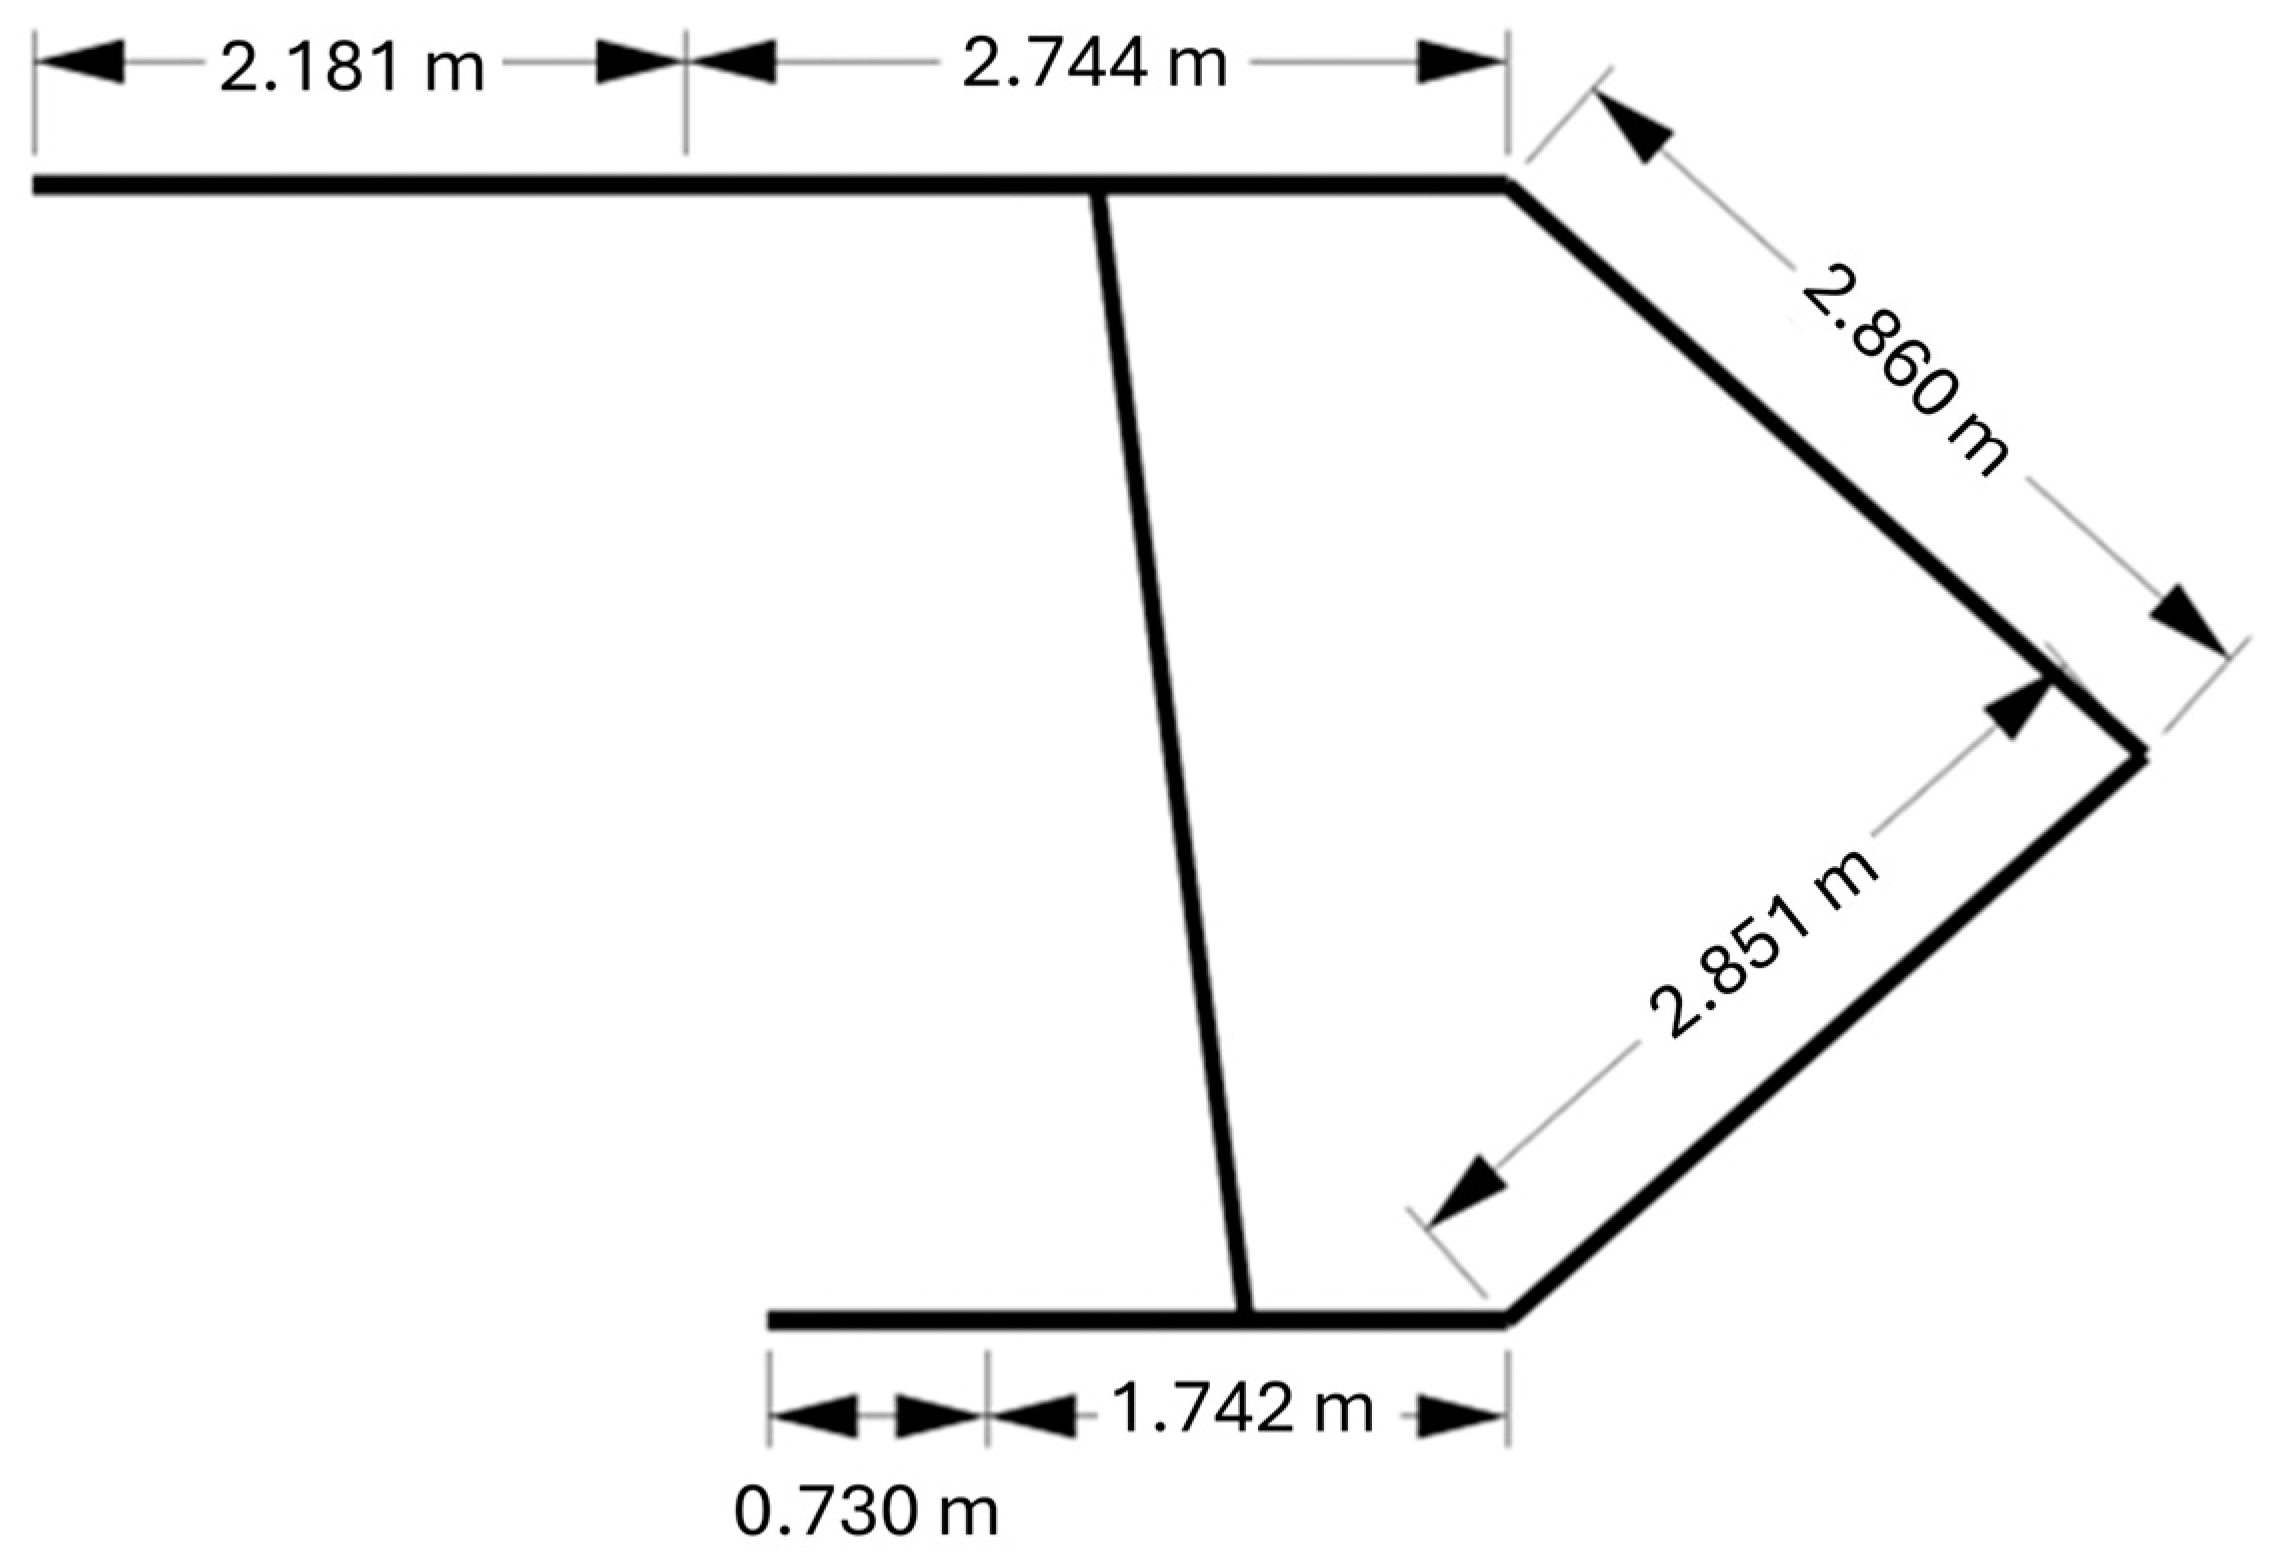
Figure 1 illustrates the lithological units imported into FLAC3D 9.0 model from borehole. The shield support configuration and the dimensions are illustrated in
Figure 2.
4. Caving Mechanism Analysis
4.1. Modified Caving Algorithm Proposed in FLAC3D 9.0
In longwall mining, the fracturing of the roof strata leads to the formation of a caved zone that fills the stope void. Simulating overburden caving is a complex process that necessitates an advanced constitutive model enhanced with a strain-softening response. Additionally, simulating longwall caving requires an efficient caving algorithm that accounts for shield support, goaf formation, and the fracturing response surrounding the caved zone. To achieve this goal, the caving algorithm initially proposed by [
16] was further developed by the Blackrock research and development group for implementation into FLAC3D 9.0 [
17].
Caving occurs when the longwall has advanced sufficiently, causing disturbance in the overburden strata. In cave mining, the ratio of broken to in situ rock is called the “bulking factor”. The broken rock mass has a significantly larger volume than its in situ solid form. In numerical modeling, the bulking factor must be set to a maximum value that should not be exceeded Sainsbury et al. (2008) [
28] reported that the porosity of caved rock is approximately 0.3, which corresponds to a bulking factor of 1.43.
Shabanimashcool and Li (2012) [
16] proposed an algorithm for the numerical modeling of the cave-in process based on the caving scenarios proposed by [
5,
29].
Figure 4 illustrates the conceptual cave-in model originally developed by and further implemented in a numerical framework by [
16] for longwall caving simulation in FLAC3D 9.0. The height of the longwall stope is denoted as
. The first cave-in occurs when the open stope length reaches
. Cave-in rock has a constant thickness b in the middle, decreasing towards the longwall front, forming a concave roof of laminated rock cantilever beams. With a critical advance of
, the cantilever beams break and fall. This caving repeats with each advance of
until the panel is completed [
16].
In our trial modeling, we observed that the initial caving occurred after 20.0 m of longwall advance (). However, the numerical simulations indicated that this distance was insufficient to achieve a complete caving response from the overburden rock mass. Consequently, we adjusted to 1.5 times the initial value. This modification was necessary due to varying lithological units, stress conditions, or other unknown geological and modeling factors that influence the required advancement length after the initial caving stage.
The caving process is simulated in FLAC3D 9.0 following these steps:
Excavate the coal seam with a 5 m advance until reaching a displacement equal to the height of the longwall panel (i.e., 3.8 m).
Identify zones with a maximum principal strain () of 5% or higher as the goaf region and alter their material properties to that of fragmented material (i.e., Young’s modulus of 200 MPa and Poisson’s ratio of 0.3).
Continue advancing the excavation by repeating Steps 1 and 2 until a bulking factor (the volumetric ratio of broken rock to solid in situ rock) of 1.43 is achieved. The fragmented blocks between each excavation–caving cycle are considered part of the caved zone due to their high susceptibility to disintegration and collapse.
Adjust the advancement rate to a ratio () of the total excavation advance measured in Step 3 from this point onwards.
Note that in the original algorithm proposed by [
16] the advancement length (
) is used for caving progress after the initial computations. However, in this study, we modified the advancement length using an adjusted ratio to achieve a more realistic representation of caving and fracturing behavior in the numerical framework.
After step 4, fracture domains developed between each caving cycle, necessitating the consideration of caving and backfilling in these areas. Although some of these zones exhibited exceeding 3.0–5.0%, it was essential to treat them as fragmented regions that required caving and backfilling to form a realistically shaped caving profile.
Figure 5 presents a pseudocode representation of the caving simulation methodology employed in our study using FLAC3D 9.0 software modified from [
16]. It outlines the step-by-step procedure for simulating the excavation and caving process, including initialization, setup, and the iterative loop for advancing excavation and updating material properties.
The pseudocode is divided into two main sections:
Initialization and Setup: This section details the initial configuration of the model, including setting material properties, excavation advance distance, target displacement, and thresholds for the maximum principal strain and bulking factor.
Excavation and Caving Process Loop: This section describes the iterative process of advancing the excavation, checking displacement, updating material properties for goaf regions, and adjusting the advancement rate based on the calculated bulking factor.
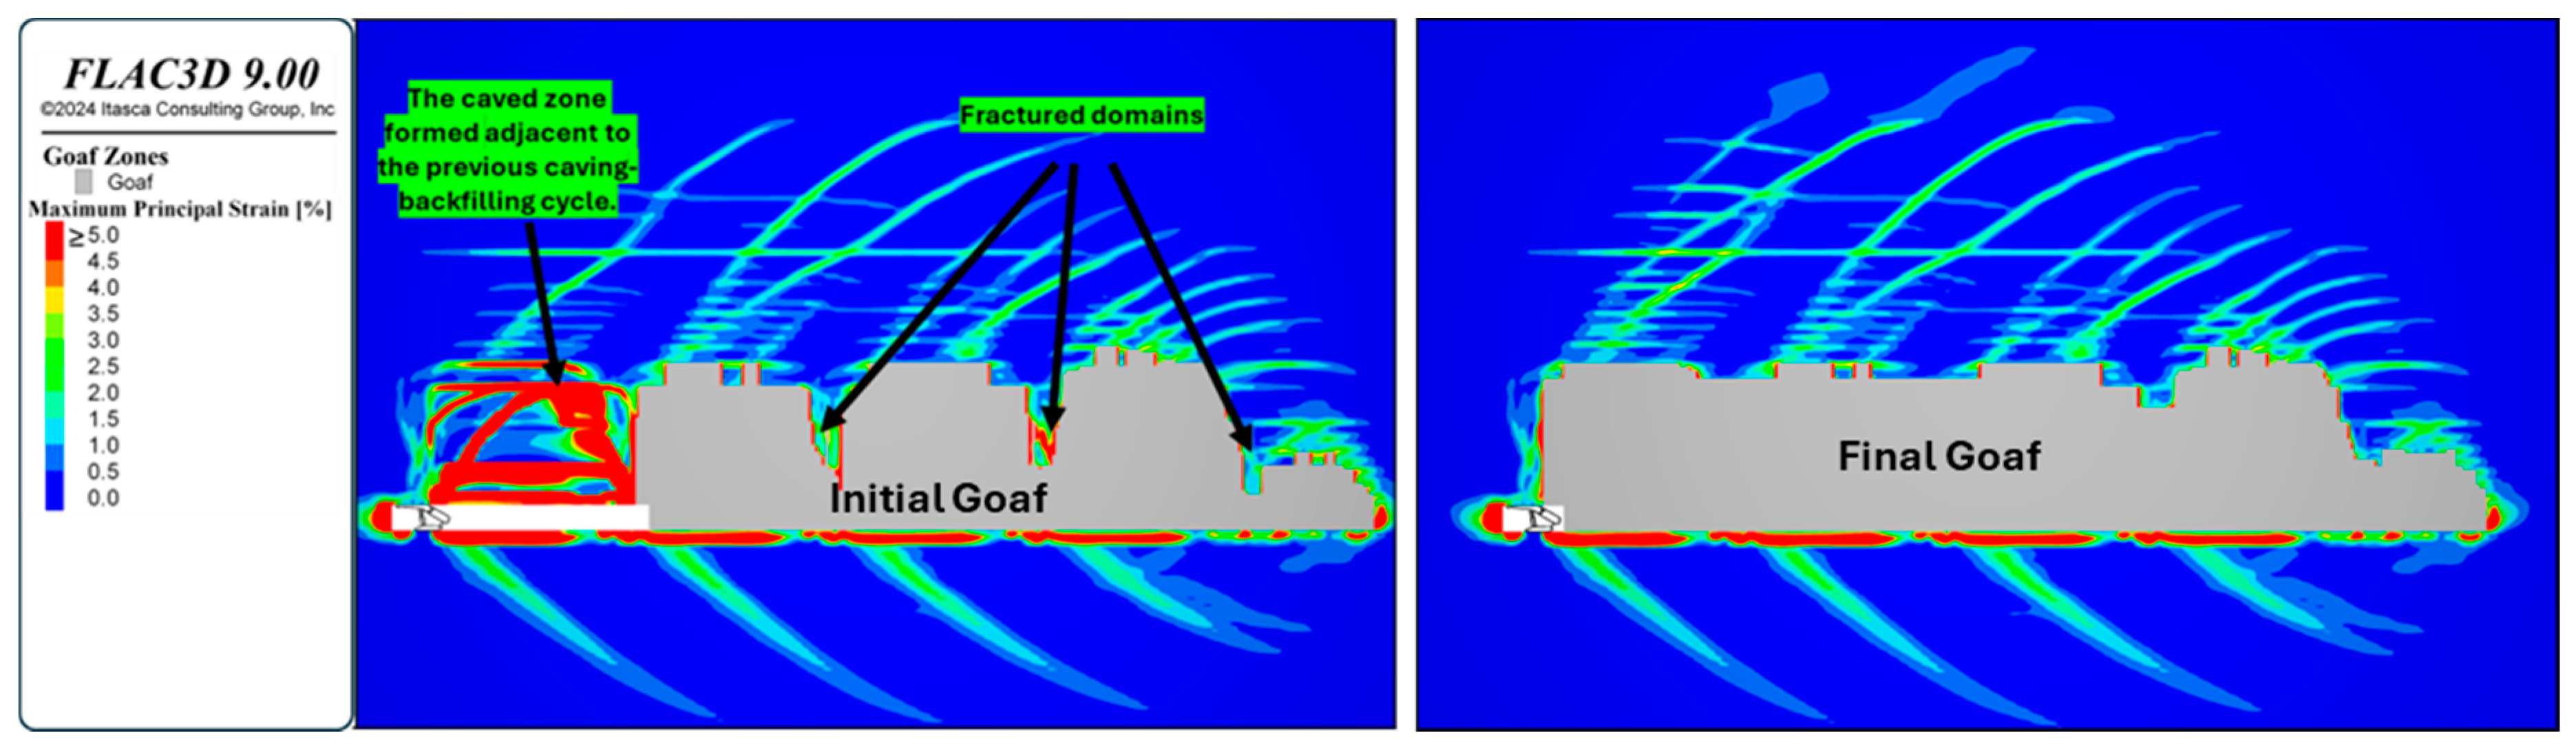
An example of the fractured domains is illustrated in
Figure 6, alongside an example of a caved zone formed adjacent to the previously backfilled stage. The zones highlighted in red contours have exceeded a
of 5.0% and must be included in the caved area. It should be noted that all zones beneath those with a critical strain value should be nulled at this stage. The assumption is that zones with 5.0% strain or higher are entirely fractured, with fractures extending wide enough to form bulk fragmented blocks that must be accounted for in the caving zone. A comprehensive numerical modeling analysis is provided in the following sub-sections.
The critical cave-in strain (εc) used in the algorithm defines the maximum extension strain that the roof strata can sustain before caving occurs. The choice of εc is influenced by several factors [
16]:
Roof quality: The value of εc depends on the quality of the roof strata, which varies with the rock type and its mechanical properties.
Stratum thickness and stress state: The thickness of each stratum and the prevailing stress conditions impact the critical strain. Thicker strata and varying stress states can alter the strain tolerance.
Back-calculation: Given the lack of straightforward methods for directly obtaining εc, we rely on back-calculation from measurement data. This approach involves using empirical data and adjusting the strain values to match observed caving behavior in similar geological settings.
4.2. Numerical Analysis of Caving Mechanism
The assessment of longwall caving in FLAC3D 9.0 involves analyzing several key model outputs:
Maximum principal strain: This strain represents the total deformation in the caved zone, where rock slabs disintegrate from the in situ rock towards the void. A maximum principal strain exceeding 5% indicates the boundaries of the caved zone. The caving algorithm developed in FLAC3D 9.0 identifies zones with such strain levels as the goaf region, modifying their material properties to reflect fragmented bulked material.
Displacement: In FLAC3D 9.0, displacement offers valuable insights into the deformation and stability responses of the rock mass, particularly in supported regions such as the shield area. These data enable the assessment of ground support measures by providing information about floor heave, roof collapse, and the stability of the longwall face.
Damage Plasticity: In the IMASS constitutive model, damage signifies the degree of fracturing and rock breakage, ranging from 0% (solid in situ rock) to 100% (highly fractured rock). This indicator depends on how cracks initiate (in tension or shear) during the softening stage and extend to form larger fractures in the caved zone.
Principal Stress: A softer coal seam is typically sandwiched between stronger roof and floor layers, experiencing vertical stress due to overburden pressure. When a goaf forms during longwall production, a de-stressed zone emerges around the caved zone, significantly reducing stress from its in situ level. Monitoring principal stresses provides insights into stress redistribution in these zones, complementing the assessment of rock mass damage and caving mechanisms.
4.3. Maximum Principal Strain
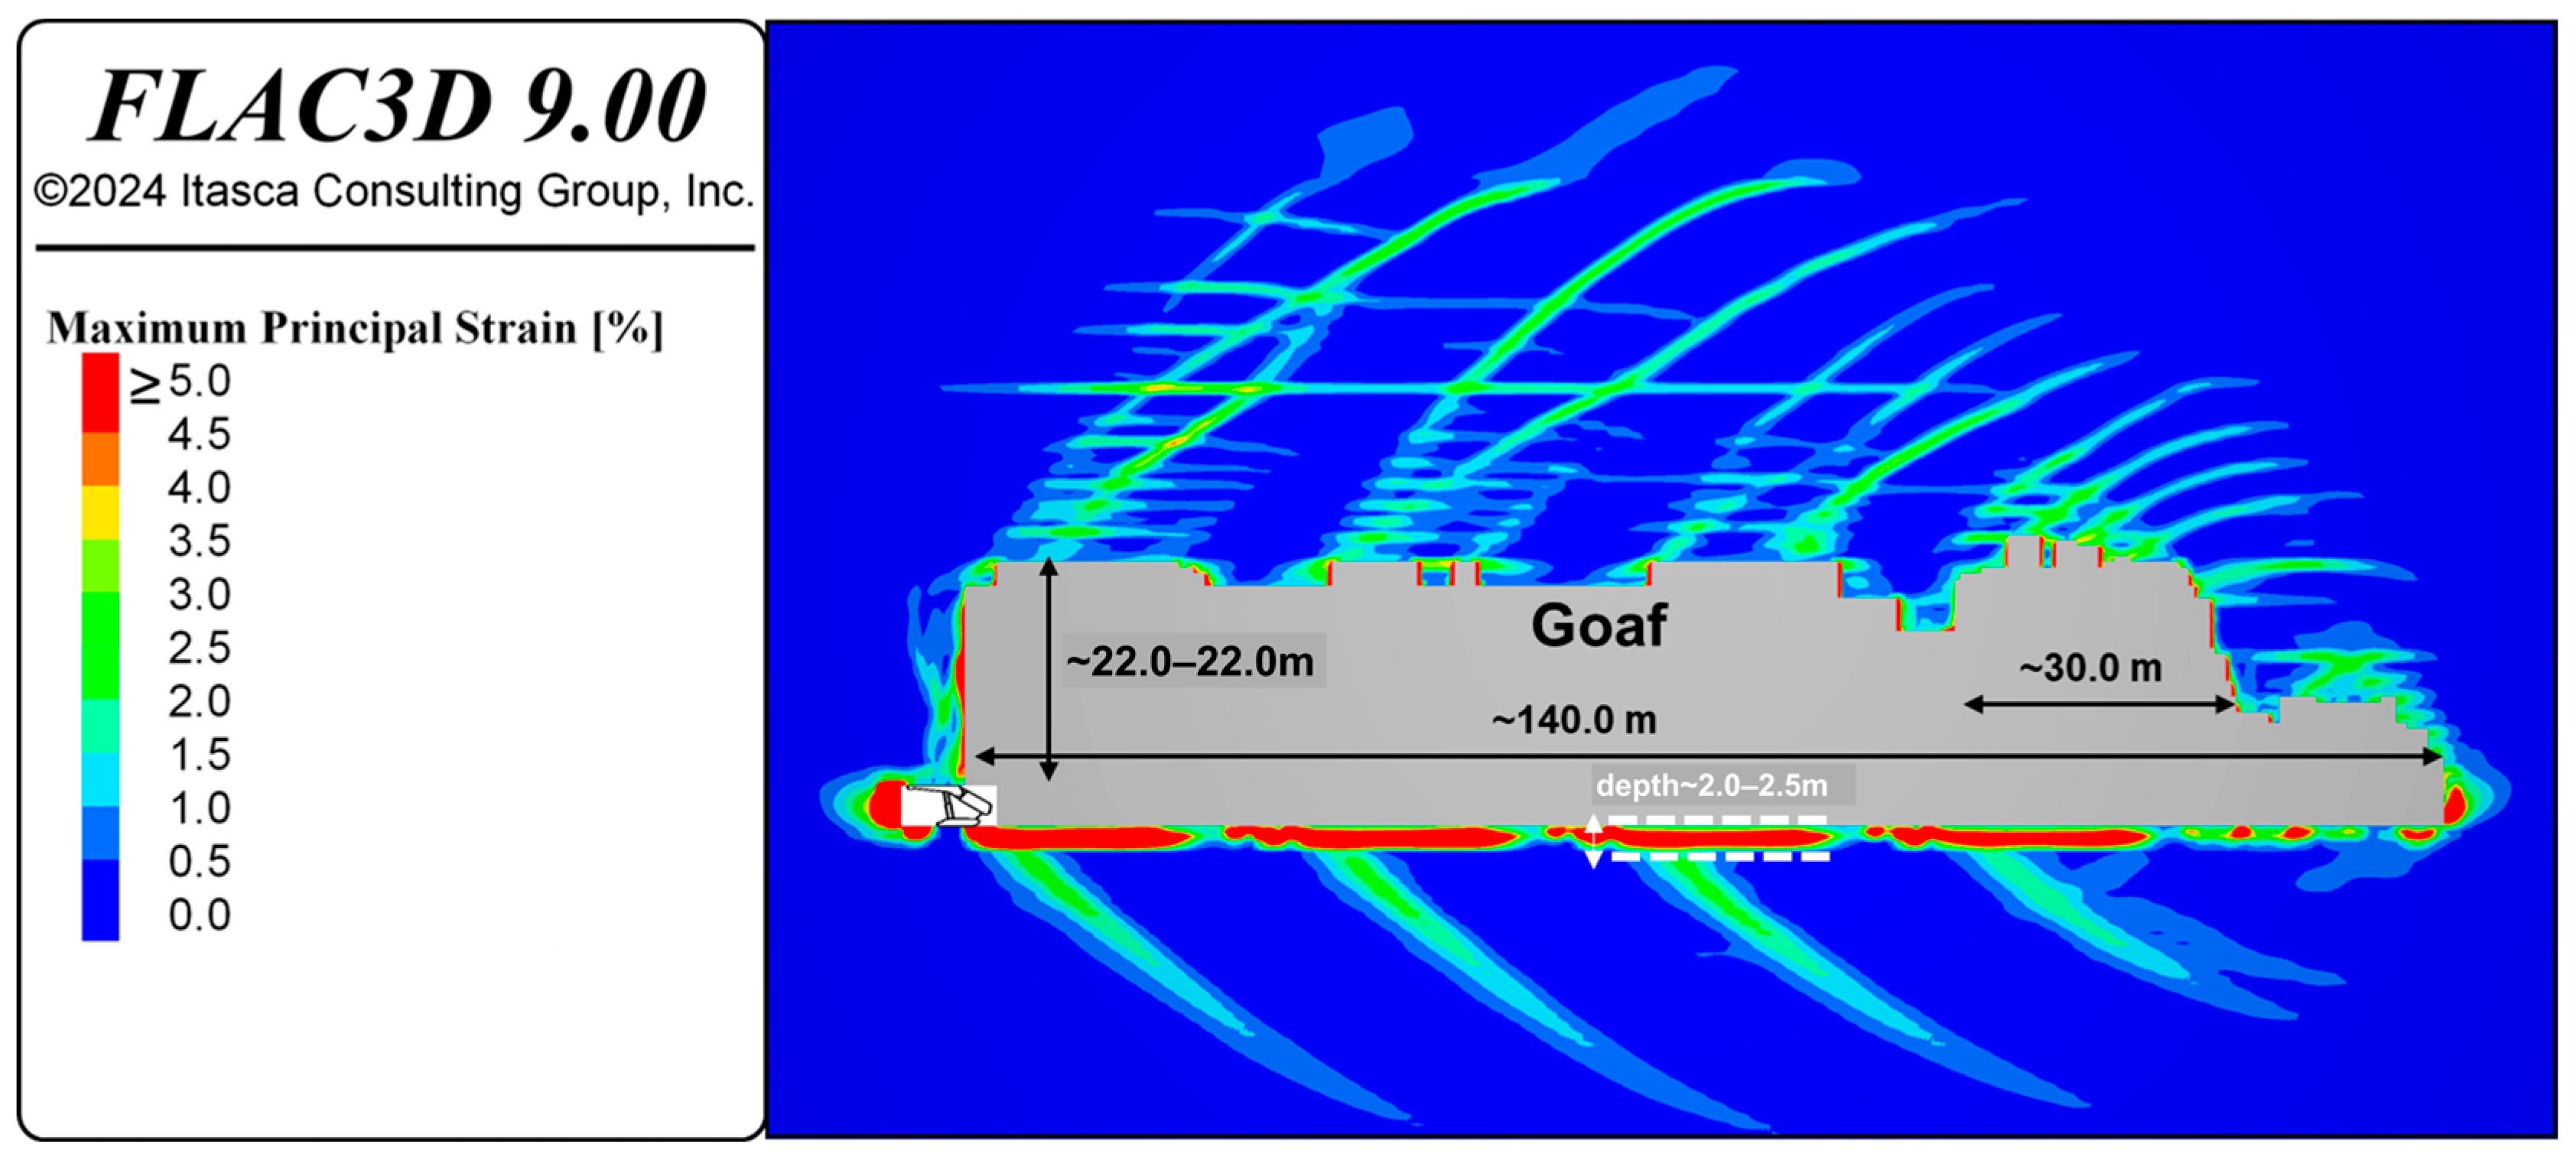
Figure 7 shows the maximum principal strain of the caving model.
Figure 7 illustrates a zoomed-in view of the maximum principal strain in front of the shield. The zones with a maximum principal strain greater than 5% are labeled as the goaf region, depicted in gray in
Figure 7. The objective of this numerical assessment was to identify the shape and thickness of the caved zone. Therefore, four cycles of caving were modeled after determining the critical caving distance.
The caved zone (goaf) represents the immediate coal roof before caving occurs, and its thickness typically ranges from two to eight times the height of the excavation [
5]. In this case, the goaf thickness is predicted to be approximately six times the excavation height (6 × 3.8 ≈ 20 to 22 m). The initially predicted critical distance by the model was 20.0 m. However, this value needs adjustment to achieve an empirically derived goaf thickness. It has been determined that the critical distance, at which the immediate roof breaks and falls to form the caved zone, is predicted to be 1.5 times the initial critical distance, resulting in a revised distance of 30 m, as shown in
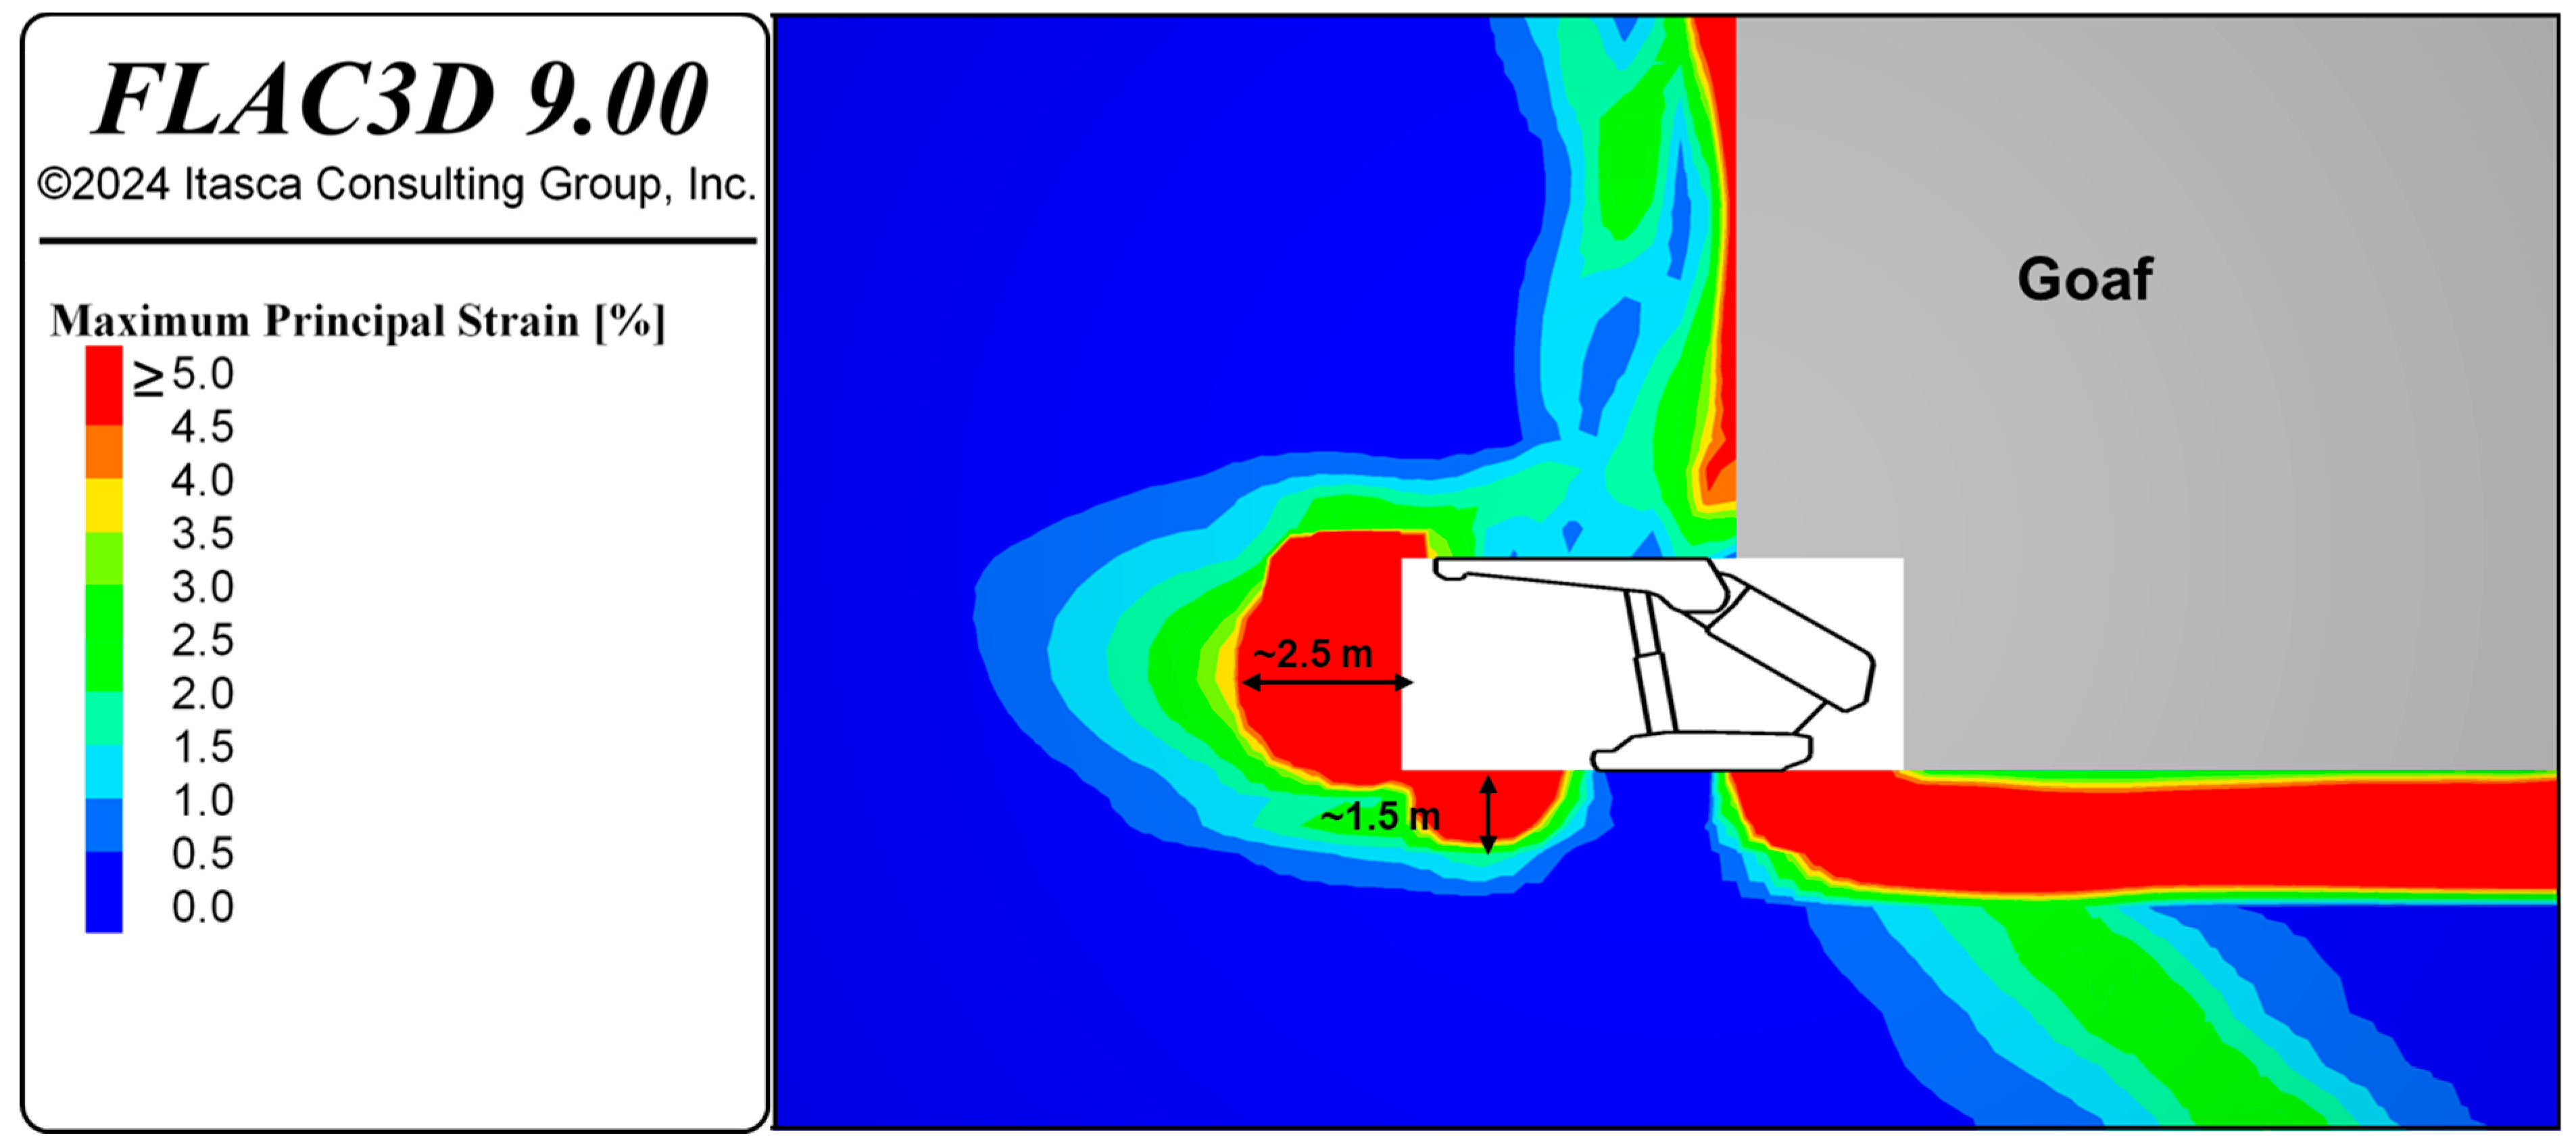
Figure 7. This 30.0 m advancement was required to achieve a reasonable caving behavior at each cycle of coal extraction. At each caving cycle, the floor deformation is monitored, showing a depth of 2.0 to 2.5 m of high deformation zone (
Figure 7). This deformation is primarily in the form of floor heave, as illustrated in
Figure 8 at the shield front, with a depth of approximately 1.5 m and a maximum strain value of 5% or higher. A high-strain zone is also observed at the shield front longwall face, with a depth of approximately 2.5 m and a maximum principal strain of 5% or higher (
Figure 8). There is also a narrow zone of high deformation on the shield roof adjacent to the goaf, which will be incorporated into the goaf region in the next excavation–caving cycle.
Above the caved region, both horizontal and sub-vertical fractures form, with a maximum principal strain ranging from 1.5 to 4% (
Figure 7). The formation of these fractures is a direct consequence of the strain-softening behavior implemented in the numerical model (IMASS), which allows the rock mass to undergo crack initiation and generate macroscopic fractures. This fractured region results from progressive excavation–caving cycles. Sub-vertical fractures are also observed on the floor during progressive excavation–caving cycles, with maximum principal strain values ranging from approximately 2% to 3% (
Figure 7).
Figure 7 illustrates the extension of horizontal fractures, a result of the bedded nature of the SS layer. The sharp rise in maximum principal strain along the bedding plane between the SS and ST units has led to the development of an extensive horizontal strain zone, signaling the disintegration of the bedding plane. A more detailed analysis of this mechanism, as revealed by monitoring the damage response in
Section 4 and
Section 5, provides further insights into the fracturing process.
As shown in
Figure 8, the maximum principal strain near the top of the shield canopy reaches a low value of 1.5%. This demonstrates that the shield model integrated into the caving simulation effectively replicates the performance of longwall support. At greater distances above the canopy and within the caved zone, significantly higher principal strain values are observed, attributed to the rapid development of macroscopic fractures and the associated stress reduction in the caved region.
A comparative analysis of
Figure 7 and
Figure 8 highlights the difference in the principal strain distribution between the overall caving model and the shield front.
Figure 7 presents a broader view, identifying zones with maximum principal strain greater than 5% within the goaf region, indicating the thickness and extent of the caved zone. Meanwhile,
Figure 8 zooms in on the shield front, where floor deformation and a maximum strain value of 5% are observed, particularly around the longwall face and roof area adjacent to the goaf. The deformation pattern, including floor heave, is more detailed in
Figure 7, which contrasts with the more extensive strain zones in
Figure 8 that result from progressive excavation–caving cycles. Together, the numerical results presented in
Figure 7 and
Figure 8 demonstrate how strain behavior varies from the caved region to the shield zone, reflecting the shield’s role in stabilizing the roof and controlling deformation during caving.
4.4. Displacement
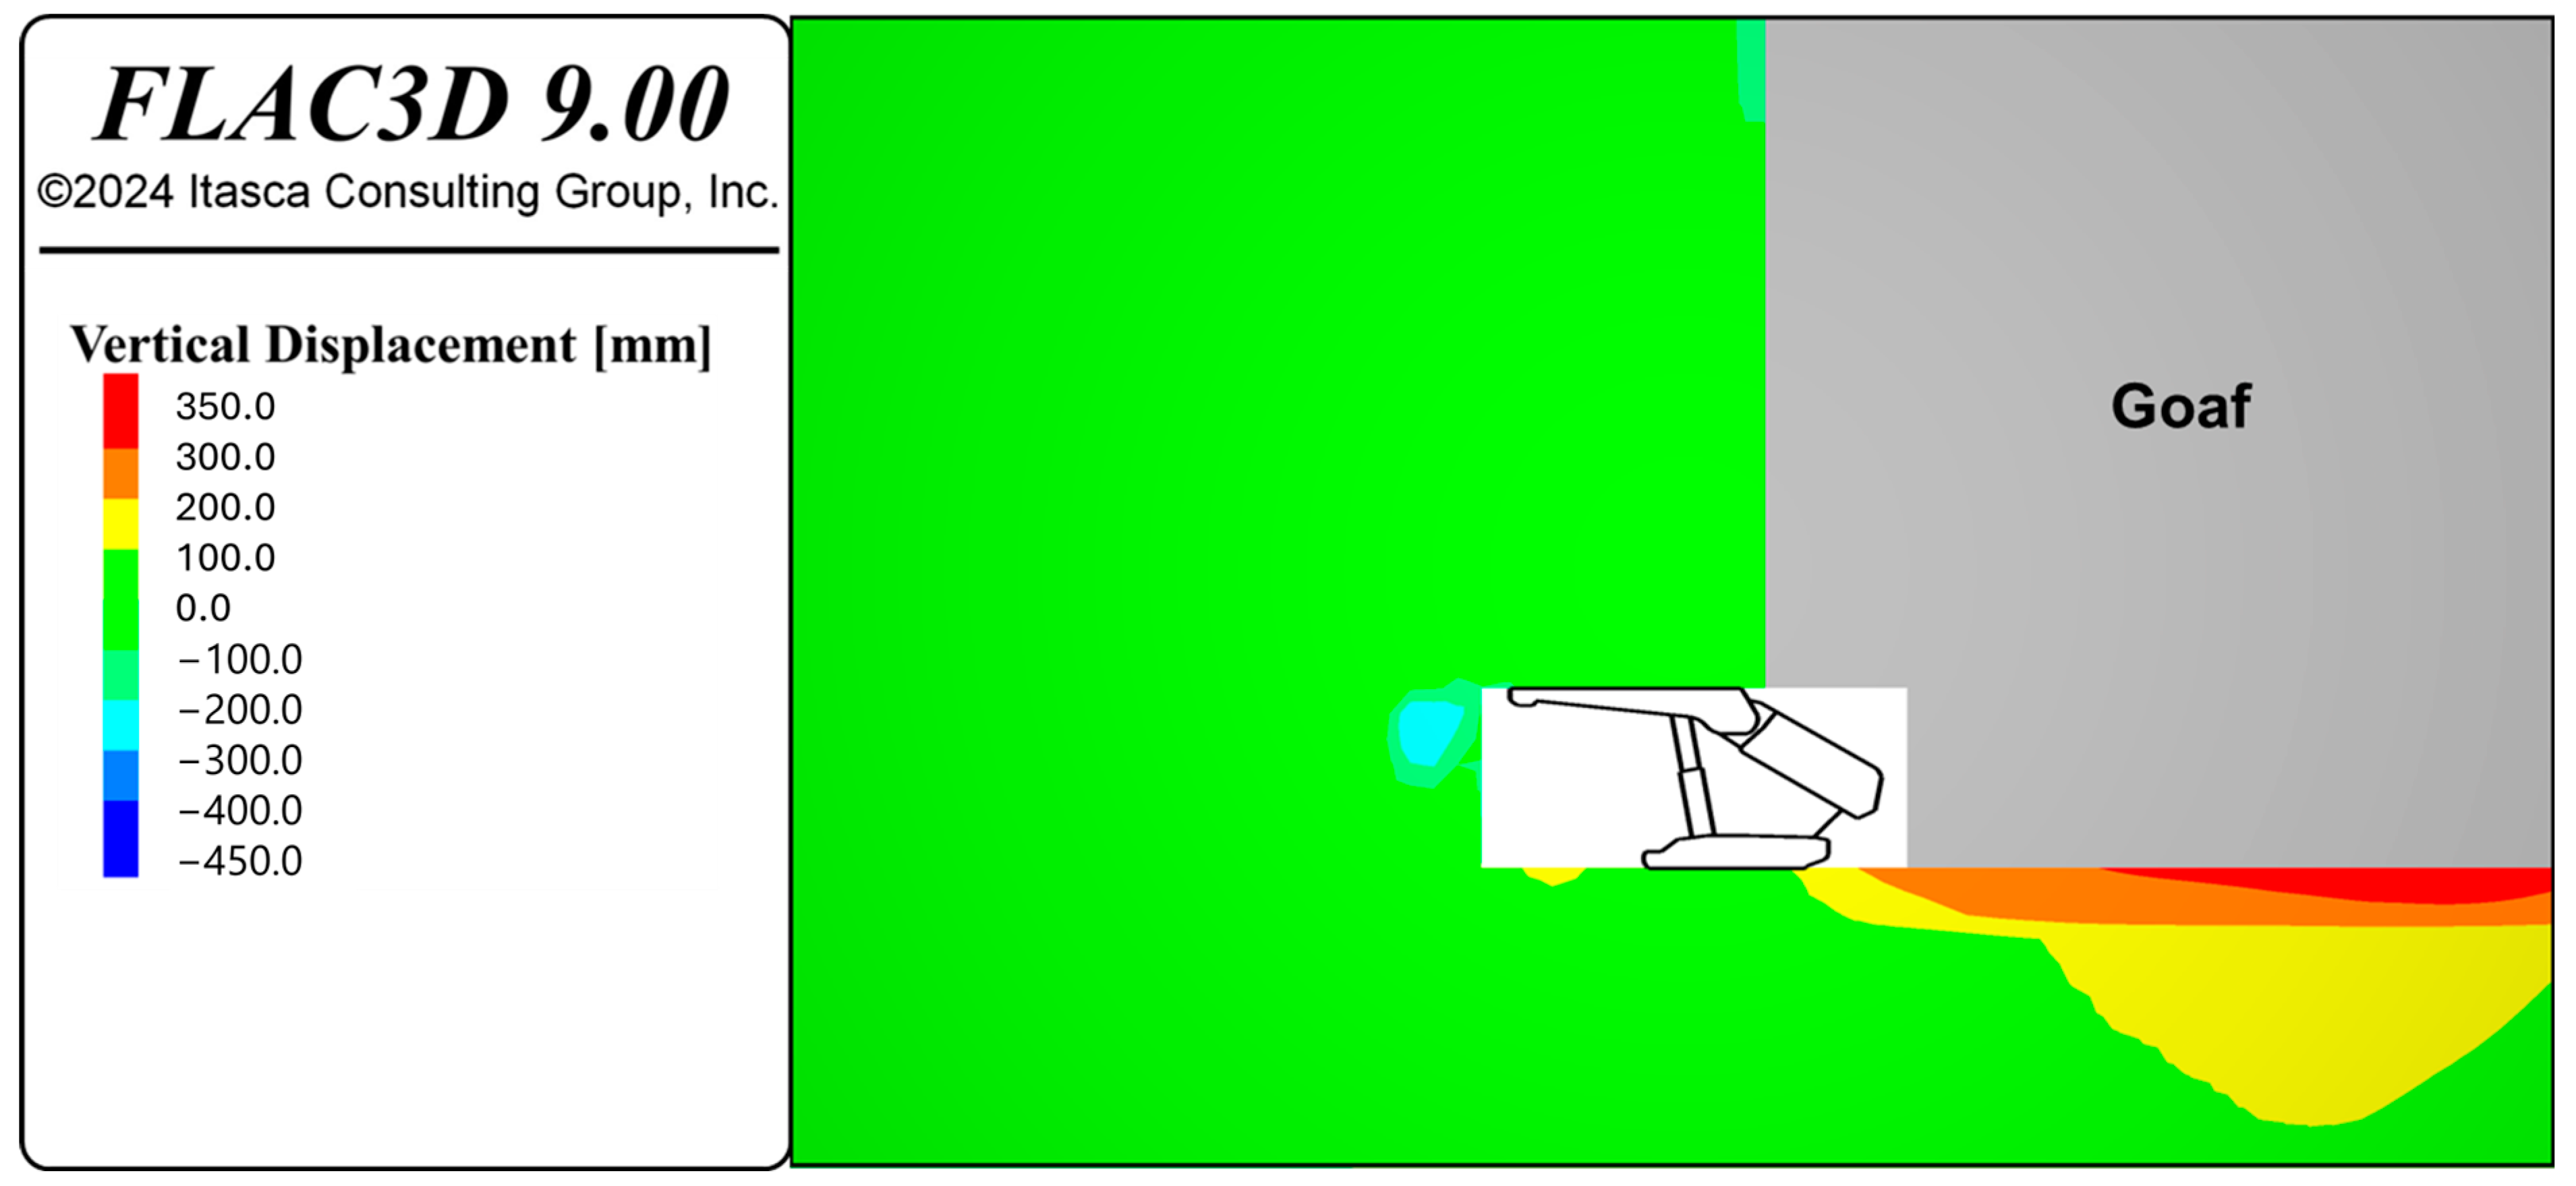
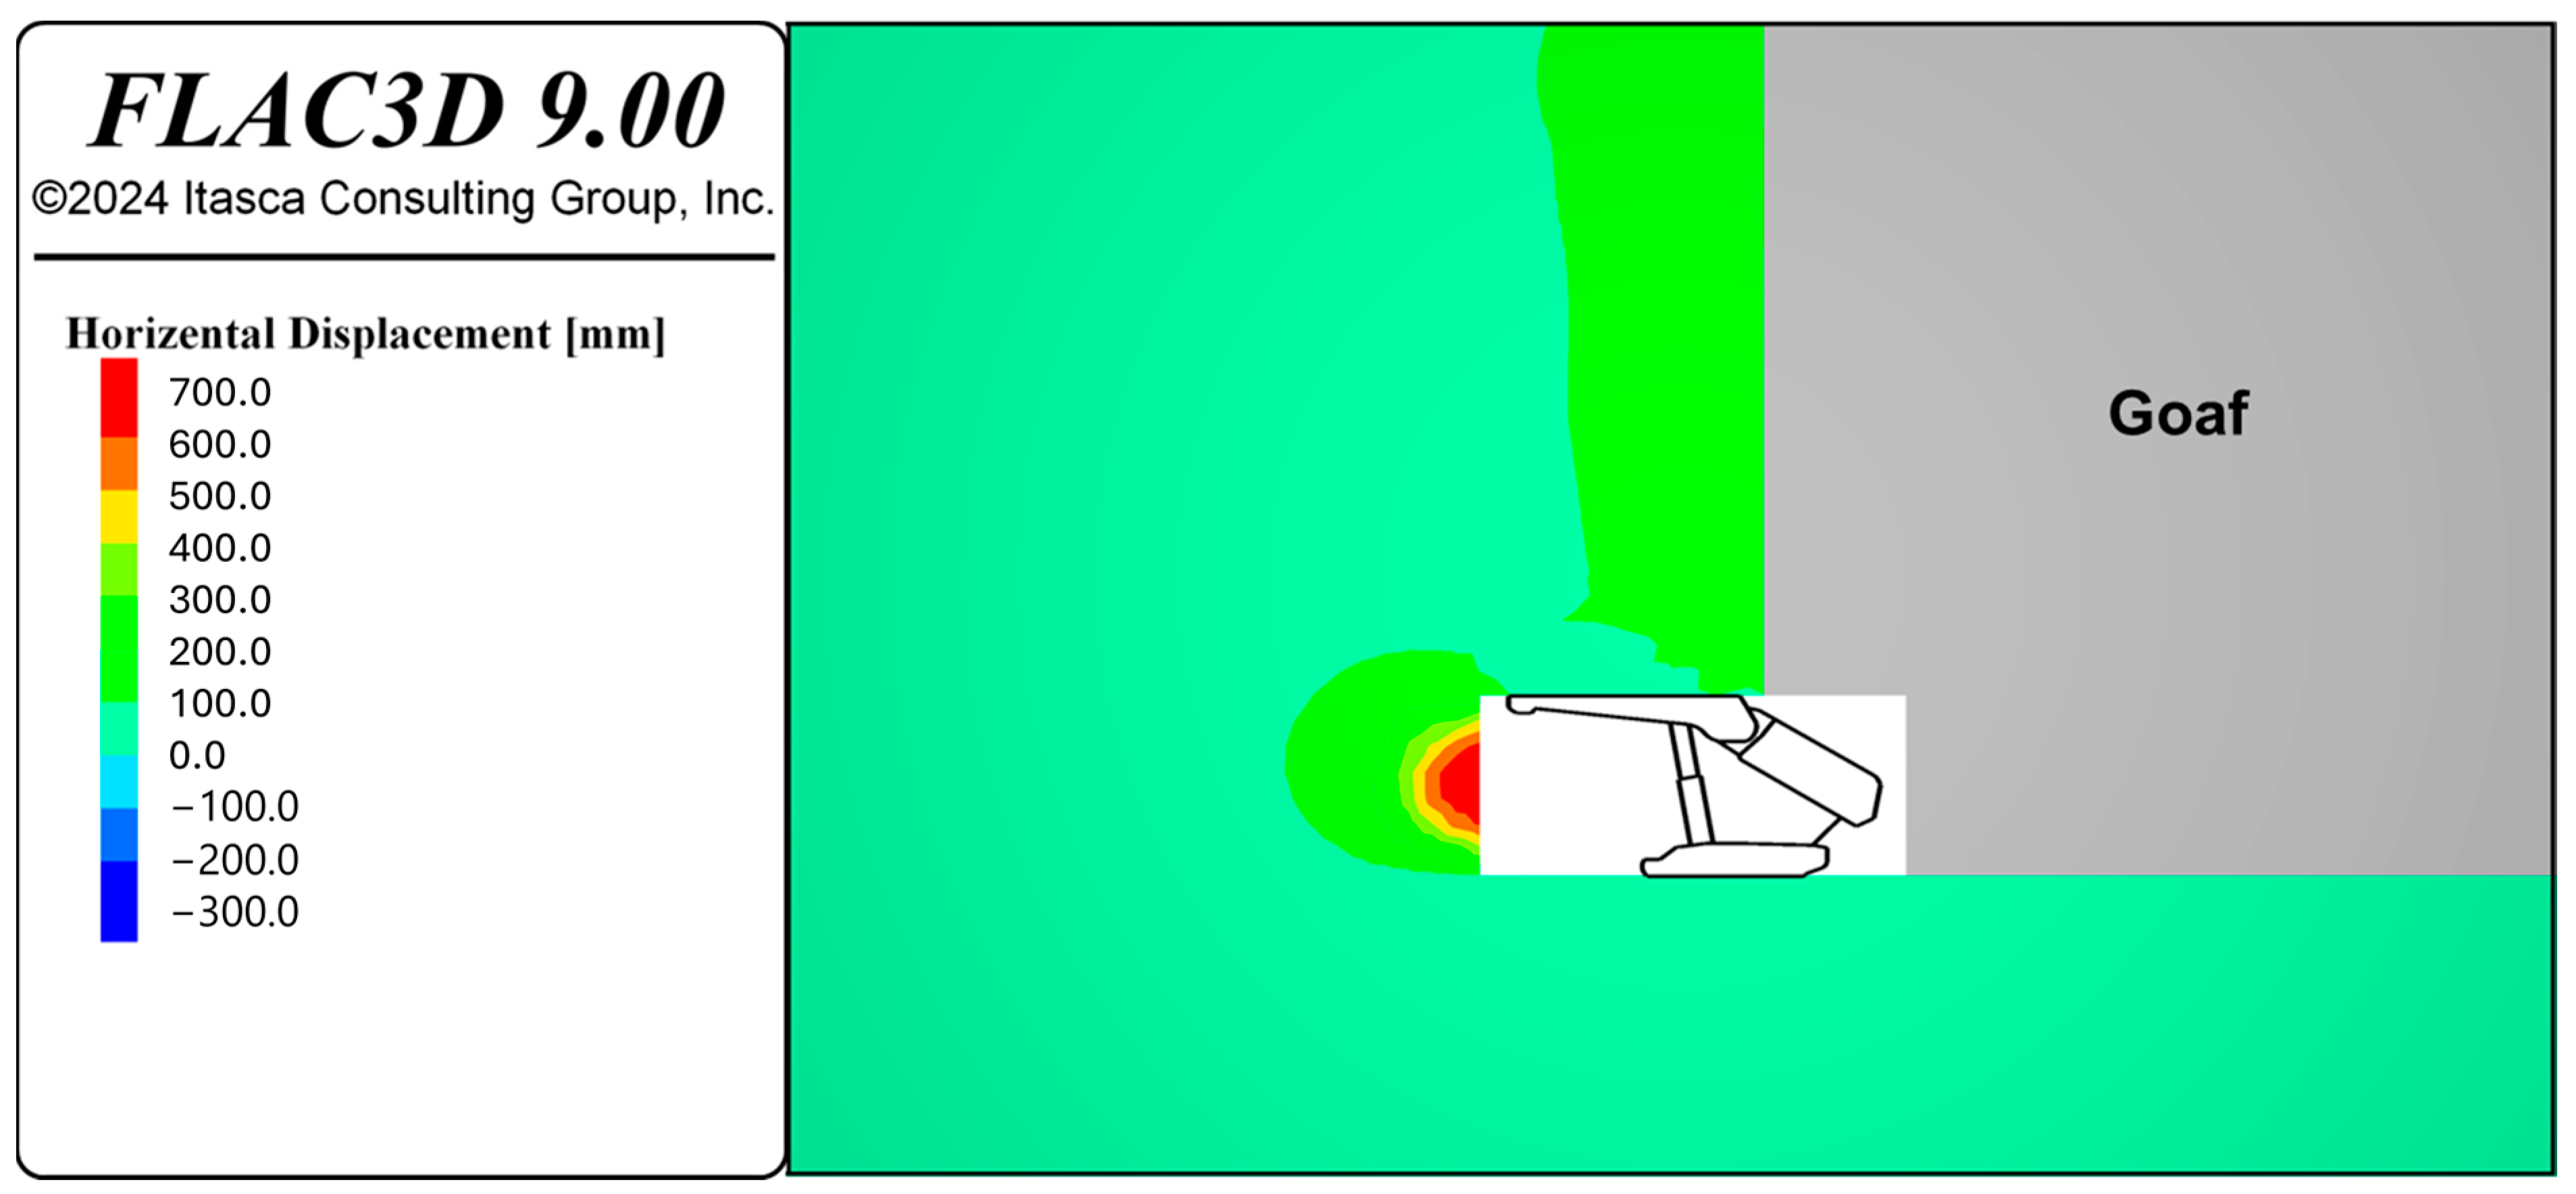
Figure 9 illustrates the monitoring displacement results of the supported area of the longwall mining face, indicating the displacements of the front, roof, and floor. The vertical and horizontal displacement contours are shown in
Figure 10.
The vertical displacements of the floor and roof are depicted, with negative values indicating downward displacement and positive values indicating upward displacement (i.e., heave). The front displacement is measured by monitoring the horizontal displacement of the model. The floor heave occurs at a depth of approximately 1.5 m from the floor, with a maximum displacement of nearly 120 mm. In the first 2 m of the immediate roof, the displacement ranges from 100 to 200 mm and then plateaus at a value of 35 mm. These results demonstrate the effectiveness of the shield support incorporated into the numerical model, as the primary requirement of the shield support was to confine and control the immediate roof and floor. The highest displacement is observed in front of the shield face, with a maximum value of 700 mm at the longwall face. The depth of this high displacement region is approximately 3 m, beyond which the displacement is less than 100 mm.
4.5. Damage and Plasticity State
In longwall mining, the rock mass is more susceptible to tensile failure during the formation of the caved zone. Tensile fractures typically occur due to failure along bedding planes and within rock mass units. The coalescence of these tensile fractures forms a fracture network that defines the shape, depth, and length of the caved zone. The role of shield support under such conditions is to maintain confinement to the caved zone and fractured rock mass and to initiate a consistent caving line.
There are numerous studies that explore rock mass fracturing above longwall coal seams and the associated caving mechanisms, providing valuable insights into the complex interactions between rock behavior and mining operations [
19,
30,
31,
32,
33]. Gale (2004) [
34] presented the fracture and caving mechanism using numerical modeling. The findings of this study indicate that damage begins significantly in advance of the longwall face, with fractures primarily resulting from bedding plane separations and rock mass failures. These fractures typically evolve into a complex network that directly influences the caving behavior observed at the faceline. In such conditions, the primary role of longwall face supports is to provide confinement to the fractured ground, promoting a uniform and controlled caving process [
34]. The numerical study of [
35] concluded that, well ahead of the longwall face line, the predominant failure mode is shear, while at the vicinity of the face line, tensile cracking controls failure behavior. The numerical analysis of [
4], however, showed that compressive shear failure is the dominant failure mechanism rather than tensile fracturing. In their review paper, Bai and Tu (2019) [
36] concluded that in brittle and hard coal seams, two main fracture patterns emerge: (a) fine fractures parallel to the longwall face, causing tensile splitting within the laminae, and (b) oblique shear fractures, leading to shear slipping of large blocks. In soft coal seams, crushed squeezing failures dominate, with tensile fractures forming along coal pillar boundaries and shear fractures occurring between core and tensile failure zones.
In the FLAC-IMASS model, the fracture response is monitored via a FISH function as “damage” on a scale of 0 to 100%, where 0% indicates no damage and 100% indicates complete damage. We slightly modified the “Sloss” parameter, a built-in output parameter in IMASS, to range from 0 to 100%. This adjustment facilitates a more precise evaluation of the degree of softening and weakening experienced by the rock mass throughout the caving procedure. Values between 0 and 100% indicate various degrees of damage, such as fracture initiation, large fracture formation, or bedding disintegration. The plasticity state is also monitored which serves as an indicator of shear or tension failure of rock mass.
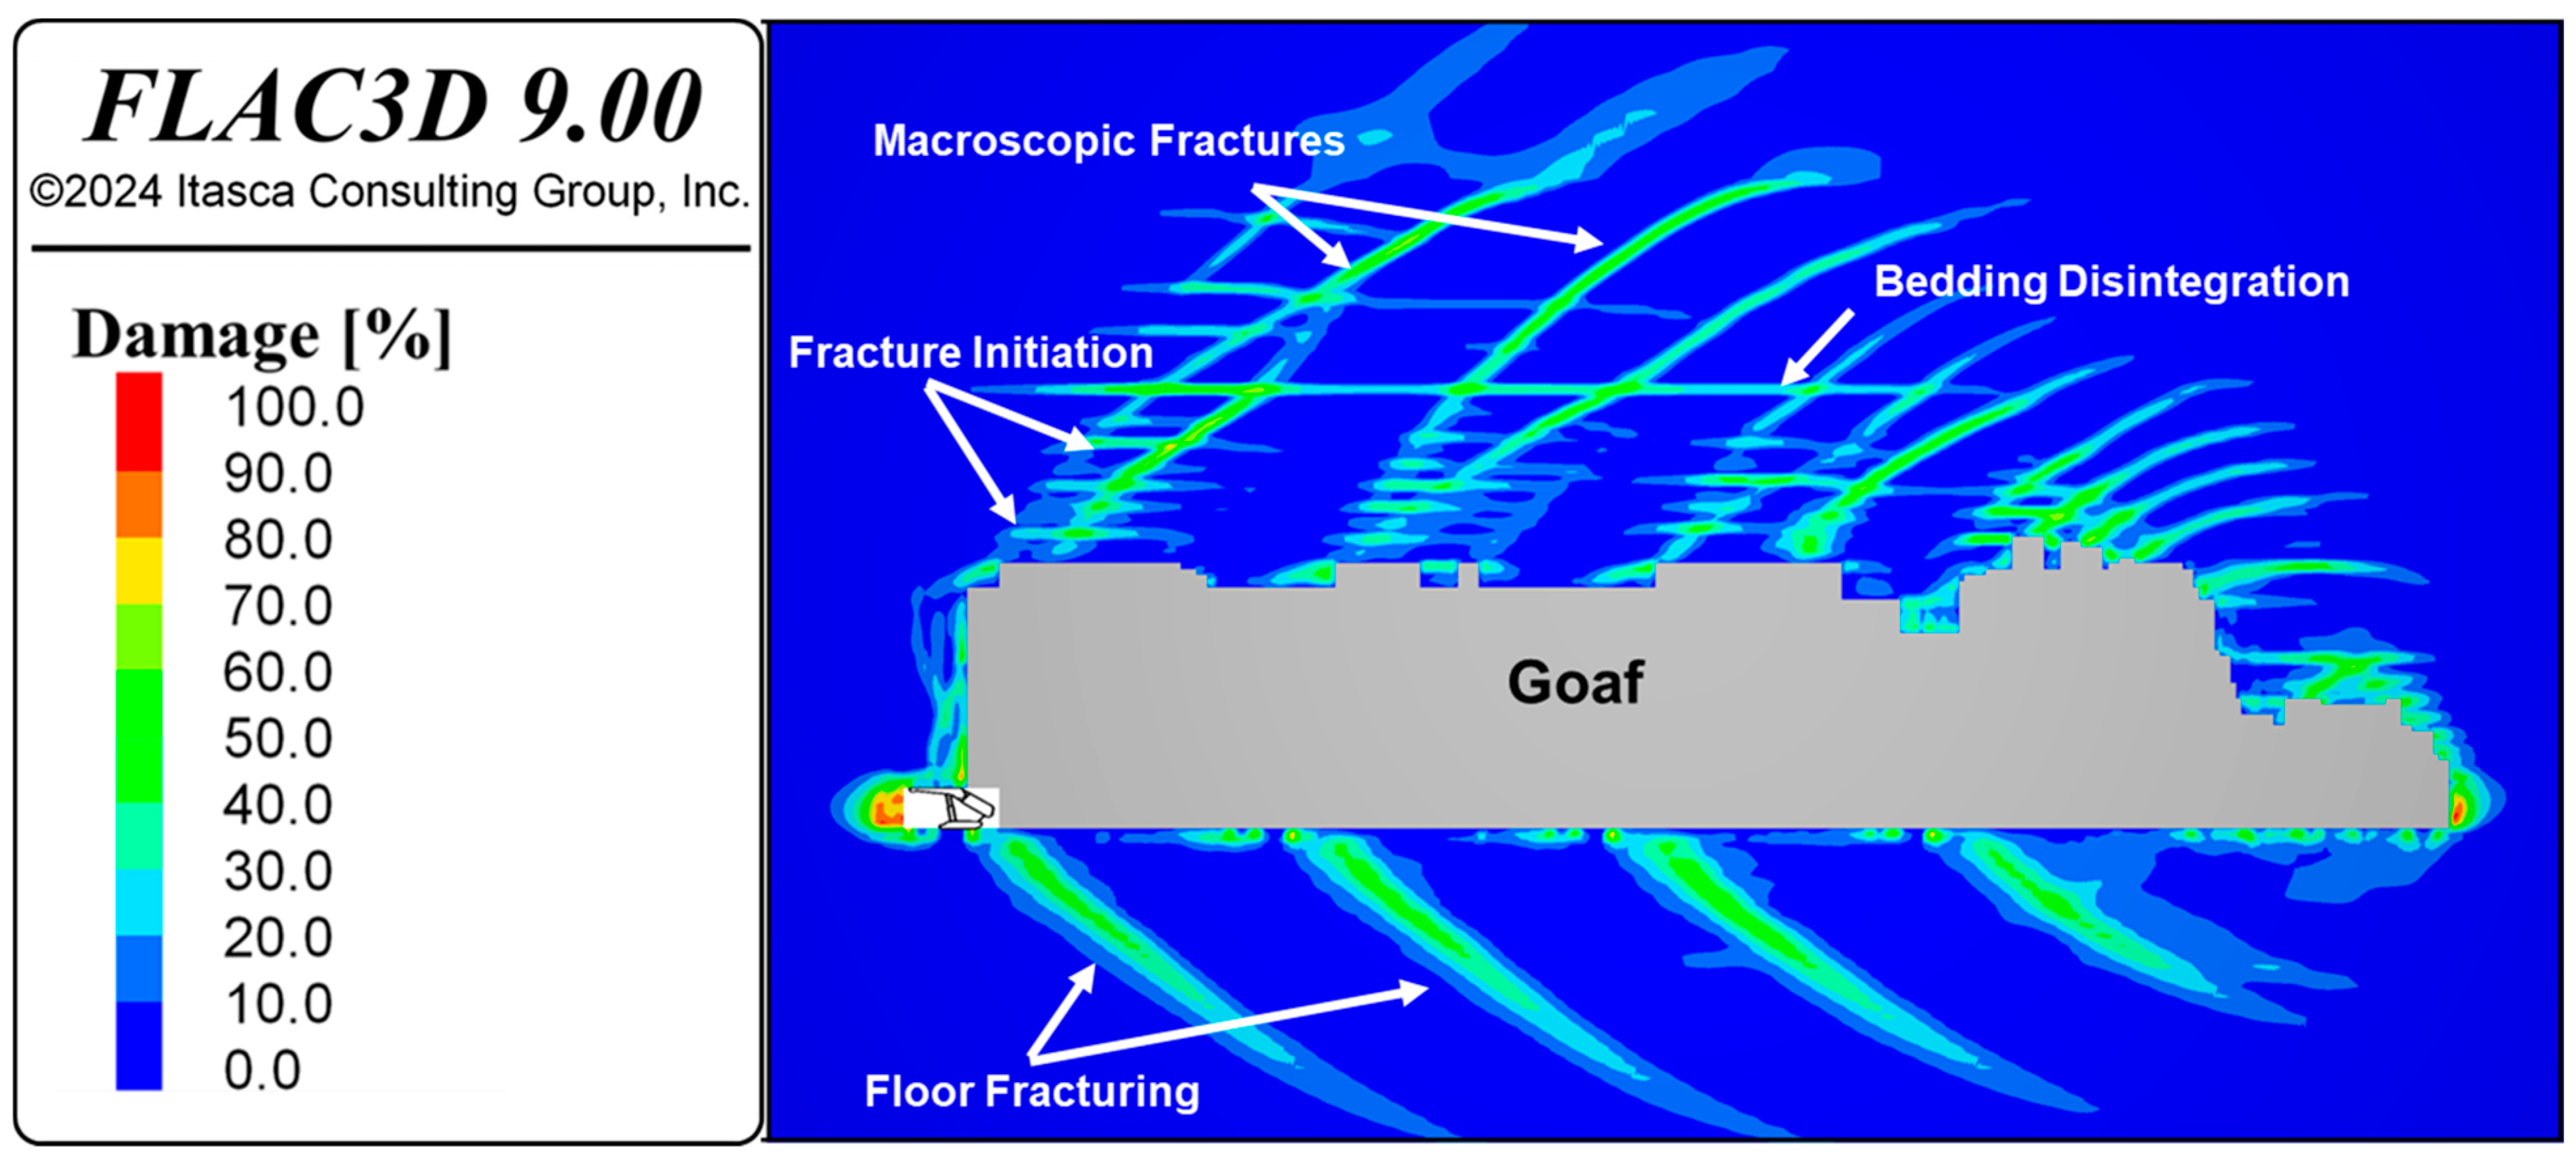
An example of macroscopic fracture in roof and floor, fracture initiation, and bedding disintegration is indicated in
Figure 11 and their corresponding plasticity state is depicted in
Figure 12. This depicts a combination of bedding plane shear failure, tensile fracture development in the rock mass, and the tensile breakage of the bedding planes, combined with shear fracture growth as part of the fracture network formation. The average damage value for this fracturing process is approximately 50%. The size of fractures in the fractured zone above the goaf varies significantly, ranging from a few centimeters (indicated by fracture initiations) to nearly 90 m (as indicated by bedding disintegration).
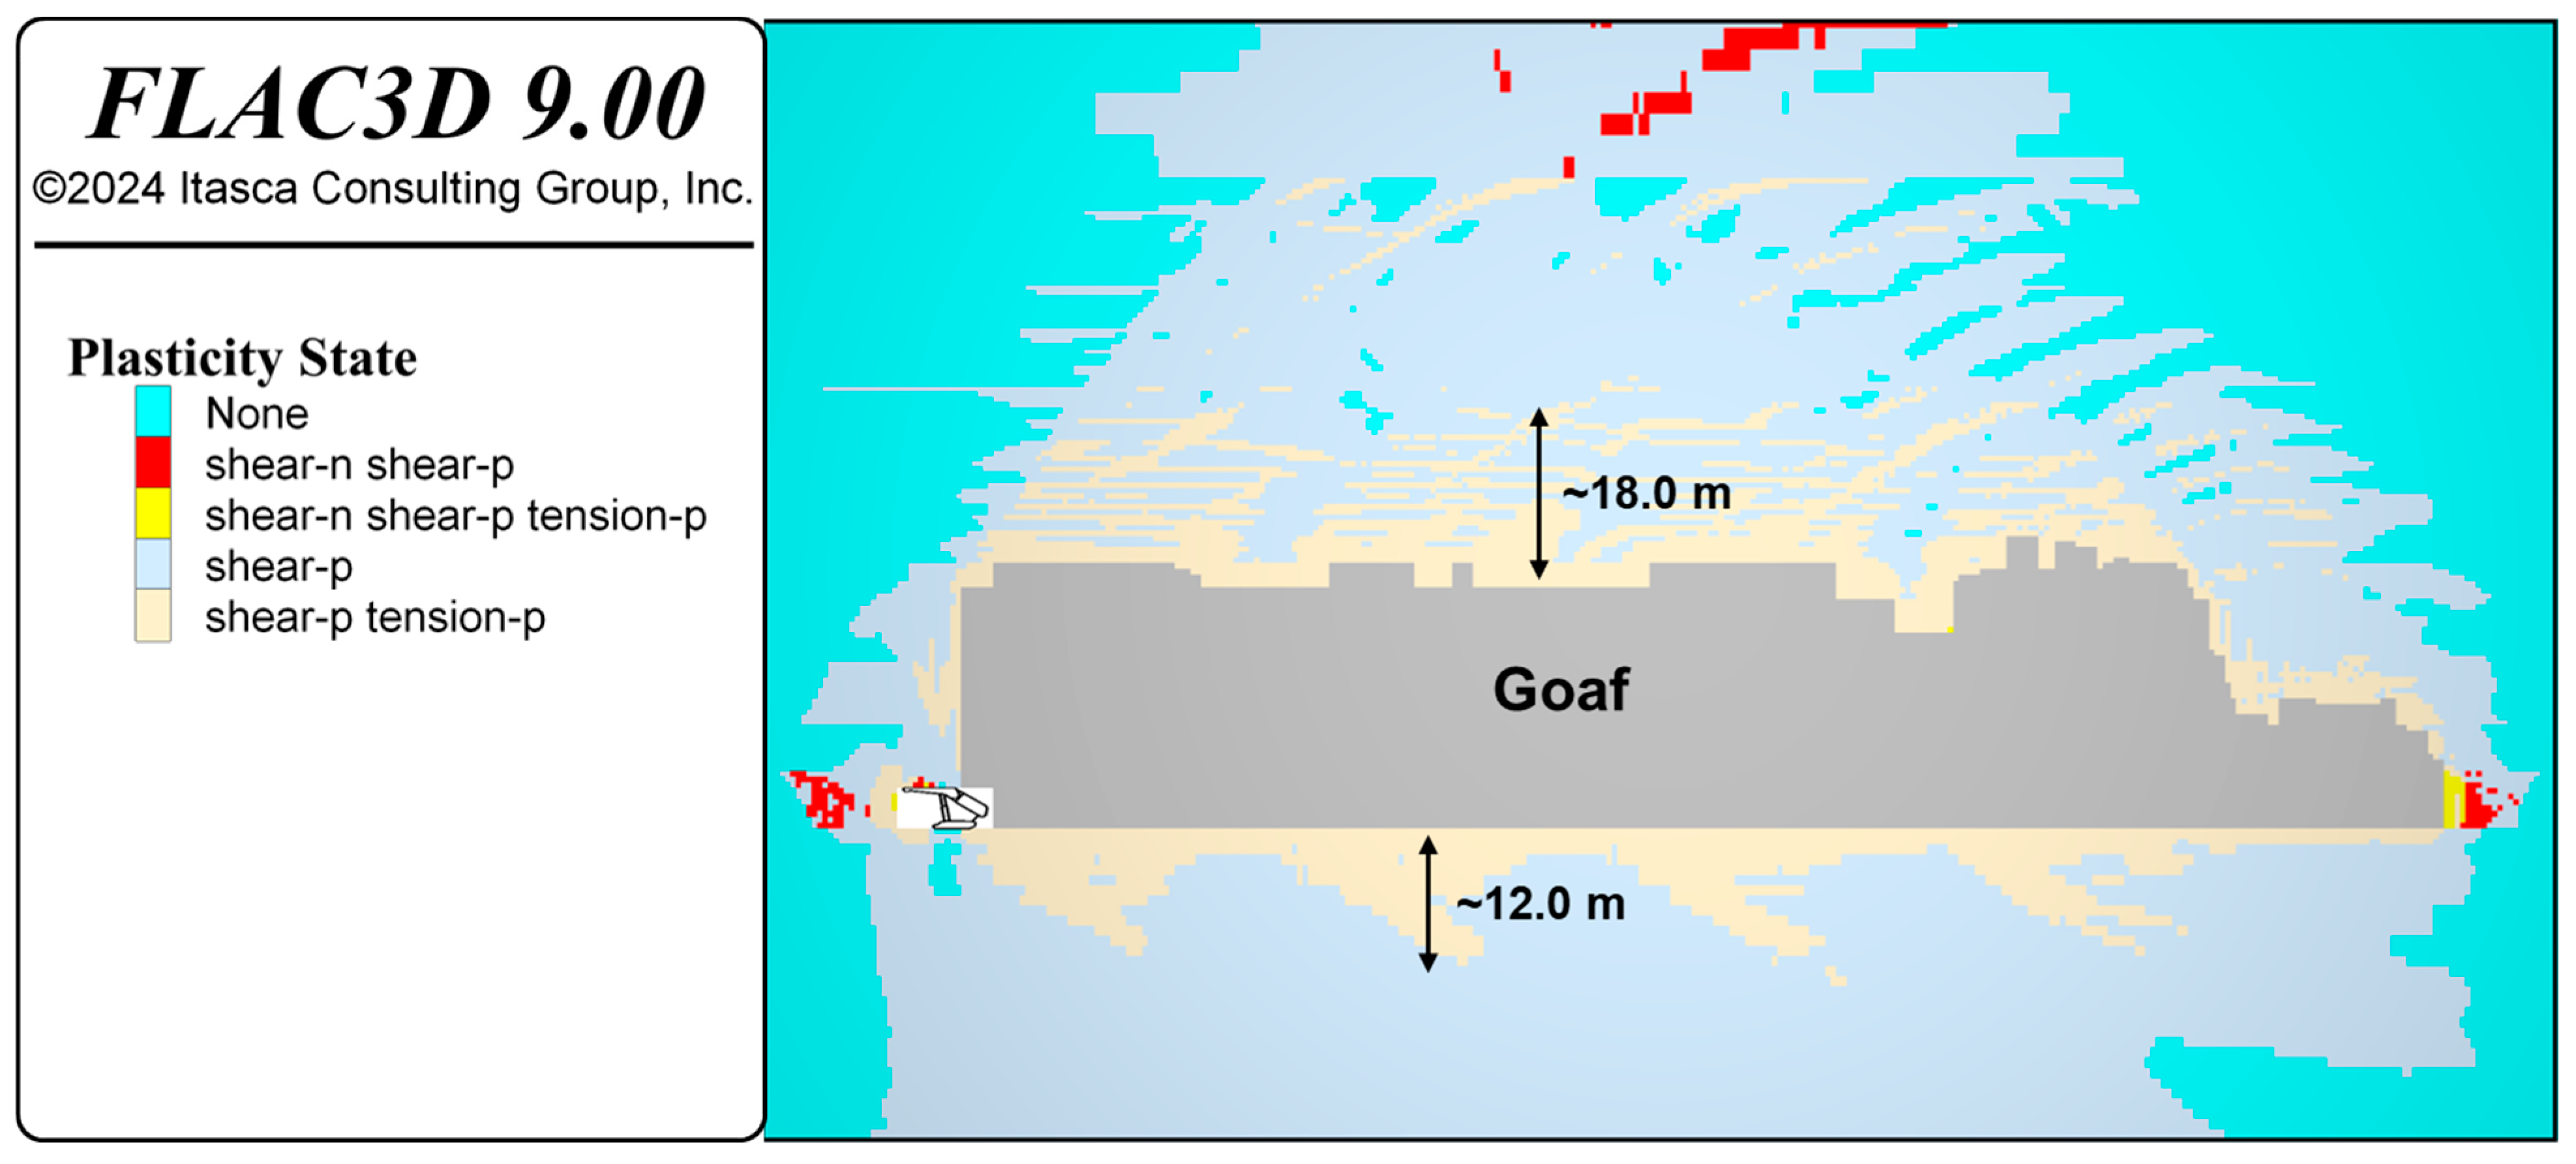
An examination of the plasticity state in the vicinity of the caved zone reveals a combination of tensile and shear fracture growth, extending to a depth of approximately 18 m above the goaf and nearly 12 m towards the floor, as illustrated in
Figure 12. Beyond these regions, shear failure is the dominant failure mechanism.
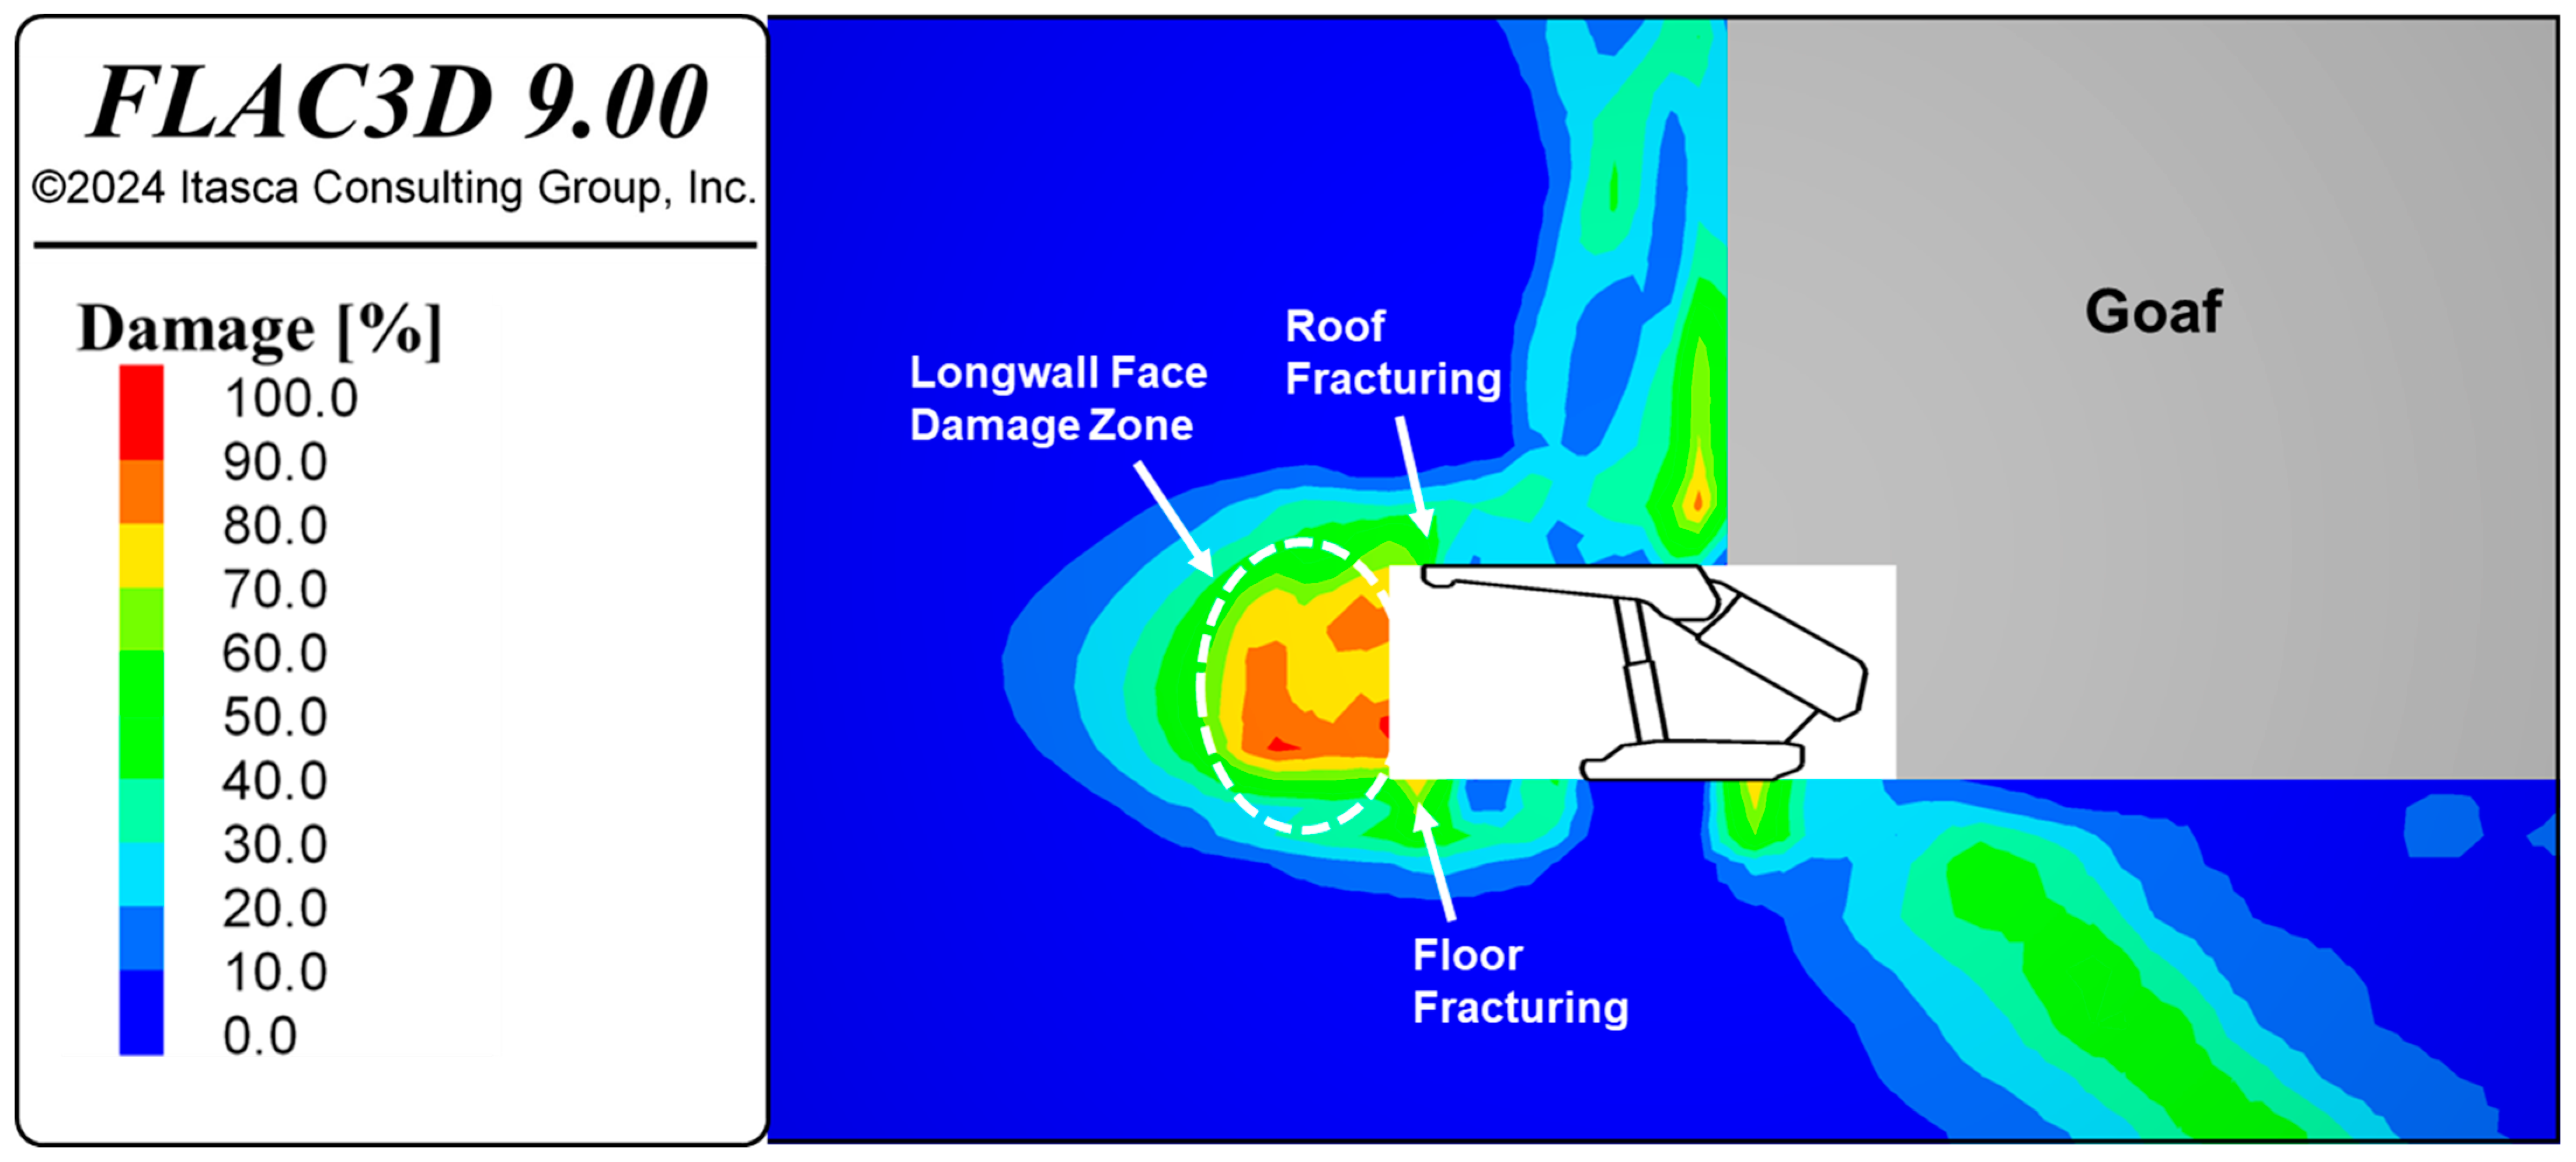
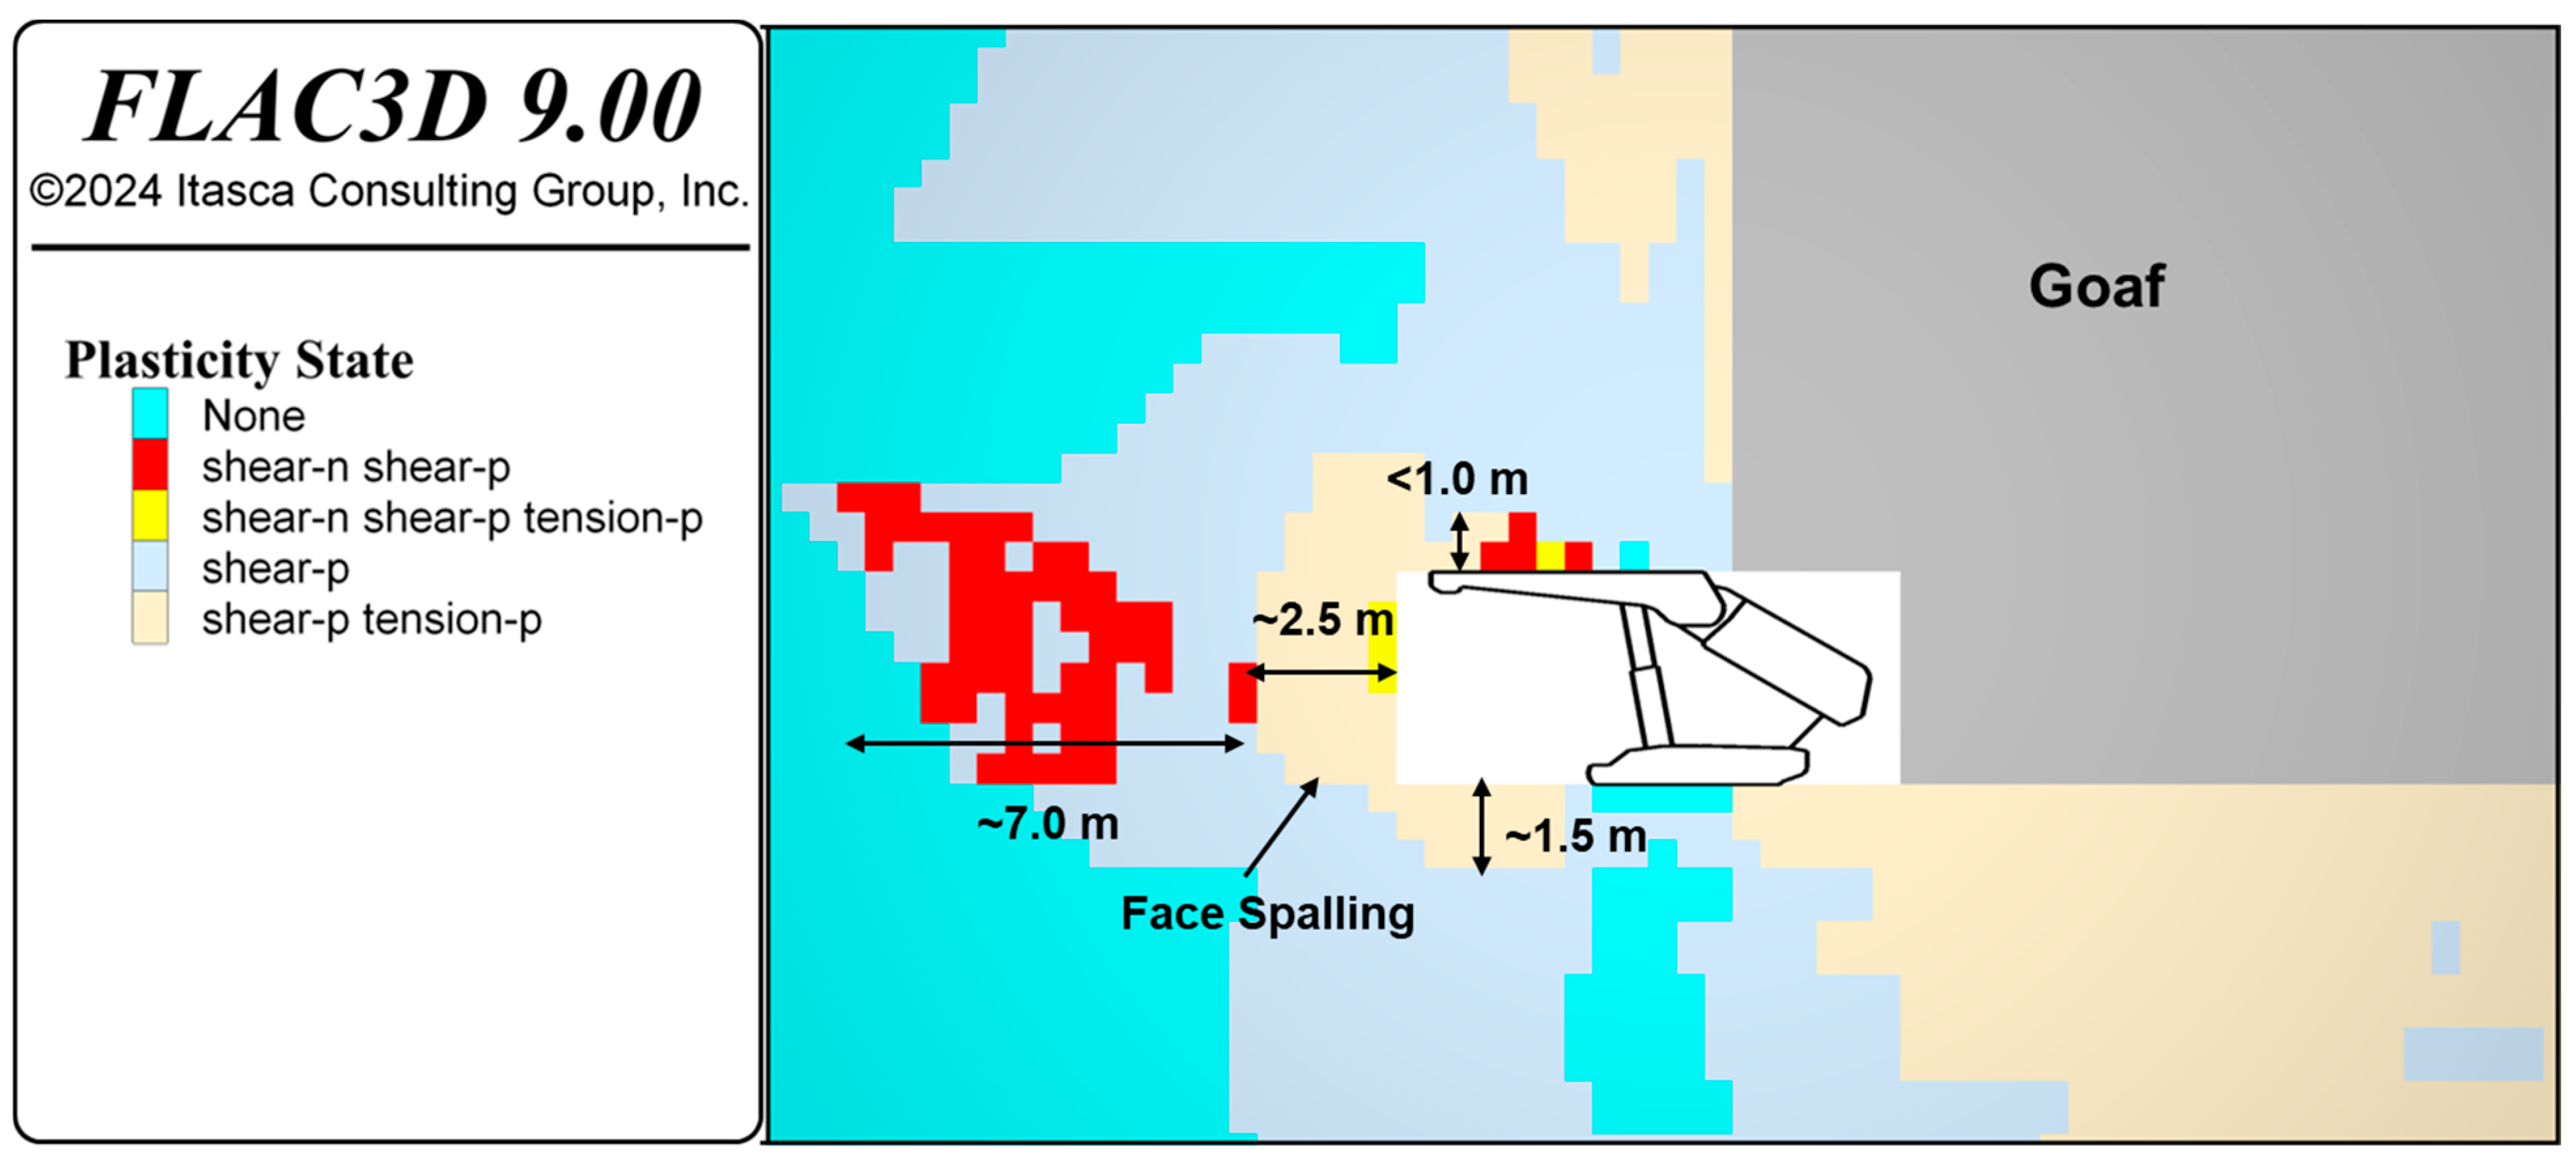
A zoomed-in view of the damage and plasticity state of the longwall face is illustrated in
Figure 13 and
Figure 14, respectively. The longwall face damage zone in
Figure 13 is indicated by a circled dashed line, which includes zones with damage values ranging from 60% to 100%. It can be seen from
Figure 14 that the depth of this damage zone is approximately 2.5 m from the excavation face, with the failure mechanism being a combination of tension and shear. The damage response of the supported roof above the shield canopy indicates the initiation of fractures, with a damage value between 20% and 40% (
Figure 13), at a height of less than 1.0 m (
Figure 14). The floor fractured zone is also observed in front of the shield, with an average damage value of 50% (
Figure 13), at a depth of approximately 1.5 m (
Figure 14).
The key feature is that the damage zone and fracturing process observed in the shield zone are not directly related to the caving process behind the support. There is also a fracturing process in front of the face with a depth of 7.0 m with an average damage of 30% to 40%, which is developing in the shear mechanism (
Figure 14).
Another key feature observed is that the shear fractures in the supported area tend to be limited in size (less than a couple of meters) and grow incrementally as localized cracks rather than forming large macroscopic fractures. The damage mechanism of the longwall face is mainly in the form of rock spalling, which occurs due to the high stresses induced by the overlying strata during the longwall production. This coal spalling is characterized by simultaneous shear and tension failure, resulting in the disintegration of small coal fragments from the face, often leading to a rough and irregular face (
Figure 14).
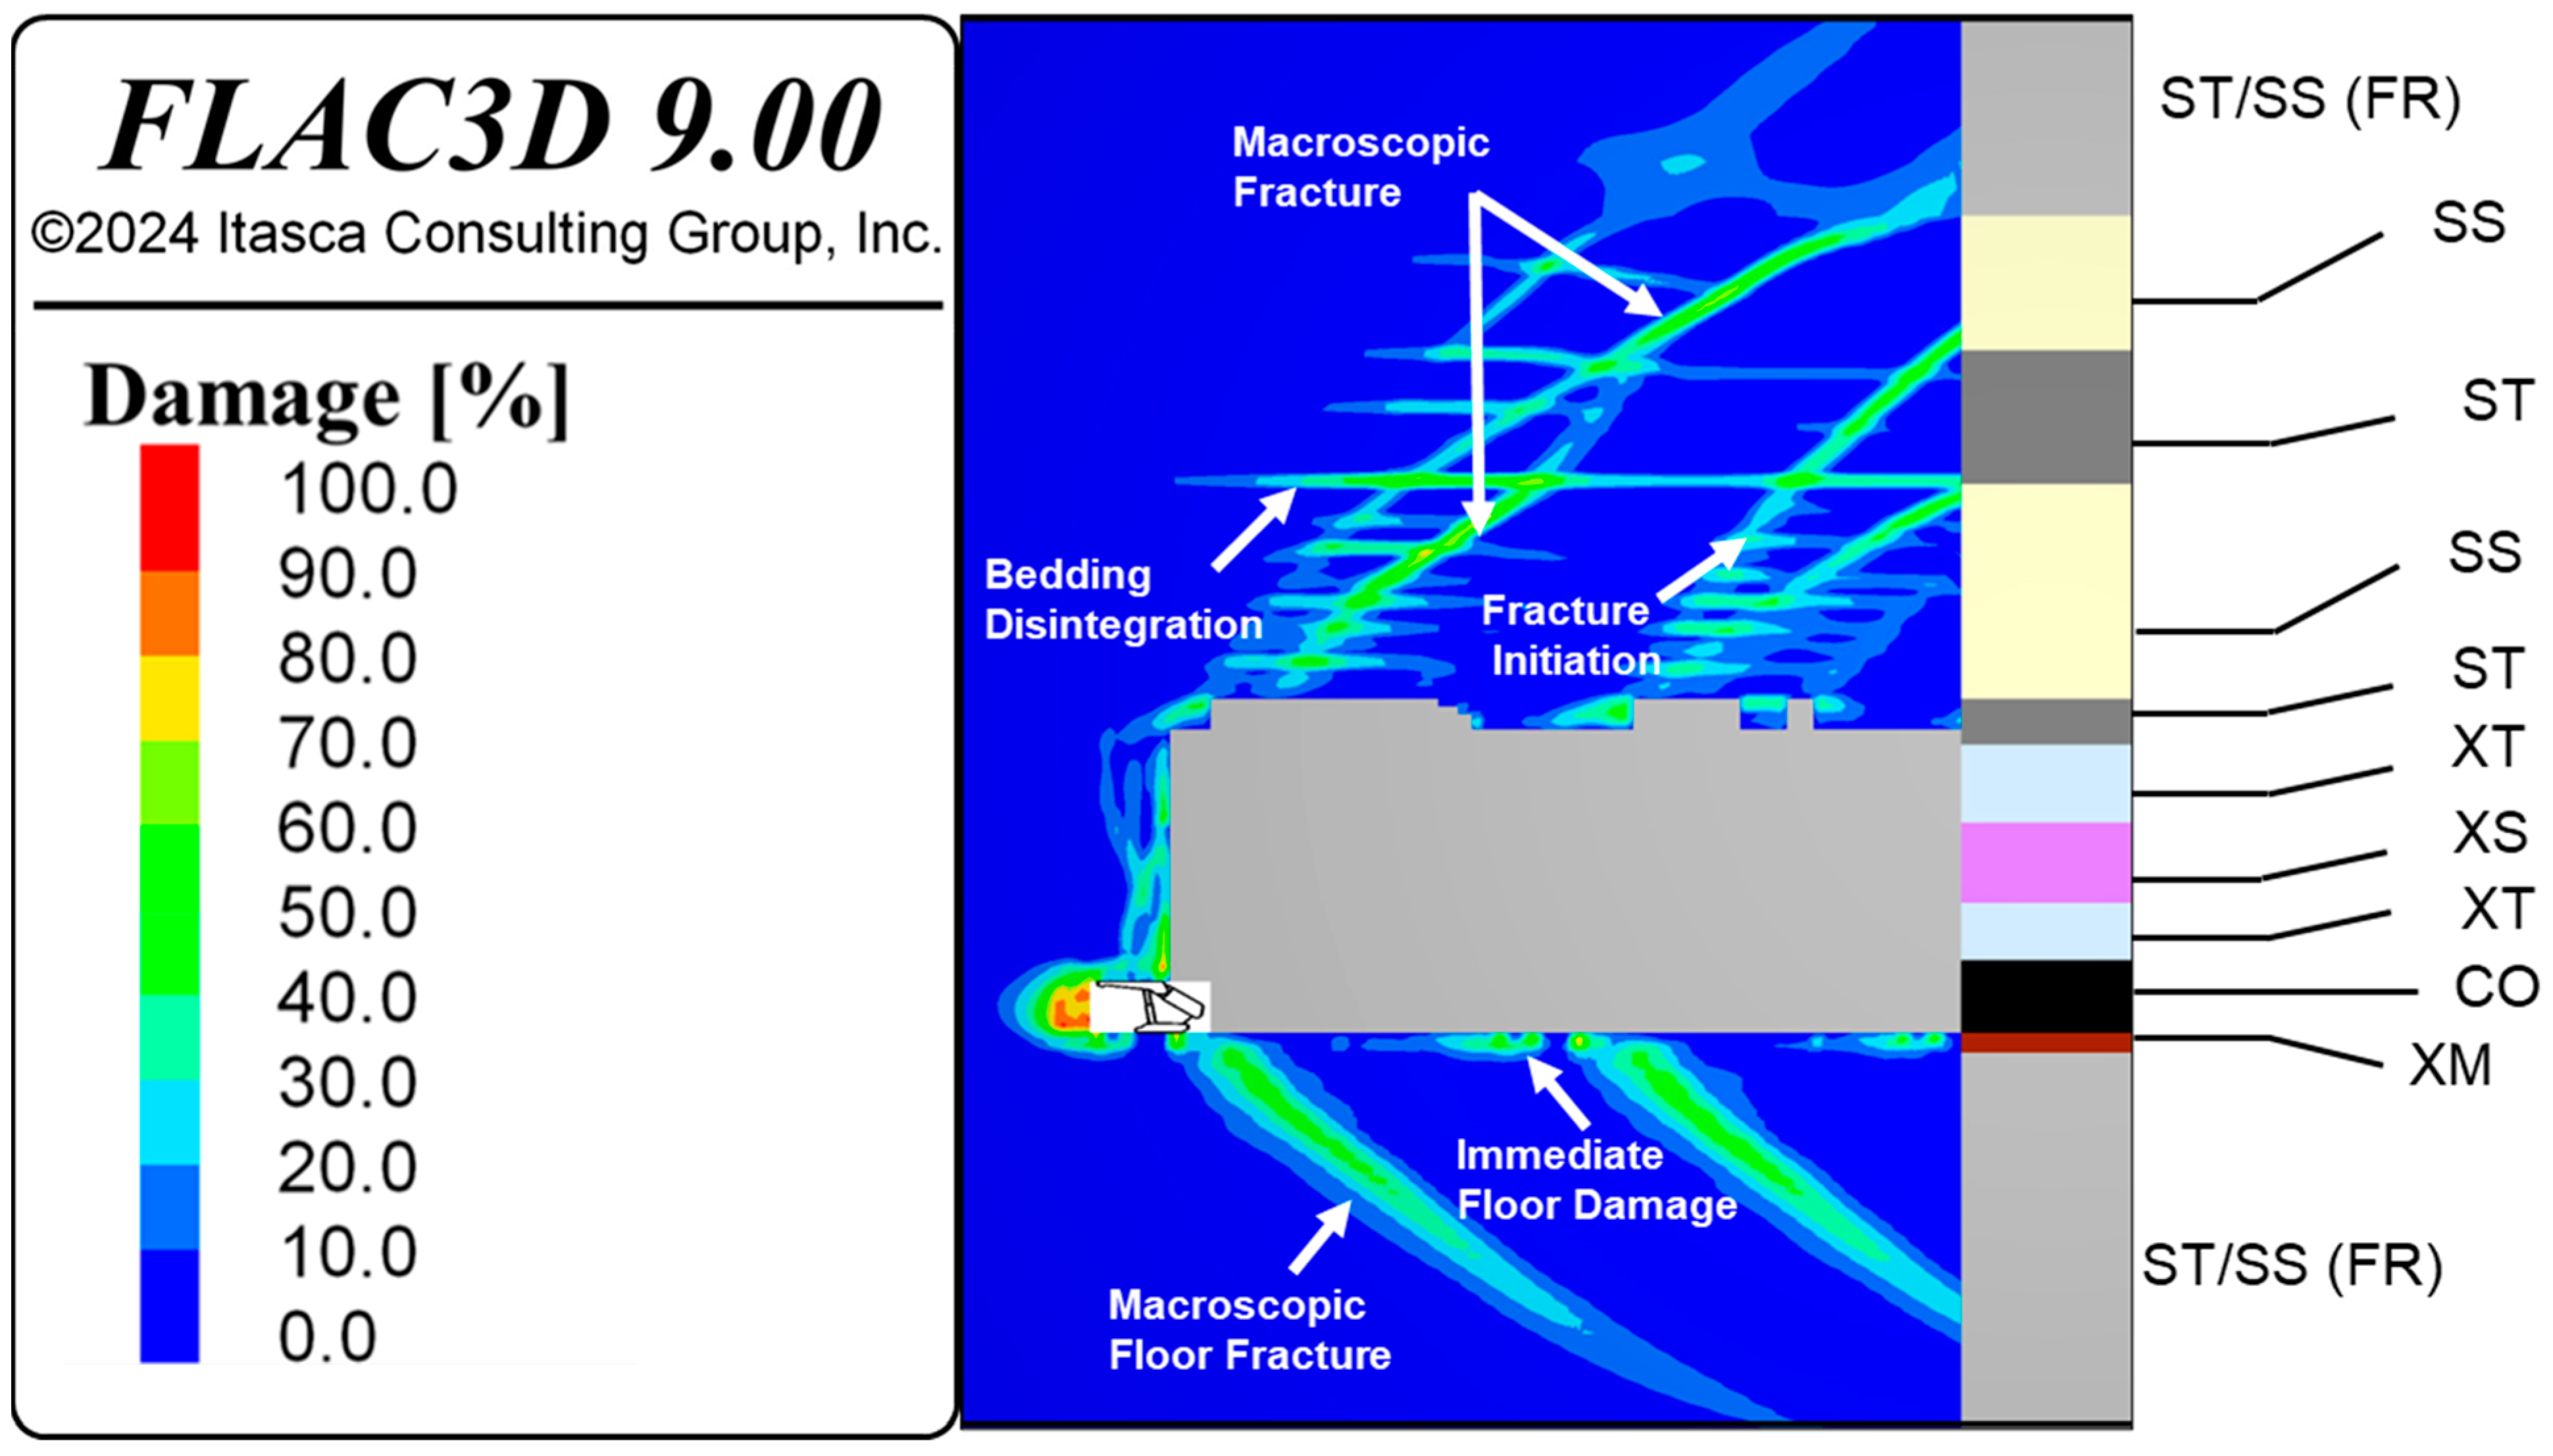
Figure 15 illustrates the damage distribution in the model with the corresponding lithological units. The goaf formation results from the fracturing and disintegration of rock block networks in XT, XS, and ST on the immediate roof. In the massive sandstone unit above the goaf, fracture initiation, primarily in the form of tensile failure, is observable. This phenomenon results from bedding plane failure and laminations within the sandstone. Additionally, macroscopic shear fractures, resulting from the downward movement of the massive sandstone unit, can be observed. These fractures have the potential to generate the caving line.
As shown in
Figure 15, bedding disintegration is formed because of the failure of the bedding plane between the massive sandstone and siltstone unit above. Immediate floor damage mainly occurs in the XM unit during both longwall production and goaf formation. Macroscopic floor fractures develop in the fresh Permian rock unit (ST/SS) behind the supported roof and within the goaf region.
4.6. Principal Stress Analysis
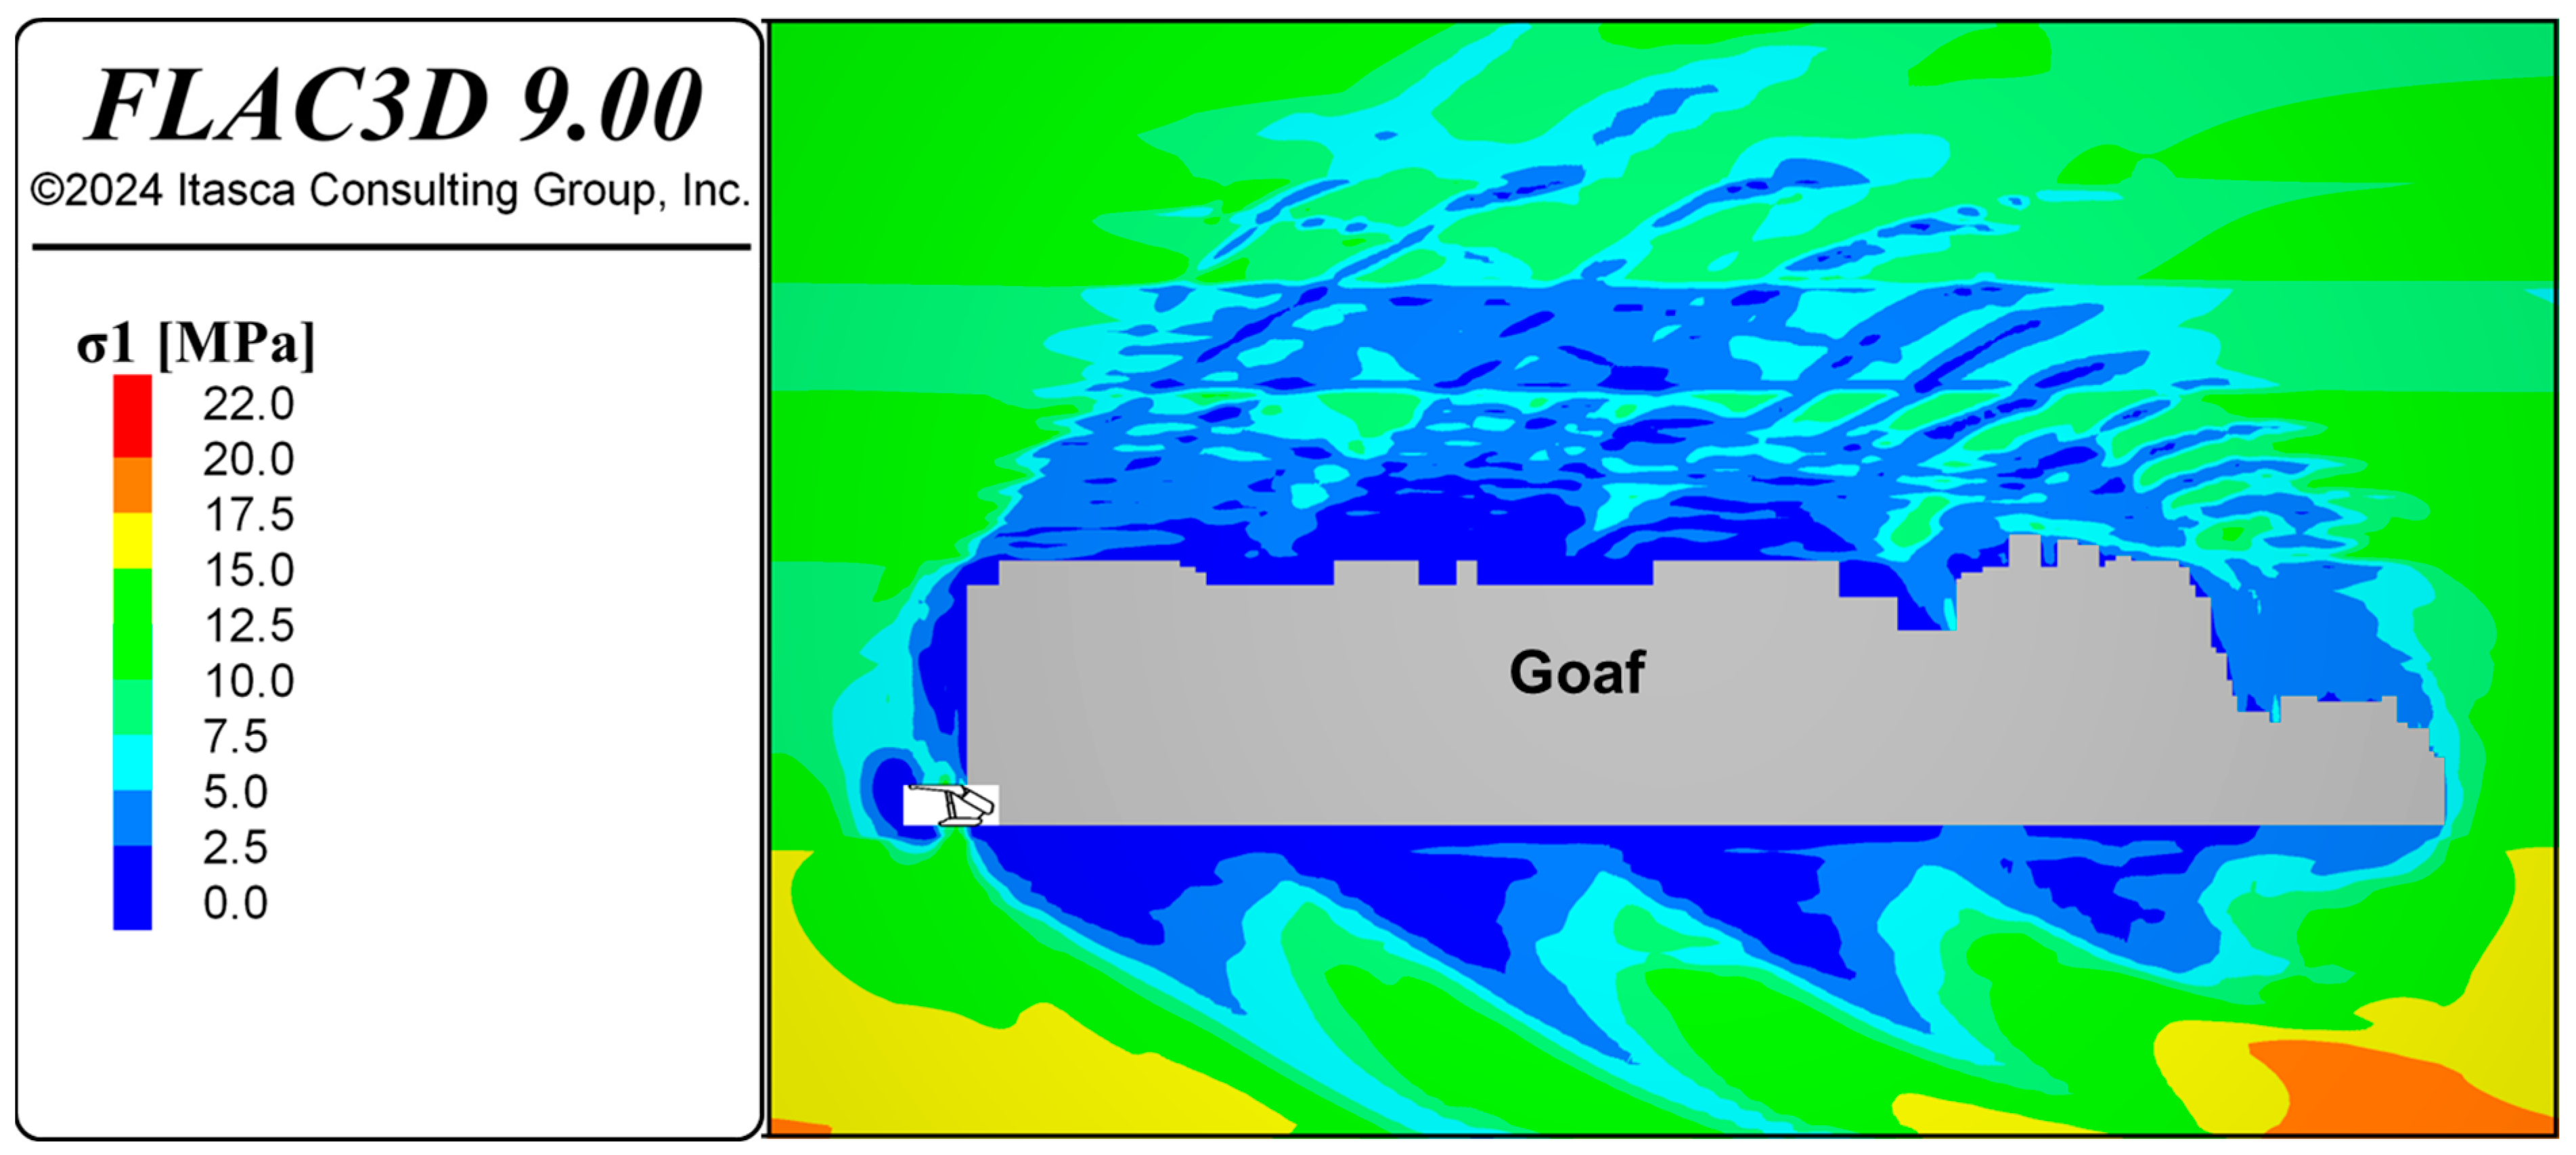
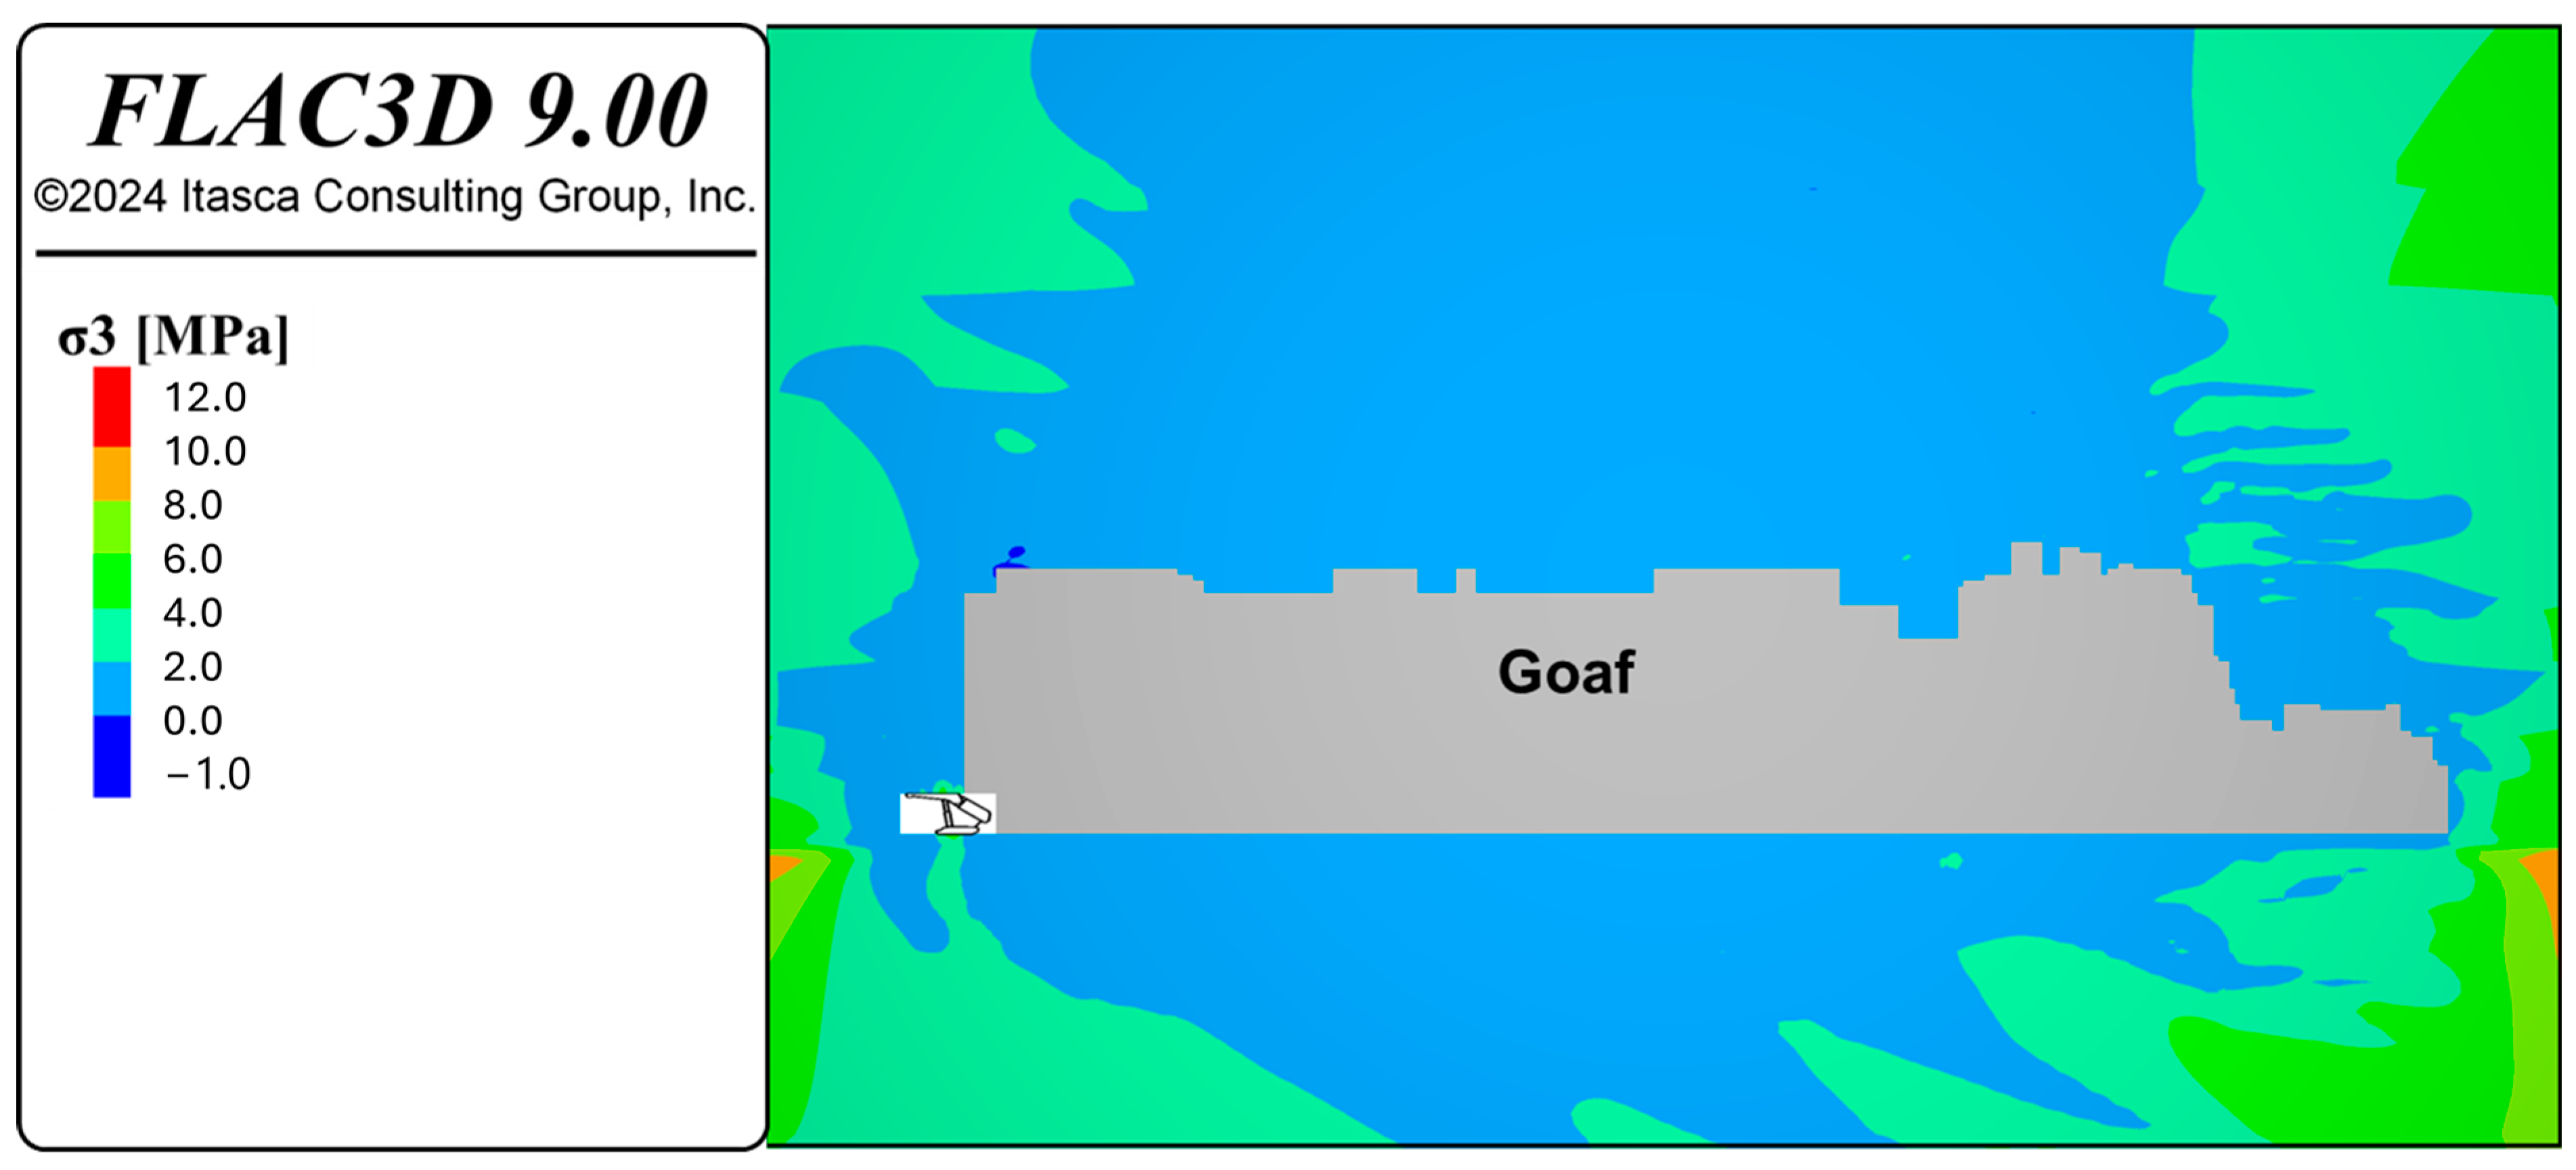
Figure 16 and
Figure 17 show the principal stress (σ1 and σ3) response of the model during caving simulation. A stress release zone is observed above the goaf, with σ1 magnitude ranging from 0 to 5.0 MPa and σ3 magnitude ranging from 0 to 2.0 MPa. Comparing the σ1 contours above the goaf with the damage response of the model shown in
Figure 11 and
Figure 12, it can be observed that fractures develop when destressing becomes predominant. This phenomenon results from strain-softening behavior incorporated into the IMASS constitutive model.
In the context of the caving mechanism, strain softening refers to a process wherein lithological units and bedding planes undergoing deformation progressively weaken, rendering them more susceptible to fracturing. As macroscopic fractures develop, they establish pathways for stress redistribution, leading to a decrease in stress within the surrounding caved zone. This stress reduction occurs because the load is transferred to the newly formed fractures, which can accommodate additional deformation with less resistance than intact rock.
Stress reduction is also observed in the longwall face, which is due to progressive wall spalling, as shown in
Figure 13 and
Figure 14. However, above the canopy on the roof, the stress reduction is less significant, ranging from 5.0 to 7.5 MPa, indicating effective roof support preventing noticeable fracture development and roof damage. The stress analysis indicates that the shield support is effectively distributing the load and maintaining the roof stability.
4.7. Periodic Weighting Event Potential
Periodic weighting events in longwall mining refer to the phenomenon where the lower stratum of the main roof periodically breaks, causing periodic high roof pressure at the face area [
5]. The breaking length or interval varies with the strength, thickness, and joint conditions of the strata, as well as the gap between the caved rock piles and the un-caved immediate or main roof.
The intensity of the periodic roof weighting depends on the breaking interval. Additionally, the upper stratum may also break periodically if there are sufficient gaps between broken and immediately overlying unbroken strata. Underground operational experience suggests that periodic weighting events become less intense or disappear as faces advance faster and shield capacity becomes larger in high-production faces.
The potential for periodic weighting events is calculated from the numerical model, as illustrated in
Figure 18, predicting an average value of 15 to 22 m between excavation–caving cycles 03 and 04. The numerical results indicate that the carbonaceous immediate roof has the potential to break and contribute to roof caving in each excavation–caving cycle repeated during the numerical simulation (
Figure 18). This suggests that the periodic weighting is influenced by the carbonaceous siltstone and carbonaceous sandstone units, which are characterized as moderate-strength rock masses.
The damage response of the model indicates that there is no sub-vertical break-line forming ahead of the longwall face, suggesting that the shield front is not under significant pressure from overburden. The longwall face experiences only coal spalling, as shown in
Figure 13 and
Figure 14. Therefore, according to this numerical analysis, there is no potential for abrupt roof collapse in the supported area.
The immediate fracture zone above the goaf is developed in a strong, 16 m thick sandstone unit, where horizontal and sub-vertical fractures are the dominant failure mechanism (
Figure 15). These findings suggest that periodic weighting during goaf formation is predominantly controlled by carbonaceous units. However, the 16 m thick sandstone unit above the goaf demonstrates the potential for self-support for a maximum of 30 m during an excavation–caving cycle.
5. Discussion and Result Analysis
The extraction of a longwall panel induces significant stress changes, resulting from the progressive initiation and extension of shear and tension fractures in the rock mass above the mined-out region. The proposed caving framework, utilizing the IMASS constitutive model, effectively reproduces this fracturing response, providing a robust tool for simulating the complex behavior of the rock mass caving during longwall mining operations.
5.1. Expected Caving Behavior and Managing Caving Risks
The primary objective of the caving assessment in the numerical model is to analyze the potential caving behavior by evaluating the fracture response in both the overburden and the front shield area. Additionally, it aims to determine the effectiveness of the proposed longwall scheme as a viable mining method for managing caving risks and mitigating potential collapse hazards. Based on the analysis of maximum principal strain, displacement, damage, and stress in the longwall caving model, the following key observations can be identified:
The numerical model shows that periodic weighting events in the area are influenced by carbonaceous siltstone and sandstone units in the immediate roof, which are moderate-strength rocks. These units can cause roof caving during each excavation–caving cycle, with an average periodic weighting of 15 to 22 m.
The numerical modeling predicted that the goaf is formed in the carbonaceous medium while the fracture zone is developed in the strong sandstone unit.
The 16 m thick sandstone unit above the goaf can self-support for up to 30 m of the excavation–caving cycle, emphasizing the need for stability monitoring during mining.
The model suggests that the current longwall design is effective in managing caving risks, as indicated by the limited displacement observed in the supported areas of the longwall face.
The numerical results suggest that caving initiates when a critical excavation distance of 30 m is achieved. It is important to implement effective seismic monitoring to track the caving progress and mitigate the risk of rockburst/coalburst. This allows adjusting the mining rate to manage and facilitate progressive caving and prevent potential rockburst.
Floor heave in the supported area was estimated to be approximately 120 mm. While this floor heave does not exceed critical values, implementing efficient remediation measures and conducting progressive floor monitoring is recommended.
The FLAC3D 9.0 model provides valuable insights into the behavior of rock strata and support systems during longwall mining. By simulating excavation and caving processes under realistic conditions, the model allows operators to predict critical zones of strain and displacement, enabling proactive measures. In practical terms, this modeling can be integrated with field monitoring systems to validate predictions and optimize support strategies, ensuring the effective management of caving and minimizing risks such as rockburst and floor heave.
5.2. Overburden and Floor Fracturing Behavior
The numerical caving framework, augmented with the IMASS constitutive model and an advanced caving algorithm, is capable of accurately reproducing the fracture response of both the overburden and the floor. This enhanced framework provides a detailed simulation of the progressive failure mechanisms, allowing for a comprehensive analysis of stress distribution, fracture propagation, and overall structural integrity during the longwall mining process. The following outcomes were achieved from the numerical simulation regarding the fracturing performance of the overburden and floor:
The model shows significant fracturing in the overburden above the caved zone, with fractures ranging from a few centimeters to nearly 90 m. The numerical model predicted that fracture initiation is the result of progressive bedding and lamination failure within the rock mass. The downward movement of fragmented blocks initiates large macroscopic fractures (i.e., shear fracturing) that determine the caving line.
Localized floor fracturing is mainly observed in the XM unit, indicating potential challenges in maintaining floor heave during longwall production.
The numerical simulation predicted the development of macroscopic fractures within the fresh Permian rock ST/SS unit. Numerical observation revealed that these fractures primarily formed well behind the supported area, suggesting an insignificant concern regarding floor fracturing.
Overall, the model suggests that the current longwall design is effective in managing caving risks, but ongoing monitoring and adaptation of support measures is required to ensure the stability of the longwall face and surrounding areas. Additional support measures may be required to manage floor heave and high strain zones effectively.
5.3. Limitations and Future Work
While the current modeling approach using a modified caving algorithm in FLAC has provided significant insights into the caving mechanism and strata fracture response in longwall mining, several limitations should be acknowledged:
Simplification of geological conditions: The model assumes homogeneity within each lithological unit, which may not fully capture the variability and complexity of natural rock formations. Future work could incorporate more detailed geological heterogeneity, including variations in rock properties and the presence of faults or joints.
3D scale effects: The model primarily operates in a 2D plane strain context, which may not fully represent the three-dimensional behavior of caving and strata response. Future simulations could explore 3D modeling approaches to better understand the scale effects and interactions in a more realistic setting.
Time-dependent behavior: While the model includes certain time-dependent aspects of rock behavior, such as creep, it does not fully capture all time-dependent processes that could affect the caving mechanism, such as the long-term relaxation or aging of materials. Incorporating more advanced time-dependent models would be a valuable area for future research.
Multi-seam longwall mining: The applicability of the proposed caving algorithm for simulating the performance of multi-seam longwall extraction can be assessed.
Real-time monitoring and model refinement: The project presented in this work is under geotechnical assessment and caving behavior observations. With the start of mining operations, real-time monitoring of the caving process and strata displacement can be implemented, allowing for the refinement of the numerical model and enhancing its application for caving modeling.
Developing models that account for geological heterogeneity and the presence of faults or joints and complex geological structures;
Implementing 3D modeling approaches to better capture scale effects and interactions in longwall mining;
Enhancing time-dependent models to include long-term relaxation and aging processes;
Investigating how the proposed algorithm performs under more complex multi-seam scenarios and whether adjustments are needed to accommodate the additional complexity;
Integrating the real-time monitoring of caving behavior and strata displacement into the model to refine its predictions during actual mining operations. This approach would enhance the accuracy of the model and its application for caving simulations by continuously updating it with field data.
6. Conclusions
Based on the results of FLAC3D 9.0 modeling of longwall mining augmented with a novel caving algorithm, the following conclusions can be drawn.
The numerical assessment successfully identified the shape and thickness of the caved zone. The predicted thickness of the caved zone was approximately 20–22 m, representing the immediate coal roof before caving occurred. The critical excavation distance was estimated to be 30 m, after which caving initiates with periodic weighting of approximately 15 to 22 m. The development of goaf is caused by the fracturing and breakdown of rock block networks in XT, XS, and ST located in the immediate roof. Within the thick sandstone layer above the goaf, tensile fractures, driven by bedding plane failure and laminations within the rock, become evident. Alongside these tensile failures, larger shear fractures form as the sandstone unit shifts downward. These shear fractures can significantly influence the formation of the caving line.
The modeling showed floor deformation primarily in the form of floor heave, with a depth of approximately 1.5 m and displacement of 120 mm. The shield support effectively controlled the immediate roof and floor displacements, with the highest displacement observed in front of the shield face, reaching a maximum of 700 mm. This observation indicates a potential of minor floor heave and progressive longwall face deformation.
The numerical model predicted horizontal and sub-vertical fractures above the caved region. Both tensile and shear fractures were also observed on the floor during progressive excavation–caving cycles behind the supported region. A critical damage zone, with a depth of approximately 2.5 m, is observed in the longwall face, indicating a high potential for face spalling. Minor damage behavior is observed in both the roof and floor, indicating the effectiveness of the shield support system. A key observation is that the damage zone and fracturing within the shielded area are not directly linked to the caving process occurring behind the support. In front of the longwall face, a fracturing zone with a depth of 7 m develops, showing an average damage level of 30% to 40%, primarily driven by shear mechanisms.
Bedding plane disintegration arises from the failure between the massive sandstone and siltstone units above. Immediate floor damage is concentrated in the XM unit during both longwall mining operations and goaf formation. Large-scale fractures also appear in the fresh Permian rock units (ST/SS) behind the supported roof and within the goaf area.
Stress analysis showed a stress reduction in the caved zone and the longwall face due to progressive wall spalling and fracture development. However, above the canopy on the roof, the stress reduction was less significant, indicating a minor damage and fracturing process due to the effective support provided by the shield.
FLAC3D 9.0 modeling, augmented with an IMASS constitutive model and an advanced caving algorithm, provided insights into the caving behavior and fracturing response of the rock mass, as well as the performance of the shield support throughout longwall production. The numerical modeling results suggest that the shield support efficiently confines and controls the immediate roof and floor, mitigating the extent of damage typically associated with longwall mining operations. These findings can be used to optimize longwall mining operations and improve safety and efficiency. Further research should focus on refining the numerical models, incorporating more complex material properties, and exploring the effects of varying geological conditions. Integrating the model with field monitoring will validate predictions, optimizing support and reducing risks like rockburst and floor heave. Additionally, future studies could investigate potential improvements in shield support design to enhance longwall mining safety and operational efficiency.


