1. Introduction
Loading and hauling materials, typically referred to as a haulage system, are critical in any mining activity. In a surface mining operation, one of the prominent types of such systems consists of shovels and trucks as loading and hauling equipment. Material movement accounts for 35% to 60% of operation cost in surface mining [
1,
2]. Therefore, minor improvements in this system could create significant savings in operational costs and increase the production of the mine.
Shovels, as reliable and long-lasting loading units, play a crucial role in the haulage system [
3], and it is expected that minor variations in their operation would have a significant influence on the system outcome.
Previous research shows that the performance of an electrical rope shovel is influenced to a great extent by machine condition, operators practices and the muck-pile characteristics [
4,
5,
6]. Automation offers the potential to eliminate human errors and variability caused by human factors and provide consistent performance and optimized output. Automation of loading units has been an active area of research, mainly focused on excavators and wheel loaders [
7].
Mines use a fleet management system to optimize their hauling system and maximize their production while feeding the processing plant with the targeted rate and predefined grade blending constraints [
8,
9]. Although even the most sophisticated fleet management algorithms are trying to reach their goal by finding the best routes and optimizing trucks and shovels assignment, it is proved that in practice, the actual results deviate from the predicted ones [
10].
Deficiencies, particularly variations in the hauling system operation, can be seen as a significant reason for this deviation in which the human factor plays an important role [
11,
12]. Different levels of automation ranging from tele-remote, operator-assisted, and driver-less equipment have been deployed to reduce operator errors, remove issues related to human behaviour such as variability as well as increase equipment utilization [
13,
14,
15,
16,
17].
Although the complex nature of mining activities and uncertainties associated with them is difficult to capture using traditional analysis methods [
18], discrete event simulation (DES) has been proven as a tool to model, assess, and investigate operational scenarios in the mining industry [
19,
20].
This paper investigates how different levels of automation of loading units could improve both shovel and mine production and how other mining activities are influenced by it. This paper also describes how a detailed simulation model can be developed to capture the loading operational uncertainties. This model uses the key performance activities of shovel operators as an input to demonstrate their influences on other activities in a mine and, more importantly, mine productivity.
2. Background
2.1. Automation in Mining
Automation is generally defined as the intelligent operation of equipment using technology without direct human contribution [
21]. The mining industry has been considered a slow industry in adopting and implementing new technologies [
22]. The combination of a long time for new technology development -between seven to ten years-, the often short-term financial focus, and the risk of failed technology are contributors to the mining industry’s slow adoption of technology [
23].
The initial purpose of automation in the mining industry was to protect the health and safety of mineworkers, but it was also considered for improvement in productivity by minimizing human error and eliminating poor driving behaviours of tired and distracted workers [
24,
25]. In addition, the reduction in lost time due to shift change, breaks, etc., was viewed as how automation could improve productivity.
Complexities related to the automation of loading units have encouraged researchers to aim for different levels of automation. Roberts, Duff and Corke [
26] suggested the following steps toward automation:
- (1)
Manual operation: The operator physically presents in the operator’s cab and performs the operation.
- (2)
In-sight teleoperation: The operator is located in the machine’s vicinity and performs all tasks using a remote control.
- (3)
Tele-remote operation: The operator controls the machine from a remote location using a remote control and video and audio feedback.
- (4)
Assisted tele-remote operation: the machine control system performs many tasks, and the operator intervenes via tele-remote control needed.
- (5)
Fully autonomous: The machine operators autonomous.
Operator assistance technologies such as path planning and navigation [
27,
28] and collision detection and avoidance [
29] have been developed mainly for Load-Haul-Dump (LHD) units by researchers. Dunbabin and Corke [
30] automate the digging cycle of an electric rope shovel, proposed techniques to detect and avert dipper stall, and the on-line estimation of the dipper fill factor. At the time of writing this paper, there are several operator assistance systems offered by electric rope shovel manufactures that mainly prevent inadvertent mishandling of the machine.
Automation in mining has had many implications ranging from an automated valve to a whole fleet of autonomous haulage trucks. Increased production hours and lower employee and associated costs are among the main benefits reported by researchers [
22]. The higher productivity and reduced costs might make some previously uneconomical mines profitable.
2.2. Simulation
Simulation has been deployed to understand and mimic real-world systems and assess different scenarios. Early attempts to use simulation in mining date back to 1950 [
31]. Since then, simulation has been used by researchers and professionals to address problems such as truck fleet sizing, dispatch, and allocation, short-, medium-, and long-term mine planning and efficiency improvement. [
32,
33,
34]
DES in particular has been used by researchers to model different aspects of mine operations. DES decomposes a system into a set of logically separate but sequential processes and events. Each event occurs at a specific instant in time and changes the state of the system. The conventional approach to model shovels in DES, in the absence of details on specific activities, i.e., each pass payload, dig, swing and return times, is to obtain truckload information from truck onboard monitoring systems and use shovel bucket capacity to estimate the number of passes it took to load the truck. Then, the average loading cycle time could be calculated by dividing the total loading time from a dispatch software and the estimated number of passes. It can be argued that this approach relies on data from sources other than the shovel itself. It is believed that this leads to a wide range of estimations and assumptions made throughout the calculations that reduce the value of the results. Additionally, by obtaining loading time from dispatch software, this approach ignores shovels’ other activities such as propel and walk that could lead to an oversimplified model.
Data from a shovel onboard monitoring system provides details such as digging, swinging and returning times, each individual pass and total truckload and many other KPIs gathered directly from shovel operation. These details could be used to model shovels more precisely and create an understanding of where improvements can be attained.
3. Approach
3.1. Discrete Event Simulation Model
A DES model was developed to assess the influence of different levels of automation on shovel, truck, and mine production and performance [
33]. The developed DES model evaluates the truck haulage system and shovel loading units and ignores the processing plant. It is assumed that the quality and density of materials throughout the simulation are consistent. The equipment mean time between failure and time to repair are used to model equipment failures. The impact of truck driver practices and weather changes is ignored in this model.
The DES model is developed based on historical data from a currently active surface mine. The operation name cannot be revealed due to confidentiality considerations. The mine employs five shovels, three waste and two ore. The shovel monitoring database contains records for a fleet of P&H4100 shovels. A fleet of Cat 793C trucks haul materials to two crushers and a waste dump based on a prescheduled plan.
Truck fleet size and their availability strongly influence shovel production and utilization. As the main focus of this study is on the loading aspect of the operation, a fleet of 60 trucks is considered for this operation to meet the required production in the base model.
The DES model is developed in Rockwell ARENA software (Rockwell Automation, Milwaukee, WI, USA). ARENA has been successfully used by researchers in mining, operation research and other industries for the purpose of studying the behavior of complex systems. The software uses SIMAN [
35] processor and simulation language. The following five steps are carried out to develop the model:
- (1)
ARENA Input Analyzer software is used for all input parameters to calculate and draw their histogram. Then, best-fitted distributions are selected based on the sum of square error criteria calculated by the software (
Appendix A).
- (2)
A mine road network needs to be developed. A VBA macro is used to build the network in ARENA.
- (3)
The fitted distributions and production schedule are stored in an MS Excel file. Before each run and in the check state, ARENA reads all those parameters and uses them to run the model.
- (4)
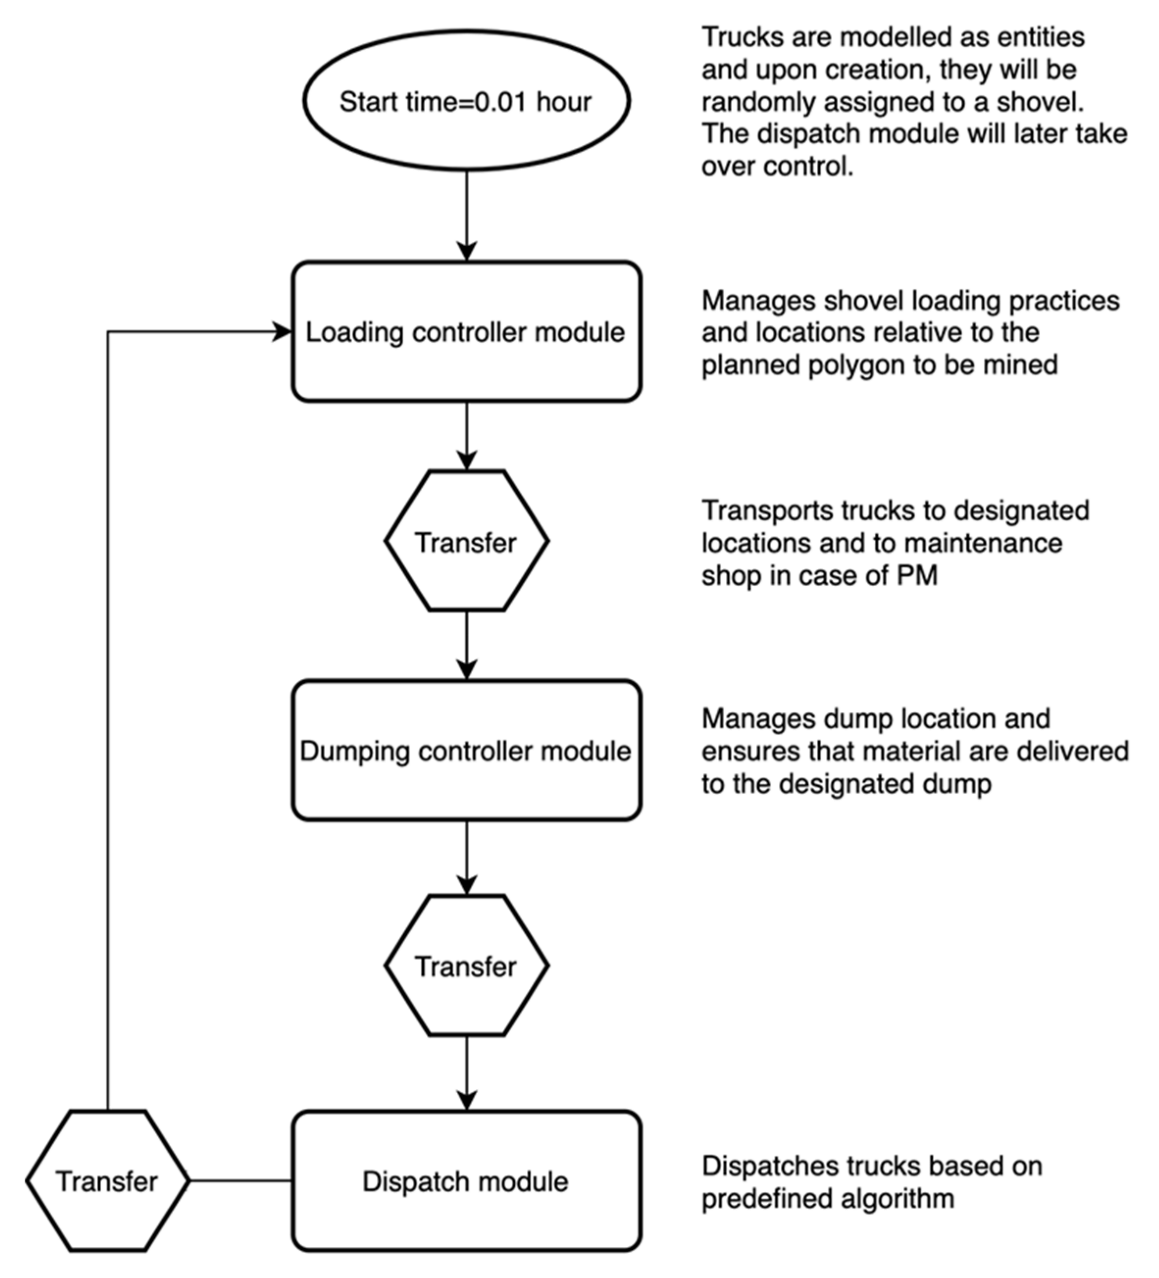
The mine DES model is build using ARENA modules (
Figure 1). Trucks and shovels are modelled as entities and resources, respectively. ARENA transporter is used to model truck interactions. Record and write modules are used to save KPIs.
- (5)
Total production, utilization of the equipment, queue length, and time at shovels are used as KPIs to evaluate and compare different operational scenarios. As a convention, the DES model is set up to run for 30 shifts of 24-h. It is also set up for 25 replications to reach the required half-width for the production within a 95% confidence interval of 20,000 tons.
- (6)
Results are written in an MS Excel file for the data analysis steps.
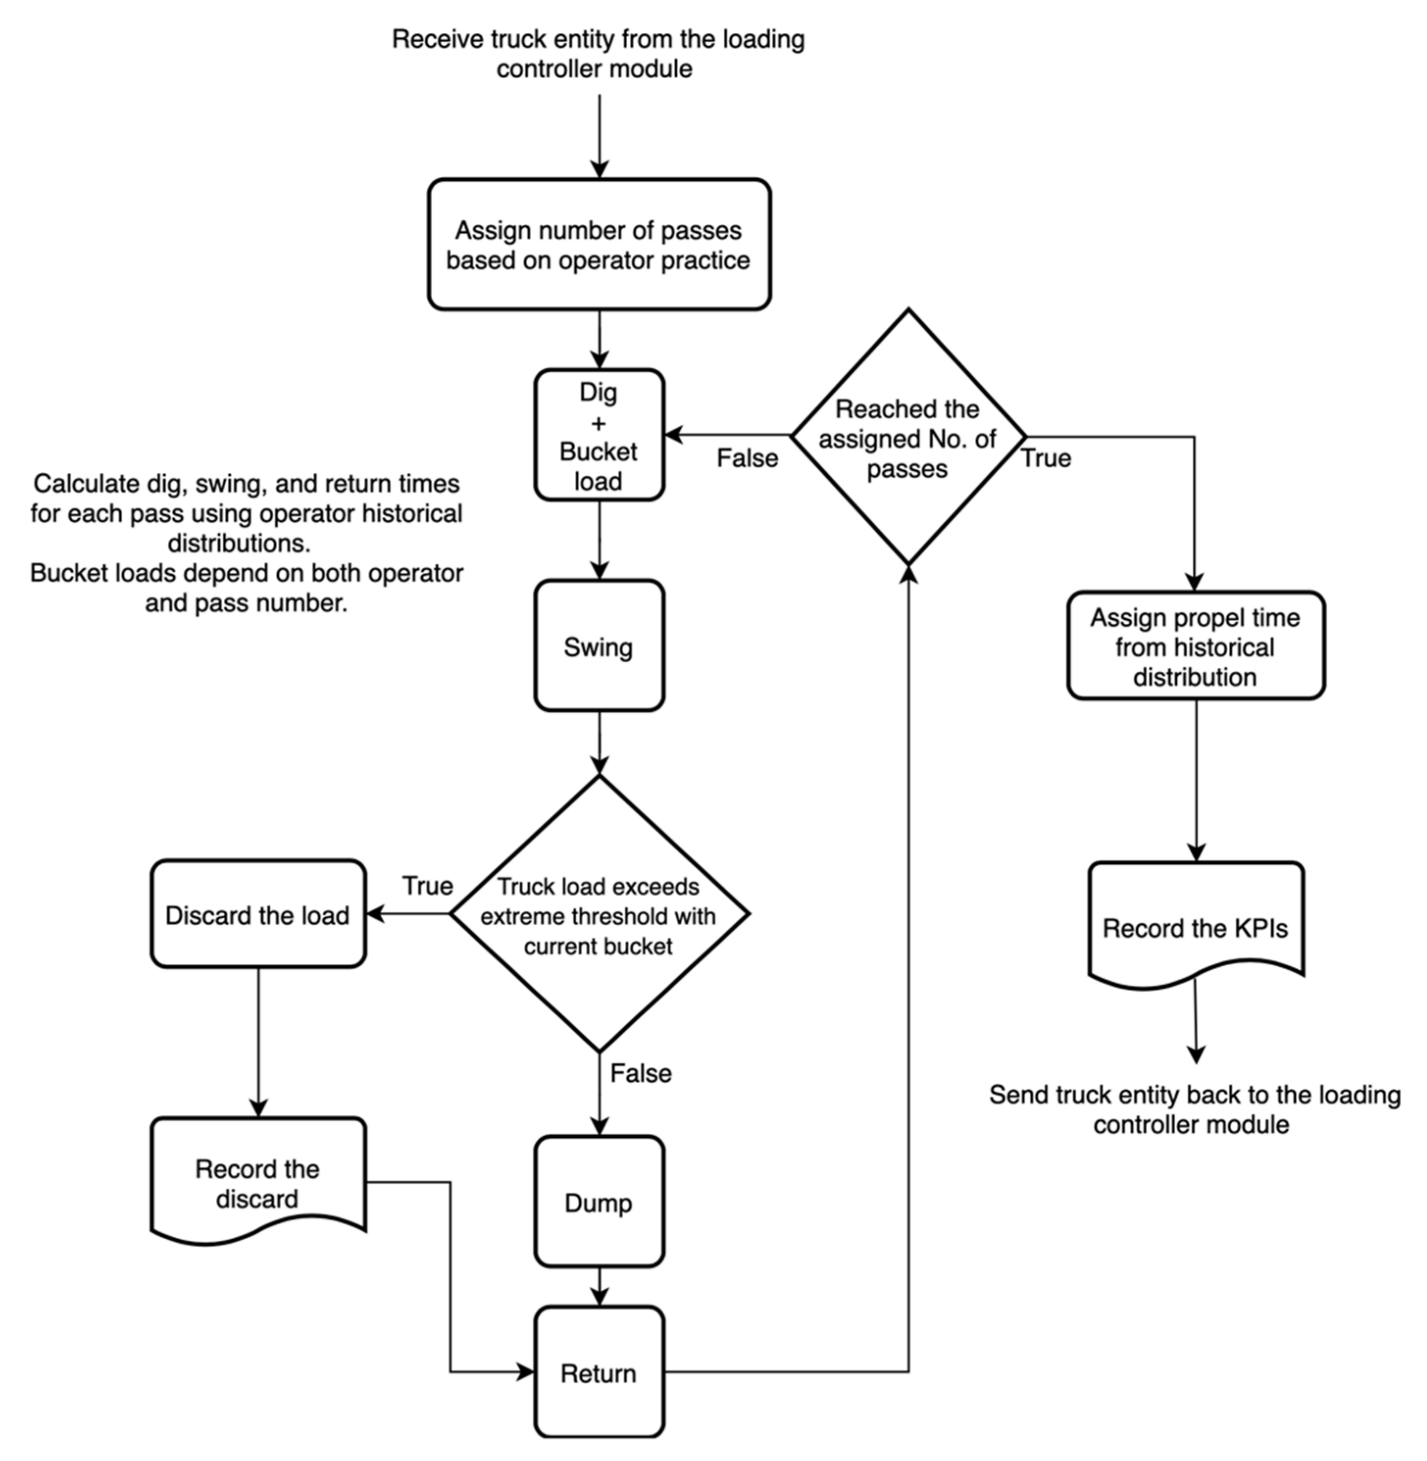
Additionally, to model loading activities, a shovel submodule is developed.
Figure 2 presents the sub-module flow chart. The sub-module uses the number-of-passes-to-load distribution to assign the number of buckets to each truck. Then, for each pass cycle, its specific distribution is used to calculate the bucket load and dig, swing and return times. This will repeat for the assigned number of buckets to the truck.
If the addition of the bucket load to the truckload will cause it to exceed the maximum allowed capacity, that pass load will be discarded. The shovel will be tasked to take an extra pass to reach the minimum allowable load for the truck to be dispatched if it has not yet. This procedure complies with the author’s field observation that operators dump their bucket load as soon as the system notifies them about the excessive truck final load considering their current bucket load is added. In this situation, it is common for the operator to dig another bucket load with less material. After the loading process is completed, a propel time will be calculated from its distribution and added to the total cycle time.
3.2. Operational Scenarios
In order to study the extent to which autonomous and operator-assisted loading units could improve different aspects of a mining operation. Four different levels of automation, ranging from operator-assisted swing and return to fully autonomous for a shovel, are considered and compared against a manual fleet as the benchmark.
Automating the dig, swing, and return part of a loading activity can be seen as the initial steps toward automating electric rope shovels. Complexities in the dig section of a loading activity suggest that their automation could occur separately from swing and return. Thus, here in the first autonomous scenario, a swing and return system is studied. The second scenario evaluates adding the dig-assisted function to the system.
The third scenario investigates how a fully autonomous shovel can improve the shovel and mine production and performance. Furthermore, as previously noted in an autonomous LHD study [
29], the most significant advantage of automation could be seen in fewer errors and higher consistency. Hence, the fourth scenario explores what benefits could be gain by a hypothetical, optimal autonomous electric rope shovel.
Table 1 summarizes automation scenarios.
3.2.1. Manual
The base scenario represents a manually operated fleet of shovels. Operating data from a shovel monitoring system is used to calculate and fit distributions to critical indicators of operator performance (i.e., dig, swing, and return times, number of buckets to load a truck, each pass load, and propel time). The shovel monitoring system database includes 364,655 truck loading cycle records. For each loaded truck, in addition to the truck capacity and final load, other KPIs, including digging, swinging and returning times and type of material, are recorded.
Table 2 and
Table 3 present average and standard deviation of main KPIs for the fleet of shovels. It should be noted that regular breaks and shift change downtimes are included in the DES to capture lost production hours due to those events (
Appendix A).
3.2.2. Automation Level 1 and 2. Swing-, Return- and Dig-Assisted System
A swing and return assisted system is studied in the first automation scenario. The second scenario evaluates adding the dig-assisted function to the system.
To capture the extent to which the proposed automation influences mine productivity and operational KPIs, statistics for the fleet average in the manual DES model are replaced with the best practices among operators [The best operator is selected using the ORS index suggested by authors (for more information, please refer to Modeling the influence of electric shovel operator performance on mine productivity, Yaghini, A., Hall, R)]. This is a reasonable assumption as any proposed ideal automation technology needs to outperform its human counterpart.
Table 4 and
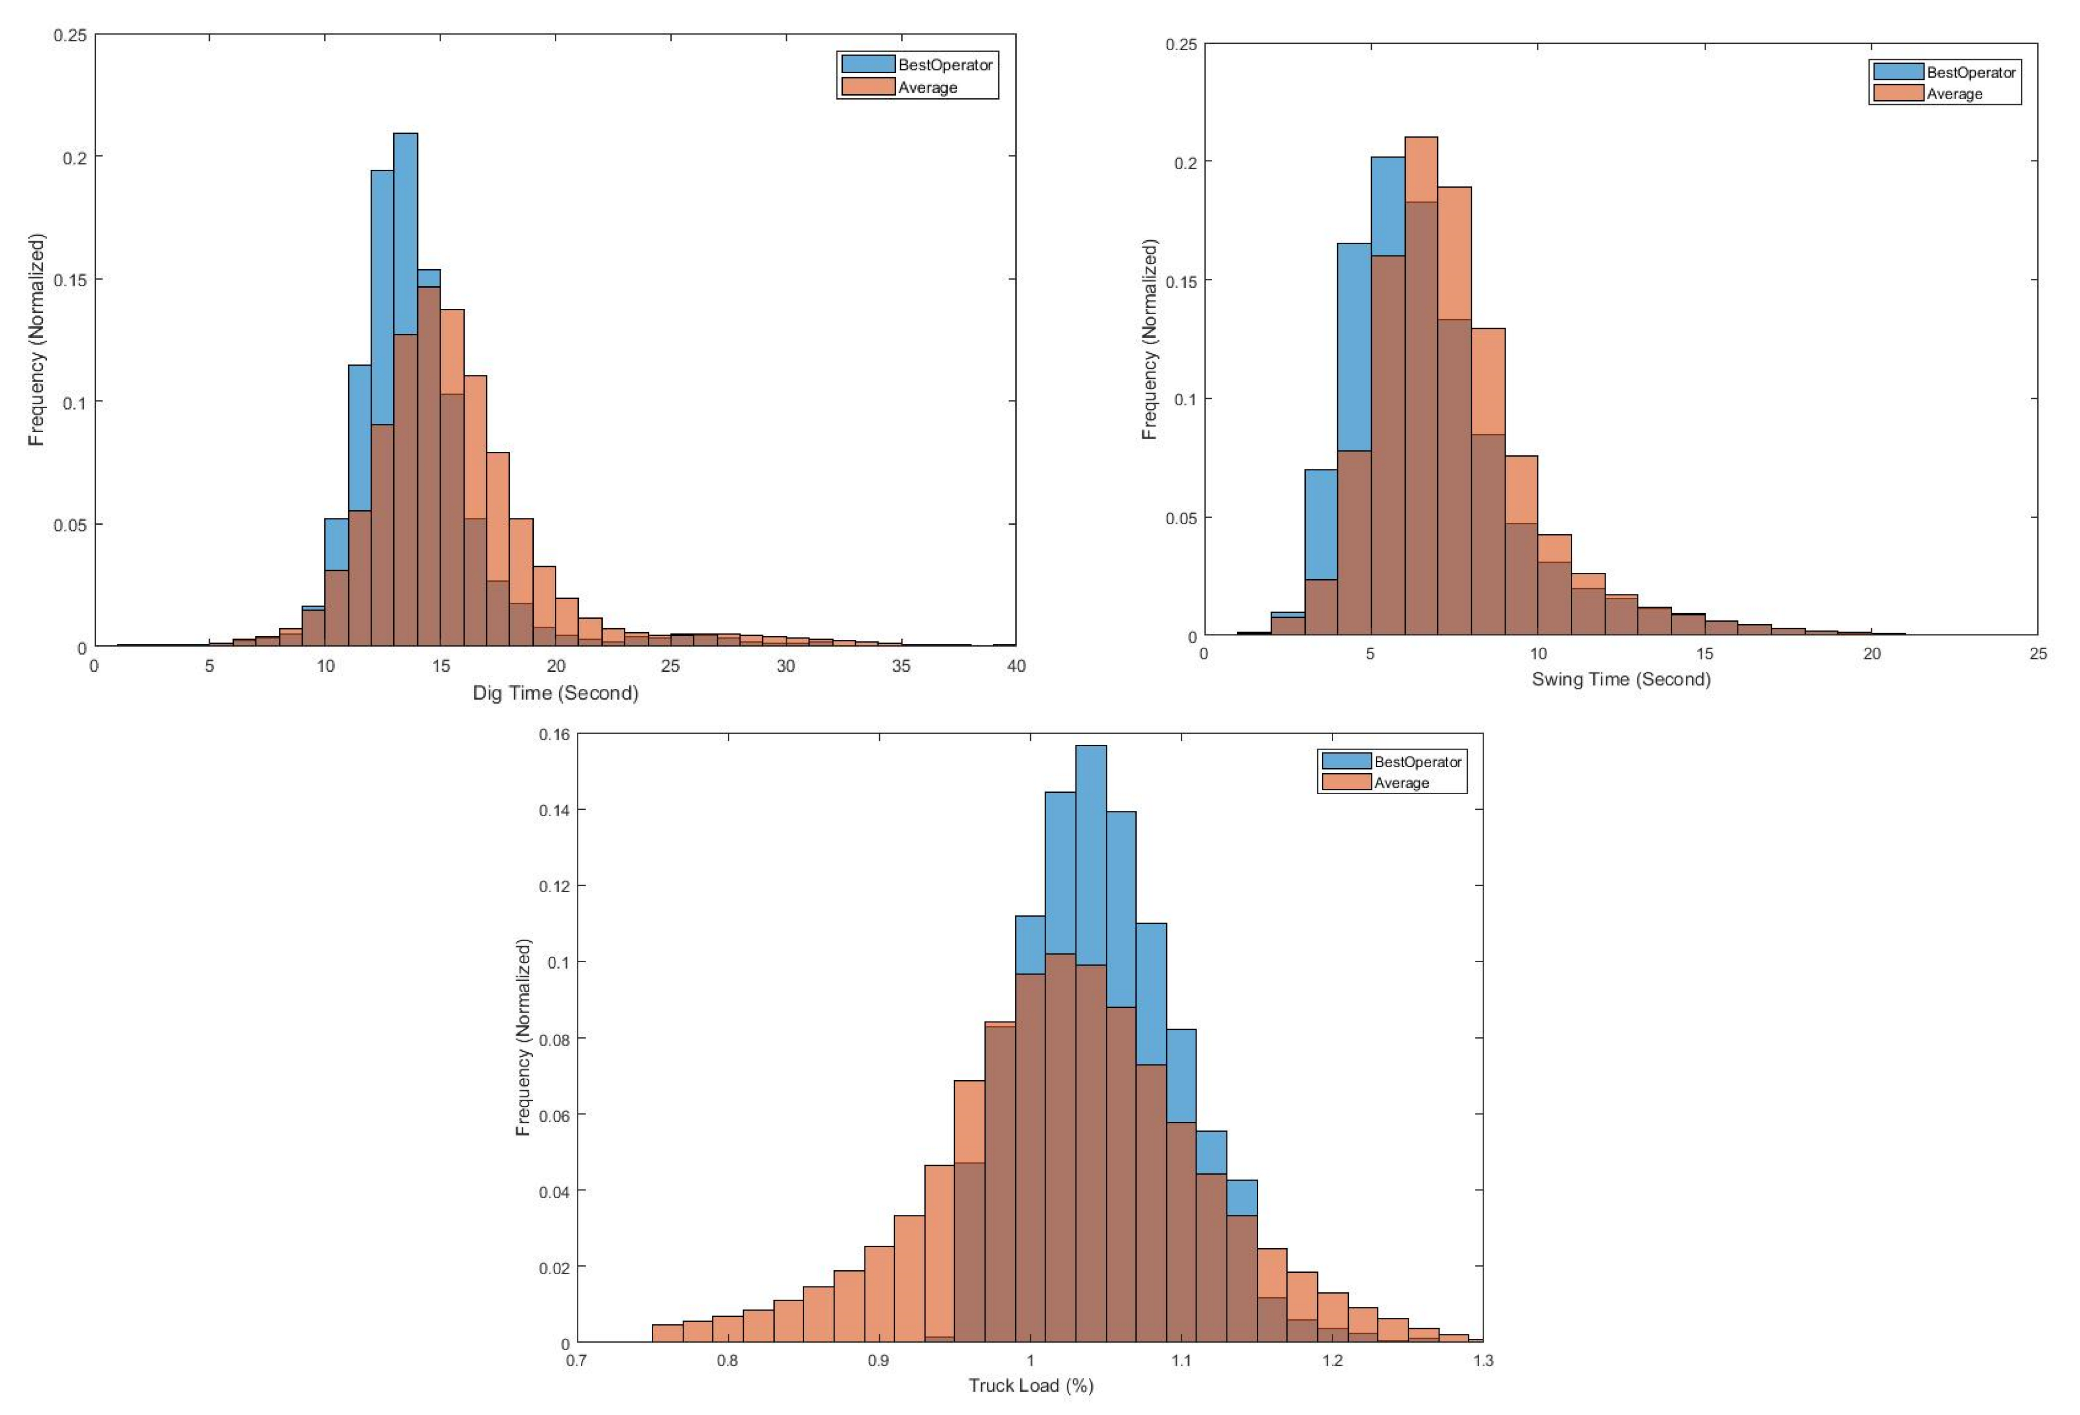
Table 5 presents the best operator KPIs.
Figure 3 shows how the best operators’ truckload ratio and dig and swing times compare with the fleet values. It can be seen that the best operator not only spends less time performing the activities but are also more consistent. Additionally, the best operator tends to load trucks slightly higher than 100% with noticeably better consistency (5% standard deviation compared to the fleet average 9%).
3.2.3. Automation Level 3 and 4. Full and Improved Autonomous Shovel
It is expected that a full autonomous shovel could load a truck without the need for human intervention. Hence, as argued for the automation level 1 and 2, statistics from loading activities best practices are used to model an autonomous shovel performance in the DES model. In addition to digging, swing, and return times presented in
Table 3, it is assumed that shovels load trucks consistently with three buckets. Each load estimated from the distribution belongs to the first pass in
Table 5.
Furthermore, as previously noted in an autonomous LHD study [
29], the most significant advantage of automation could be seen in fewer errors and higher consistency. A scenario with 10% and 50% hypothetical improvements in the average and standard deviation of loading activities is examined (except for the shovel bucket load as the 10% increase would cause it to exceed its maximum capacity). This scenario could be interpreted as an ideal automation implementation.
Table 6 presents the main statistics used for the proposed system.
4. Results and Discussion
4.1. DES Model
4.1.1. Verification of the Simulation Model
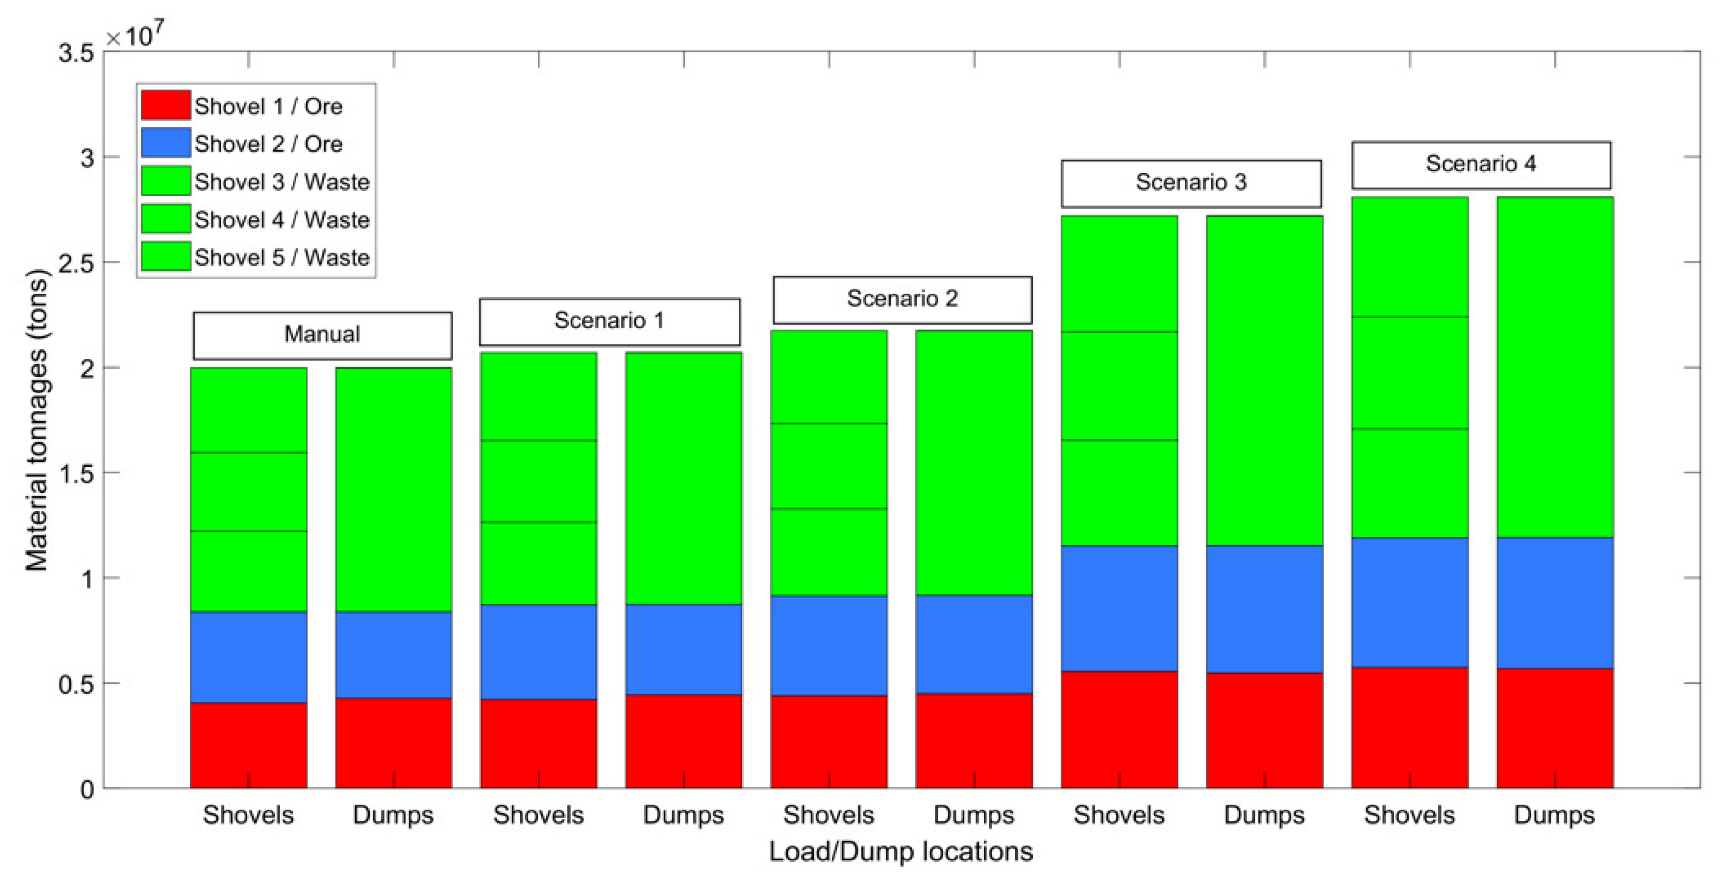
Before the developed simulation model results can be used and interpreted, the model needs to be verified. The first step is to monitor the model and reflect the mine operation visually. Afterward, shovel-loaded tonnages and delivered materials to the dump locations are used to verify the model.
Figure 4 shows a summary of material moved during the run time for all DES models. It can be seen that all loaded materials are delivered to their designated dump locations.
4.1.2. Shovel Production
Table 7 shows the total production of the shovel fleet during the simulation period and compares automated scenarios with the base (i.e., manual) scenario. While implementing an assisted swing and return system in the first scenario has resulted in 3.6% improvement, it has been the automated dig function in the second scenario that improved production by 8.8%, both compared to the manual case. This could be directly linked to the fact that in the automated dig scenario, trucks are being loaded with more optimum bucket loads, and hence, not only their average final load has lower variability, but also the number of passes required to fill them and total loading time are decreased on average.
Figure 5 shows these changes.
As expected before, automation resulted in an astounding 36.1% improvement in production. Reduced propel time and number of buckets to load a truck collectively with the higher bucket load could be regarded as main operational contributors. Furthermore, eliminating the shift changes and lunch break times (a total of 1.5 h per 12-h shift including one shift change and two half an hour breaks) has a significant role in this achievement. It can be seen from
Table 8 that those lost production hours can be accounted for almost half of the automation production gain compared to the manual scenario.
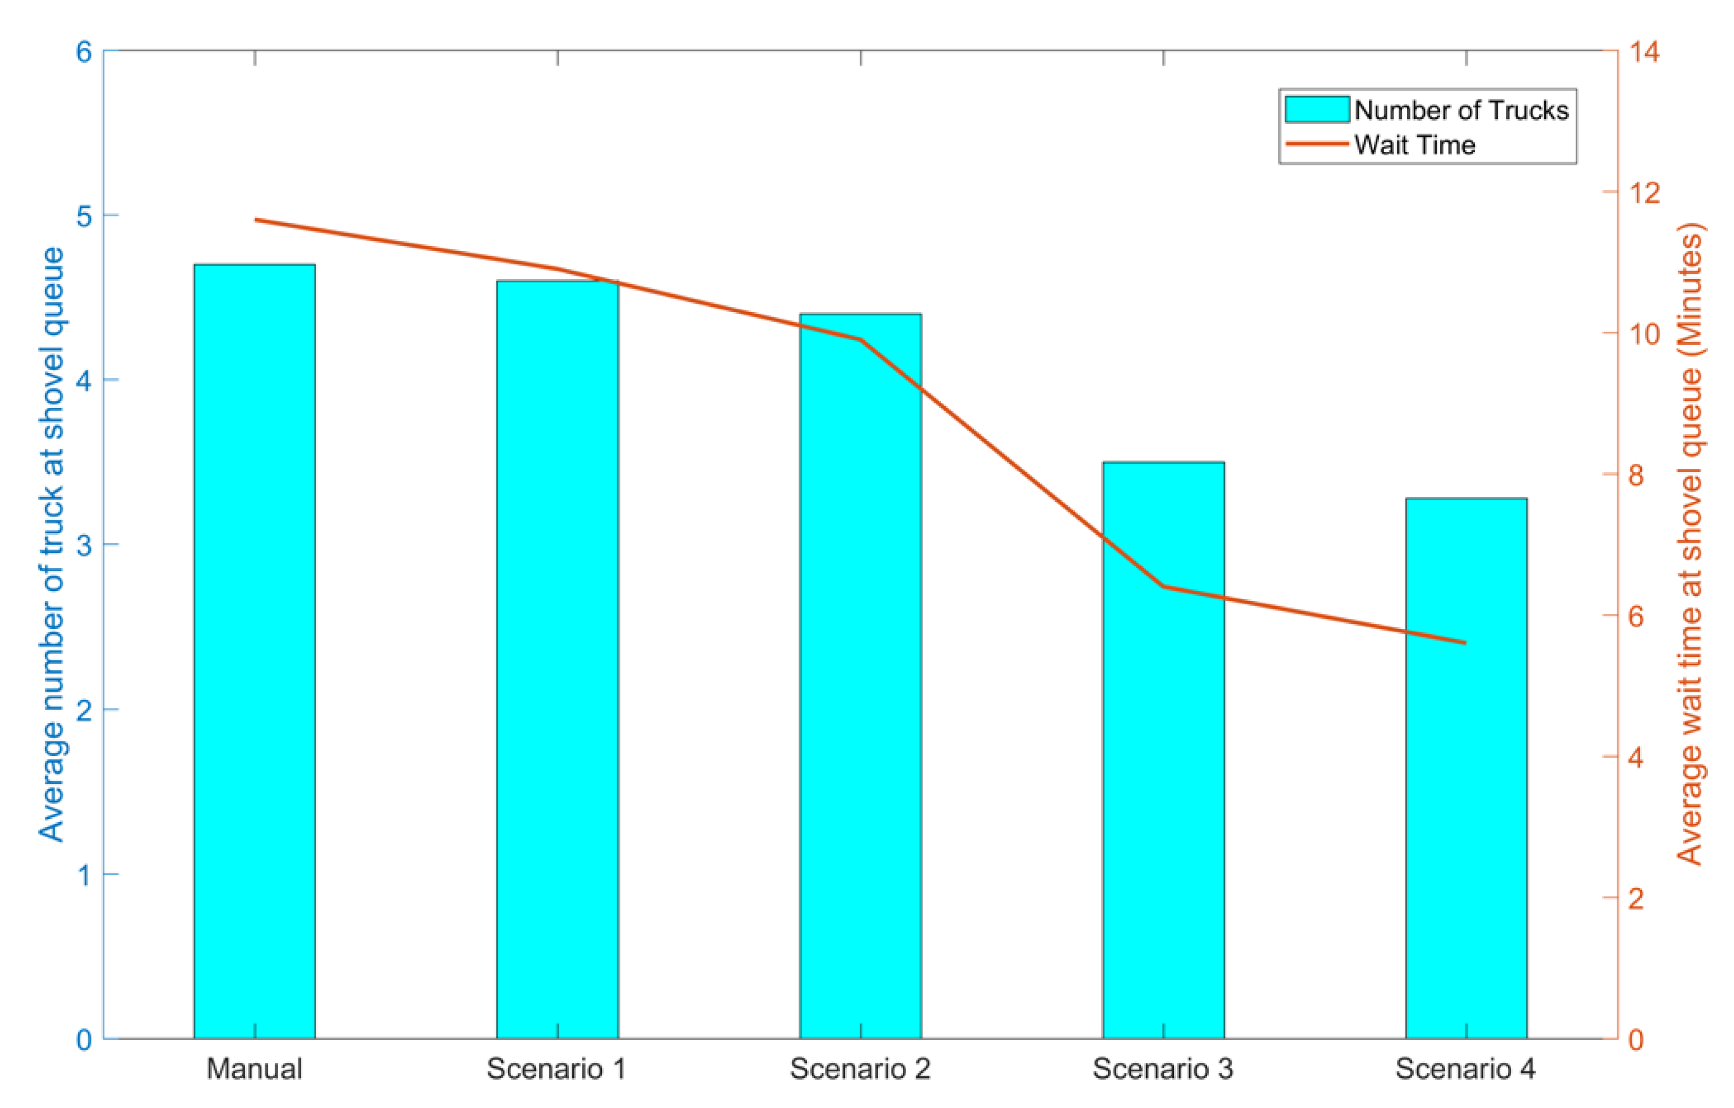
In addition to their influence on production, loading cycle times could affect other aspects of the operation.
Figure 6 presents the average number of trucks and their waiting time at loading locations. It can be seen that there is a lower wait time for all non-manual scenarios. While all truck fleet operational parameters (i.e., spotting, backing, and dump times, speeds, capacity, and dispatch algorithm) were the same for all scenarios, it is the shovel loading practices that could be solely considered as a primary contributor to the decrease in truck wait times. Additionally, the extra trucks assigned to active shovels when a shovel is out of service, either due to operator breaks or shift change, could also result in a higher number of trucks in a queue at loading locations in non-autonomous scenarios. Minimizing the wait time improves productivity and reduces operational costs and could be seen as a significant opportunity to reduce the air pollution caused by truck idling.
Truck fleet size and availability play a significant role in a shovel’s utilization of availability. As the direct result of decreased loading times and improved efficiency of shovels, trucks have become the bottleneck of the operation. Hence, shovels have to wait for trucks to become available, and the average shovel fleet utilization dropped by 10% in the improved autonomous scenario compared to the manual. It could be argued that the autonomous and improved autonomous shovel production would have been even more if the truck fleet size were increased. Furthermore, if increasing the number of trucks is not an option for the operation, a scenario with fewer shovels can be considered to meet the same production level.
5. Conclusions
This paper presented a detailed assessment of different levels of automation for an electric rope shovel and their potentials to improve mining loading and haulage system. Four hypothetical levels of automation were considered for shovels, and the influence of each proposed level on both shovel and mine productivity was evaluated. It was found that in addition to increased production for shovels, wait times at loading locations could also be reduced. The increased production for the autonomous scenarios was almost equally due to the elimination of breaks and shift time changes and the assumption of more efficient loading using automation.
It is envisioned that mine professionals can use the proposed simulation approach to help them assess the extent to which automation could improve their activities.
Future work is needed to investigate whether the automation technologies could improve overall machine health by preventing human errors (i.e., extra stresses on machine frame, or events such as boom jacks). Furthermore, how trucks and their health could be influenced by higher and more consistent payloads with better load distribution needs to be studied.


