Environmental and Work Factors That Drive Fatigue of Individual Haul Truck Drivers
Abstract
:1. Introduction
2. Previous Studies
3. Case Study
3.1. Data Description
3.2. Data Pre-Processing
3.2.1. Data Integration
3.2.2. Data Cleaning
3.2.3. Negative and Positive Samples
3.2.4. Feature Engineering
3.2.5. Features
3.3. Data Visualization
4. Methodology
4.1. Modeling Approach
XGBoost Algorithm
- n_estimators: is the number of iterations in training. A very small n_estimators can result in underfitting, which diminishes the learning ability of the model. However, very large n_estimators will cause overfitting, which is not good either [26].
- min_child_weight: identifies the summation of sample weight of the smallest leaf nodes to prevent overfitting.
- max_depth: is the maximum depth of the tree. The bigger depth of the tree makes the tree model more complex and the fitting ability stronger. However, the model is more likely to overfit.
- subsample: is the sampling rate of all training samples.
- colsample_bytree: is the feature sampling rate when constructing each tree. In this task, this is equivalent to the sampling rate of the landmark gene.
- learning_rate: is a tuning parameter in an algorithm that defines the weight at each step while moving toward a minimum of a loss function. It is a very important parameter that needs to be adjusted in every algorithm. It greatly affects the model performance. To make the model more robust, we can decrease the weight of each step.
4.2. Model
4.2.1. Model Iterations
4.2.2. Model Evaluation
- Where 0 describes that all the elements be allied to a certain class.
- The Gini index of value as 1 denotes that all the elements are randomly distributed across various classes.
- A value of 0.5 shows the elements are uniformly distributed into some classes.
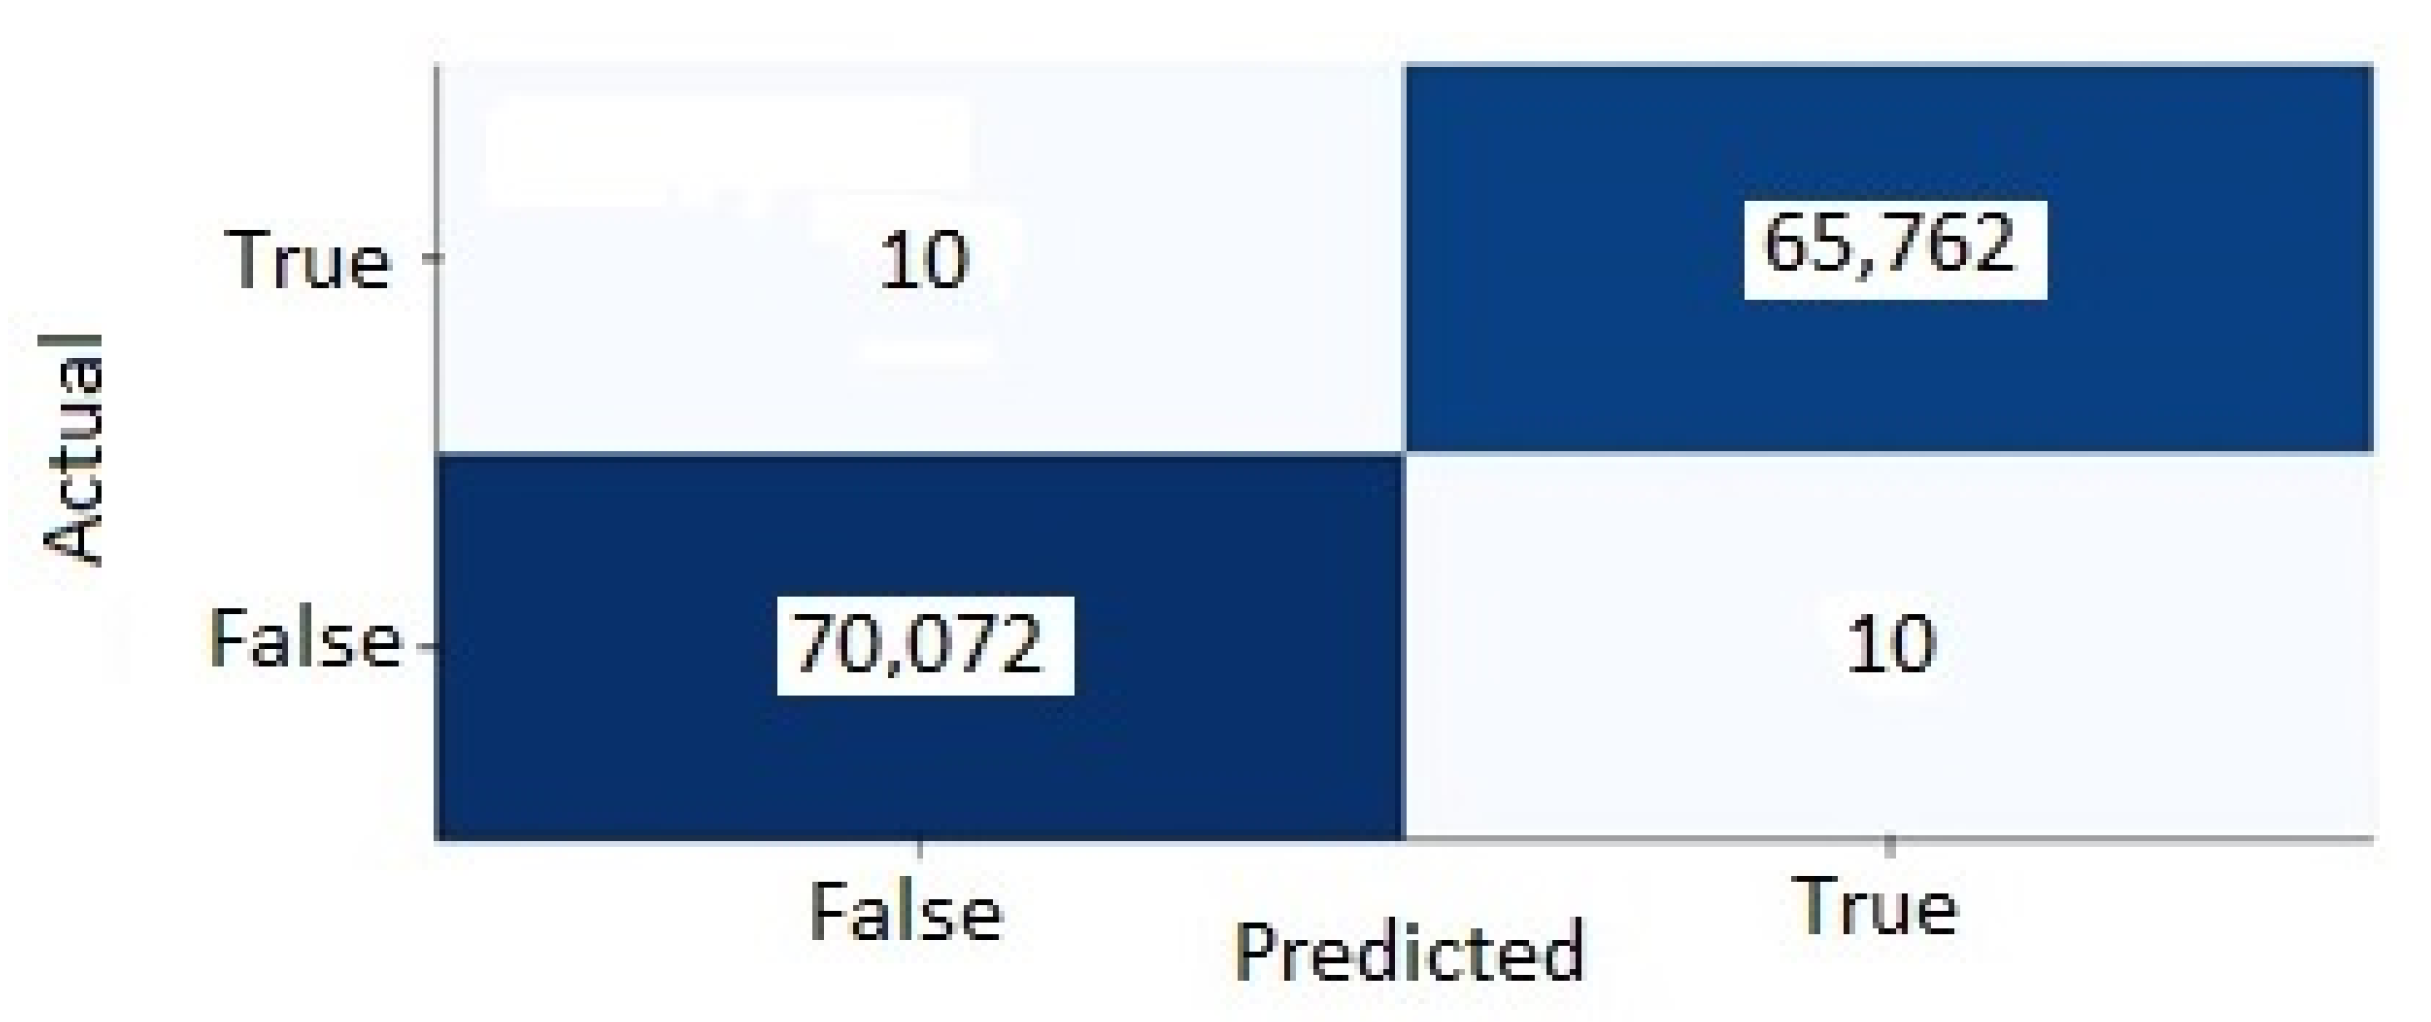
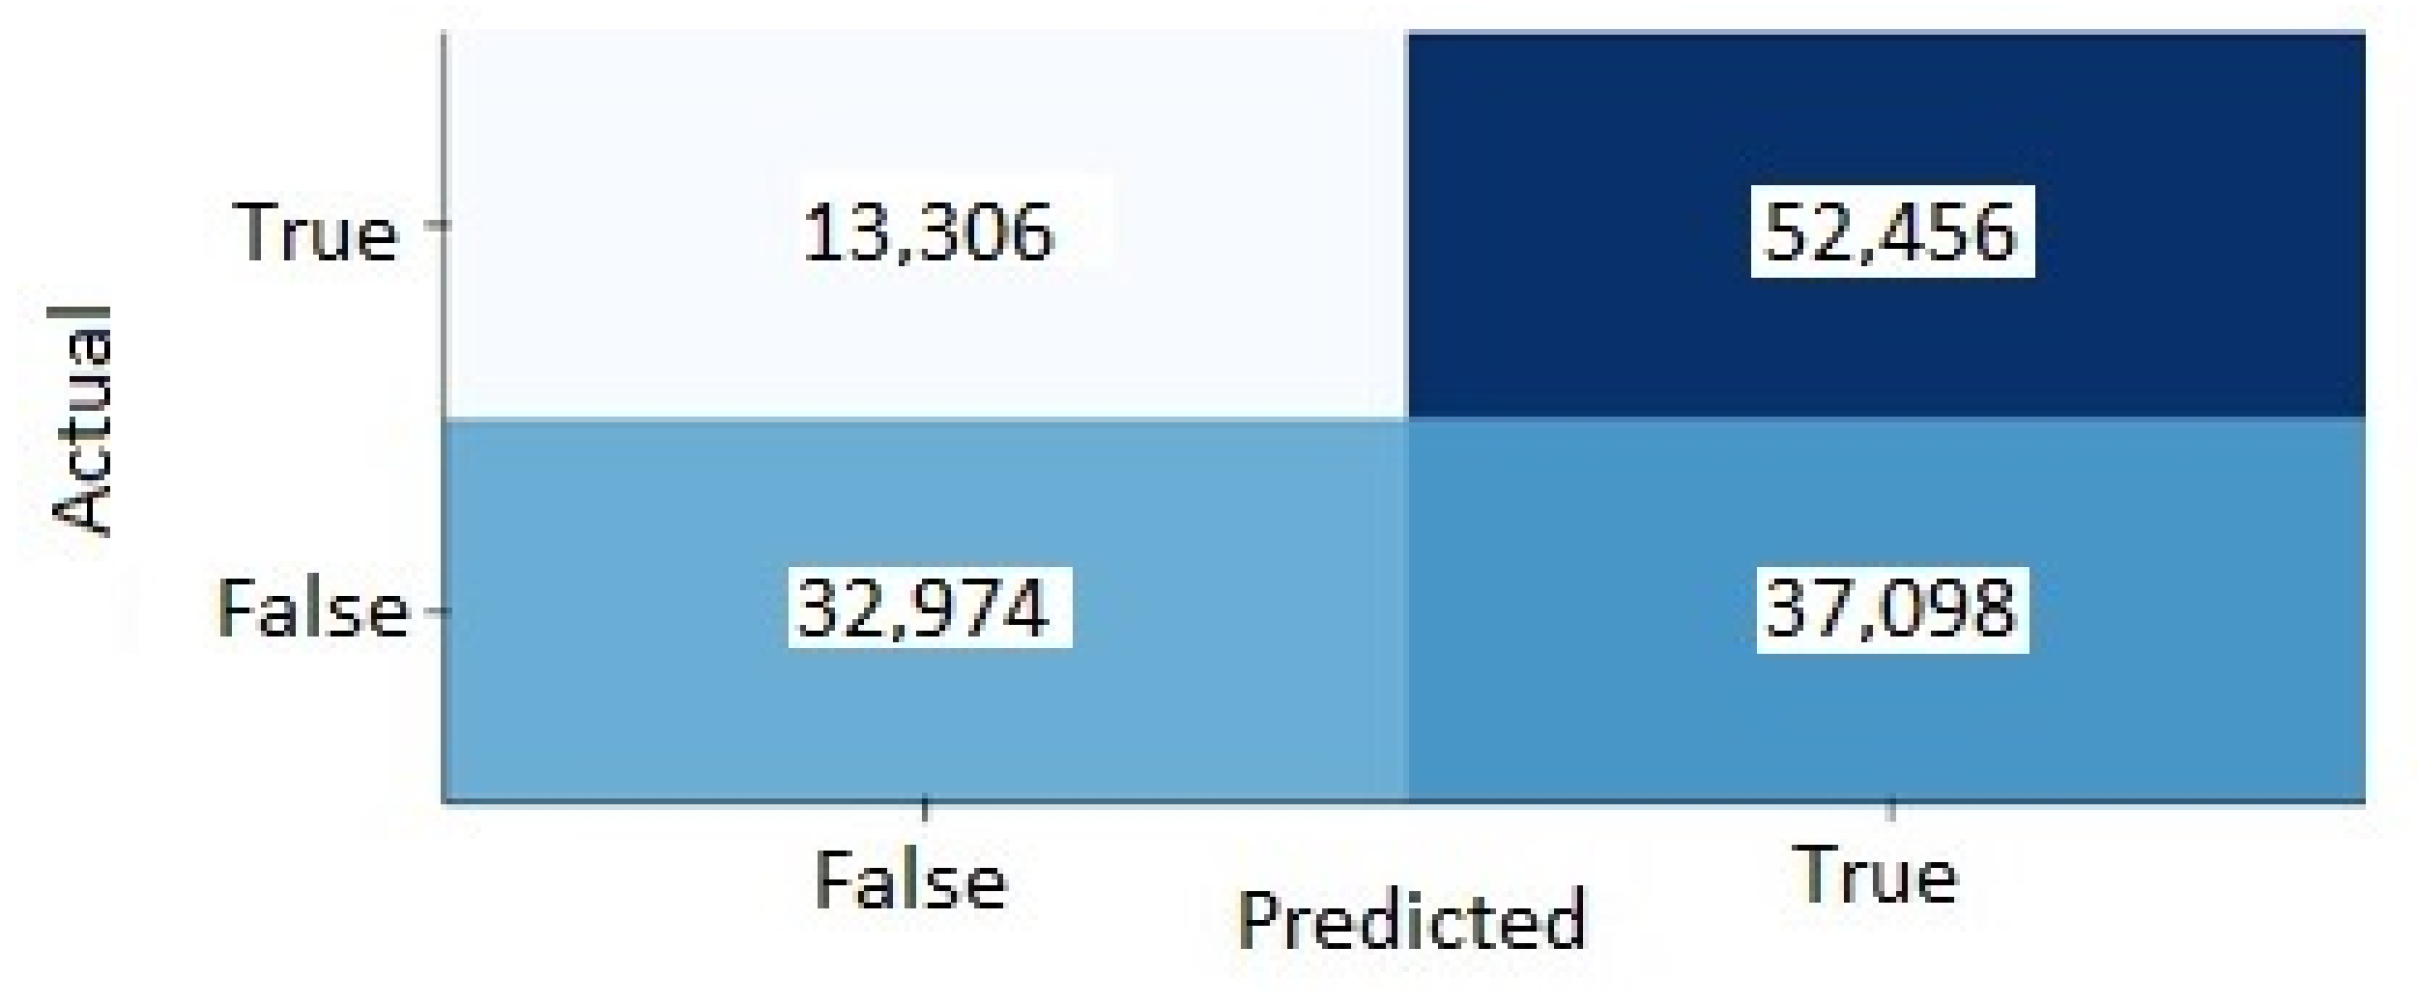
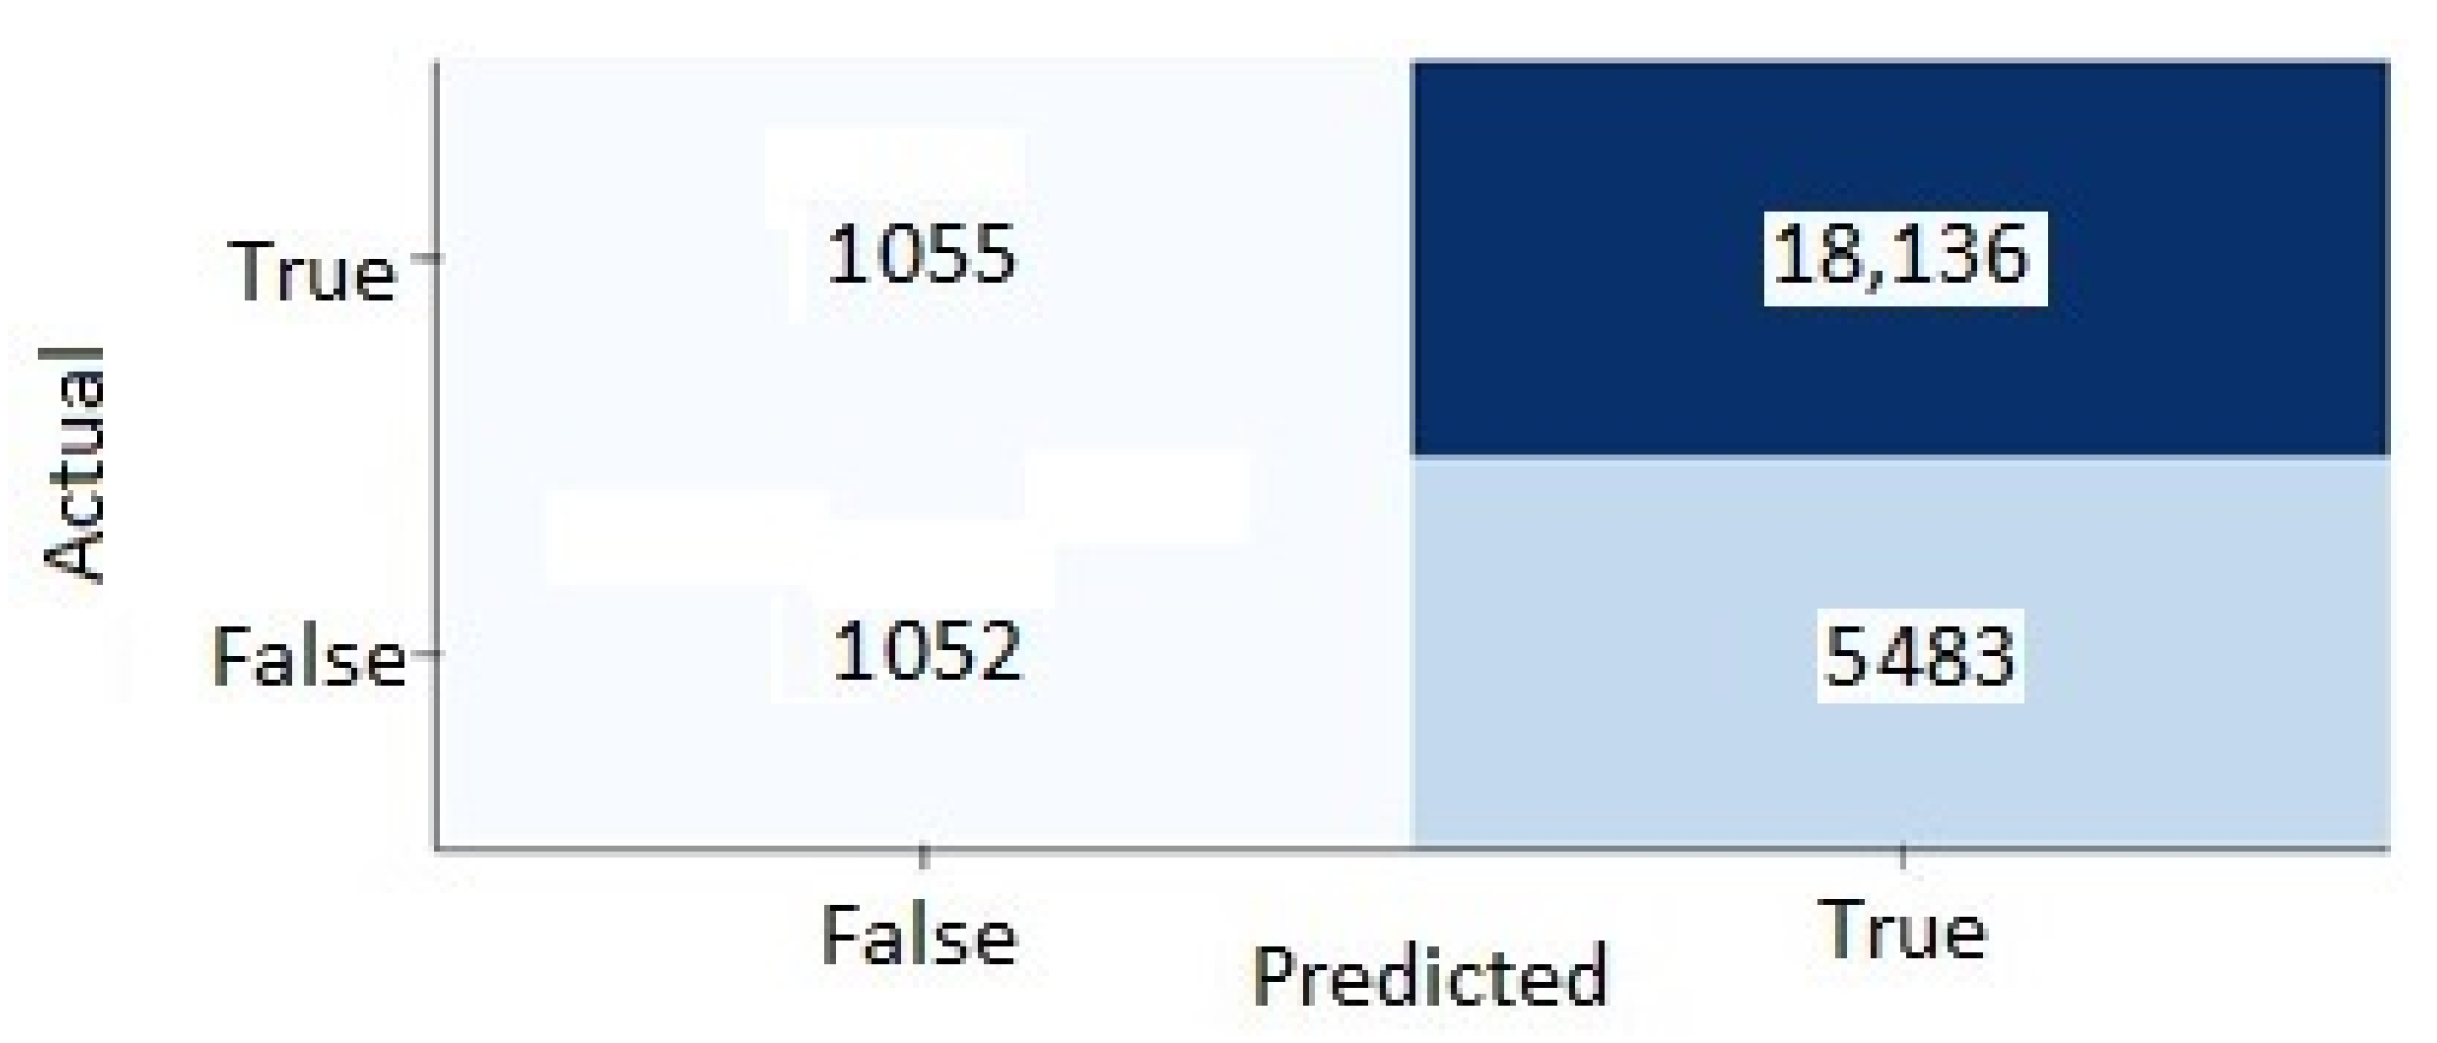
- True positives: when the model predicts a fatigue event which is an actual fatigue event in the data sets.
- True negatives: when the model predicts that an event is not fatigue and it is not an actual fatigue event in the data sets.
- False positives: when the model predicts a fatigue event that is not an actual fatigue event in the data sets.
- False negatives: when the model predicts that an event is not fatigue and it is an actual fatigue event in the data sets.
5. Results
5.1. Model Results
5.2. Gini Index
5.3. Confusion Matrix
5.4. SHAP Values of the Models
5.5. Model Iterations Comparison
6. Discussion
7. Conclusions
Author Contributions
Funding
Data Availability Statement
Acknowledgments
Conflicts of Interest
References
- Sadeghniiat-Haghighi, K.; Yazdi, Z. Fatigue management in the workplace. Ind. Psychiatry J. 2015, 24, 12. [Google Scholar] [PubMed]
- Halvani, G.H.; Zare, M.; Mirmohammadi, S.J. The relation between shift work, sleepiness, fatigue and accidents in Iranian Industrial Mining Group workers. Ind. Health 2009, 47, 134–138. [Google Scholar] [CrossRef] [PubMed]
- Bauerle, T.; Dugdale, Z.; Poplin, G. Mineworker fatigue: A review of what we know and future directions. Min. Eng. 2018, 70, 33. [Google Scholar] [PubMed]
- Qing, W.; BingXi, S.; Bin, X.; Junjie, Z. A perclos-based driver fatigue recognition application for smart vehicle space. In Proceeding of the 2010 Third International Symposium on Information Processing, Qingdao, China, 15–17 October 2010. [Google Scholar]
- Wang, L.F.; Liu, J.Q.; Yang, B.; Yang, C.S. PDMS-based low cost flexible dry electrode for long-term EEG measurement. IEEE Sens. J. 2012, 12, 2898–2904. [Google Scholar] [CrossRef]
- Prediction and Management of Fatigue with Voice Analysis. Available online: https://wombatt.net/ (accessed on 15 July 2022).
- Bakker, A.B.; Demerouti, E. The Job Demands-Resources model: State of the art. J. Manag. Psychol. 2007, 22, 309–328. [Google Scholar] [CrossRef]
- Bakker, A.B.; Demerouti, E.; De Boer, E.; Schaufeli, W.B. Job demands and job resources as predictors of absence duration and frequency. J. Vocat. Behav. 2003, 62, 341–356. [Google Scholar] [CrossRef]
- Demerouti, E.; Bakker, A.B.; Nachreiner, F.; Schaufeli, W.B. The job demands-resources model of burnout. J. Appl. Psychol. 2001, 86, 499. [Google Scholar] [CrossRef] [PubMed]
- Briggs, C.; Nolan, J.; Heiler, K. Fitness for Duty in the Australian Mining Industry: Emerging Legal and Industrial Issues; Australian Centre for Industrial Relations Research and Teaching: Sydney, Australia, 2001; pp. 1–52. ISBN 186487421X. [Google Scholar]
- Parker, T.W.; Warringham, C. Fitness for work in mining: Not a ‘one size fits all’ approach. In Proceedings of the Queensland Mining Industry Health & Safety Conference, Casino, Australia, 4–7 August 2004. [Google Scholar]
- Hutchinson, B. Fatigue Management in Mining–Time to Wake up and Act. Optimize Consulting. 2014. Available online: http://www.tmsconsulting.com.au/basic-fatigue-management-in-mining/ (accessed on 20 January 2020).
- Pelders, J.; Nelson, G. Contributors to Fatigue of Mine Workers in the South African Gold and Platinum Sector. Saf. Health Work 2019, 10, 188–195. [Google Scholar] [CrossRef] [PubMed]
- Cavuoto, L.; Megahed, F. Understanding fatigue and the implications for worker safety. In Proceedings of the ASSE Professional Development Conference and Exposition 2016, Atlanta, GA, USA, 26–29 June 2016. [Google Scholar]
- Talebi, E.; Roghanchi, P.; Abbasi, B. Heat management in mining industry: Personal risk factors, mitigation practices, and industry actions. In Proceedings of the 17th North American Mine Ventilation Symposium, Montreal, QU, Canada, 28 April–1 May 2019. [Google Scholar]
- Tufano, P. Who manages risk? An empirical examination of risk management practices in the gold mining company. J. Financ. 1996, 51, 1097–1137. [Google Scholar] [CrossRef]
- Wegerich, S.W.; Wolosewicz, A.; Xu, X.; Herzog, J.P.; Pipke, R.M. Automated Model Configuration and Deployment System for Equipment Health Monitoring. U.S. Patent 7,640,145 B2, 29 December 2009. [Google Scholar]
- Drews, F.A.; Rogers, W.P.; Talebi, E.; Lee, S. The Experience and Management of Fatigue: A Study of Mine Haulage Operators. Min. Metall. Explor. 2020, 37, 1837–1846. [Google Scholar] [CrossRef]
- Hallowell, M.R.; Hinze, J.W.; Baud, K.C.; Wehle, A. Proactive construction safety control: Measuring, monitoring, and responding to safety leading indicators. J. Constr. Eng. Manag. 2013, 139, 04013010. [Google Scholar] [CrossRef]
- Tixier, A.J.P.; Hallowell, M.R.; Rajagopalan, B.; Bowman, D. Application of machine learning to construction injury prediction. Autom. Constr. 2016, 69, 102–114. [Google Scholar] [CrossRef]
- Thibaud, M.; Chi, H.; Zhou, W.; Piramuthu, S. Internet of Things (IoT) in high-risk Environment, Health and Safety (EHS) industries: A comprehensive review. Decis. Support Syst. 2018, 108, 79–95. [Google Scholar] [CrossRef]
- Lingard, H.; Hallowell, M.; Salas, R.; Pirzadeh, P. Leading or lagging? Temporal analysis of safety indicators on a large infrastructure construction project. Saf. Sci. 2017, 91, 206–220. [Google Scholar] [CrossRef]
- Talebi, E.; Rogers, W.P.; Morgan, T.; Drews, F.A. Modeling mine workforce fatigue: Finding leading indicators of fatigue in operational data sets. Minerals 2021, 11, 621. [Google Scholar] [CrossRef]
- Dong, G.; Liu, H. (Eds.) Feature Engineering for Machine Learning and Data Analytics; CRC Press: Boca Raton, FL, USA, 2018; pp. 2–9. [Google Scholar]
- Zhang, L.; Zhan, C. Machine learning in rock facies classification: An application of XGBoost. In Proceedings of the International Geophysical Conference, Qingdao, China, 17–20 April 2017. [Google Scholar]
- Li, W.; Yin, Y.; Quan, X.; Zhang, H. Gene expression value prediction based on XGBoost algorithm. Front. Genet. 2019, 10, 1077. [Google Scholar] [CrossRef] [PubMed] [Green Version]


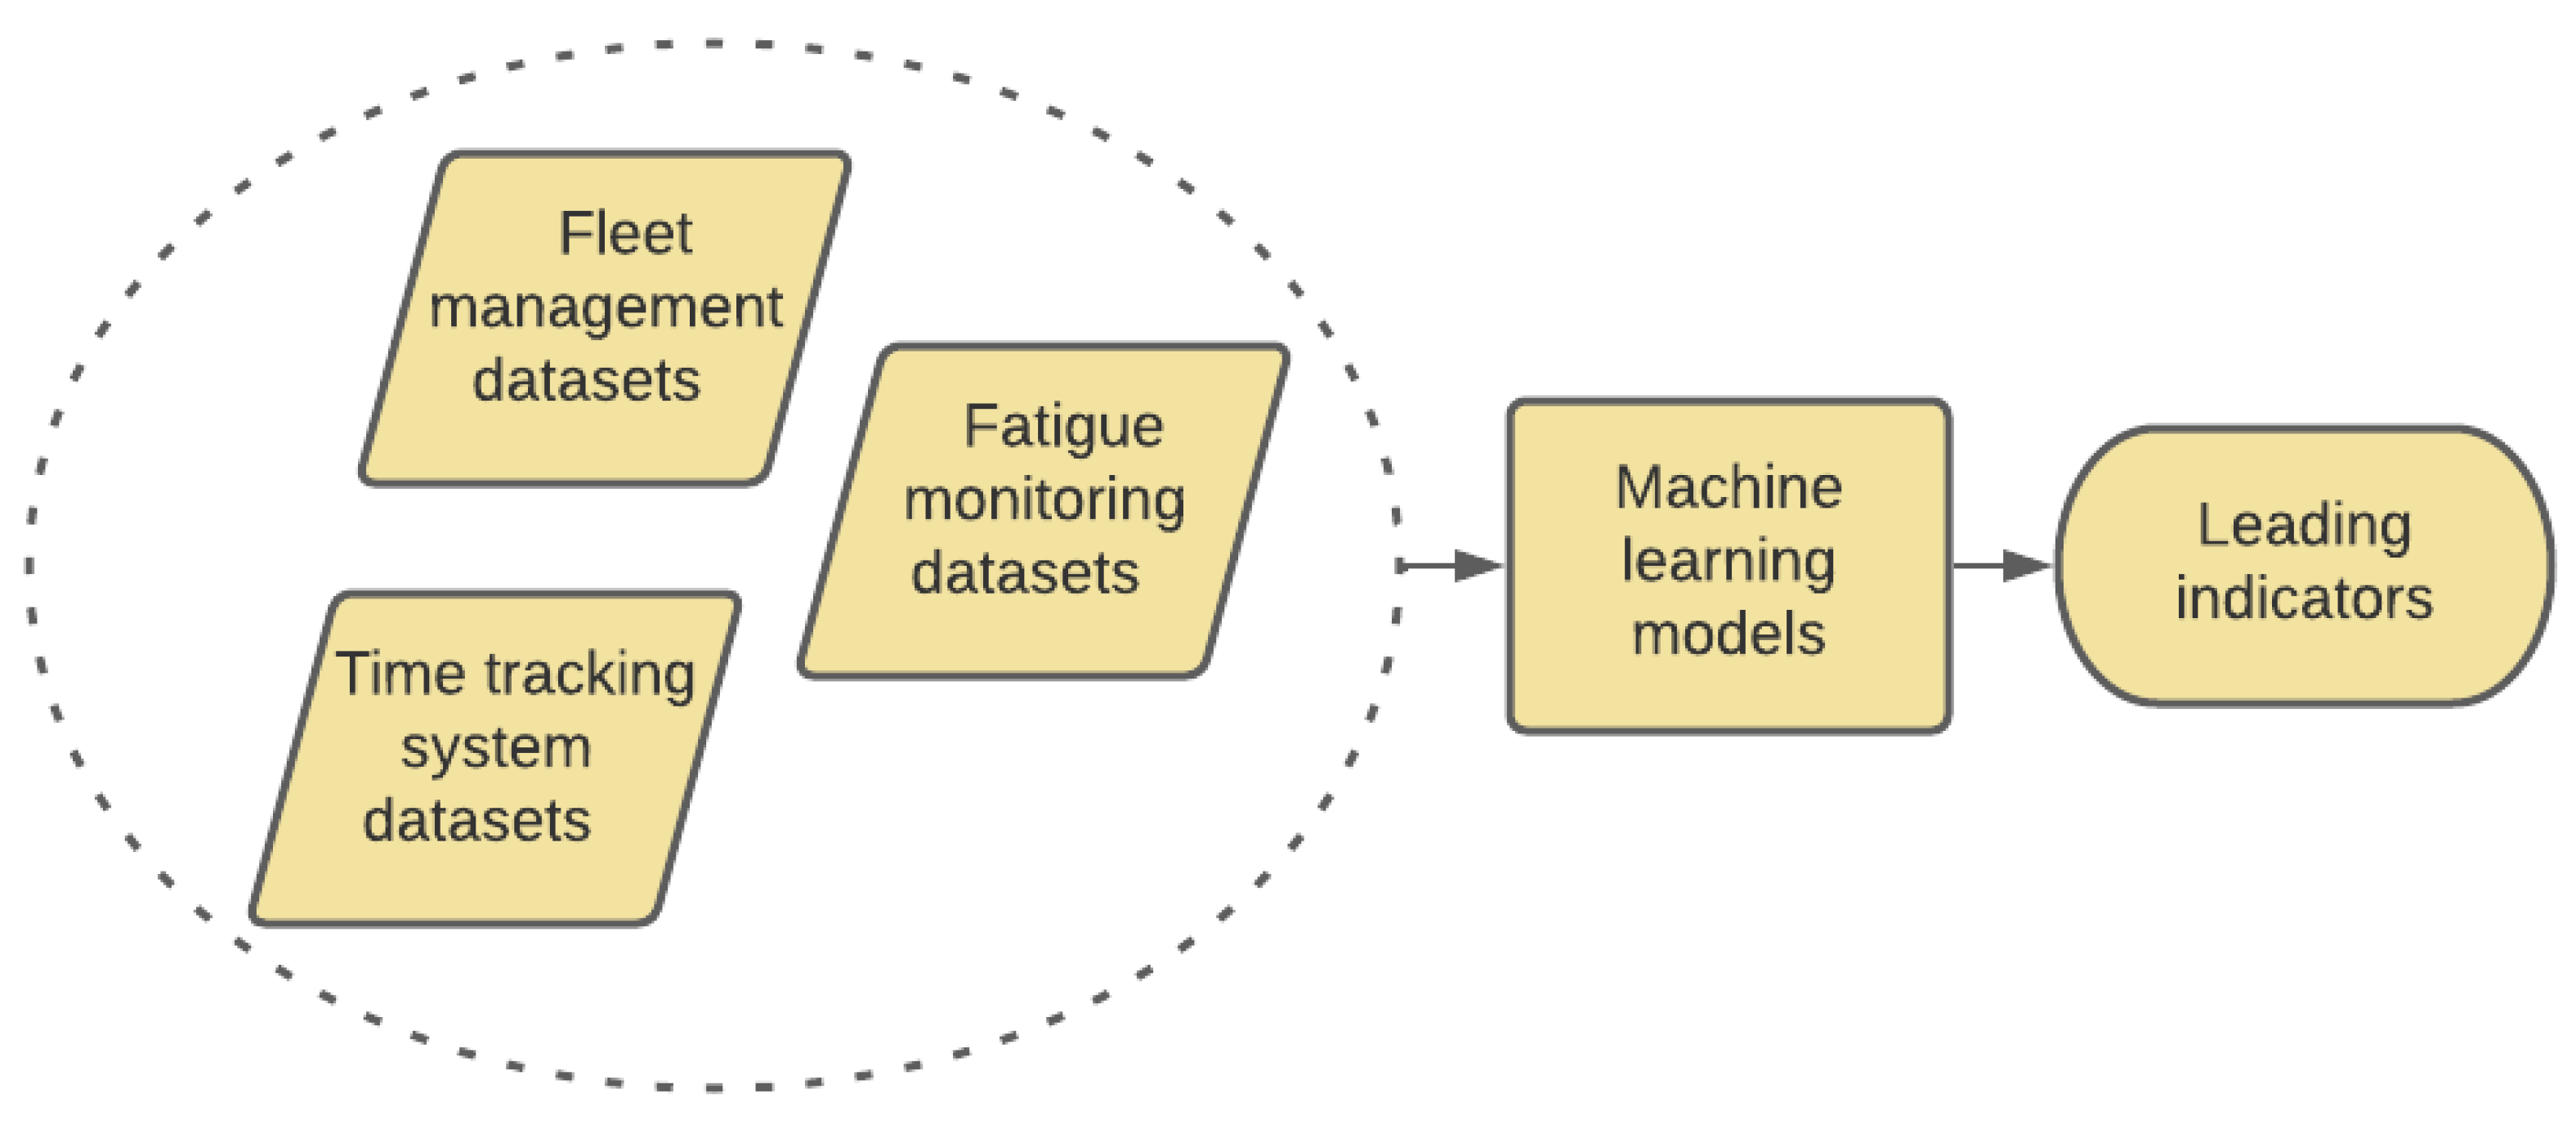
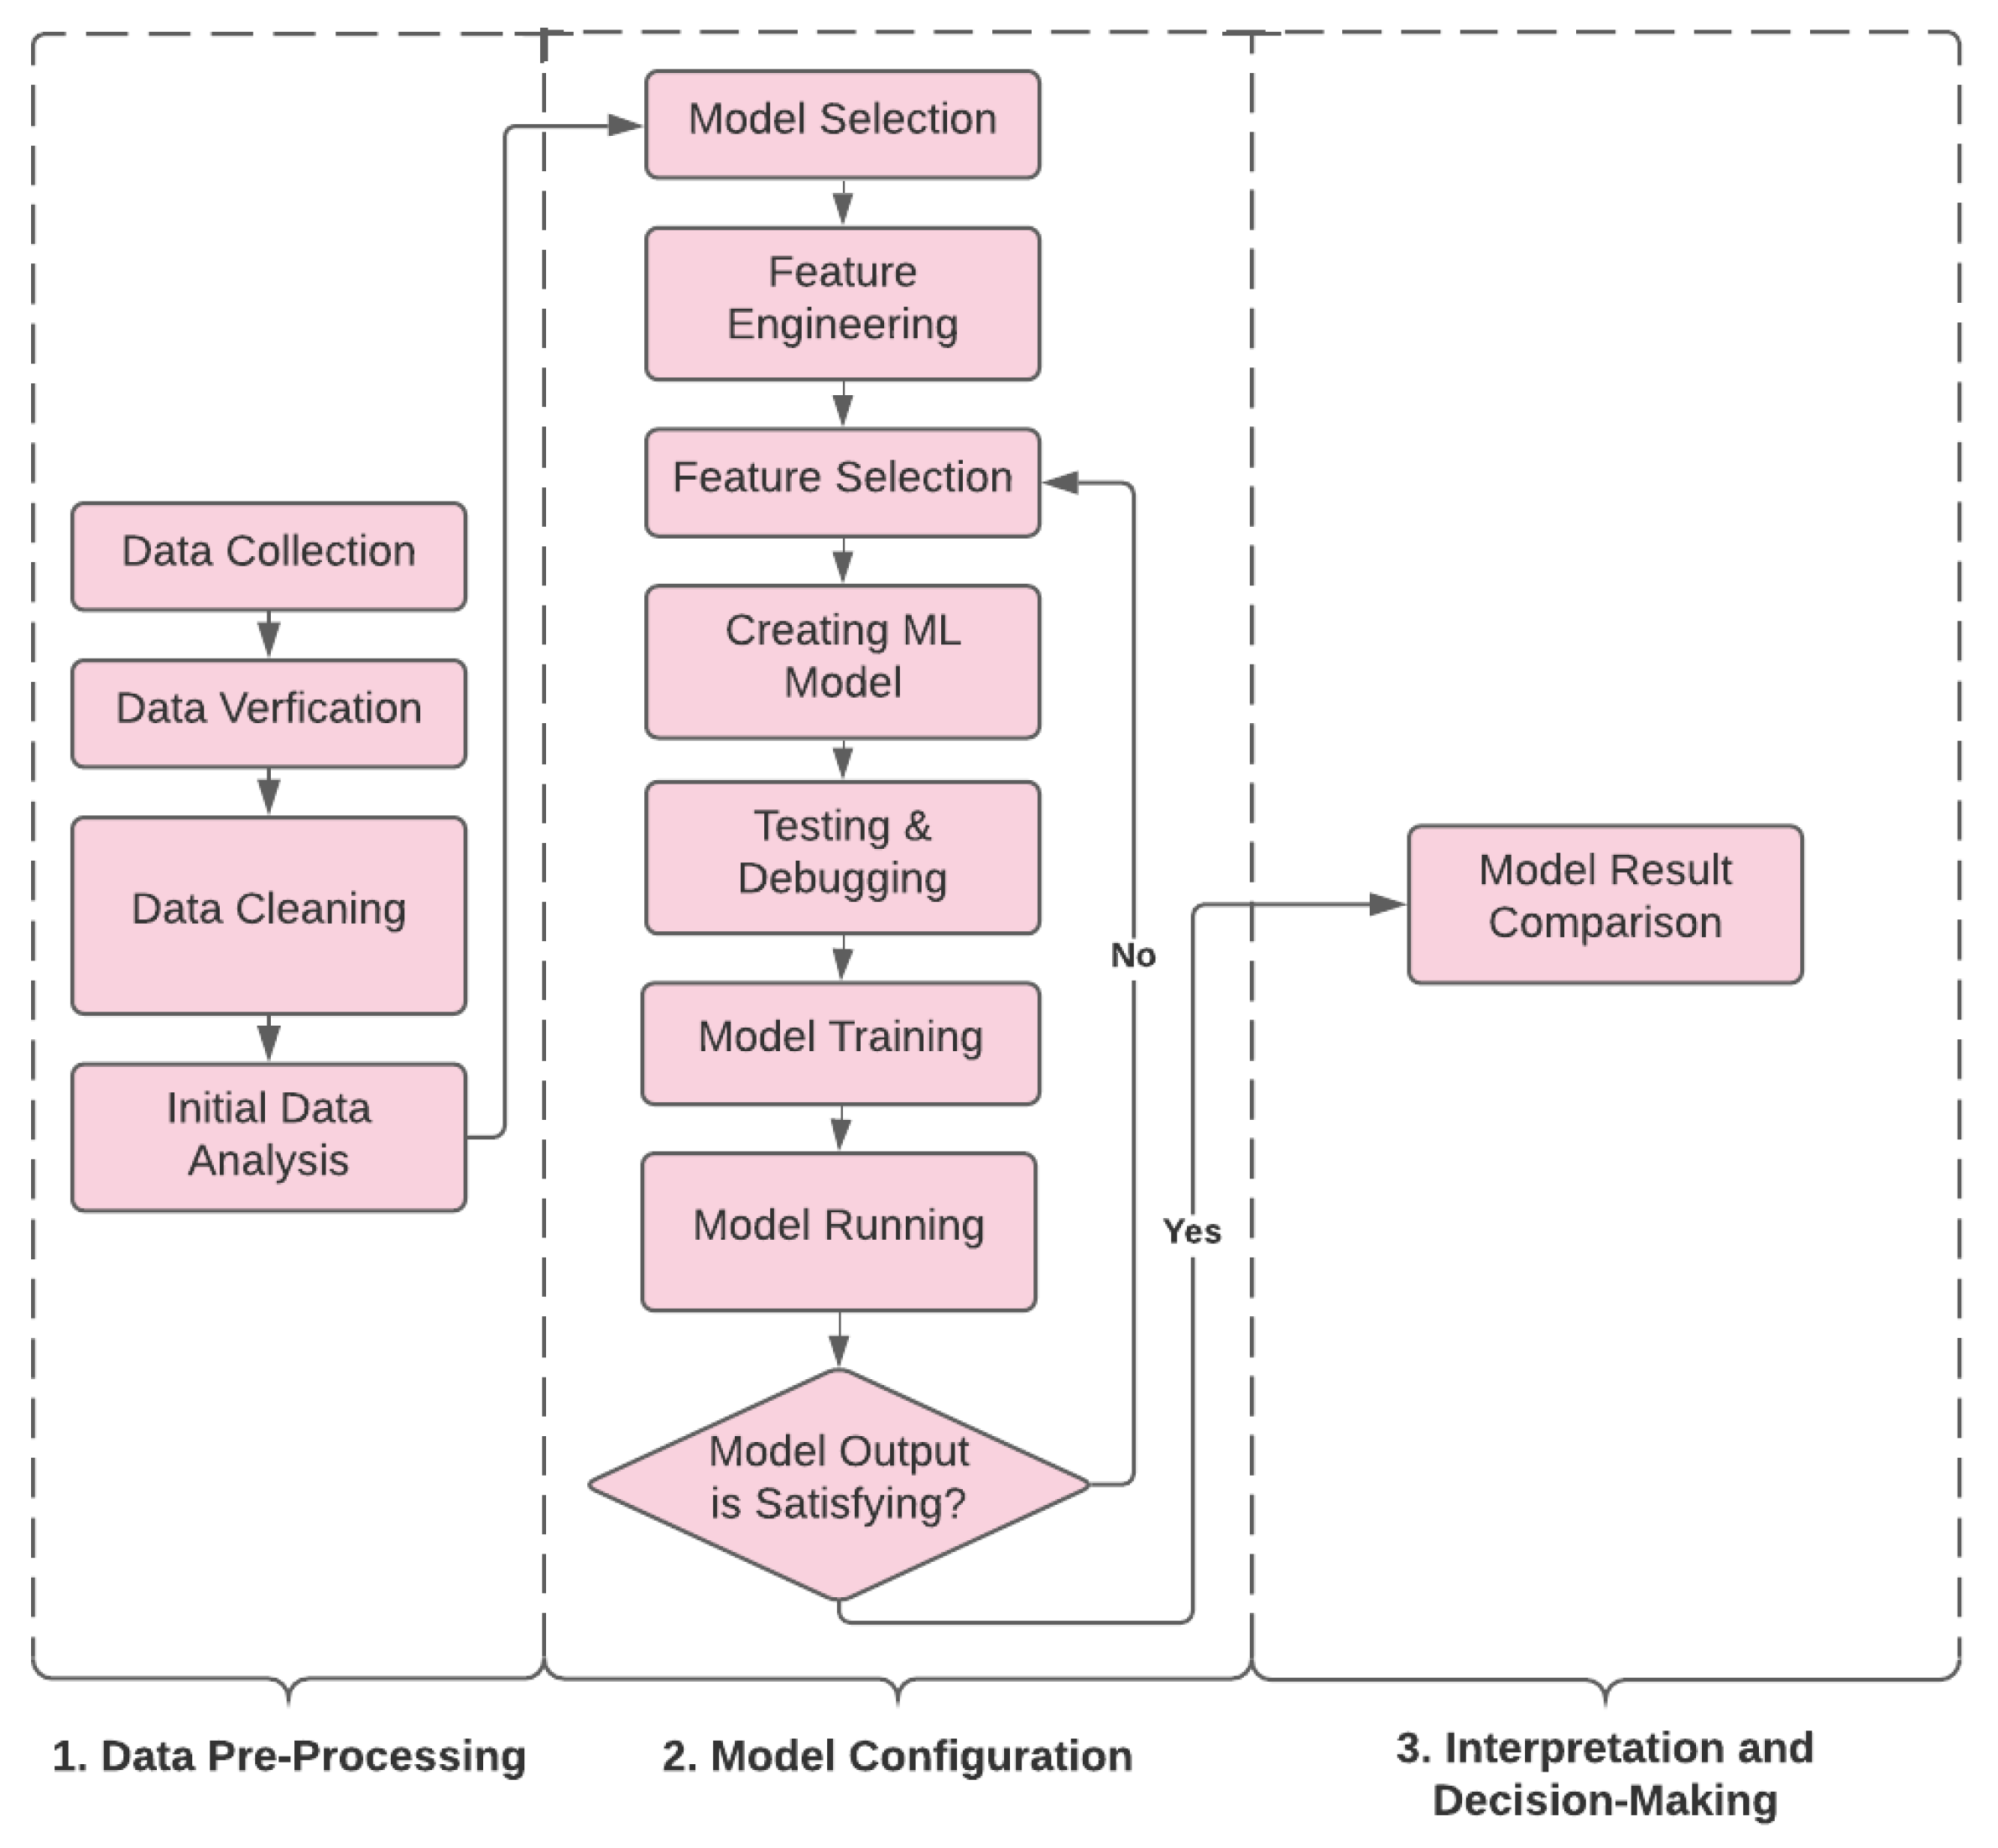




| Data Source | Key Factors | Date Range |
|---|---|---|
| Fatigue monitoring | Micro-sleeps (low and critical fatigue) | 2016–2020 |
| Time and attendance | Hours worked, overtime, etc. | 2016–2020 |
| Fleet management system (production and status) | Production cycles, down equipment, delayed equipment, etc. | 2016–2020 |
| Fatigue Event Review Type | Number of Fatigue Events | Percentage of Fatigue |
|---|---|---|
| Low Fatigue | 741 | 69% |
| Critical Fatigue | 332 | 31% |
| Data Source | Variables | Data Type and Example Data |
|---|---|---|
| Time and attendance | Employee ID | Integer (5 to 89,021) |
| Common Equipment ID | Integer (205 to 841) | |
| Year | Integer (2014 to 2020) | |
| Month | Integer (1 to 12) | |
| Week | Integer (1 to 54) | |
| Day | Integer (1 to 31) | |
| Day of week | Integer (1 to 7) | |
| Day of year | Integer (1 to 366) | |
| Shift is end of month | Categorical Integer (0 and 1) | |
| Shift is start of month | Categorical Integer (0 and 1) | |
| Shift is end of quarter | Categorical Integer (0 and 1) | |
| Shift is start of quarter | Categorical Integer (0 and 1) | |
| Shift is end of year | Categorical Integer (0 and 1) | |
| Shift is start of year | Categorical Integer (0 and 1) | |
| Worked hour | Integer (0 to 13) | |
| Overtime | Integer (0 to 1) | |
| Overtime of previous shift | Integer (0 to 1) | |
| Fleet management system (production and status) | Status—Delay Status—Down Status—Ready Status—Standby Number of cycles Number of cycles of previous shift Work Type Scheduled Work type Unscheduled Fleet_HTE—KOM960 Fleet_HTE—LEB282 Fleet_HTM—CAT793 Reason Description (Included of 70 different variables) State of Truck—Empty Driving State of Truck—Full Driving State of Truck—Loading State of Truck—None State of Truck—In Queue Waiting for Loading State of Truck—Spotting for Load Status Event Duration | Categorical Integer (0 and 1) Categorical Integer (0 and 1) Categorical Integer (0 and 1) Categorical Integer (0 and 1) Integer (1 to 121) Integer (1 to 121) Categorical Integer (0 and 1) Categorical Integer (0 and 1) Categorical Integer (0 and 1) Categorical Integer (0 and 1) Categorical Integer (0 and 1) Categorical Integer (0 and 1) Categorical Integer (0 and 1) Categorical Integer (0 and 1) Categorical Integer (0 and 1) Categorical Integer (0 and 1) Categorical Integer (0 and 1) Categorical Integer (0 and 1) Integer (2 to 167,932) |
| Fatigue monitoring system | Is Fatigue | Categorical Integer (0 to 1) |
| Model | Independent Variables | Score | Top Features |
|---|---|---|---|
| First model | Employee ID Common Equipment ID Year Month Week Day Day of week Day of year Shift is end of month Shift is start of month Shift is end of quarter Shift is start of quarter Shift is end of year Shift is start of year Worked hour Overtime of previous shift Status—Down Status—Standby Number of cycles of previous shift Work Type Scheduled Work type Unscheduled Fleet_HTE—KOM960 Fleet_HTE—LEB282 Fleet_HTM—CAT793 Reason Description (Included of 70 different variables) State of Truck—Empty Driving State of Truck—Full Driving State of Truck—Loading State of Truck—None State of Truck—In Queue Waiting for Loading State of Truck—Spotting for Load Status Event Duration | 0.98 |
|
| Second model | Employee ID Common Equipment ID Year Month Week Day Day of week Day of year Shift is end of month Shift is start of month Shift is end of quarter Shift is start of quarter Shift is end of year Shift is start of year Worked hour Overtime Status—Down Status—Standby Number of cycles Work Type Scheduled Work type Unscheduled Fleet_HTE—KOM960 Fleet_HTE—LEB282 Fleet_HTM—CAT793 Reason Description (Included of 70 different variables) State of Truck—Empty Driving State of Truck—Full Driving State of Truck—Loading State of Truck—None State of Truck—In Queue Waiting for Loading State of Truck—Spotting for Load Status Event Duration | 0.83 |
|
| Third model | Employee ID Common Equipment ID Year Month Week Day Day of week Day of year Shift is end of month Shift is start of month Shift is end of quarter Shift is start of quarter Shift is end of year Shift is start of year Worked hour Status—Down Status—Standby Work Type Scheduled Work type Unscheduled Fleet_HTE—KOM960 Fleet_HTE—LEB282 Fleet_HTM—CAT793 Reason Description (Included of 70 different variables) State of Truck—Empty Driving State of Truck—Full Driving State of Truck—Loading State of Truck—None State of Truck—In Queue Waiting for Loading State of Truck—Spotting for Load Status Event Duration | 0.82 |
|
| Fourth model (With employees with a higher rate of fatigue) | Common Equipment ID Year Month Week Day Day of week Day of year Shift is end of month Shift is start of month Shift is end of quarter Shift is start of quarter Shift is end of year Shift is start of year Worked hour Status—Down Status—Standby Work Type Scheduled Work type Unscheduled Fleet_HTE—KOM960 Fleet_HTE—LEB282 Fleet_HTM—CAT793 Reason Description (Included of 70 different variables) State of Truck—Empty Driving State of Truck—Full Driving State of Truck—Loading State of Truck—None State of Truck—In Queue Waiting for Loading State of Truck—Spotting for Load Status Event Duration | 0.83 |
|
| Fifth model (With employees with a lower rate of fatigue) | Common Equipment ID Year Month Week Day Day of week Day of year Shift is end of month Shift is start of month Shift is end of quarter Shift is start of quarter Shift is end of year Shift is start of year Worked hour Status—Down Status—Standby Work Type Scheduled Work type Unscheduled Fleet_HTE—KOM960 Fleet_HTE—LEB282 Fleet_HTM—CAT793 Reason Description (Included of 70 different variables) State of Truck—Empty Driving State of Truck—Full Driving State of Truck—Loading State of Truck—None State of Truck—In Queue Waiting for Loading State of Truck—Spotting for Load Status Event Duration | 0.82 |
|
| Model | Gini Index |
|---|---|
| First model | 0 |
| Second model | 0.46 |
| Third model | 0.48 |
| Fourth model | 0.37 |
| Fifth model | 0.47 |
| Model | Accuracy |
|---|---|
| First model | 0.99 |
| Second model | 0.63 |
| Third model | 0.60 |
| Fourth model | 0.74 |
| Fifth model | 0.60 |
| Model | Top Feature | Score | Percentage of Samples That Predicted Correctly |
|---|---|---|---|
| First model | Employee ID | 0.99 | 100% |
| Second model | Employee ID | 0.83 | 63% |
| Third model | Employee ID | 0.82 | 60% |
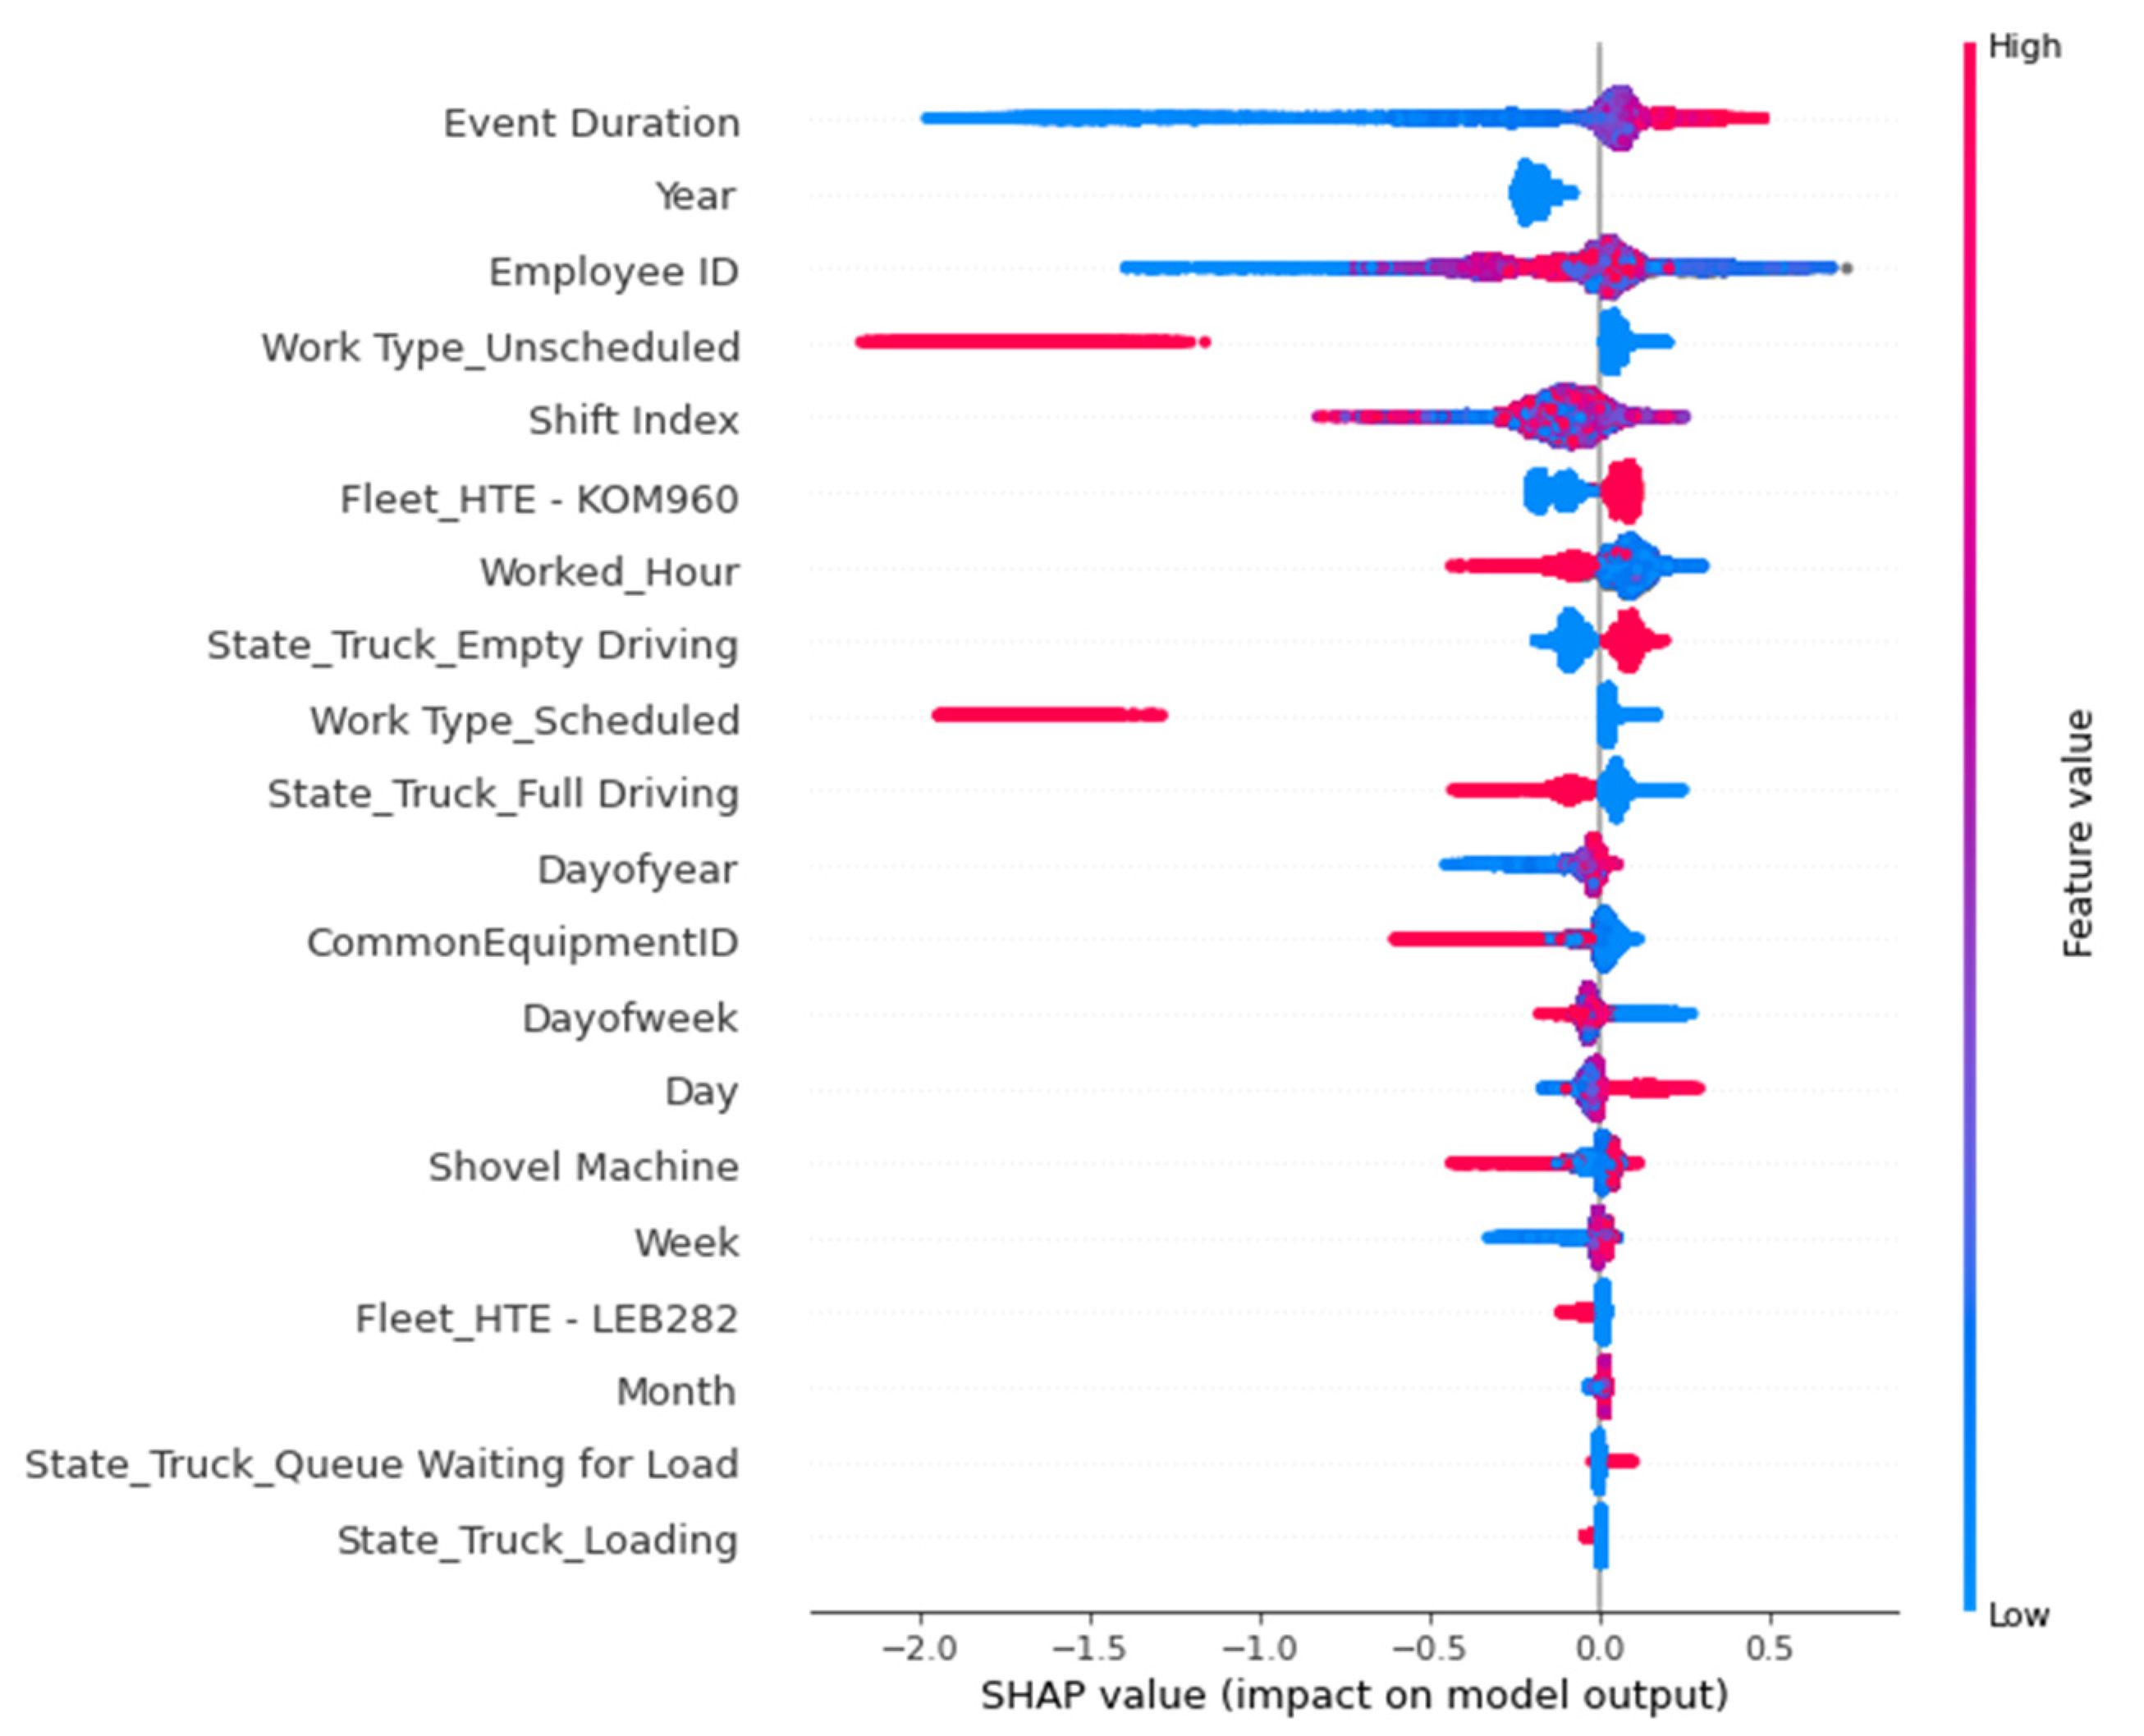
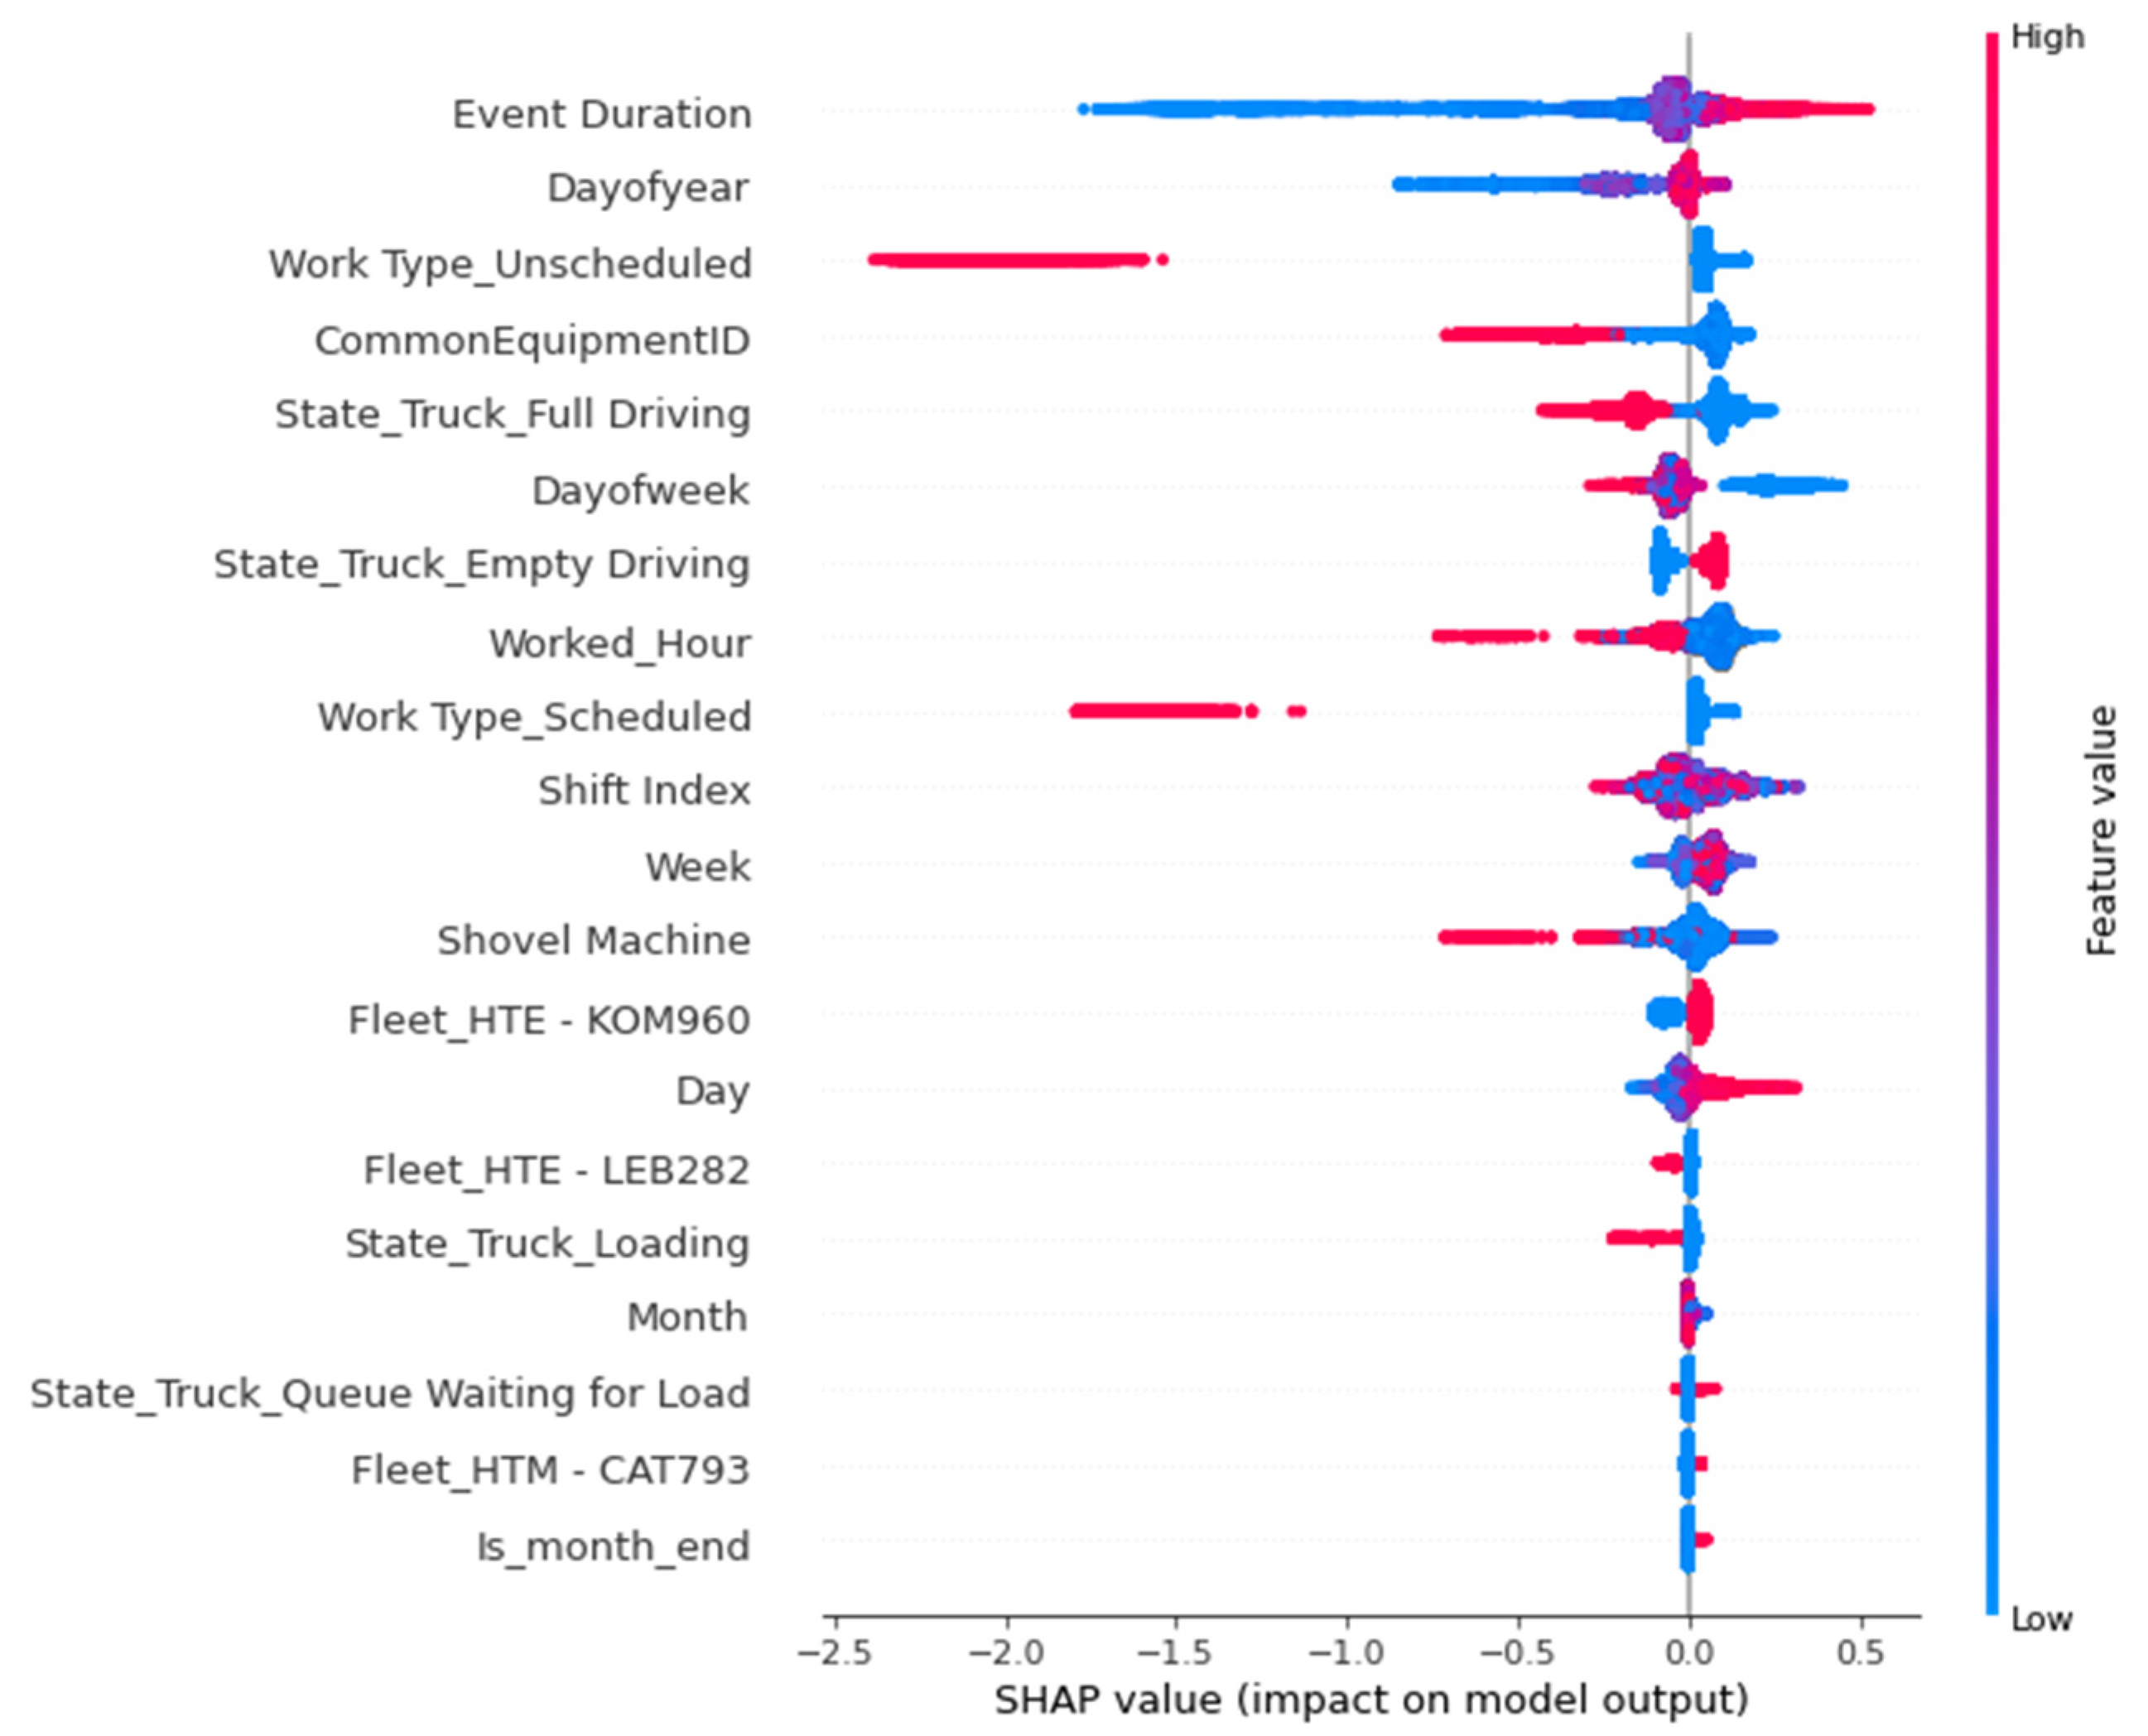
| Fourth model | Shift Index | 0.83 | 74% |
| Fifth model | Shift Index | 0.82 | 60% |
| Data Category | Feature Rank | Feature |
|---|---|---|
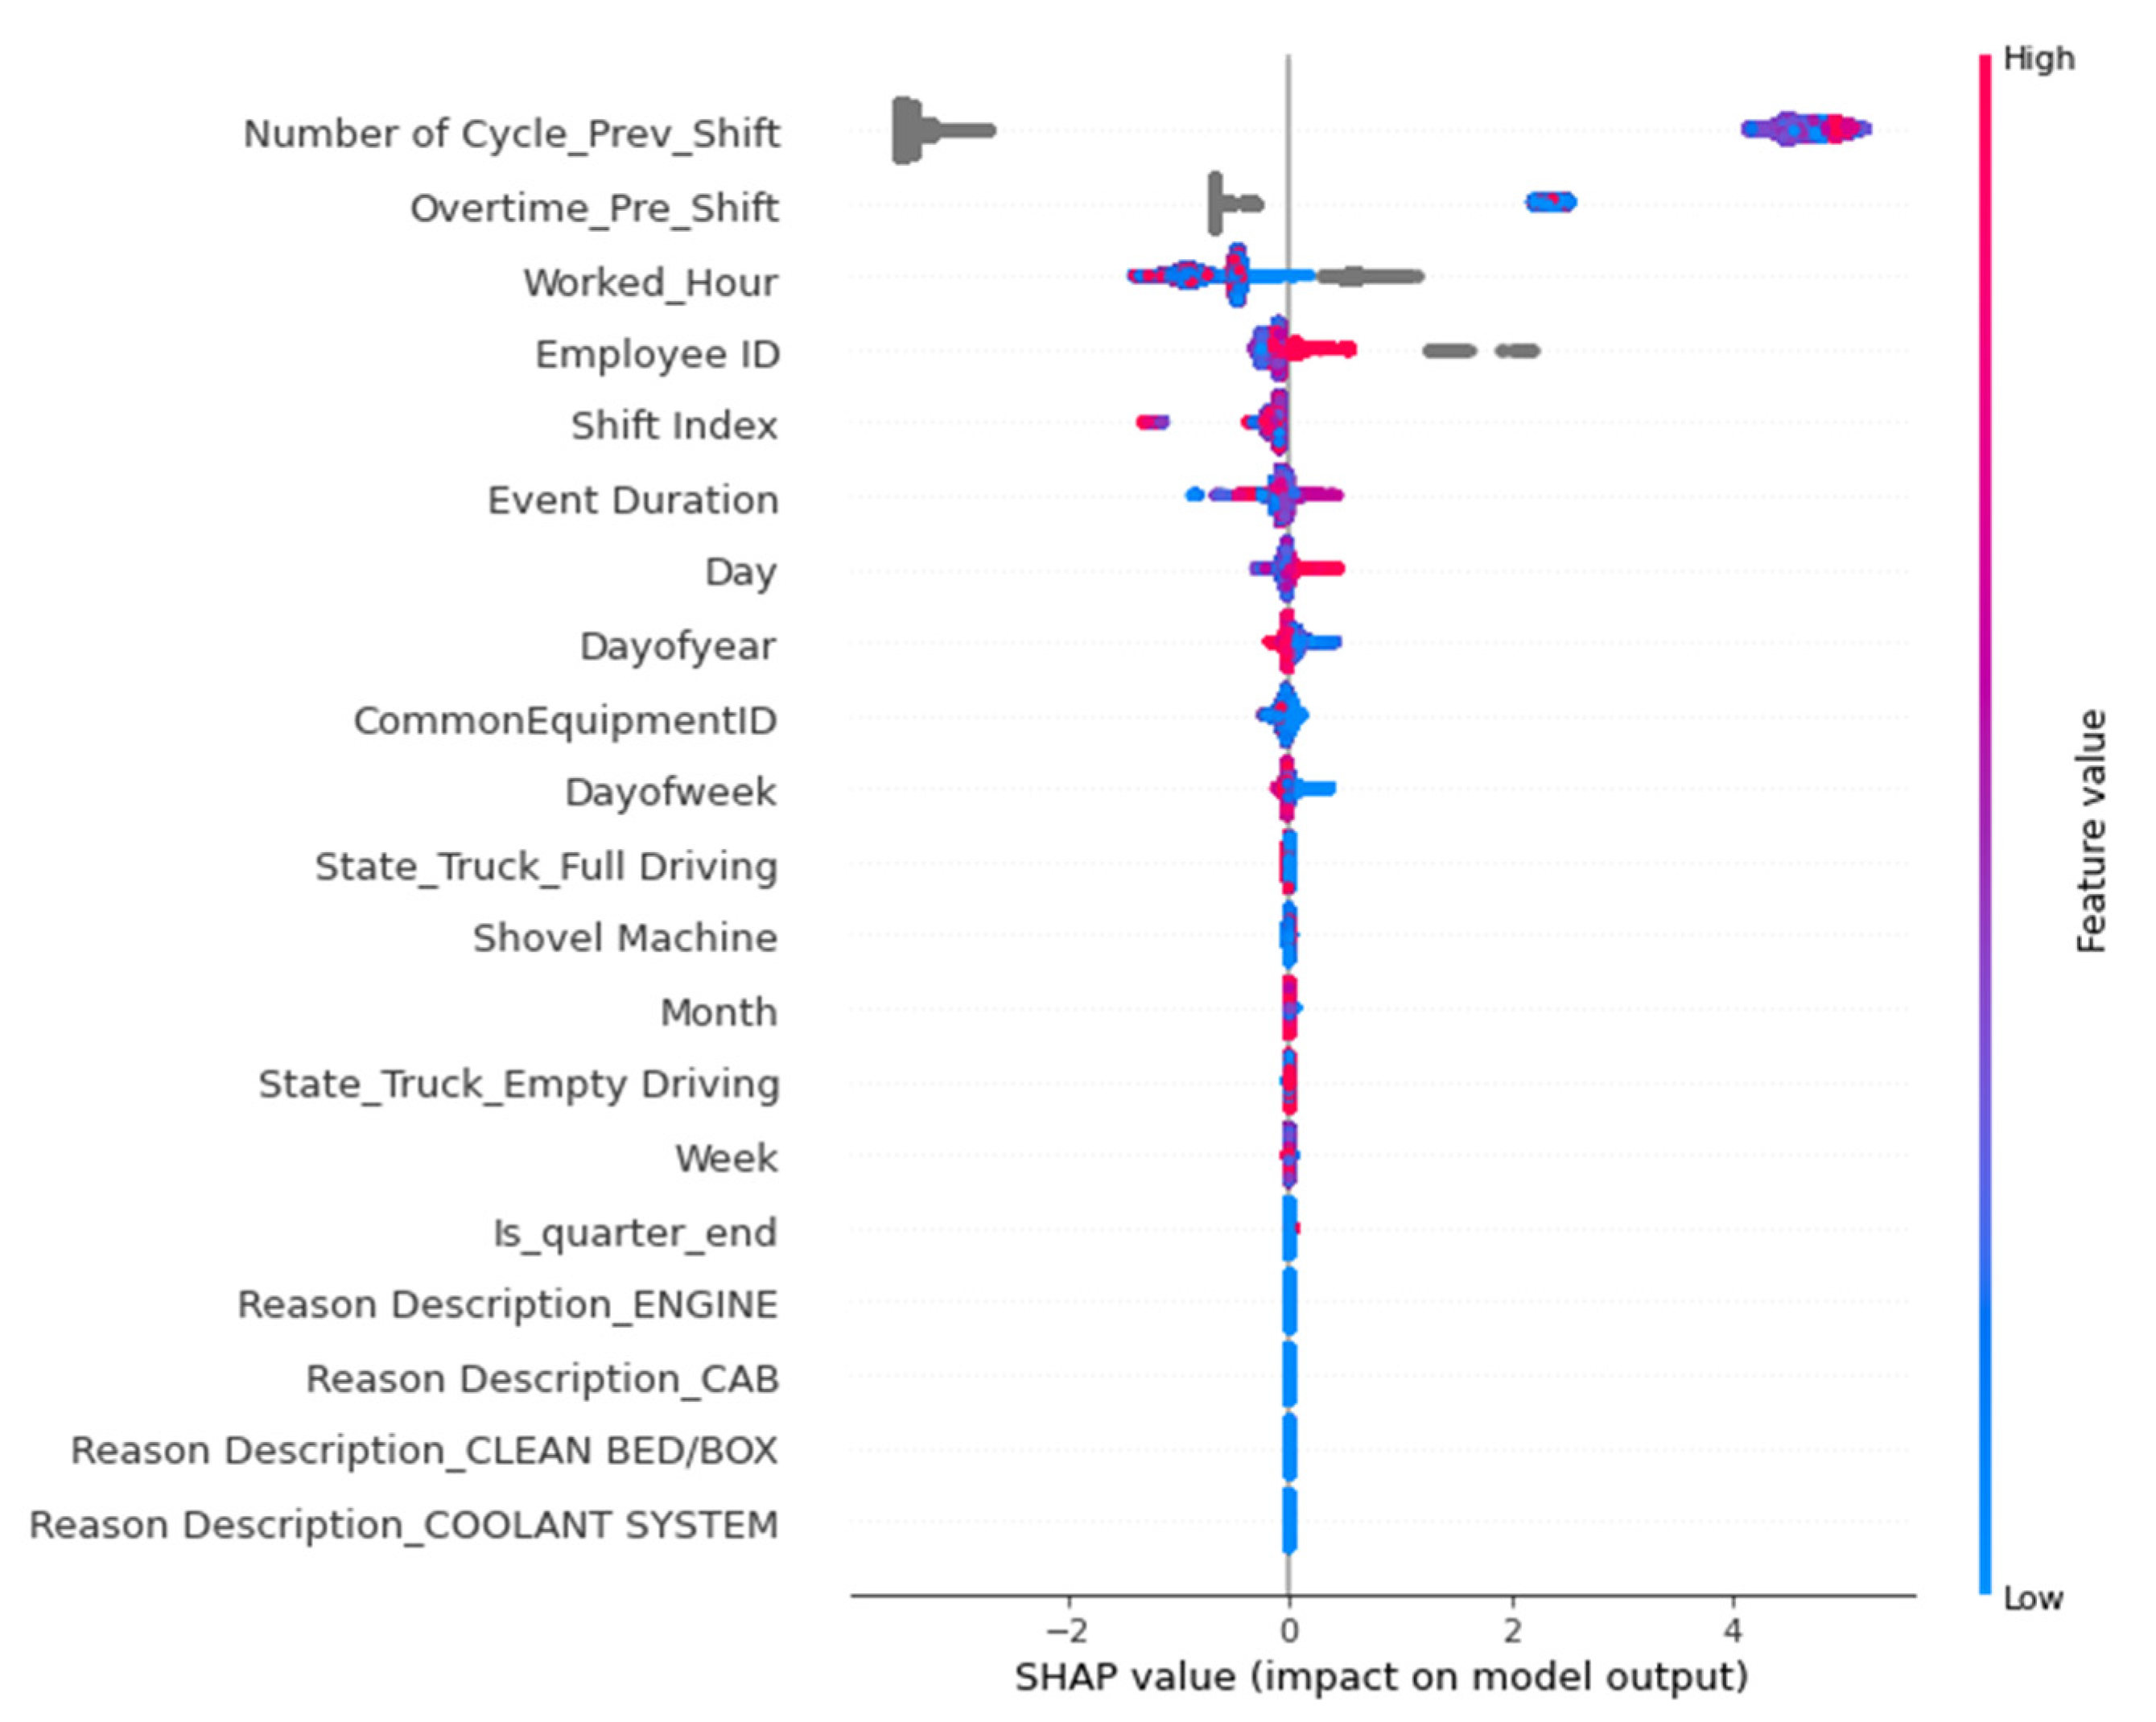
| Time and attendance | 1 | Employee ID |
| 3 | Worked Hour | |
| 5 | Shift index | |
| 6 | Day | |
| 7 | Day of year | |
| 8 | Day of Week | |
| 9 | Overtime Previous Shift | |
| 11 | Is quarter end | |
| 13 | Month | |
| 14 | Week | |
| Fleet management system (production and status) | 2 | Event Duration |
| 4 | Number of Cycle Previous Shift | |
| 10 | Common Equipment ID | |
| 12 | Shovel Machine | |
| 15 | State Truck Full Driving | |
| 16 | State Truck Empty Driving |
Publisher’s Note: MDPI stays neutral with regard to jurisdictional claims in published maps and institutional affiliations. |
© 2022 by the authors. Licensee MDPI, Basel, Switzerland. This article is an open access article distributed under the terms and conditions of the Creative Commons Attribution (CC BY) license (https://creativecommons.org/licenses/by/4.0/).
Share and Cite
Talebi, E.; Rogers, W.P.; Drews, F.A. Environmental and Work Factors That Drive Fatigue of Individual Haul Truck Drivers. Mining 2022, 2, 542-565. https://doi.org/10.3390/mining2030029
Talebi E, Rogers WP, Drews FA. Environmental and Work Factors That Drive Fatigue of Individual Haul Truck Drivers. Mining. 2022; 2(3):542-565. https://doi.org/10.3390/mining2030029
Chicago/Turabian StyleTalebi, Elaheh, W. Pratt Rogers, and Frank A. Drews. 2022. "Environmental and Work Factors That Drive Fatigue of Individual Haul Truck Drivers" Mining 2, no. 3: 542-565. https://doi.org/10.3390/mining2030029
APA StyleTalebi, E., Rogers, W. P., & Drews, F. A. (2022). Environmental and Work Factors That Drive Fatigue of Individual Haul Truck Drivers. Mining, 2(3), 542-565. https://doi.org/10.3390/mining2030029


