Article

Integrating Generative Artificial Intelligence in Clinical Dentistry: Enhancing Diagnosis, Treatment Planning, and Procedural Precision Through Advanced Knowledge Representation and Reasoning

by
Hossam Dawa
1,2,
Arthur Rodriguez Gonzalez Cortes
3,
Carlos Ribeiro
2,
José Neves
1,4 and
Henrique Vicente
4,5,6,*
1
AI & Health—Research Unit in Artificial Intelligence Applied to Health, CESPU University, Rua José António Vidal, 81, 4760-409 Famalicão, Portugal
2
UNIPRO—Oral Pathology and Rehabilitation Research Unit, University Institute of Health Science, CESPU, Avenida Central de Gandra, 1317, 4585-116 Gandra, Portugal
3
Department of Dental Surgery, University of Malta, MSD 2080 Msida, Malta
4
LASI—Associated Laboratory of Intelligent Systems, ALGORITMI Research Centre, University of Minho, Campus de Gualtar, Rua da Universidade, 4710-057 Braga, Portugal
5
Department of Chemistry and Biochemistry, School of Science and Technology, University of Évora, Rua Romão Ramalho, 59, 7000-671 Évora, Portugal
6
LAQV REQUIMTE—Associated Laboratory for Green Chemistry of the Network of Chemistry and Technology, University of Évora, Rua Romão Ramalho, 59, 7000-671 Évora, Portugal
*
Author to whom correspondence should be addressed.
Digital 2025, 5(3), 44; https://doi.org/10.3390/digital5030044
Submission received: 16 July 2025 / Revised: 10 September 2025 / Accepted: 15 September 2025 / Published: 18 September 2025

Abstract

Generative artificial intelligence (GAI) is poised to transform clinical dentistry by enhancing diagnostic accuracy, personalizing treatment planning, and improving procedural precision. This study integrates logic programming and entropy within knowledge representation and reasoning to generate hypotheses, quantify uncertainty, and support clinical decisions. A six-month longitudinal questionnaire was administered to 127 dentists, of whom 119 provided valid responses across four dimensions: current use and knowledge (CUKD), potential applications (PAD), future perspectives (FPD), and challenges and barriers (CBD). Responses, analyzed with both classical statistics and entropy-based measures, revealed significant differences among dimensions (p < 0.01, η2 = 0.14). CUKD, PAD, and FPD all increased steadily over time (baseline means 2.32, 3.06, and 3.27; rising to 3.75, 4.51, and 4.71, respectively), while CBD remained more variable (1.87–3.87). The overall entropic state declined from 0.43 to 0.31 (p = 0.018), reflecting reduced uncertainty. Statistical and entropy-derived trends converged, suggesting growing professional clarity and cautious acceptance of GAI. These findings indicate that, despite persistent concerns, GAI holds promise for advancing adaptive and evidence-driven dental practice.

1. Introduction

Artificial intelligence (AI) is reshaping healthcare, with dentistry increasingly benefiting from its diagnostic, predictive, and decision-support capacities [1,2]. Beyond conventional machine learning, generative AI (GAI) enables not only pattern recognition but also the synthesis of dental images, simulation of treatment outcomes, and support for restorative design [3,4]. Clinical applications are advancing rapidly: FDA-cleared systems such as Pearl Second Opinion®, Overjet Caries Assist, and VideaHealth Dental Assist provide chairside radiograph interpretation; Neocis Yomi® robotic guidance improves implant placement accuracy; and DentalMonitoring offers EU-MDR certified orthodontic remote follow-up [5,6,7,8,9]. These examples underscore that AI in dentistry is transitioning from research to regulated practice.
Despite these advances, real-world adoption remains inconsistent. Survey data show that only 22% of Swiss dentists use AI weekly, with younger practitioners perceiving higher utility [10]. A UK General Dental Council review further concluded that although interest is growing, clinical translation is slowed by the lack of standardization, ethical frameworks, and structured educational programs [11]. Moreover, most published perception studies are cross-sectional, providing snapshots rather than trajectories of evolving attitudes toward AI. A key barrier lies in addressing uncertainty in professional perceptions. Traditional statistical analyses, while robust, may fail to capture the variability, vagueness, and convergence of attitudes over time. Entropy-based reasoning, derived from information theory, can quantify uncertainty in responses, while logic programming (e.g., Prolog) supports formal hypothesis generation and reasoning under rules and constraints [12,13,14,15]. Applied together, these tools allow modeling of adoption scenarios that extend beyond descriptive statistics.
Novelty of this study. This work introduces two contributions:
  • A 6-month longitudinal survey assessing dental professionals’ perceptions of GAI across four dimensions: Current Use and Knowledge (CUKD), Potential Applications (PAD), Future Perspectives (FPD), and Concerns and Barriers (CBD).
  • Methodological triangulation, aligning assumption-guided classical statistics with entropy-based reasoning (exergy, vagueness, Overall Entropic State [OES]) operationalized in Prolog, thereby combining interpretability with rigor.
Research question. How do dental professionals’ perceptions of GAI–across CUKD, PAD, FPD, and CBD, evolve longitudinally, and how does entropy-based modeling align with classical statistical inference?
Hypotheses.
H1. 
PAD and FPD ratings increase significantly over six months.
H2. 
OES decreases, indicating reduced uncertainty and greater clarity of perceptions.
H3. 
Higher baseline CUKD is associated with more favorable PAD and FPD, suggesting experience-related readiness for adoption.
By integrating advanced reasoning frameworks with empirical longitudinal data, this study aims to provide transparent and clinically relevant evidence on the readiness of dental professionals to adopt GAI.

2. A Thermodynamic Logic Framework for Knowledge Representation in Dentistry

Entropy, originally a thermodynamic construct, has been increasingly applied to quantify uncertainty in decision-making systems, including healthcare [12,13]. In the context of dental informatics, entropy can serve as a heuristic measure of variability and disorder in professional perceptions or clinical processes. Within this framework, three derivative concepts help operationalize uncertainty:
  • Exergy, the portion of available information that can be effectively used for reasoning and decision-making.
  • Vagueness, the ambiguity arising when it is unclear whether available information has been adequately utilized.
  • Anergy, the residual potential (unused information) that remains inaccessible to reasoning processes.
These constructs, adapted from thermodynamic theory, provide useful metaphors and computational tools to model the evolution of clarity versus uncertainty in dental professionals’ perceptions of GAI. An Overall Entropic State (OES) ranging from 0 (full clarity/order) to 1 (complete uncertainty/disorder) is used to track perceptional convergence across timepoints.
To implement this framework, we use logic programming (LP), a symbolic AI method that encodes knowledge as formal rules and exceptions [14,15,16]. LP is particularly suited for dentistry because it can represent complex relationships between symptoms, diagnoses, treatments, and professional perceptions in a structured and transparent manner. By combining LP with entropy-based measures, we encourage the reasoning system to not only prioritize the most likely scenarios but also to consider less probable, edge-case outcomes—critical when evaluating innovation adoption in healthcare.
The proof-theoretic formulation we employ allows for the incorporation of exceptions (abducibles) and constraints (invariants), ensuring that the reasoning system remains resilient even under incomplete or uncertain information. This hybridization enables GAI models to:
  • Quantify uncertainty in professionals’ perceptions through entropy and exergy metrics.
  • Generate hypotheses about adoption scenarios under varying conditions.
  • Align symbolic reasoning with statistical inference, bridging abstract computational models and clinically meaningful insights.
In this study, we apply this entropy-logic framework alongside assumption-guided classical statistics (normality testing, ANOVA/Kruskal–Wallis, effect sizes) to evaluate whether dental professionals’ perceptions of GAI converge toward greater clarity over a six-month period. This dual approach, triangulating statistical rigor with symbolic reasoning, offers a novel and transparent method to assess readiness for adopting advanced AI tools in clinical dentistry.

3. Materials and Methods

This section describes the study design, data collection, participants, questionnaire validation, analytical methods, and ethical considerations. The framework was developed to maximize transparency, reproducibility, and clinical interpretability.

3.1. Study Design

We conducted a six-month longitudinal survey study to investigate how dental professionals perceive generative artificial intelligence (GAI). Perceptions were measured across four dimensions:
  • Current use and knowledge dimension
  • Potential applications dimension
  • Future perspectives dimension
  • Challenges and barriers dimension
Each participant completed the same questionnaire monthly. This design allowed us to monitor temporal shifts in perceptions and uncertainty.
The novelty of this study lies in its methodological triangulation: classical statistics were combined with entropy-based reasoning (exergy, vagueness, anergy, overall entropic state (OES)) within a logic-programming environment [12,13,14,15,16]. This approach allowed us to assess not only changes in mean ratings but also the clarity versus uncertainty underlying respondents’ attitudes toward GAI.

3.2. Questionnaire Development and Validation

The 16-item questionnaire (Table 1) was developed from prior literature on technology acceptance in healthcare and dentistry [17,18,19]. Items were distributed across the four predefined dimensions (CUKD: 2 items, PAD: 5 items, FPD: 6 items, CBD: 3 items).
Responses were collected on a five-point Likert scale (1 = not at all important, 5 = very important). To capture the direction of change, participants also indicated whether their opinion was increasing or decreasing over time. These trajectories were encoded in an extended nine-point Likert format, preserving both intensity and trend.

Reliability Testing

Although no pilot study was performed, we assessed internal consistency at baseline (Month 0, n = 119). Cronbach’s α was excellent for PAD (α = 0.975), FPD (α = 0.969), and CBD (α = 0.957). For the two-item CUKD scale, inter-item correlation was weak (r = 0.08, Spearman–Brown = 0.149). Because CUKD intentionally measured two distinct (i.e., constructs, ”current use” and “knowledge” we retained it descriptively but interpreted results cautiously (Table 2). This provides evidence of validity and reliability for the questionnaire in line with accepted psychometric standards [20].
Internal consistency was assessed at baseline (month 0, n = 119). Cronbach’s α: PAD = 0.975, FPD = 0.969, CBD = 0.957. For the two-item CUKD scale, inter-item correlation was r = 0.08 with Spearman–Brown reliability = 0.149; because CUKD intentionally spans use and knowledge, we retained it to capture breadth but interpreted its differences cautiously. Item–total correlations and α estimates and the two-item diagnostics are provided in Supplementary Materials, Table S1 and Table S2, respectively.

3.3. Participants

A total of 127 licensed dentists working in clinical and academic settings in Portugal were recruited. After excluding incomplete responses, 119 valid cases were analyzed.
  • Age: 25–65 years (mean 39.2 ± 9.5)
  • Gender: 56.7% male, 43.3% female
  • Experience: 22% had 1–5 years, 33.9% 6–10 years, 25.2% 11–15 years, and 18.9% >16 years of practice
  • Clinical context: 51.2% general dentistry, 27.6% specialized practice, 9.4% academic/research, 11.8% other (e.g., consultancy)
Inclusion criteria: active practice ≥1 year and informed consent. Exclusion criteria: incomplete or inconsistent data.

3.4. Data Processing and Analysis

3.4.1. Statistical Framework

  • Normality was assessed with Shapiro–Wilk.
  • Homogeneity of variance with Levene’s test.
  • Depending on assumptions, we used one-way ANOVA with Tukey’s HSD (parametric) or Kruskal–Wallis with Dunn’s correction (non-parametric).
  • Effect sizes were reported as η2 (ANOVA) or r (non-parametric).
  • Analyses were performed in SPSS v27 and GraphPad Prism v9.
An a priori power analysis (G*Power 3.1) indicated ≥100 participants were needed to detect medium effect sizes (Cohen’s d = 0.5, power = 0.80, α = 0.05).

3.4.2. Entropy-Based Reasoning

In parallel, responses were mapped into exergy (useful/stable perception), vagueness (uncertainty), and anergy (unused potential). From these, an Overall Entropic State (OES) was calculated [12,13]. Trends in entropy were then compared with statistical results to evaluate triangulation and convergence of evidence.
Reasoning was implemented in a Prolog-based system to simulate adoption scenarios and explore best-case versus worst-case trajectories [14,15,16].

3.4.3. Randomization and Blinding

Question order was randomized in each administration. Data were anonymized and pseudonymized with participant codes. Statistical analyses were conducted by an independent investigator blinded to identities and affiliations.

3.5. Ethical Considerations

All participants received study information and provided written informed consent. Ethical approval was obtained from the Ethics Committee of CESPU University (protocol CE/IUCS/CESPU-13/22, approved 21 April 2022). Data were anonymized, securely stored, and handled in compliance with GDPR.
The questionnaire was answered anonymously, and all participants agreed to participate over a period of six months by completing the questionnaire monthly. The participants received a secret personal code when they first answered the questionnaire, enabling researchers to identify responses from the same participant across multiple instances.

4. Results

4.1. Descriptive Statistics

Perceptions of GAI were evaluated across four dimensions, i.e., CUKD, PAD, FPD, and CBD.
  • CUKD scores increased steadily from a baseline mean of 2.78 ± 0.74 to 3.40 ± 0.36 at month 4, with progressively narrower confidence intervals, indicating reduced variability over time (Table 3).
  • PAD received the most favorable ratings throughout, rising from 3.89 ± 0.67 at baseline to 4.10 ± 0.62 at month 4 (Table 4).
  • FPD also showed upward trends (3.55 ± 0.59 → 3.87 ± 0.51), with reduced dispersion (Table 5).
  • CBD was the most variable dimension, with wider standard deviations (0.69–0.85), reflecting heterogeneity in professional concerns (Table 6).
  • The full distributions of responses for each dimension and month are illustrated in Supplementary Materials, Figure S1.

4.2. Statistical Comparisons

Assumptions of normality and homogeneity of variances were violated (Shapiro–Wilk p < 0.001; Levene’s test p = 0.0167). Non-parametric testing was therefore applied (Table 7).
  • Kruskal–Wallis tests showed significant differences across the four dimensions at month 4 (H = 30.51, p < 0.001).
  • Post-hoc analysis indicated that PAD and FPD were rated significantly higher than CUKD (p < 0.01).
  • CBD differed significantly from both PAD and FPD, with the largest effect size (r = 0.36).
Table 7. Statistical test results.
TestStatisticp-Value
Shapiro–Wilk (current use and knowledge dimension)0.64720.0
Shapiro–Wilk (potential applications dimension)0.59370.0
Shapiro–Wilk (future perspectives dimension)0.72640.0
Shapiro–Wilk (challenges and barriers dimension)0.77180.0
Levene’s Test3.44440.0167
One-way ANOVA385.76270.0
Kruskal–Wallis360.08090.0

4.3. Longitudinal Trends

Figure 1 displays temporal dynamics across all dimensions. The analysis of Figure 1 shows that:
  • PAD and FPD consistently maintained the highest mean ratings with tight confidence intervals.
  • CUKD demonstrated the steepest increase between months 1 and 3, suggesting growing familiarity with AI concepts over time.
  • CBD showed fluctuating variability, highlighting divergent views about barriers such as cost, workflow integration, and patient consent.
Figure 1. Perception scores by dimension (current use and knowledge dimension (CUKD), potential applications dimension (PAD), future perspectives dimension (FPD) and challenges and barriers dimension (CBD)) across study months.
Digital 05 00044 g001

4.4. Exploratory Subgroup Analysis

Using baseline CUKD as a proxy for prior AI exposure:
  • Participants in the upper quartile (≥75th percentile) scored significantly higher on PAD (p = 0.0008, r = 0.298) and FPD (p = 0.0001, r = 0.348) compared to those in the lower quartile (≤25th percentile).
  • No significant differences were observed for CBD (p = 0.350).
These findings suggest that prior exposure to AI is associated with more optimism about its potential and future role, but not with reduced concerns about barriers.

4.5. Entropy-Based Analysis

The data processing employs LP for KRR, embedding and converting data in accordance with the Laws of Thermodynamics [21]. The participants’ responses were collected and analyzed on an individual basis. Figure S2 (available within the Supplementary Materials) displays participant 1’s responses at month 0, while Table 8 presents the correspondent responses in terms of the extended Likert scale. For example, for the future perspectives dimension at month 0 the response to Q8 was not at all important (1), with no indicated trend. This response should be interpreted on the positive scale, ranging from not at all important (1) to very important (5), as it may remain stable or increase over time. For Q9 the I don’t know option was selected, indicating uncertainty. In this case, while the precise values for exergy, vagueness, and anergy cannot be determined, their range is known to lie between 0 and 1 [21,22]. For Q10 and Q11 participant one marked the option marginally important (3) and indicates an increasing tendency in his/her response (Figure S2). Therefore, this response should be evaluated on a scale from not at all important (1) to very important (5), with important representing the best-case scenario (BCS) and marginally important as the worst-case scenario (WCS), as illustrated in Table 8. For Q12, the situation mirrors the previous one, with very important representing the BCS and important representing the WCS. Conversely, for Q13 participant one marked the option slightly important (2) and indicates a decreasing tendency in his/her response (Figure S2). Therefore, this response should be evaluated on a scale from very important (5) to not at all important (1), with slightly important representing the BCS and not at all important representing the WCS, as illustrated in Table 8.
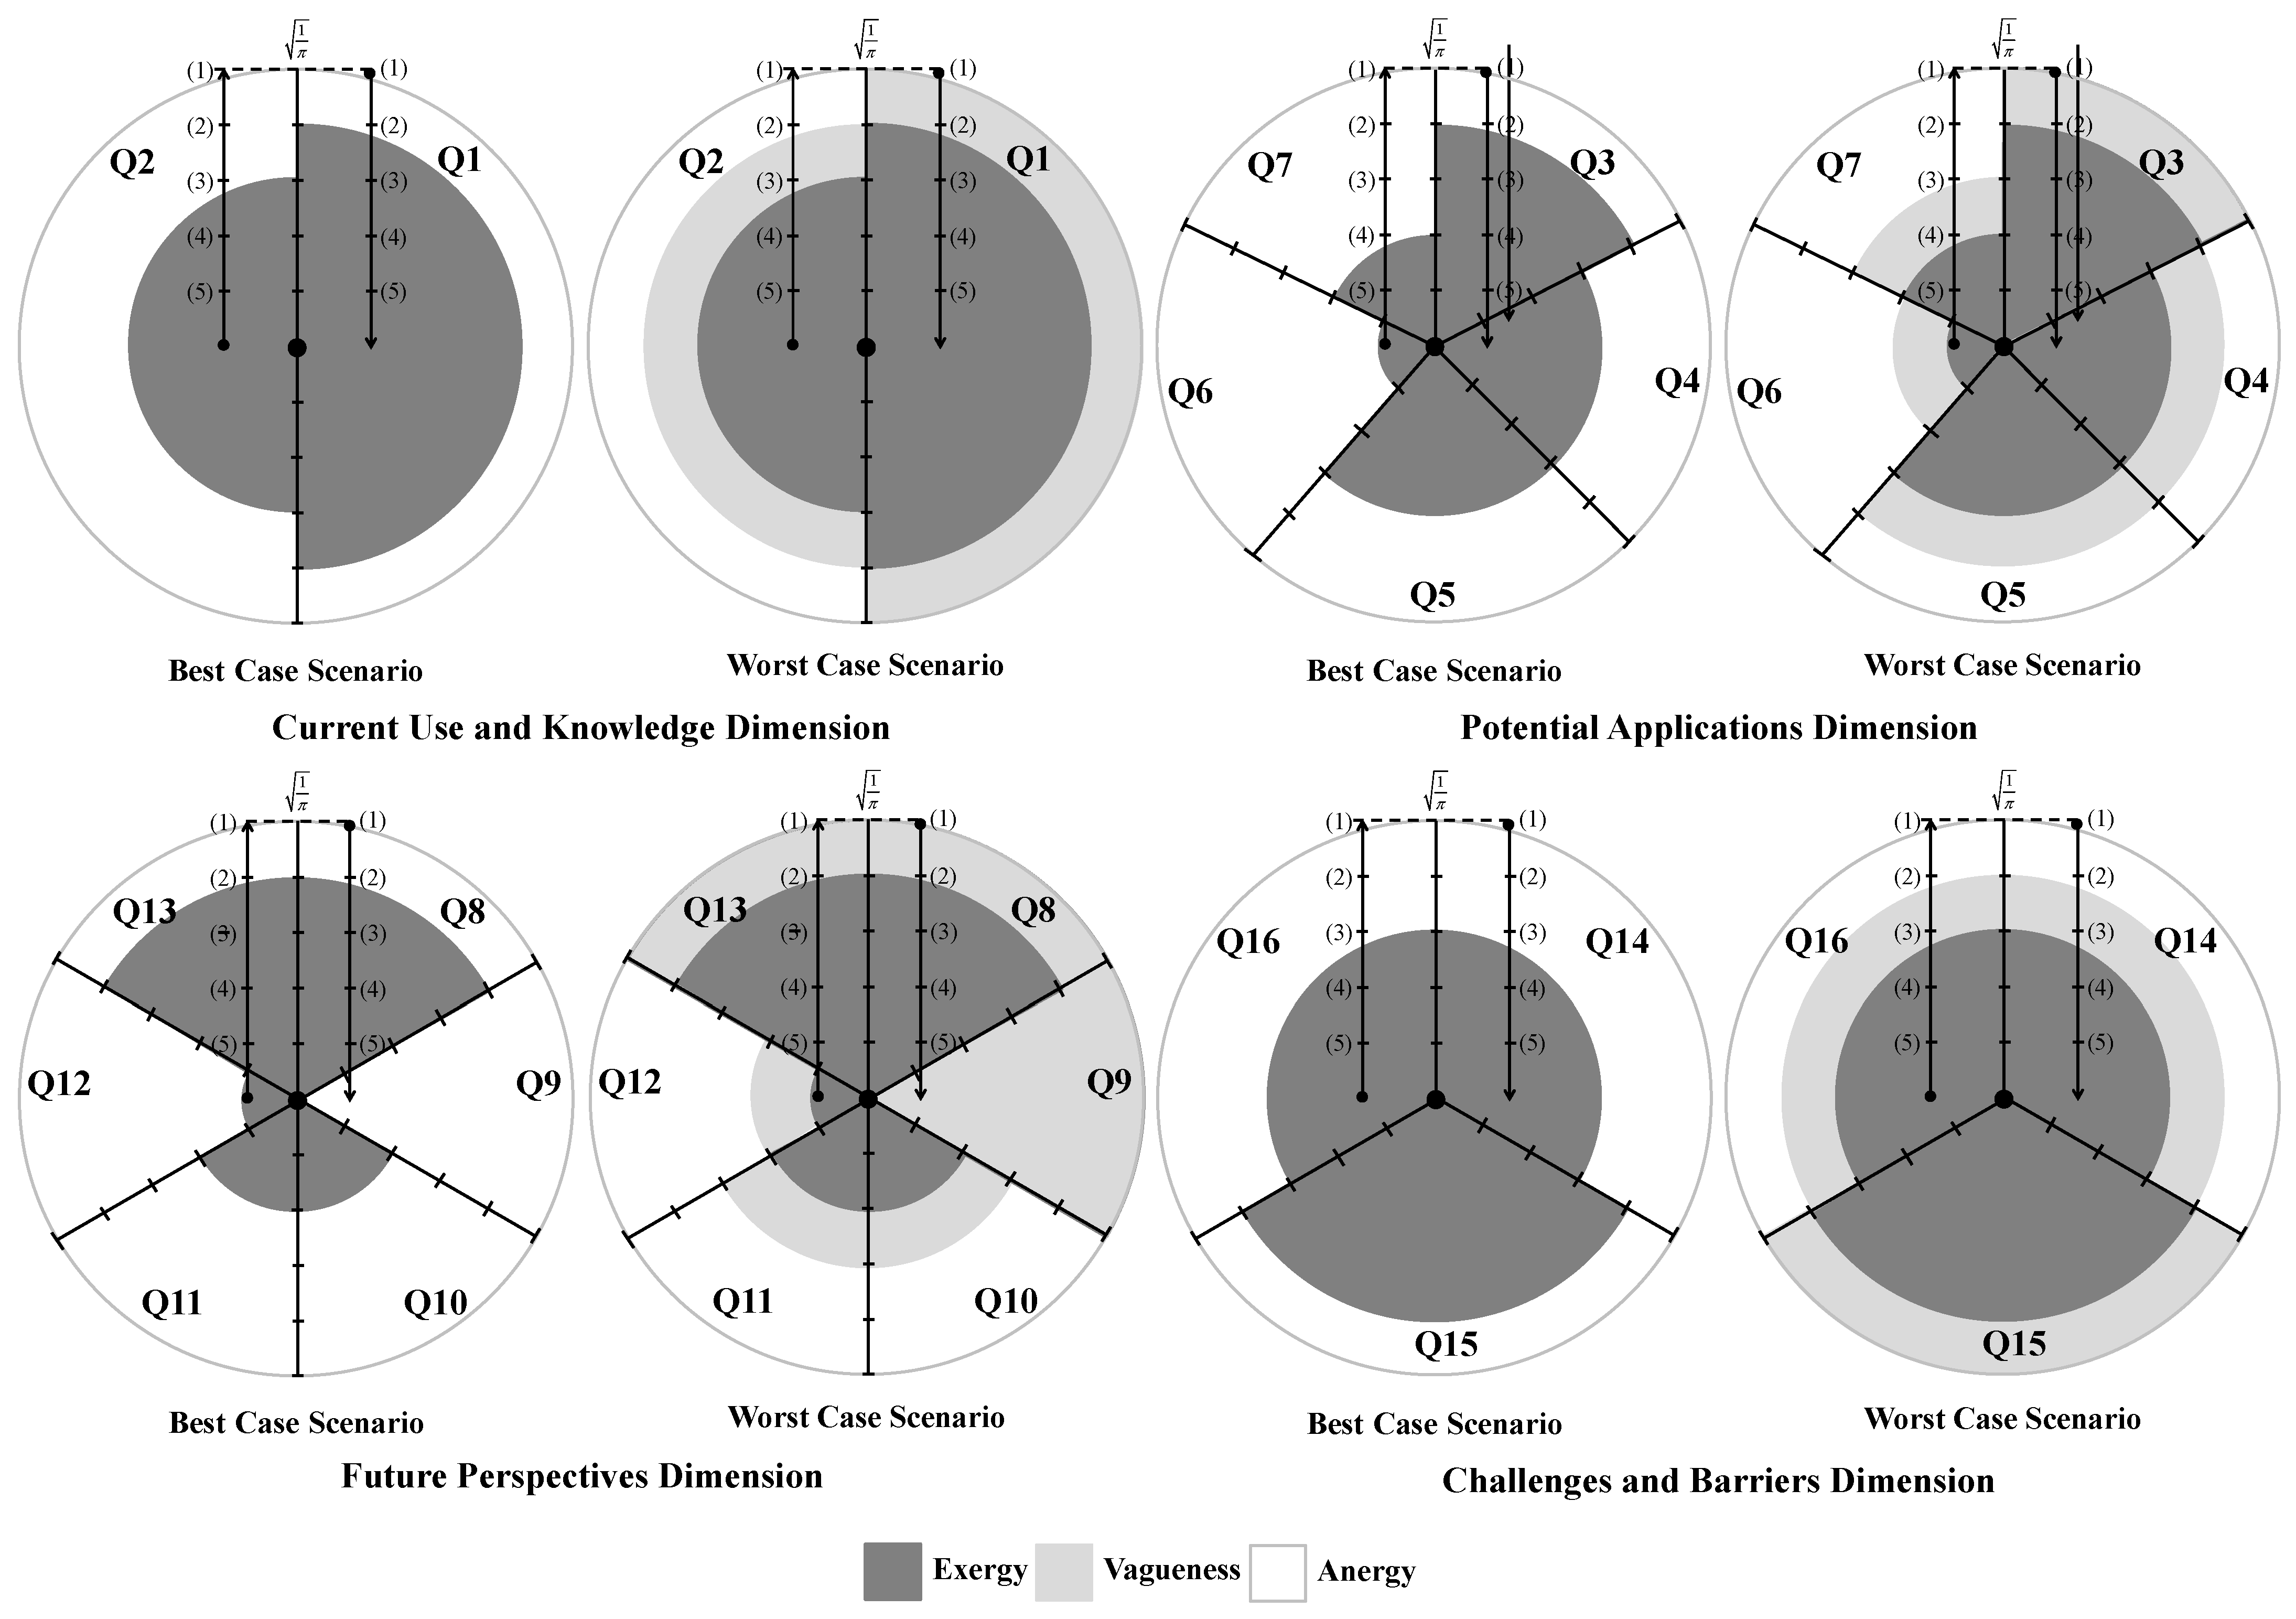
Figure 2 displays participant one’s month 0 responses visually. The darkest regions correspond to exergy, signifying high-energy or useful energy states. The grey portions denote vagueness, indicating uncertainty or undefined energy levels, and the white areas represent anergy, corresponding to unavailable energy to perform work [21,22,23]. Due to the symmetry of the nine-point Likert scale, it can be read in two directions, i.e., from the left toward the center, indicating a decline in participant responses, or from the center toward the right, indicating improvement in those responses. Thus, the axis labels in Figure 2 should be understood as follows:
  • Bottom to top (from the most positive to the least positive response): this signifies increasing entropy and a corresponding decline in system performance;
  • Top to bottom (from the least positive to the most positive response): this reflects decreasing entropy and an enhancement in system performance.
Figure 2. Diagrammatic representation of the participant one responses to questions Q1–Q16, grouped by dimensions, at month 0, in the best-case and worst-case scenarios. (1), (2), (3), (4), and (5) denote, respectively, not at all important, slightly important, marginally important, important, and very important. The dark, grey, and white colored areas correspond to exergy, vagueness, and anergy.
Digital 05 00044 g002
The colored zones in Figure 2 correspond to circular regions. The darkest areas denote exergy, while the gray and white annular regions represent vagueness and anergy, respectively. Responses are plotted along a radial axis scaled to 1 / π and divided into five equal intervals, corresponding to radii of 1 5 1 π ,   2 5 1 π , ,   5 5 1 π . Exergy (the dark regions) is quantified by applying the standard area formula for a circle (Equation (1)), using the appropriate radius values.
A = 1 Q π r 2
where Q represents the number of questions per dimension (i.e., Q = 2 ,   5 ,   6 , and 3 for the CUKD, PAD, FPD and CBD, respectively), and r denotes the radius corresponding to the most positive response.
In the case of vagueness (grey zones), only the most positive response is considered in the BCS, resulting in no vagueness, i.e., zero. In the WCS, both the highest and lowest responses are included, forming a ring-shaped region. Its area is calculated using the annulus formula:
A = 1 Q π R 2 r 2
where Q represents the number of questions per dimension, R denotes the outer circle’s radius and r denotes that of the inner circle. Consequently, r corresponds to the radius linked to the most positive response, while R corresponds to that associated with the least positive response.
In the case of anergy (white zones), the relevant portion also forms a ring-like region. The outer radius R is fixed at 1 / π . In the BCS, the inner radius r matches the radius associated with the most favorable response, whereas under the WCS, r corresponds to the radius of the least favorable response. The area of this region is then determined using the annulus formula (Equation (2)).

4.5.1. Assessing the Entropic State of Participants for the Best-Case Scenario

The responses of participant one to FPD at month 0 will be used to exemplify the valuation of the colored regions present in Figure 2 for the BCS. Therefore, for this dimension, one may have:
  • In questions Q8 and Q13, the options slightly important and not at all important were considered (Table 8), so r = 4 5 1 π   and R = 5 5 1 π (Figure 2);
  • In question Q9, the option I don’t know was selected corresponding to a vague situation (Table 8), so r = 0 ,   and R = 1 π (Figure 2); and
  • In questions Q10 and Q11, the options important and marginally important were considered (Table 8), so r = 2 5 1 π   and R = 3 5 1 π (Figure 2).
  • In question Q12, the options very important and important were considered (Table 8), so r = 1 5 1 π   and R = 2 5 1 π (Figure 2).
The quantification of the colored regions presented in Figure 2 for FPD, at month 0, for both scales (ranging from very important (5) to not at all important (1) and vice versa) are shown in Table 9 for the BCS.
Hence, for participant one, the global values of exergy, vagueness, and anergy regarding FPD in the BCS are computed using the values from Table 9 on the scale from very important (5) to not at all important (1), as follows:
e x e r g y 5 1 = e x e r g y 5 1 S 9 + e x e r g y 5 1 S 13 = 0 + 0.107 = 0.107
v a g u e n e s s 5 1 = v a g u e n e s s 5 1 S 9 + v a g u e n e s s 5 1 S 13 = 0
a n e r g y 5 1 = a n e r g y 5 1 S 9 + a n e r g y 5 1 S 13 = 0.167 + 0.060 = 0.227
while, for the scale from not at all important (1) to very important (5), the values are:
e x e r g y 1 5 = e x e r g y 1 5 S 8 + e x e r g y 1 5 S 10 + e x e r g y 1 5 S 11 + e x e r g y 1 5 S 12 = 0.107 + 0.027 + 0.027 + 0.007 = 0.168
v a g u e n e s s 1 5 = v a g u e n e s s 1 5 S 8 + v a g u e n e s s 1 5 S 10 + v a g u e n e s s 1 5 S 11 + v a g u e n e s s 1 5 S 12 = 0
a n e r g y 1 5 = a n e r g y 1 5 S 8 + a n e r g y 1 5 S 10 + a n e r g y 1 5 S 11 + a n e r g y 1 5 S 12 = 0.060 + 0.140 + 0.140 + 0.160 = 0.500
Using the same framework described earlier, the values of exergy, vagueness, and anergy can be determined for each participant. For participant one, the corresponding values related to each dimension examined (i.e., CUKD, PAD, FPD, and CBD) are displayed in Table 10 for the BCS.

4.5.2. Assessing the Entropic State of Participants for the Worst-Case Scenario

For the WCS, computing the areas highlighted in Figure 2 requires taking into account both the most and least positive responses. Accordingly, for participant one, the numerical values corresponding to the areas highlighted in Figure 2 for CUKD at month 0, for both rating scales (from very important (5) to not at all important (1), and vice versa), are shown in Table 11. Table 12 presents the exergy, vagueness, and anergy values for each dimension analyzed (i.e., CUKD, PAD, FPD, and CBD).

4.5.3. Case Study’s Formal Description

Logic-based programming is an approach that utilizes deductive reasoning to address problems, focusing on generating support for a specific hypothesis. This approach forms the basis for a symbolic interpretation of the entropic state (ES), defined as the sum of exergy and vagueness E S = e x e r g y + v a g u e n e s s , and generates a multi-valued logic system in which truth values range from 0 to 1 [21,22]. Thus, the formal representation of the participants’ responses applying LP can now be introduced. Program 1 refer to participant one’s responses grounded on the data figured in Table 10 concerning the BCS, whereas Program 2 offers the equivalent formulation for the WCS, utilizing the information found in Table 12.
Program 1.
The formal representation of the participant one’s responses for the best-case scenario at month 0, applying logic programming.
{
/* The sentences below state that the extending of predicates cukd5–1, cukd1–5, pad5–1, pad1–5, fpd5–1, fpd1–5, cbd1–5, and cbd1–5, are based on explicitly specified clauses and those that cannot be dropped */
  {
        ¬   c u k d 5 1 e x e r g y , v a g u e n e s s , a n e r g y
n o t   c u k d 5 1 e x e r g y , v a g u e n e s s , a n e r g y ,                                
n o t   e x c e p t i o n c u k d 5 1 e x e r g y , v a g u e n e s s , a n e r g y
        c u k d 5 1 0.320 , 0 ,   0.180 .
  }
  {
        ¬   c u k d 1 5 e x e r g y , v a g u e n e s s , a n e r g y
n o t   c u k d 1 5 e x e r g y , v a g u e n e s s , a n e r g y ,                                    
n o t   e x c e p t i o n c u k d 1 5 e x e r g y , v a g u e n e s s , a n e r g y  
        c u k d 1 5 0.180 , 0 ,   0.320 .
  }
  {
        ¬   p a d 5 1 e x e r g y , v a g u e n e s s , a n e r g y
n o t   p a d 5 1 e x e r g y , v a g u e n e s s , a n e r g y ,                                  
n o t   e x c e p t i o n p a d 5 1 e x e r g y , v a g u e n e s s , a n e r g y
        p a d 5 1 0.072 , 0 ,   0.128 .
  }
  {
        ¬   p a d 1 5 e x e r g y , v a g u e n e s s , a n e r g y
n o t   p a d 1 5 e x e r g y , v a g u e n e s s , a n e r g y ,                                    
n o t   e x c e p t i o n p a d 1 5 e x e r g y , v a g u e n e s s , a n e r g y  
        p a d 1 5 0.240 , 0 ,   0.560 .
  }
  {
        ¬   f p d 5 1 e x e r g y , v a g u e n e s s , a n e r g y
n o t   f p d 5 1 e x e r g y , v a g u e n e s s , a n e r g y ,                                  
n o t   e x c e p t i o n f p d 5 1 e x e r g y , v a g u e n e s s , a n e r g y
        f p d 5 1 0.107 , 0 ,   0.227 .
  }
  {
        ¬   f p d 1 5 e x e r g y , v a g u e n e s s , a n e r g y
n o t   f p d 1 5 e x e r g y , v a g u e n e s s , a n e r g y ,                                  
n o t   e x c e p t i o n f p d 1 5 e x e r g y , v a g u e n e s s , a n e r g y
        f p d 1 5 0.168 , 0 ,   0.500 .
  }
  {
        ¬   c b d 5 1 e x e r g y , v a g u e n e s s , a n e r g y          
n o t   c b d 5 1 e x e r g y , v a g u e n e s s , a n e r g y ,                                    
n o t   e x c e p t i o n c b d 5 1 e x e r g y , v a g u e n e s s , a n e r g y  
        c b d 5 1 0.120 , 0 ,   0.213 .
  }
  {
        ¬   c b d 1 5 e x e r g y , v a g u e n e s s , a n e r g y
n o t   c b d 1 5 e x e r g y , v a g u e n e s s , a n e r g y ,                                  
n o t   e x c e p t i o n c b d 1 5 e x e r g y , v a g u e n e s s , a n e r g y
        c b d 1 5 0.333 , 0 ,   0.333 .
  }
}
Program 2.
The formal representation of the participant one’s responses for the worst-case scenario at month 0, applying logic programming.
{
/* The sentences below state that the extending of predicates cukd5–1, cukd1–5, pad5–1, pad1–5, fpd5–1, fpd1–5, cbd1–5, and cbd1–5, are based on explicitly specified clauses and those that cannot be dropped */
  {
        ¬   c u k d 5 1 E X , V A , A N n o t   c u k d 5 1 E X , V A , A N ,                          
n o t   e x c e p t i o n c u k d 5 1 E X , V A , A N                                                                                            
        c u k d 5 1 0.320 , 0.180 ,   0 .
  }
  {
        ¬   c u k d 1 5 E X , V A , A N n o t   c u k d 1 5 E X , V A , A N ,                          
n o t   e x c e p t i o n c u k d 1 5 E X , V A , A N                                                                                            
        c u k d 1 5 0.180 , 0.140 ,   0.180 .
  }
  {
        ¬   p a d 5 1 E X , V A , A N n o t   p a d 5 1 E X , V A , A N ,                          
n o t   e x c e p t i o n p a d 5 1 E X , V A , A N                                                                                                  
        p a d 5 1 0.072 , 0.056 ,   0.072 .
}  
  {
        ¬   p a d 1 5 E X , V A , A N n o t   p a d 1 5 E X , V A , A N ,                          
n o t   e x c e p t i o n p a d 1 5 E X , V A , A N                                                                                                  
        p a d 1 5 0.240 , 0.192 ,   0.368 .
  }
  {
        ¬   f p d 5 1 E X , V A , A N n o t   f p d 5 1 E X , V A , A N ,                          
n o t   e x c e p t i o n f p d 5 1 E X , V A , A N                                                                                                  
        f p d 5 1 0.107 , 0.227 ,   0 .
  }
  {
        ¬   f p d 1 5 E X , V A , A N n o t   f p d 1 5 E X , V A , A N ,                          
n o t   e x c e p t i o n f p d 1 5 E X , V A , A N                                                                                                  
        f p d 1 5 0.168 , 0.146 ,   0.354 .
  }
  {
        ¬   c b d 5 1 E X , V A , A N n o t   c b d 5 1 E X , V A , A N ,                          
n o t   e x c e p t i o n c b d 5 1 E X , V A , A N                                                                                                    
        c b d 5 1 0.120 , 0.093 ,   0.120 .
  }
  {
        ¬   p c b d 1 5 E X , V A , A N n o t   c b d 1 5 E X , V A , A N ,                          
n o t   e x c e p t i o n c b d 1 5 E X , V A , A N                                                                                                
        c b d 1 5 0.333 , 0.213 ,   0.120 .
  }
}
As a result, the ES of the participants in the BCS can be assessed based on their responses collected over a six-month period. The evolution of the participants’ ES is determined by proving theorems 1 and 2.
Theorem 1.
Scale (5) to (1).
p r e d i c a t e 1 5 1 e x e r g y , v a g u e n e s s , a n e r g y ,
, p r e d i c a t e j 5 1 e x e r g y , v a g u e n e s s , a n e r g y
c u k d 5 1 e x e r g y , v a g u e n e s s , a n e r g y , p a d 5 1 e x e r g y , v a g u e n e s s , a n e r g y ,
f p d 5 1 e x e r g y , v a g u e n e s s , a n e r g y , c b d 5 1 e x e r g y , v a g u e n e s s , a n e r g y .
Theorem 2.
Scale (1) to (5).
p r e d i c a t e 1 1 5 e x e r g y , v a g u e n e s s , a n e r g y ,
, p r e d i c a t e j 1 5 e x e r g y , v a g u e n e s s , a n e r g y
c u k d 1 5 e x e r g y , v a g u e n e s s , a n e r g y , p a d 1 5 e x e r g y , v a g u e n e s s , a n e r g y ,
f p d 1 5 e x e r g y , v a g u e n e s s , a n e r g y , c b d 1 5 e x e r g y , v a g u e n e s s , a n e r g y .
As shown in the timeline present in Figure 3 and Program 1, it is possible to track and anticipate the evolution of the participants’ ES [21,22]. Predictive analysis based on mathematical proof enables the examination of all possible combinations of terms or clauses associated with the extensions of the predicates CUKD, PAD, FPD, and CBD. The total number of these combinations can be determined using Equation (3):
C 1 P r e d i c a t e s e x t e n s i o n s + C 2 P r e d i c a t e s e x t e n s i o n s + + C P r e d i c a t e s e x t e n s i o n s   c a r d i n a l i t y P r e d i c a t e s e x t e n s i o n s
where C P r e d i c a t e s e x t e n s i o n s c a r d i n a l i t y P r e d i c a t e s e x t e n s i o n s is the predicate extension combination subset.
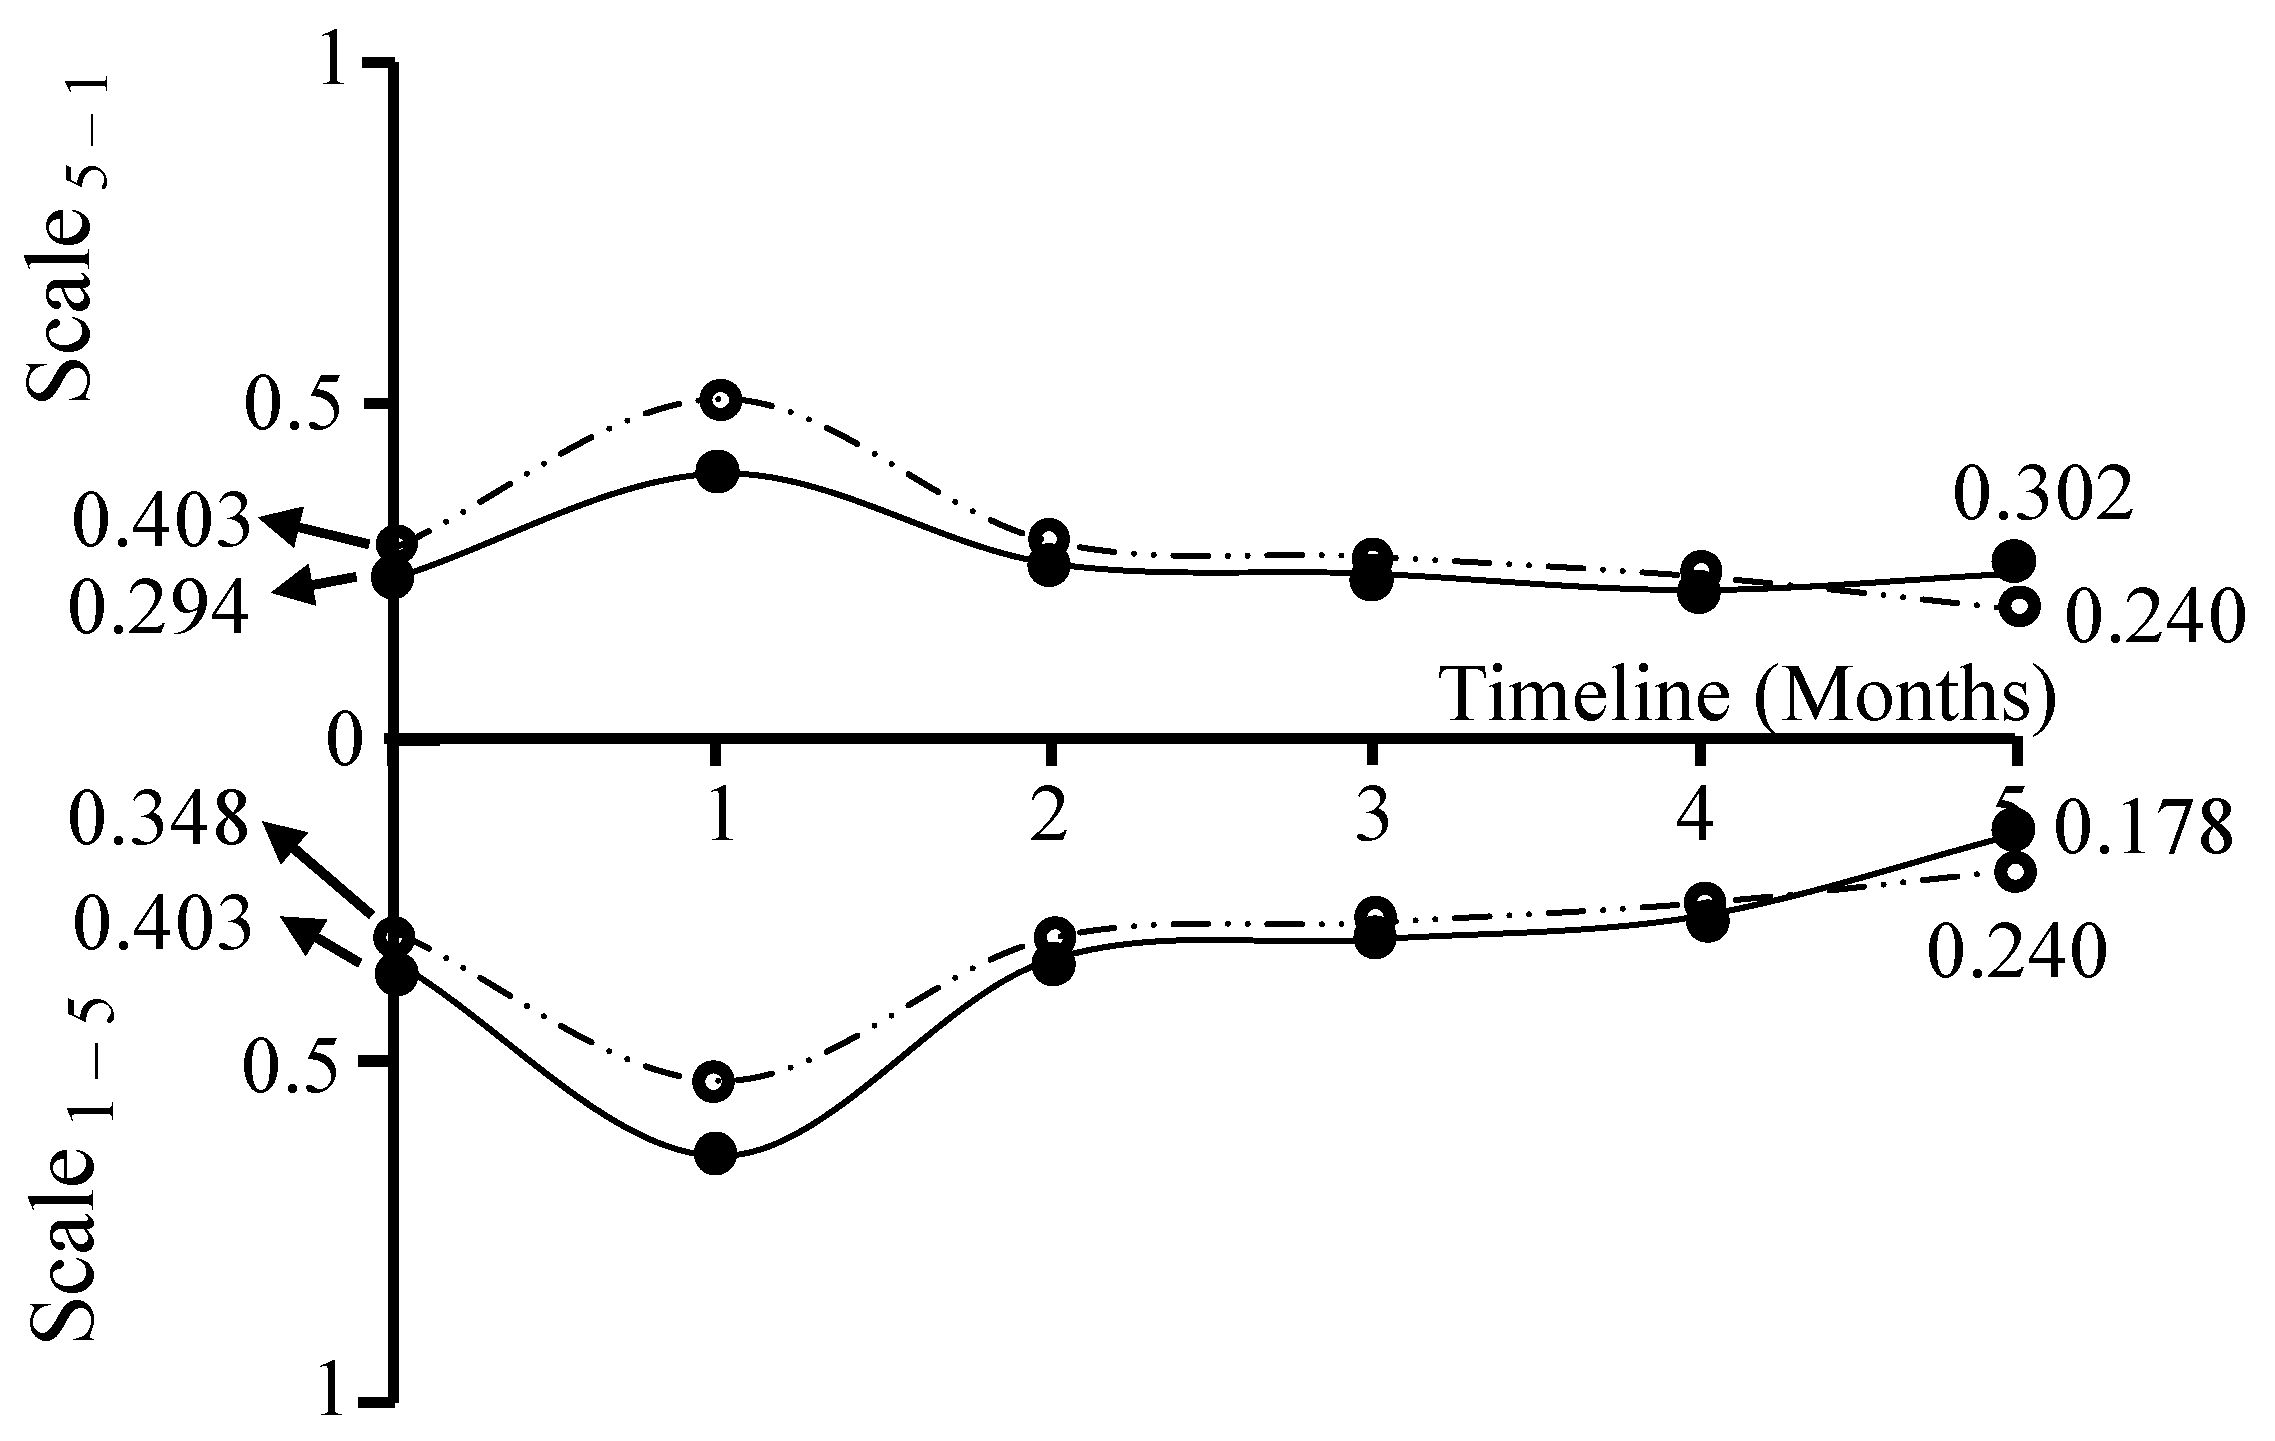
Throughout the six-month duration of the study, data was gathered on a monthly basis. Calculations for the subsequent months are omitted here, as they follow the same structure as those illustrated for the month 0. Figure 3 displays the outcomes derived from applying the previously discussed theorems to the participants’ responses across the study period for the BCS. The output of Theorem 1 is mapped along a scale ranging from 5 to 1, while Theorem 2 is represented on a scale from 1 to 5. This graphical representation reveals key trends in the participants’ ES under both evaluation scales.
The calculation of overall entropic state (OES), based on participants’ responses to the questionnaire over the study period, is carried out using Equation (4):
O E S m o n t h   i = E S 5 1 m o n t h   i + E S 1 5 m o n t h   i 2 = E x e r g y 5 1 + V a g u e n e s s 5 1 m o n t h   i + E X x e r g y 1 5 + V a g u e n e s s 1 5 m o n t h   i 2
here, ES denotes the entropic state, defined as the sum of exergy and vagueness. The overall entropic state (OES) reflects the ES values linked to the catch-all clause, which includes all individual terms (Table 10). Accordingly, the values for months 0 and 5 are calculated as follows.
O E S m o n t h   0 = 0.155 + 0 + 0.230 + 0 2 = 0.192
O E S m o n t h   5 = 0.220 + 0 + 0.100 + 0 2 = 0.160
When the ES approaches zero (low entropy), the resulting OES value is also low, indicating that the integration of GAI in C) is viewed as beneficial for diagnosis, treatment planning, and procedural accuracy. In contrast, when the OES is close to one (high entropy), it reflects a less favorable perception of GAI integration in CD. The patterns shown in Figure 3 reveal a decline in OES from the beginning of the study to month 1, followed by a tendency towards improvement. This improvement pattern may be attributed to the fact that dental practitioners may initially encounter challenges integrating GAI into clinical workflows. These hurdles often stem from the steep learning curve associated with new AI-based digital tools—as has been seen with CAD/CAM systems in restorative dentistry—and the technical complexity of embedding AI software and hardware into existing practice management and imaging workflows [24]. However, as clinicians and staff gradually build familiarity and digital literacy, and as software and infrastructure mature with better interoperability and tailored interfaces, these issues tend to fade—eventually enabling seamless AI-aided diagnostics, treatment planning, and procedural precision in everyday practice [25,26].
In the context of the WCS, one can also assess ES of the participants by analyzing their responses collected over a six-month period (Figure 4). Their development over time is established through the validation of theorems 1 and 2, using the data related to the WCS shown in Table 12 for month 0.
In the WCS, the OES at months 0 and 5 is quantified as follows:
O E S m o n t h   0 = 0.155 + 0.139 + 0.230 + 0.173 2 = 0.403
O E S m o n t h   5 = 0.220 + 0.082 + 0.100 + 0.78 2 = 0.240
The trend shown in Figure 4 resembles that observed in the BCS (Figure 3). However, in the WCS, this pattern is more pronounced due to comparatively higher OES values. By applying the appropriate data, the progression of ES can be analyzed for each dimension (Table 10 and Table 12) or each question (Table 9 and Table 11) using the same approach. Targeted evaluations can also be conducted for specific professional groups by using only their responses. However, a sufficiently large sample is required to ensure reliable outcomes.
The results obtained using entropy modeling aligned with the classical statistics, namely:
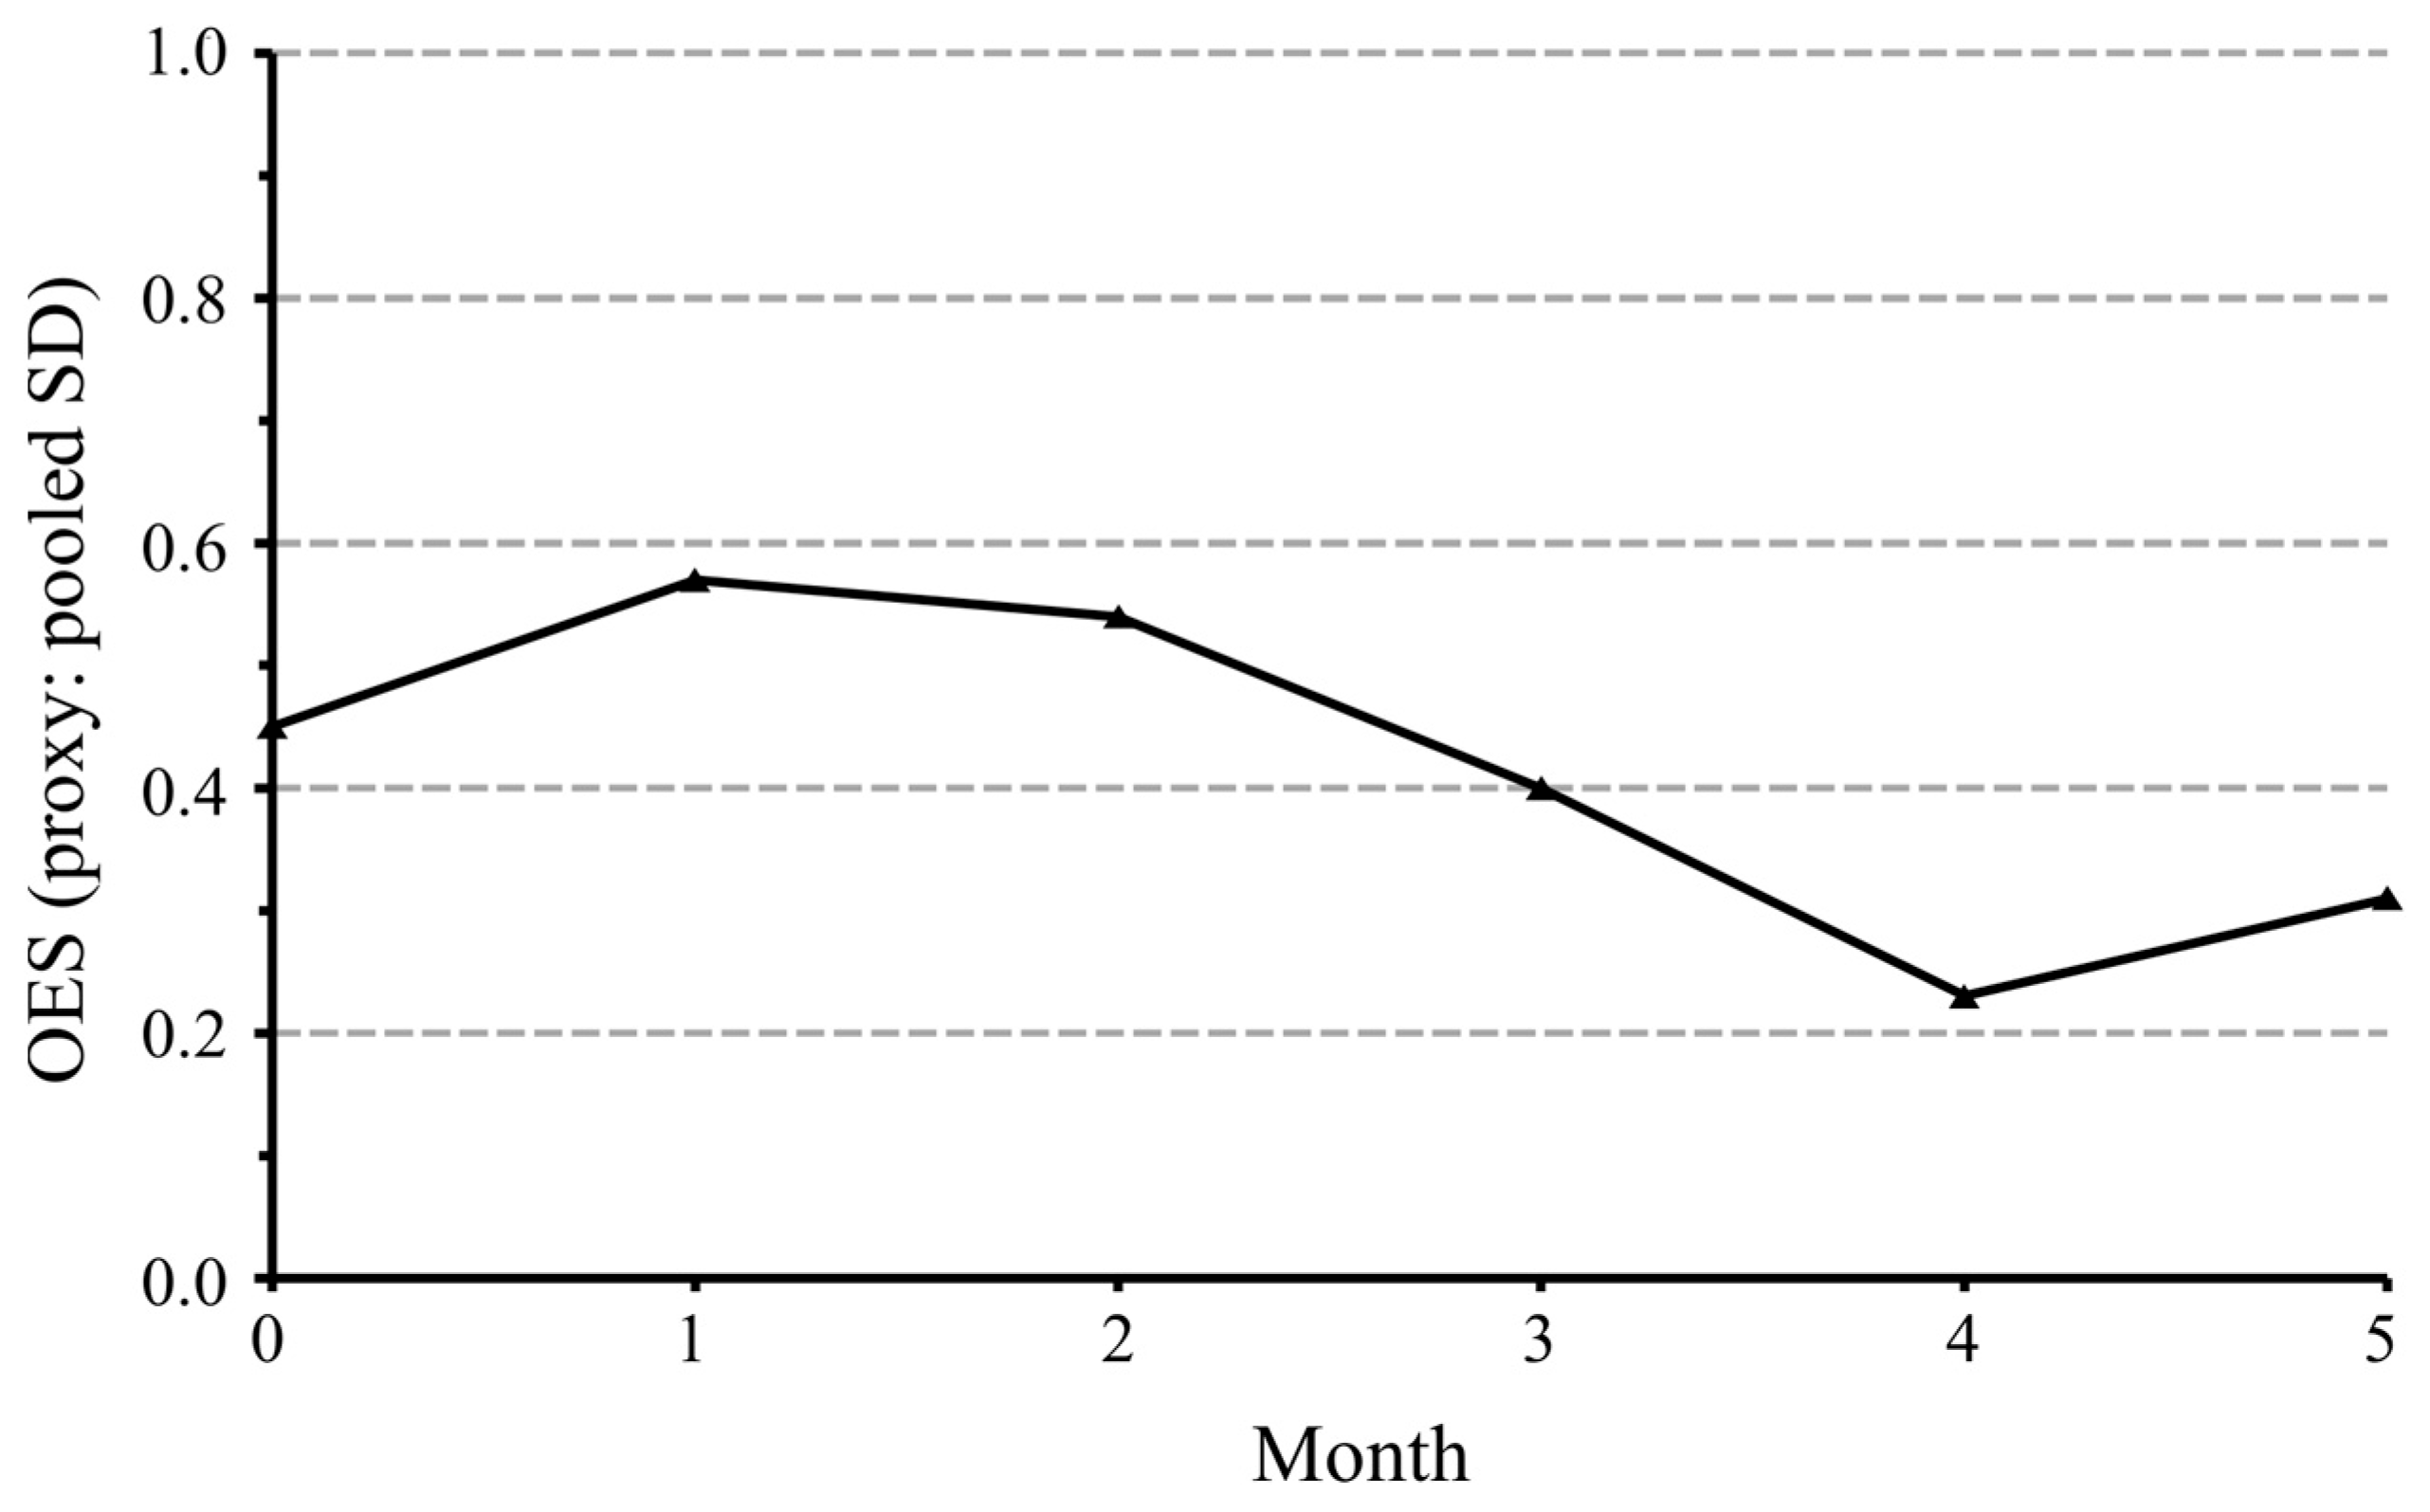
  • The Overall Entropic State (OES) decreased from 0.43 at baseline to 0.31 at month 5 (p = 0.018) (Figure 5).
  • This reduction indicates that dentists’ perceptions became more consistent and less uncertain as the study progressed.
  • The triangulation between narrower confidence intervals (statistical results) and declining OES (entropy analysis) strengthens the conclusion that attitudes toward GAI grew clearer and more favorable over time.

5. Discussion

This six-month longitudinal study revealed that dental professionals’ perceptions of GAI improved in clarity over time. Potential applications and future perspectives dimensions consistently scored higher than current use and knowledge dimension, while challenges and barriers dimension remained the most variable. The overall entropic state—a measure of uncertainty—declined steadily, indicating increasing coherence in attitudes. The alignment between classical statistics and entropy-based reasoning provides robust support for these trends. These results echo recent findings showing that clinicians generally hold a cautious but positive outlook on AI’s role in dentistry (e.g., enhancing diagnosis and treatment planning), despite limited routine use. Surveys across Europe and North America report growing interest, particularly among younger or tech-savvy professionals [22,27,28]. However, most of those studies are cross-sectional, lacking longitudinal insight or computational modeling of uncertainty. Our approach—with entropy offering a complementary perspective on variability and reliability—adds methodological depth, as encouraged in emerging dental informatics literature [22,29].

5.1. Ethical and Educational Context

  • Training: While there is no single global GAI curriculum yet, continuing education (CE) and CPD programs are emerging. The American Dental Association, European dental schools, and other institutions now offer structured courses on AI in practice [30,31]. FDI’s recent policy statements advocate for incorporating AI into undergraduate and postgraduate dental training [23], and the UK’s General Dental Council allows AI topics to count toward CPD credits [21].
  • Ethics and Accountability: Transparency and informed consent are increasingly emphasized. The EU AI Act mandates disclosure when AI significantly influences clinical decisions, complementing existing medical device law [24]. Professional guidelines affirm that clinicians maintain accountability for outcomes, even when supported by AI—with documentation practices to reflect AI input, fairness, bias mitigation, and explainability [25,26].
  • Entropy Interpretation: Clinically, a declining OES is promising: it reflects greater consensus and readiness. Higher exergy signals stable, useful perceptions, while lower vagueness suggests that ambiguity in attitudes is waning—key indicators of growing confidence in GAI tools.

5.2. Study Limitations

This study has several important limitations:
  • Geographic scope: Participants were all recruited in Portugal, which restricts the external validity of the findings. Future studies are encouraged to replicate this work in diverse international cohorts to strengthen external validation.
  • The data is self-reported and hence reflects subjective perceptions, which may be influenced by bias and do not directly measure clinical performance or patient outcomes.
  • Demographic detail: While age, gender, and years of practice were collected, subgroup analyses were limited, and broader variables such as digital literacy, practice size, or type of institution were not examined.
  • The study lacks a pilot study.
  • Psychometric considerations: Reliability testing showed very high internal consistency for multi-item dimensions—PAD (α = 0.975), FPD (α = 0.969), and CBD (α = 0.957). Although this indicates strong reliability, values above 0.95 may also reflect item redundancy, meaning items captured overlapping aspects rather than distinct constructs. In contrast, the two-item CUKD scale demonstrated weak internal consistency and low reliability (r = 0.08; Spearman–Brown = 0.149), so its results should be interpreted cautiously.
  • Entropy modeling: The entropy framework simplified vagueness estimation by using standard deviations as a proxy, which may not capture the full nuance of uncertainty in responses and should be refined in future research.
Despite these constraints, the longitudinal design and the integration of classical statistical inference with entropy-based reasoning strengthen the validity of the findings and provide a robust picture of how dental professionals’ perceptions of GAI evolve.

5.3. Strengths and Contributions

Key strengths include the longitudinal design, which captures evolving perceptions rather than one-off snapshots. The novel triangulation of classical statistics and entropy-based reasoning provides rich, multidimensional insights. The transparent reporting—exact p-values, confidence intervals, effect sizes, individual scatter plots—enhances replicability and meets open-science standards [20].

5.4. Implications for Practice and Research

  • Practice: The finding that GAI perceptions are improving but tethered by ethical, educational, and governance concerns suggests the need for structured AI training (e.g., CPD modules) and clear practice guidelines.
  • Research: Hybrid methods that pair entropy modeling with statistical inference may be especially valuable in evaluating emerging technologies with inherent uncertainty. Future studies should include broader, more diverse populations, incorporate demographic moderators, and assess links between perceptions and real-world performance.

5.5. Clinical Applications of the Entropy–Logic Framework

In clinical terms, entropy–logic indices enable several near-term clinical uses:
  • Chairside decision support: Entropy-derived confidence and vagueness scores can be surfaced alongside AI outputs (e.g., caries or periapical findings), allowing uncertainty-aware triage/defer decisions and “explanation by confidence” that aligns with guidance from medical-imaging uncertainty literature and recent dental decision-making reviews [27,32].
  • Imaging workflows: Uncertainty-aware learning has already been demonstrated for panoramic caries segmentation, where multi-level uncertainty signals guide semi-supervised training and mask low-confidence regions—an approach compatible with entropy-based indices for flagging ambiguous areas for human review [28].
  • EHR/EDR integration: Entropy metrics can be computed over longitudinal records (e.g., conflicting codes or fluctuating problem lists) to flag cases with unstable documentation for audit or follow-up; recent work shows robust extraction of periodontal diagnoses from clinical notes across institutions, while informatics reviews emphasize the need for standardized dental data to support such analytics [22,29].
  • Education/CPD: Declining overall entropic state (OES) and exergy over time can be mapped to readiness and consensus and incorporated into reflective training that builds comfort with uncertainty in clinical judgment [30]. Conceptually, these uses are grounded in entropy’s role as an operational measure of uncertainty in probabilistic systems, providing a principled scalar signal that complements classical statistical inference in dental research and practice [31].

6. Conclusions

This six-month longitudinal study provides empirical evidence that dental professionals perceive generative artificial intelligence most favorably in terms of its potential applications and future perspectives, compared with current use and knowledge. Challenges and barriers remained more heterogeneous. Both classical statistical analyses and entropy-based reasoning converged on a consistent trend. The overall entropic state decreased over time, indicating greater clarity and coherence in professional attitudes. This methodological triangulation underscores the robustness of the findings and highlights the value of hybrid analytical approaches in capturing uncertainty and variability in technology adoption studies. Exploratory subgroup analyses further suggested that clinicians with higher baseline exposure to AI reported more favorable views of GAI applications and future potential. These results resonate with emerging survey evidence showing that younger and digitally literate dental professionals display higher readiness to integrate AI into practice [21,23,24]. However, important limitations must temper interpretation. The study relied on self-reported perceptions, was geographically constrained, and did not assess clinical performance or workflow outcomes. In addition, demographic moderators such as age and years in practice were not collected, limiting subgroup generalizability. Entropy modeling, while innovative, used simplified proxies that require further refinement in future research.
Practical implications are clear; i.e., adoption of GAI in clinical dentistry will require (i) structured AI education integrated into continuing professional development (CPD) and undergraduate curricula, in line with international recommendations; (ii) ethical safeguards, including informed patient consent when AI meaningfully informs decisions and transparency consistent with regulatory frameworks such as the EU AI Act [25,26,33,34,35,36,37]; and (iii) shared accountability models, where clinicians remain responsible for clinical outcomes despite AI assistance, as emphasized in professional guidance [38,39].
In conclusion, while GAI is not yet widely embedded in everyday clinical workflows, this study demonstrates a growing professional readiness to engage with its applications. The findings suggest that carefully designed training programs, transparent governance structures, and standardized evaluation protocols will be essential to ensure responsible and effective adoption. By advancing both technical and ethical integration, dentistry can leverage GAI not only to improve efficiency and diagnostic precision, but also to strengthen patient-centered care in the evolving digital era.

Supplementary Materials

The following supporting information can be downloaded at: https://www.mdpi.com/article/10.3390/digital5030044/s1. Table S1. Item-total correlations and Cronbach’s α for each across potential applications dimension (PAD), future perspectives dimension (FPD) and challenges and barriers dimension (CBD) (baseline, n = 119). Table S2. Two-item diagnostic (current use and knowledge dimension (CUKD), baseline, n = 119) Figure S1. Scatter plots overlaid on boxplots for each dimension across study months. Figure S2. Participant one’s responses to questions Q1–Q16 at month 0.

Author Contributions

Conceptualization, H.D., J.N. and H.V.; methodology, H.D., A.R.G.C., J.N. and H.V.; software, J.N. and H.V.; validation, H.D., J.N. and H.V.; formal analysis, H.D., J.N. and H.V.; investigation, H.D.; writing—original draft preparation, H.D.; writing—review and editing, H.D., A.R.G.C., C.R., J.N. and H.V.; visualization, J.N. and H.V. All authors have read and agreed to the published version of the manuscript.

Funding

This research was funded by PT national funds (FCT/MCTES, Fundação para a Ciência e Tecno-logia and Ministério da Ciência, Tecnologia e Ensino Superior) through the projects UIDB/50006/2020 and UIDP/50006/2020.

Institutional Review Board Statement

The study was conducted in accordance with the Declaration of Helsinki and approved by the Ethics Committee of CESPU University (protocol code CE/IUCS/CESPU-13/22 on 21 April 2022).

Informed Consent Statement

Informed consent was obtained from all subjects involved in the study.

Data Availability Statement

The original contributions presented in the study are included in the article, further inquiries can be directed to the corresponding author.

Conflicts of Interest

The authors declare no conflicts of interest.

Abbreviations

The following abbreviations are used in this manuscript:
AIArtificial intelligence
BCSBest-case scenario
CBDChallenges and barriers dimension
CDClinical dentistry
CUKDCurrent use and knowledge dimension
ESEntropic state
FPDFuture perspectives dimension
GAIGenerative artificial intelligence
KRRKnowledge representation and reasoning
LPLogic programming
OESOverall entropic state
PADPotential applications dimension
WCSWorst-case scenario

References

  1. Schwendicke, F.; Samek, W.; Krois, J. Artificial Intelligence in Dentistry: Chances and Challenges. J. Dent. Res. 2020, 99, 769–774. [Google Scholar] [CrossRef] [PubMed]
  2. Turkkahraman, H. Embracing the Unprecedented Pace of Change: Artificial Intelligence’s Impact on Dentistry and Beyond. Eur. J. Dent. 2023, 17, 567–568. [Google Scholar] [CrossRef] [PubMed]
  3. Anil, S.; Sudeep, K.; Saratchandran, S.; Sweety, V.K. Revolutionizing Dental Caries Diagnosis through Artificial Intelligence. In Dental Caries Perspectives—A Collection of Thoughtful Essays; Chibinski, A.C., Gehrke, S.A., Eds.; IntechOpen: London, UK, 2024; pp. 1–27. [Google Scholar] [CrossRef]
  4. Ding, H.; Wu, J.; Zhao, W.; Matinlinna, J.P.; Burrow, M.F.; Tsoi, J.K. Artificial Intelligence in Dentistry—A Review. Front. Dent. Med. 2023, 4, 1085251. [Google Scholar] [CrossRef]
  5. Pearl Inc. Pearl Second Opinion®: FDA Clearance for 2D/3D Radiograph Analysis. U.S. Food and Drug Administration Database. Available online: https://www.fda.gov (accessed on 17 August 2025).
  6. Overjet Inc. Overjet Caries Assist: FDA 510(k) Clearances. FDA Device Database. 2023. Available online: https://www.fda.gov (accessed on 17 August 2025).
  7. VideaHealth Inc. Videa Dental Assist FDA Clearance Announcement. Boston, MA, USA, 2024. Available online: https://www.fda.gov (accessed on 17 August 2025).
  8. Neocis Inc. Yomi® Robotic-Assisted Dental Surgery: FDA Clearances and Modules. FDA Device Database. 2022. Available online: https://www.fda.gov (accessed on 17 August 2025).
  9. DentalMonitoring. CE Certification of AI Remote Orthodontic Monitoring as EU-MDR Class IIa Device. Paris, France, 2024. Available online: https://dental-monitoring.com (accessed on 17 August 2025).
  10. Donati, J.; Beyer, M.; Brokmeier, J.; Neuhaus, K.W.; Thieringer, F.M.; Berg, B.I. Artificial Intelligence in Dentistry: Insights and Expectations from Swiss Dental Professionals. BMC Med. Inform. Decis. Mak. 2025, 25, 231. [Google Scholar] [CrossRef]
  11. General Dental Council. The Impact of Artificial Intelligence on Dentistry: A Rapid Evidence Review; GDC: London, UK, 2022; Available online: https://www.gdc-uk.org (accessed on 17 August 2025).
  12. Mylrea, M.; Robinson, N. Artificial Intelligence (AI) Trust Framework and Maturity Model: Applying an Entropy Lens to Improve Security, Privacy, and Ethical AI. Entropy 2023, 25, 1429. [Google Scholar] [CrossRef]
  13. Neves, J. A Logic Interpreter to Handle Time and Negation in Logic Databases. In Proceedings of the 1984 Annual Conference of the ACM on the 5th Generation Challenge; ACM: New York, NY, USA, 1984; pp. 50–54. [Google Scholar] [CrossRef]
  14. Kakas, A.; Kowalski, R.; Toni, F. The Role of Abduction in Logic Programming. In Handbook of Logic in Artificial Intelligence and Logic Programming; Gabbay, D., Hogger, C., Robinson, I., Eds.; Oxford University Press: Oxford, UK, 1998; Volume 5, pp. 235–324. [Google Scholar] [CrossRef]
  15. Dawa, H.; Neves, J.; Vicente, H. Evaluating the Impact of Digital Tool Utilization in Dentistry on Burnout Syndrome among Dentists: An Entropy Analysis and AI-Driven Approach. Eng 2025, 6, 47. [Google Scholar] [CrossRef]
  16. Bratko, I. Prolog Programming for Artificial Intelligence, 4th ed.; Pearson Education: Harlow, UK, 2012. [Google Scholar]
  17. Davis, F.D. Perceived Usefulness, Perceived Ease of Use, and User Acceptance of Information Technology. MIS Q. 1989, 13, 319–340. [Google Scholar] [CrossRef]
  18. Venkatesh, V.; Morris, M.G.; Davis, G.B.; Davis, F.D. User Acceptance of Information Technology: Toward a Unified View. MIS Q. 2003, 27, 425–478. [Google Scholar] [CrossRef]
  19. Tavakol, M.; Dennick, R. Making Sense of Cronbach’s Alpha. Int. J. Med. Educ. 2011, 2, 53–55. [Google Scholar] [CrossRef] [PubMed]
  20. Khalid, N.; Qayyum, A.; Bilal, M.; Al-Fuqaha, A.; Qadir, J. Privacy-Preserving Artificial Intelligence in Healthcare: Techniques and Applications. Comput. Biol. Med. 2023, 158, 106848. [Google Scholar] [CrossRef]
  21. Shujaat, S. Automated Machine Learning in Dentistry: A Narrative Review of Applications, Challenges, and Future Directions. Diagnostics 2025, 15, 273. [Google Scholar] [CrossRef]
  22. Chuang, Y.-S.; Lee, C.-T.; Lin, G.-H.; Brandon, R.; Jiang, X.; Walji, M.F.; Tokede, O. Cross-Institutional Dental Electronic Health Record Entity Extraction via Generative Artificial Intelligence and Synthetic Notes. JAMIA Open 2025, 8, ooaf061. [Google Scholar] [CrossRef]
  23. Lin, G.S.S.; Ng, Y.S.; Ghani, N.R.N.; Chua, K.H. Revolutionising Dental Technologies: A Qualitative Study on Dental Technicians’ Perceptions of Artificial Intelligence Integration. BMC Oral Health 2023, 23, 690. [Google Scholar] [CrossRef]
  24. Villena, F.; Véliz, C.; García-Huidobro, R.; Aguayo, S. Generative Artificial Intelligence in Dentistry: Current Approaches and Future Challenges. arXiv 2024, arXiv:2407.17532. [Google Scholar] [CrossRef]
  25. Monterubbianesi, R.; Tosco, V.; Vitiello, F.; Orilisi, G.; Fraccastoro, F.; Putignano, A.; Orsini, G. Augmented, Virtual and Mixed Reality in Dentistry: A Narrative Review on the Existing Platforms and Future Challenges. Appl. Sci. 2022, 12, 877. [Google Scholar] [CrossRef]
  26. Kim, C.S.; Samaniego, C.S.; Sousa Melo, S.L.; Brachvogel, W.A.; Baskaran, K.; Rulli, D. Artificial Intelligence (A.I.) in Dental Curricula: Ethics and Responsible Integration. J. Dent. Educ. 2023, 87, 1570–1573. [Google Scholar] [CrossRef] [PubMed]
  27. Huang, L.; Ruan, S.; Xing, Y.; Feng, M. A Review of Uncertainty Quantification in Medical Image Analysis: Probabilistic and Non-Probabilistic Methods. Med. Image Anal. 2024, 97, 103223. [Google Scholar] [CrossRef]
  28. Wang, X.; Gao, S.; Jiang, K.; Zhang, H.; Wang, L.; Chen, F.; Yu, J.; Yang, F. Multi-Level Uncertainty Aware Learning for Semi-Supervised Dental Panoramic Caries Segmentation. Neurocomputing 2023, 540, 126208. [Google Scholar] [CrossRef]
  29. Gurupur, V.P.; Vu, G.; Mayya, V.; King, C. The Need for Standards in Evaluating the Quality of Electronic Health Records and Dental Records: A Narrative Review. Big Data Cogn. Comput. 2024, 8, 168. [Google Scholar] [CrossRef]
  30. Brodén, J.; Fransson, H.; Vareman, N.; Pigg, M. Reflection to Enhance Dental Students’ Awareness of and Comfort with Uncertainty—An Experimental Study. BMC Med. Educ. 2025, 25, 46. [Google Scholar] [CrossRef]
  31. Robinson, D.W. Entropy and Uncertainty. Entropy 2008, 10, 493–506. [Google Scholar] [CrossRef]
  32. Murdoch, A.I.K.; Blum, J.; Chen, J.; Baziotis-Kalfas, D.; Dao, A.; Bai, K.; Bekheet, M.; Atwal, N.; Cho, S.S.H.; Ganhewa, M.; et al. Determinants of Clinical Decision Making under Uncertainty in Dentistry: A Scoping Review. Diagnostics 2023, 13, 1076. [Google Scholar] [CrossRef]
  33. Tuygunov, N.; Samaranayake, L.; Khurshid, Z.; Rewthamrongsris, P.; Schwendicke, F.; Osathanon, T.; Yahya, N.A. The Transformative Role of Artificial Intelligence in Dentistry: A Comprehensive Overview, Part 2: The Promise and Perils, and the International Dental Federation Communique. Int. Dent. J. 2025, 75, 397–404. [Google Scholar] [CrossRef]
  34. FDI World Dental Federation. FDI Artificial Intelligence in Dentistry Working Group White Paper & Policy Statement; FDI: Geneva, Switzerland, 2023. [Google Scholar]
  35. General Dental Council. Continuing Professional Development (CPD) Requirements—AI-Related Content; GDC: London, UK, 2024. [Google Scholar]
  36. European Union. AI Act: Regulation on AI Systems (2024); Official Journal of the EU: Brussels, Belgium, 2024. [Google Scholar]
  37. Rigby, M.J. Ethical Dimensions of Using Artificial Intelligence in Health Care. AMA J. Ethics 2019, 21, 121–124. [Google Scholar] [CrossRef]
  38. Karimian, G.; Petelos, E.; Evers, S.M.A.A. The Ethical Issues of the Application of Artificial Intelligence in Healthcare: A Systematic Scoping Review. AI Ethics 2022, 2, 539–551. [Google Scholar] [CrossRef]
  39. Martini, B.; Bellisario, D.; Coletti, P. Human-Centered and Sustainable Artificial Intelligence in Industry 5.0: Challenges and Perspectives. Sustainability 2024, 16, 5448. [Google Scholar] [CrossRef]
Figure 3. Progression of the overall entropic state of participants under the best-case scenario across a six-month period. Solid lines represent the entropic state on both the 5–1 and 1–5 scales, while dashed lines indicate the overall entropic state.
Digital 05 00044 g003
Figure 4. Progression of the overall entropic state of participants under the worst-case scenario across a six-month period. Solid lines represent the entropic state on both the 5–1 and 1–5 scales, while dashed lines indicate the overall entropic state.
Digital 05 00044 g004
Figure 5. Overall entropic state (OES) across study months.
Digital 05 00044 g005
Table 1. Dimensions and questions present in the questionnaire.
Dimension 1Question
CUKDQ1How would you rate your knowledge of generative AI technologies in dentistry?
Q2How would you rate the formal training on AI applications in dentistry you received?
PADQ3How would you rate AI in improving diagnostic accuracy?
Q4How would you rate AI in reducing time per patient?
Q5How would you rate AI in improving customized treatment planning?
Q6How would you rate AI in the development of personalized prosthetics and orthodontics?
Q7How would you rate the integration of AI in dental education and training?
FPDQ8How would you rate AI in being essential in dental diagnostics within the next 5–10 years?
Q9How would you rate AI in enhancing personalized patient care by predicting individual risks and outcomes?
Q10How would you rate GAI in the reduction of the cost of dental care?
Q11How would you rate GAI to facilitate greater access to dental care in underserved regions?
Q12How would you rate GAI in empowering professionals to acquire new skills to work effectively with AI technologies?
Q13How would you rate GAI to assure that ethical concerns in dentistry will be adequately addressed?
CBDQ14How would you rate the barrier related with GAI in assessing if the integration of AI into existing workflows is difficult?
Q15How would you rate the barrier related with GAI in assessing if AI technology is cost-prohibitive?
Q16How would you rate the barrier related with GAI in assessing if patient consent for AI use is a complex issue?
1 CUKD-current use and knowledge dimension, PAD-potential applications dimension, FPD-future perspectives dimension, and CBD-challenges and barriers dimension.
Table 2. Internal consistency reliability of the four dimensions at baseline (n = 119).
Dimension 1Items Cronbach’s αSpearman–Brown (2-Item)Interpretation
CUKD20.149Low; items reflect distinct constructs; interpret with caution
PAD50.975Excellent internal consistency
FPD60.969Excellent internal consistency
CBD30.957Excellent internal consistency
1 CUKD-current use and knowledge dimension, PAD-potential applications dimension, FPD-future perspectives dimension, and CBD-challenges and barriers dimension.
Table 3. Descriptive statistics for current use and knowledge dimension.
MonthMeanStandard DeviationN95% Confidence Interval
02.3150.6851190.123
11.5500.5141190.092
22.5500.5141190.092
33.1930.3971190.071
43.3580.2051190.037
53.7530.4531190.081
Table 4. Descriptive statistics for potential applications dimension.
MonthMeanStandard DeviationN95% Confidence Interval
03.0610.9511190.171
12.1650.8301190.149
23.1180.7851190.141
33.8500.5071190.091
44.2080.3331190.060
54.5110.3351190.060
Table 5. Descriptive statistics for future perspectives dimension.
MonthMeanStandard DeviationN95% Confidence Interval
03.2660.8991190.162
12.4480.7291190.131
23.3360.8081190.145
34.1360.5311190.095
44.3880.2721190.049
54.7080.2761190.050
Table 6. Descriptive statistics for challenges and barriers dimension.
MonthMeanStandard DeviationN95% Confidence Interval
02.7790.7441190.134
11.8740.6211190.112
22.8740.6211190.112
33.4290.4971190.089
43.3960.361190.065
53.8720.3521190.063
Table 8. Converting the responses of participant one to the questionnaire segmented by dimensions (current use and knowledge dimension (CUKD), potential applications dimension (PAD), future perspectives dimension (FPD) and challenges and barriers dimension (CBD)), at month 0, on an expanded nine-level Likert scale.
DimensionQuestionsSymmetrical Nine-Level Likert Scale *Vagueness
Decreasing TrendIncreasing Trend
Digital 05 00044 i001Digital 05 00044 i002
543212345
CUKDQ1
Q2
PADQ3
Q4
Q5
Q6
Q7
FPDQ8
Q9
Q10
Q11
Q12
Q13
CBDQ14
Q15
Q16
* (5) very important, (4) important, (3) marginally important, (2) slightly important, and (1) not at all important.
Table 9. Computing of exergy, vagueness and anergy values for participant one’s responses to question Q8–Q13, regarding future perspectives dimension at month 0, in the best-case scenario, for both scales, ranging from very important (5) to not at all important (1), and from not at all important (1) to very important (5).
Scale (5) → (1)Scale (1) → (5)
Q8 e x e r g y Q 8 = 1 6 π 4 5 1 π 2 = 0.107
v a g u e n e s s Q 8 = 0
a n e r g y Q 8 = 1 6 π 5 5 1 π 2 4 5 1 π 2 = 0.060
Q9 e x e r g y Q 9 = 0
v a g u e n e s s S 4 = 0
a n e r g y Q 9 = 1 6 π 5 5 1 π 2 0 2 = 0.167
Q10 e x e r g y Q 10 = 1 6 π 2 5 1 π 2 = 0.027
v a g u e n e s s Q 10 = 0
a n e r g y Q 10 = 1 6 π 5 5 1 π 2 2 5 1 π 2 = 0.140
Q11 e x e r g y Q 11 = 1 6 π 2 5 1 π 2 = 0.027
v a g u e n e s s Q 11 = 0
a n e r g y Q 11 = 1 6 π 5 5 1 π 2 2 5 1 π 2 = 0.140
Q12 e x e r g y Q 12 = 1 6 π 1 5 1 π 2 = 0.007
v a g u e n e s s Q 12 = 0
a n e r g y Q 12 = 1 6 π 5 5 1 π 2 1 5 1 π 2 = 0.160
Q13 e x e r g y Q 13 = 1 6 π 4 5 1 π 2 = 0.107
v a g u e n e s s Q 13 = 0
a n e r g y Q 13 = 1 6 π 5 5 1 π 2 4 5 1 π 2 = 0.060
Table 10. Values of exergy, vagueness, and anergy for each dimension under investigation (current use and knowledge dimension (CUKD), potential applications dimension (PAD), future perspectives dimension (FPD) and challenges and barriers dimension (CBD)) for participant one at month 0, in the best-case scenario, for both scales, where (5) to (1) ranges from the most to least positive response option, and (1) to (5) ranges from the least to most positive response.
Scale (5) to (1) Scale (1) to (5)
ExergyVaguenessAnergy ExergyVaguenessAnergy
CUKD5–10.32000.180CUKD1–50.18000.320
PAD5–10.07200.128PAD1–50.24000.560
FPD5–10.10700.227FPD1–50.16800.500
CBD5–10.12000.213CDB1–50.33300.333
Catch-all clause0.15500.187Catch-all clause0.23000.428
Table 11. Computing of exergy, vagueness and anergy values for participant one’s responses to question Q8–Q13, regarding future perspectives dimension at month 0, in the worst-case scenario, for both scales, ranging from very important (5) to not at all important (1), and from not at all important (1) to very important (5).
Scale (5) → (1)Scale (1) → (5)
Q8 e x e r g y Q 8 = 1 6 π 4 5 1 π 2 = 0.107
v a g u e n e s s Q 8 = 1 6 π 5 5 1 π 2 4 5 1 π 2 = 0.060
a n e r g y Q 8 = 0
Q9 e x e r g y Q 9 = 0
v a g u e n e s s S 4 = 1 6 π 5 5 1 π 2 0 2 = 0.167
a n e r g y Q 9 = 0
Q10 e x e r g y Q 10 = 1 6 π 2 5 1 π 2 = 0.027
v a g u e n e s s Q 10 = 1 6 π 3 5 1 π 2 2 5 1 π 2 = 0.033
a n e r g y Q 10 = 1 6 π 5 5 1 π 2 3 5 1 π 2 = 0.107
Q11 e x e r g y Q 11 = 1 6 π 2 5 1 π 2 = 0.027
v a g u e n e s s Q 11 = 1 6 π 3 5 1 π 2 2 5 1 π 2 = 0.033
a n e r g y Q 11 = 1 6 π 5 5 1 π 2 3 5 1 π 2 = 0.107
Q12 e x e r g y Q 12 = 1 6 π 1 5 1 π 2 = 0.007
v a g u e n e s s Q 12 = 1 6 π 2 5 1 π 2 1 5 1 π 2 = 0.020
a n e r g y Q 12 = 1 6 π 5 5 1 π 2 2 5 1 π 2 = 0.140
Q13 e x e r g y Q 13 = 1 6 π 4 5 1 π 2 = 0.107
v a g u e n e s s Q 13 = 1 6 π 5 5 1 π 2 4 5 1 π 2 = 0.060
a n e r g y Q 13 = 0
Table 12. Values of exergy, vagueness, and anergy for each dimension under investigation (current use and knowledge dimension (CUKD), potential applications dimension (PAD), future perspectives dimension (FPD) and challenges and barriers dimension (CBD)) for participant one at month 0, in the worst-case scenario, for both scales, where (5) to (1) ranges from the most to least positive response option, and (1) to (5) ranges from the least to most positive response.
Scale (5) to (1) Scale (1) to (5)
ExergyVaguenessAnergy ExergyVaguenessAnergy
CUKD5–10.3200.1800CUKD1–50.1800.1400.180
PAD5–10.0720.0560.072PAD1–50.2400.1920.368
FPD5–10.1070.2270FPD1–50.1680.1460.354
CBD5–10.1200.0930.120CDB1–50.3330.2130.120
Catch-all clause0.1550.1390.048Catch-all clause0.2300.1730.256
Disclaimer/Publisher’s Note: The statements, opinions and data contained in all publications are solely those of the individual author(s) and contributor(s) and not of MDPI and/or the editor(s). MDPI and/or the editor(s) disclaim responsibility for any injury to people or property resulting from any ideas, methods, instructions or products referred to in the content.