4.5. Entropy-Based Analysis
The data processing employs LP for KRR, embedding and converting data in accordance with the Laws of Thermodynamics [
21]. The participants’ responses were collected and analyzed on an individual basis.
Figure S2 (available within the
Supplementary Materials) displays participant 1’s responses at month 0, while
Table 8 presents the correspondent responses in terms of the extended Likert scale. For example, for the future perspectives dimension at month 0 the response to Q8 was not at all important (1), with no indicated trend. This response should be interpreted on the positive scale, ranging from not at all important (1) to very important (5), as it may remain stable or increase over time. For Q9 the I don’t know option was selected, indicating uncertainty. In this case, while the precise values for exergy, vagueness, and anergy cannot be determined, their range is known to lie between 0 and 1 [
21,
22]. For Q10 and Q11 participant one marked the option marginally important (3) and indicates an increasing tendency in his/her response (
Figure S2). Therefore, this response should be evaluated on a scale from not at all important (1) to very important (5), with important representing the best-case scenario (BCS) and marginally important as the worst-case scenario (WCS), as illustrated in
Table 8. For Q12, the situation mirrors the previous one, with very important representing the BCS and important representing the WCS. Conversely, for Q13 participant one marked the option slightly important (2) and indicates a decreasing tendency in his/her response (
Figure S2). Therefore, this response should be evaluated on a scale from very important (5) to not at all important (1), with slightly important representing the BCS and not at all important representing the WCS, as illustrated in
Table 8.
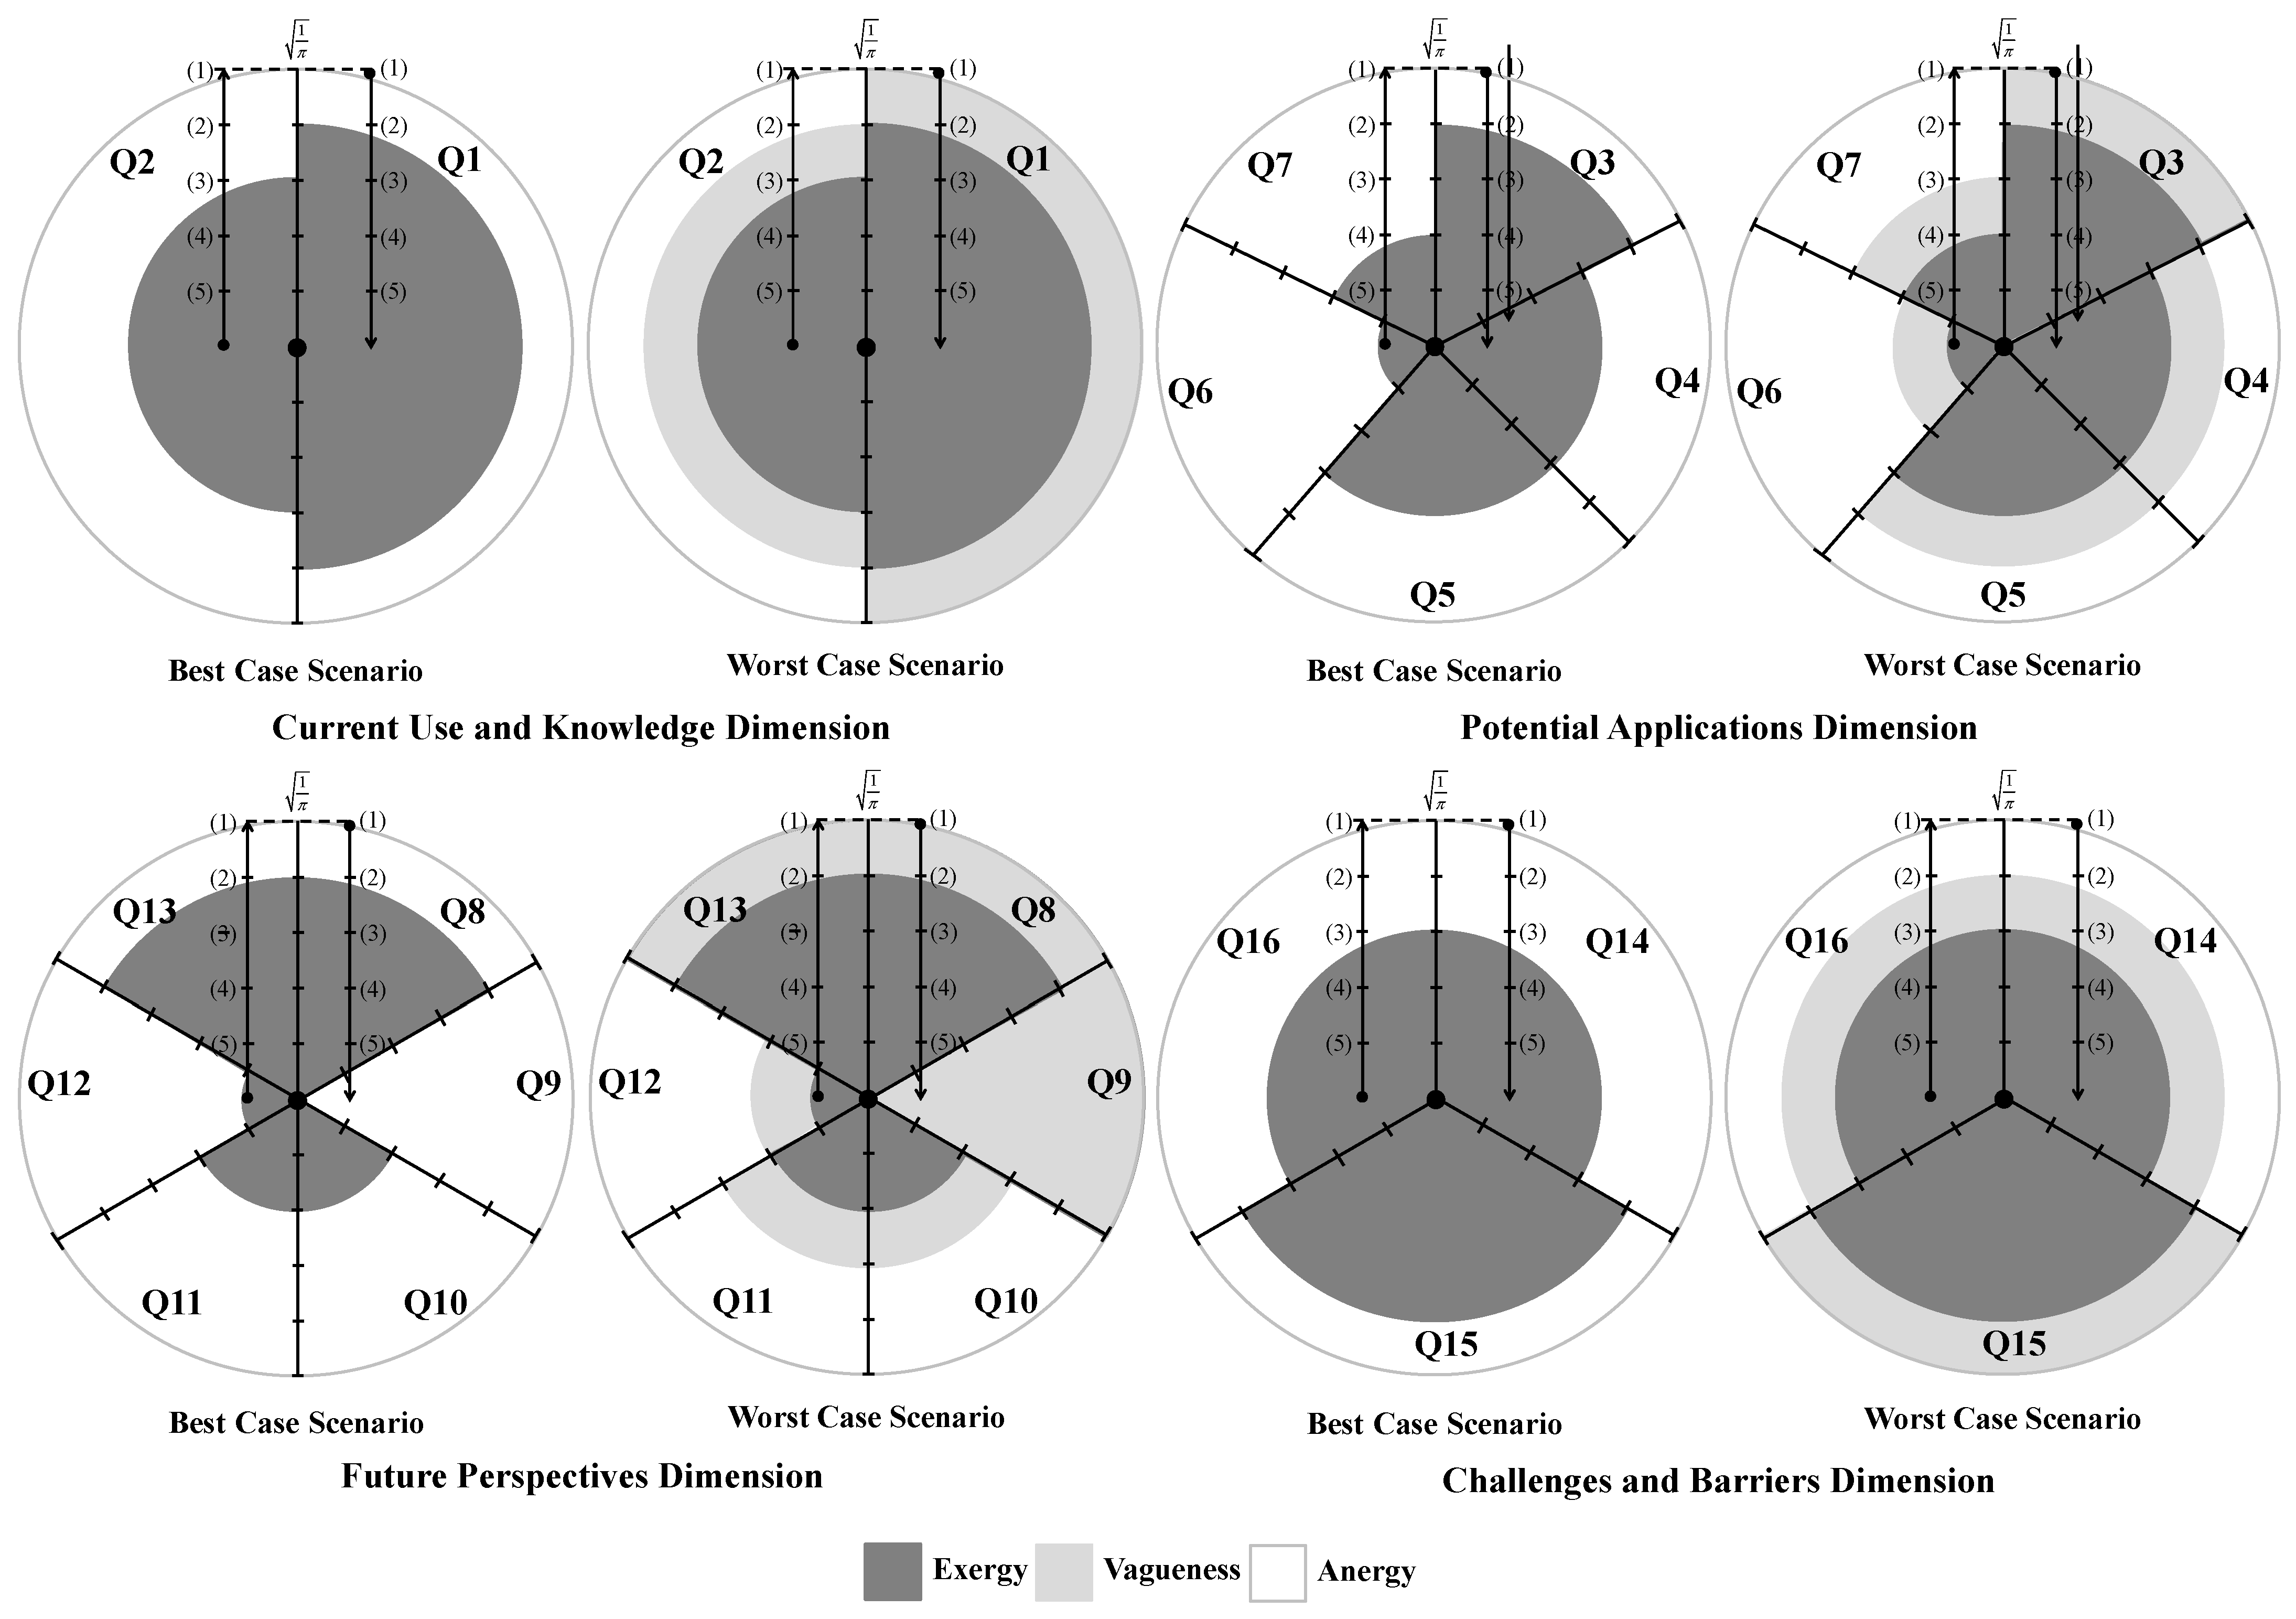
Figure 2 displays participant one’s month 0 responses visually. The darkest regions correspond to exergy, signifying high-energy or useful energy states. The grey portions denote vagueness, indicating uncertainty or undefined energy levels, and the white areas represent anergy, corresponding to unavailable energy to perform work [
21,
22,
23]. Due to the symmetry of the nine-point Likert scale, it can be read in two directions, i.e., from the left toward the center, indicating a decline in participant responses, or from the center toward the right, indicating improvement in those responses. Thus, the axis labels in
Figure 2 should be understood as follows:
Bottom to top (from the most positive to the least positive response): this signifies increasing entropy and a corresponding decline in system performance;
Top to bottom (from the least positive to the most positive response): this reflects decreasing entropy and an enhancement in system performance.
Figure 2.
Diagrammatic representation of the participant one responses to questions Q1–Q16, grouped by dimensions, at month 0, in the best-case and worst-case scenarios. (1), (2), (3), (4), and (5) denote, respectively, not at all important, slightly important, marginally important, important, and very important. The dark, grey, and white colored areas correspond to exergy, vagueness, and anergy.
The colored zones in
Figure 2 correspond to circular regions. The darkest areas denote exergy, while the gray and white annular regions represent vagueness and anergy, respectively. Responses are plotted along a radial axis scaled to
and divided into five equal intervals, corresponding to radii of
. Exergy (the dark regions) is quantified by applying the standard area formula for a circle (Equation (1)), using the appropriate radius values.
where
represents the number of questions per dimension (i.e.,
and
for the CUKD, PAD, FPD and CBD, respectively), and
denotes the radius corresponding to the most positive response.
In the case of vagueness (grey zones), only the most positive response is considered in the BCS, resulting in no vagueness, i.e., zero. In the WCS, both the highest and lowest responses are included, forming a ring-shaped region. Its area is calculated using the annulus formula:
where
represents the number of questions per dimension,
denotes the outer circle’s radius and
denotes that of the inner circle. Consequently,
corresponds to the radius linked to the most positive response, while
corresponds to that associated with the least positive response.
In the case of anergy (white zones), the relevant portion also forms a ring-like region. The outer radius is fixed at . In the BCS, the inner radius matches the radius associated with the most favorable response, whereas under the WCS, r corresponds to the radius of the least favorable response. The area of this region is then determined using the annulus formula (Equation (2)).
4.5.1. Assessing the Entropic State of Participants for the Best-Case Scenario
The responses of participant one to FPD at month 0 will be used to exemplify the valuation of the colored regions present in
Figure 2 for the BCS. Therefore, for this dimension, one may have:
In questions Q8 and Q13, the options slightly important and not at all important were considered (
Table 8), so
and
(
Figure 2);
In question Q9, the option I don’t know was selected corresponding to a vague situation (
Table 8), so
and
(
Figure 2); and
In questions Q10 and Q11, the options important and marginally important were considered (
Table 8), so
and
(
Figure 2).
In question Q12, the options very important and important were considered (
Table 8), so
and
(
Figure 2).
The quantification of the colored regions presented in
Figure 2 for FPD, at month 0, for both scales (ranging from very important (5) to not at all important (1) and vice versa) are shown in
Table 9 for the BCS.
Hence, for participant one, the global values of exergy, vagueness, and anergy regarding FPD in the BCS are computed using the values from
Table 9 on the scale from very important (5) to not at all important (1), as follows:
while, for the scale from not at all important (1) to very important (5), the values are:
Using the same framework described earlier, the values of exergy, vagueness, and anergy can be determined for each participant. For participant one, the corresponding values related to each dimension examined (i.e., CUKD, PAD, FPD, and CBD) are displayed in
Table 10 for the BCS.
4.5.2. Assessing the Entropic State of Participants for the Worst-Case Scenario
For the WCS, computing the areas highlighted in
Figure 2 requires taking into account both the most and least positive responses. Accordingly, for participant one, the numerical values corresponding to the areas highlighted in
Figure 2 for CUKD at month 0, for both rating scales (from very important (5) to not at all important (1), and vice versa), are shown in
Table 11.
Table 12 presents the exergy, vagueness, and anergy values for each dimension analyzed (i.e., CUKD, PAD, FPD, and CBD).
4.5.3. Case Study’s Formal Description
Logic-based programming is an approach that utilizes deductive reasoning to address problems, focusing on generating support for a specific hypothesis. This approach forms the basis for a symbolic interpretation of the entropic state (ES), defined as the sum of exergy and vagueness
, and generates a multi-valued logic system in which truth values range from 0 to 1 [
21,
22]. Thus, the formal representation of the participants’ responses applying LP can now be introduced. Program 1 refer to participant one’s responses grounded on the data figured in
Table 10 concerning the BCS, whereas Program 2 offers the equivalent formulation for the WCS, utilizing the information found in
Table 12.
Program 1. The formal representation of the participant one’s responses for the best-case scenario at month 0, applying logic programming.
| { |
| /* The sentences below state that the extending of predicates cukd5–1, cukd1–5, pad5–1, pad1–5, fpd5–1, fpd1–5, cbd1–5, and cbd1–5, are based on explicitly specified clauses and those that cannot be dropped */ |
| { |
|
|
|
|
| } |
| { |
|
|
|
|
| } |
| { |
|
|
|
|
| } |
| { |
|
|
|
|
| } |
| { |
|
|
|
|
| } |
| { |
|
|
|
|
| } |
| { |
|
|
|
|
| } |
| { |
|
|
|
|
| } |
| } |
Program 2. The formal representation of the participant one’s responses for the worst-case scenario at month 0, applying logic programming.
| { |
| /* The sentences below state that the extending of predicates cukd5–1, cukd1–5, pad5–1, pad1–5, fpd5–1, fpd1–5, cbd1–5, and cbd1–5, are based on explicitly specified clauses and those that cannot be dropped */ |
| { |
|
|
|
| } |
| { |
|
|
|
| } |
| { |
|
|
|
| } |
| { |
|
|
|
| } |
| { |
|
|
|
| } |
| { |
|
|
|
| } |
| { |
|
|
|
| } |
| { |
|
|
|
| } |
| } |
As a result, the ES of the participants in the BCS can be assessed based on their responses collected over a six-month period. The evolution of the participants’ ES is determined by proving theorems 1 and 2.
Theorem 1. Scale (5) to (1). |
|
| , |
|
Theorem 2. Scale (1) to (5). |
|
| , |
|
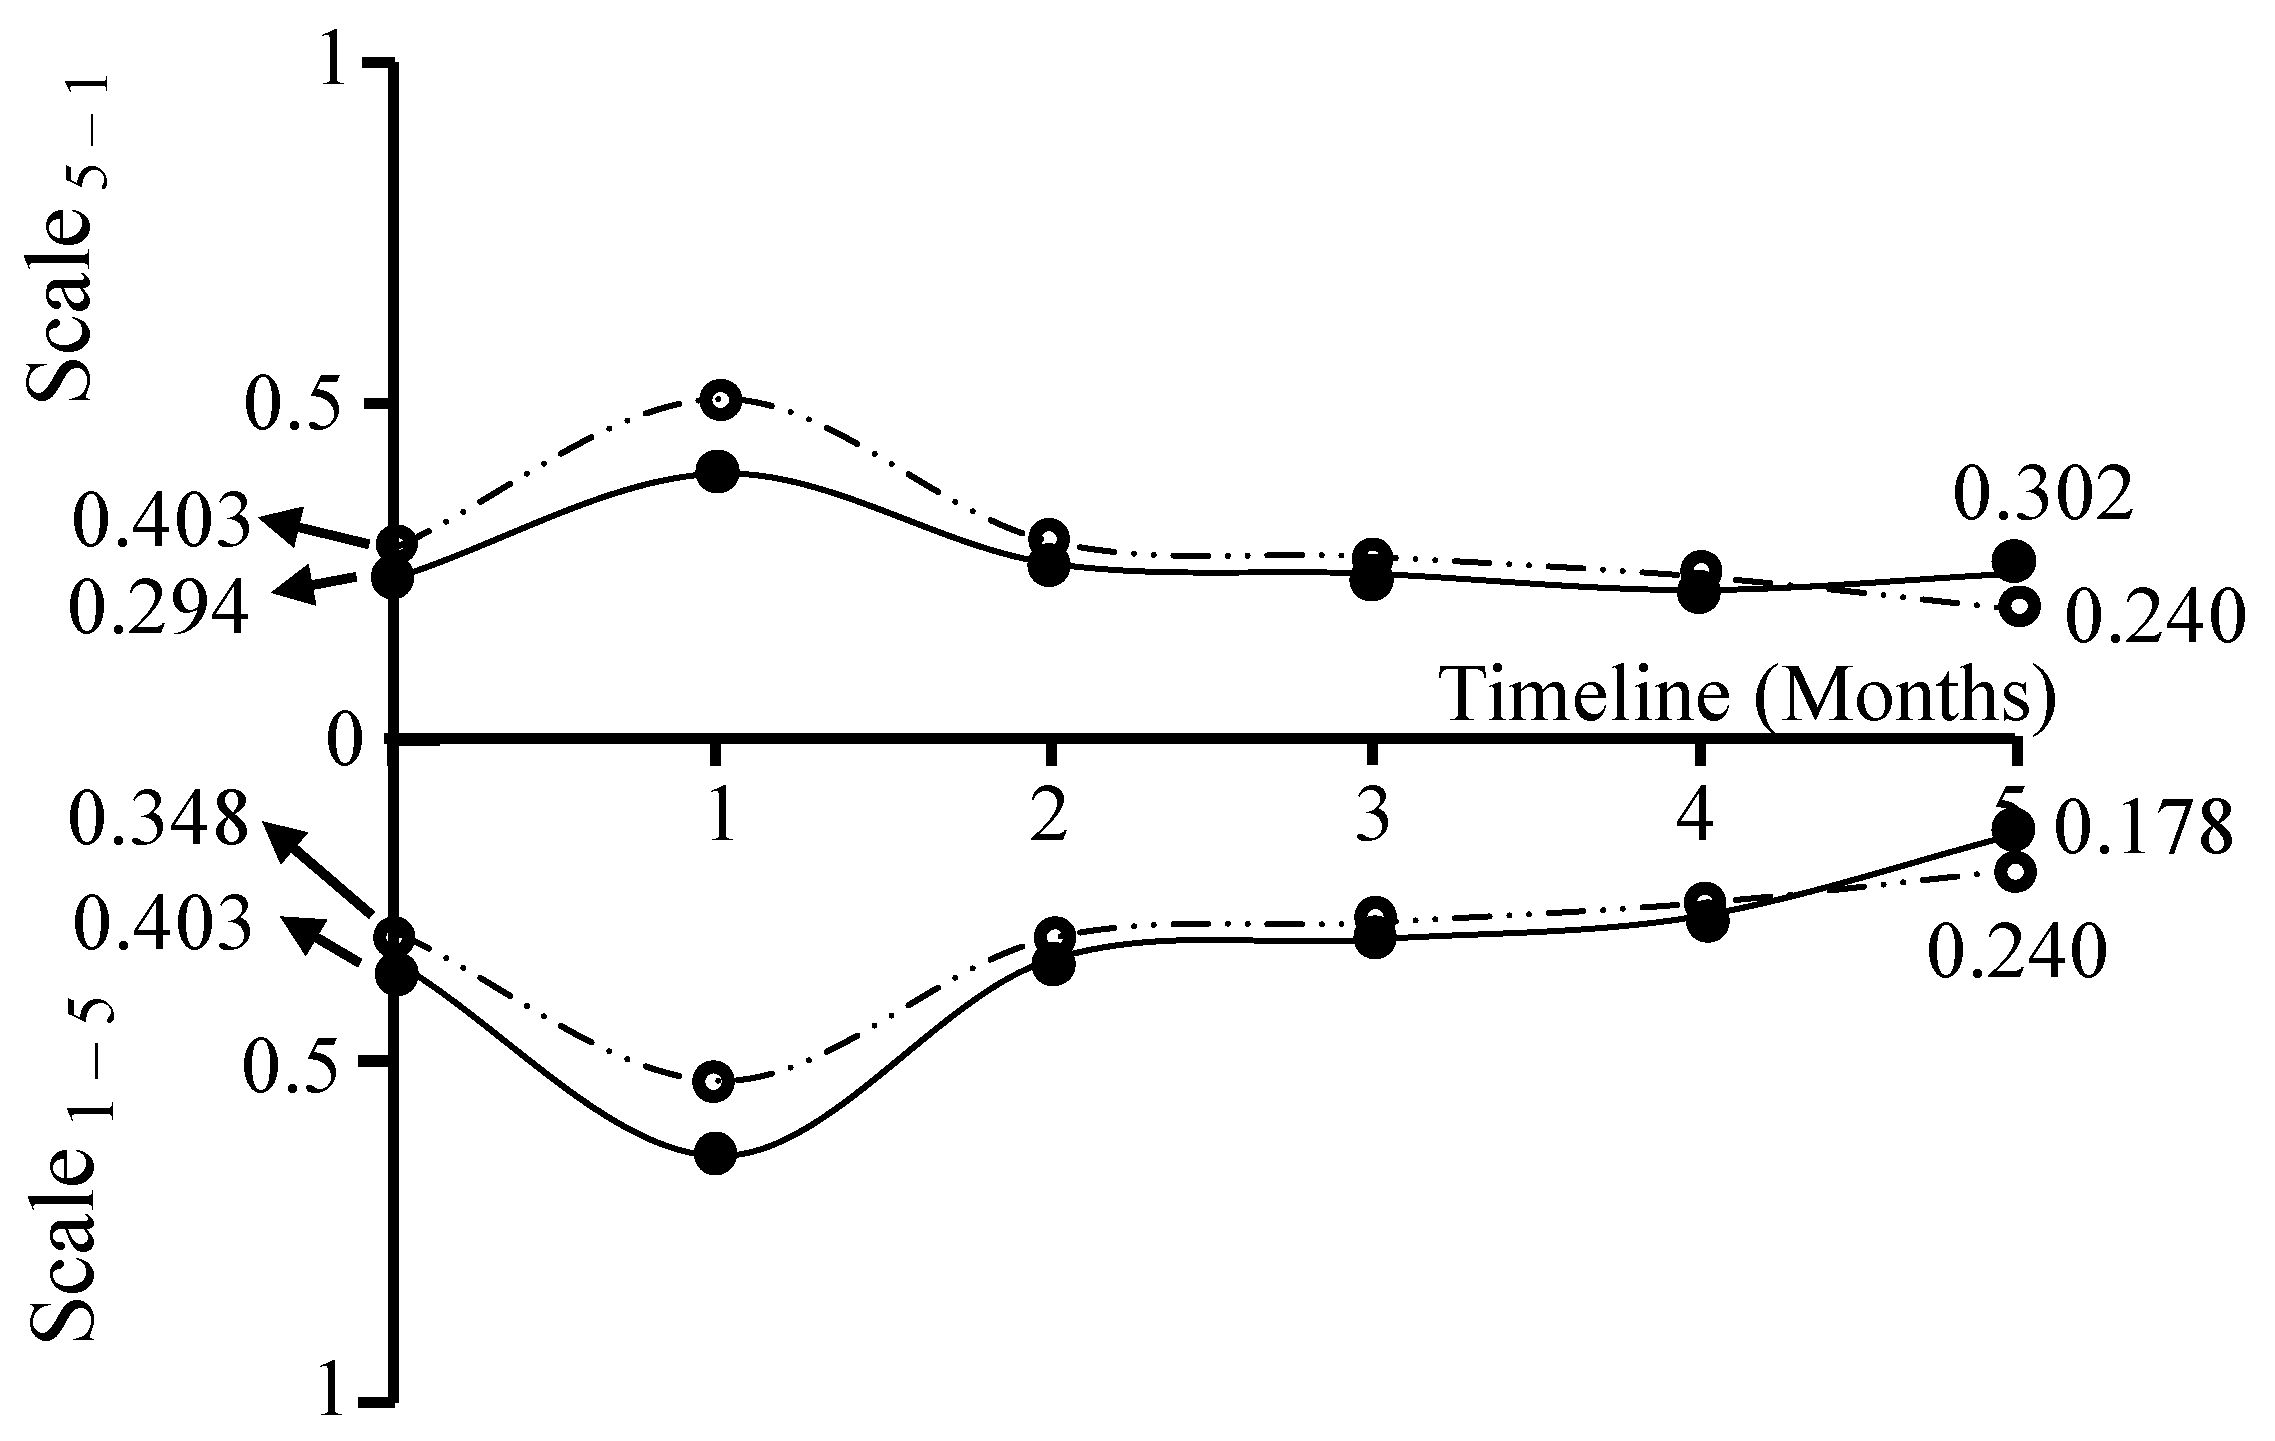
As shown in the timeline present in
Figure 3 and Program 1, it is possible to track and anticipate the evolution of the participants’ ES [
21,
22]. Predictive analysis based on mathematical proof enables the examination of all possible combinations of terms or clauses associated with the extensions of the predicates CUKD, PAD, FPD, and CBD. The total number of these combinations can be determined using Equation (3):
where
is the predicate extension combination subset.
Throughout the six-month duration of the study, data was gathered on a monthly basis. Calculations for the subsequent months are omitted here, as they follow the same structure as those illustrated for the month 0.
Figure 3 displays the outcomes derived from applying the previously discussed theorems to the participants’ responses across the study period for the BCS. The output of Theorem 1 is mapped along a scale ranging from 5 to 1, while Theorem 2 is represented on a scale from 1 to 5. This graphical representation reveals key trends in the participants’ ES under both evaluation scales.
The calculation of overall entropic state (OES), based on participants’ responses to the questionnaire over the study period, is carried out using Equation (4):
here, ES denotes the entropic state, defined as the sum of exergy and vagueness. The overall entropic state (OES) reflects the ES values linked to the catch-all clause, which includes all individual terms (
Table 10). Accordingly, the values for months 0 and 5 are calculated as follows.
When the ES approaches zero (low entropy), the resulting OES value is also low, indicating that the integration of GAI in C) is viewed as beneficial for diagnosis, treatment planning, and procedural accuracy. In contrast, when the OES is close to one (high entropy), it reflects a less favorable perception of GAI integration in CD. The patterns shown in
Figure 3 reveal a decline in OES from the beginning of the study to month 1, followed by a tendency towards improvement. This improvement pattern may be attributed to the fact that dental practitioners may initially encounter challenges integrating GAI into clinical workflows. These hurdles often stem from the steep learning curve associated with new AI-based digital tools—as has been seen with CAD/CAM systems in restorative dentistry—and the technical complexity of embedding AI software and hardware into existing practice management and imaging workflows [
24]. However, as clinicians and staff gradually build familiarity and digital literacy, and as software and infrastructure mature with better interoperability and tailored interfaces, these issues tend to fade—eventually enabling seamless AI-aided diagnostics, treatment planning, and procedural precision in everyday practice [
25,
26].
In the context of the WCS, one can also assess ES of the participants by analyzing their responses collected over a six-month period (
Figure 4). Their development over time is established through the validation of theorems 1 and 2, using the data related to the WCS shown in
Table 12 for month 0.
In the WCS, the OES at months 0 and 5 is quantified as follows:
The trend shown in
Figure 4 resembles that observed in the BCS (
Figure 3). However, in the WCS, this pattern is more pronounced due to comparatively higher OES values. By applying the appropriate data, the progression of ES can be analyzed for each dimension (
Table 10 and
Table 12) or each question (
Table 9 and
Table 11) using the same approach. Targeted evaluations can also be conducted for specific professional groups by using only their responses. However, a sufficiently large sample is required to ensure reliable outcomes.
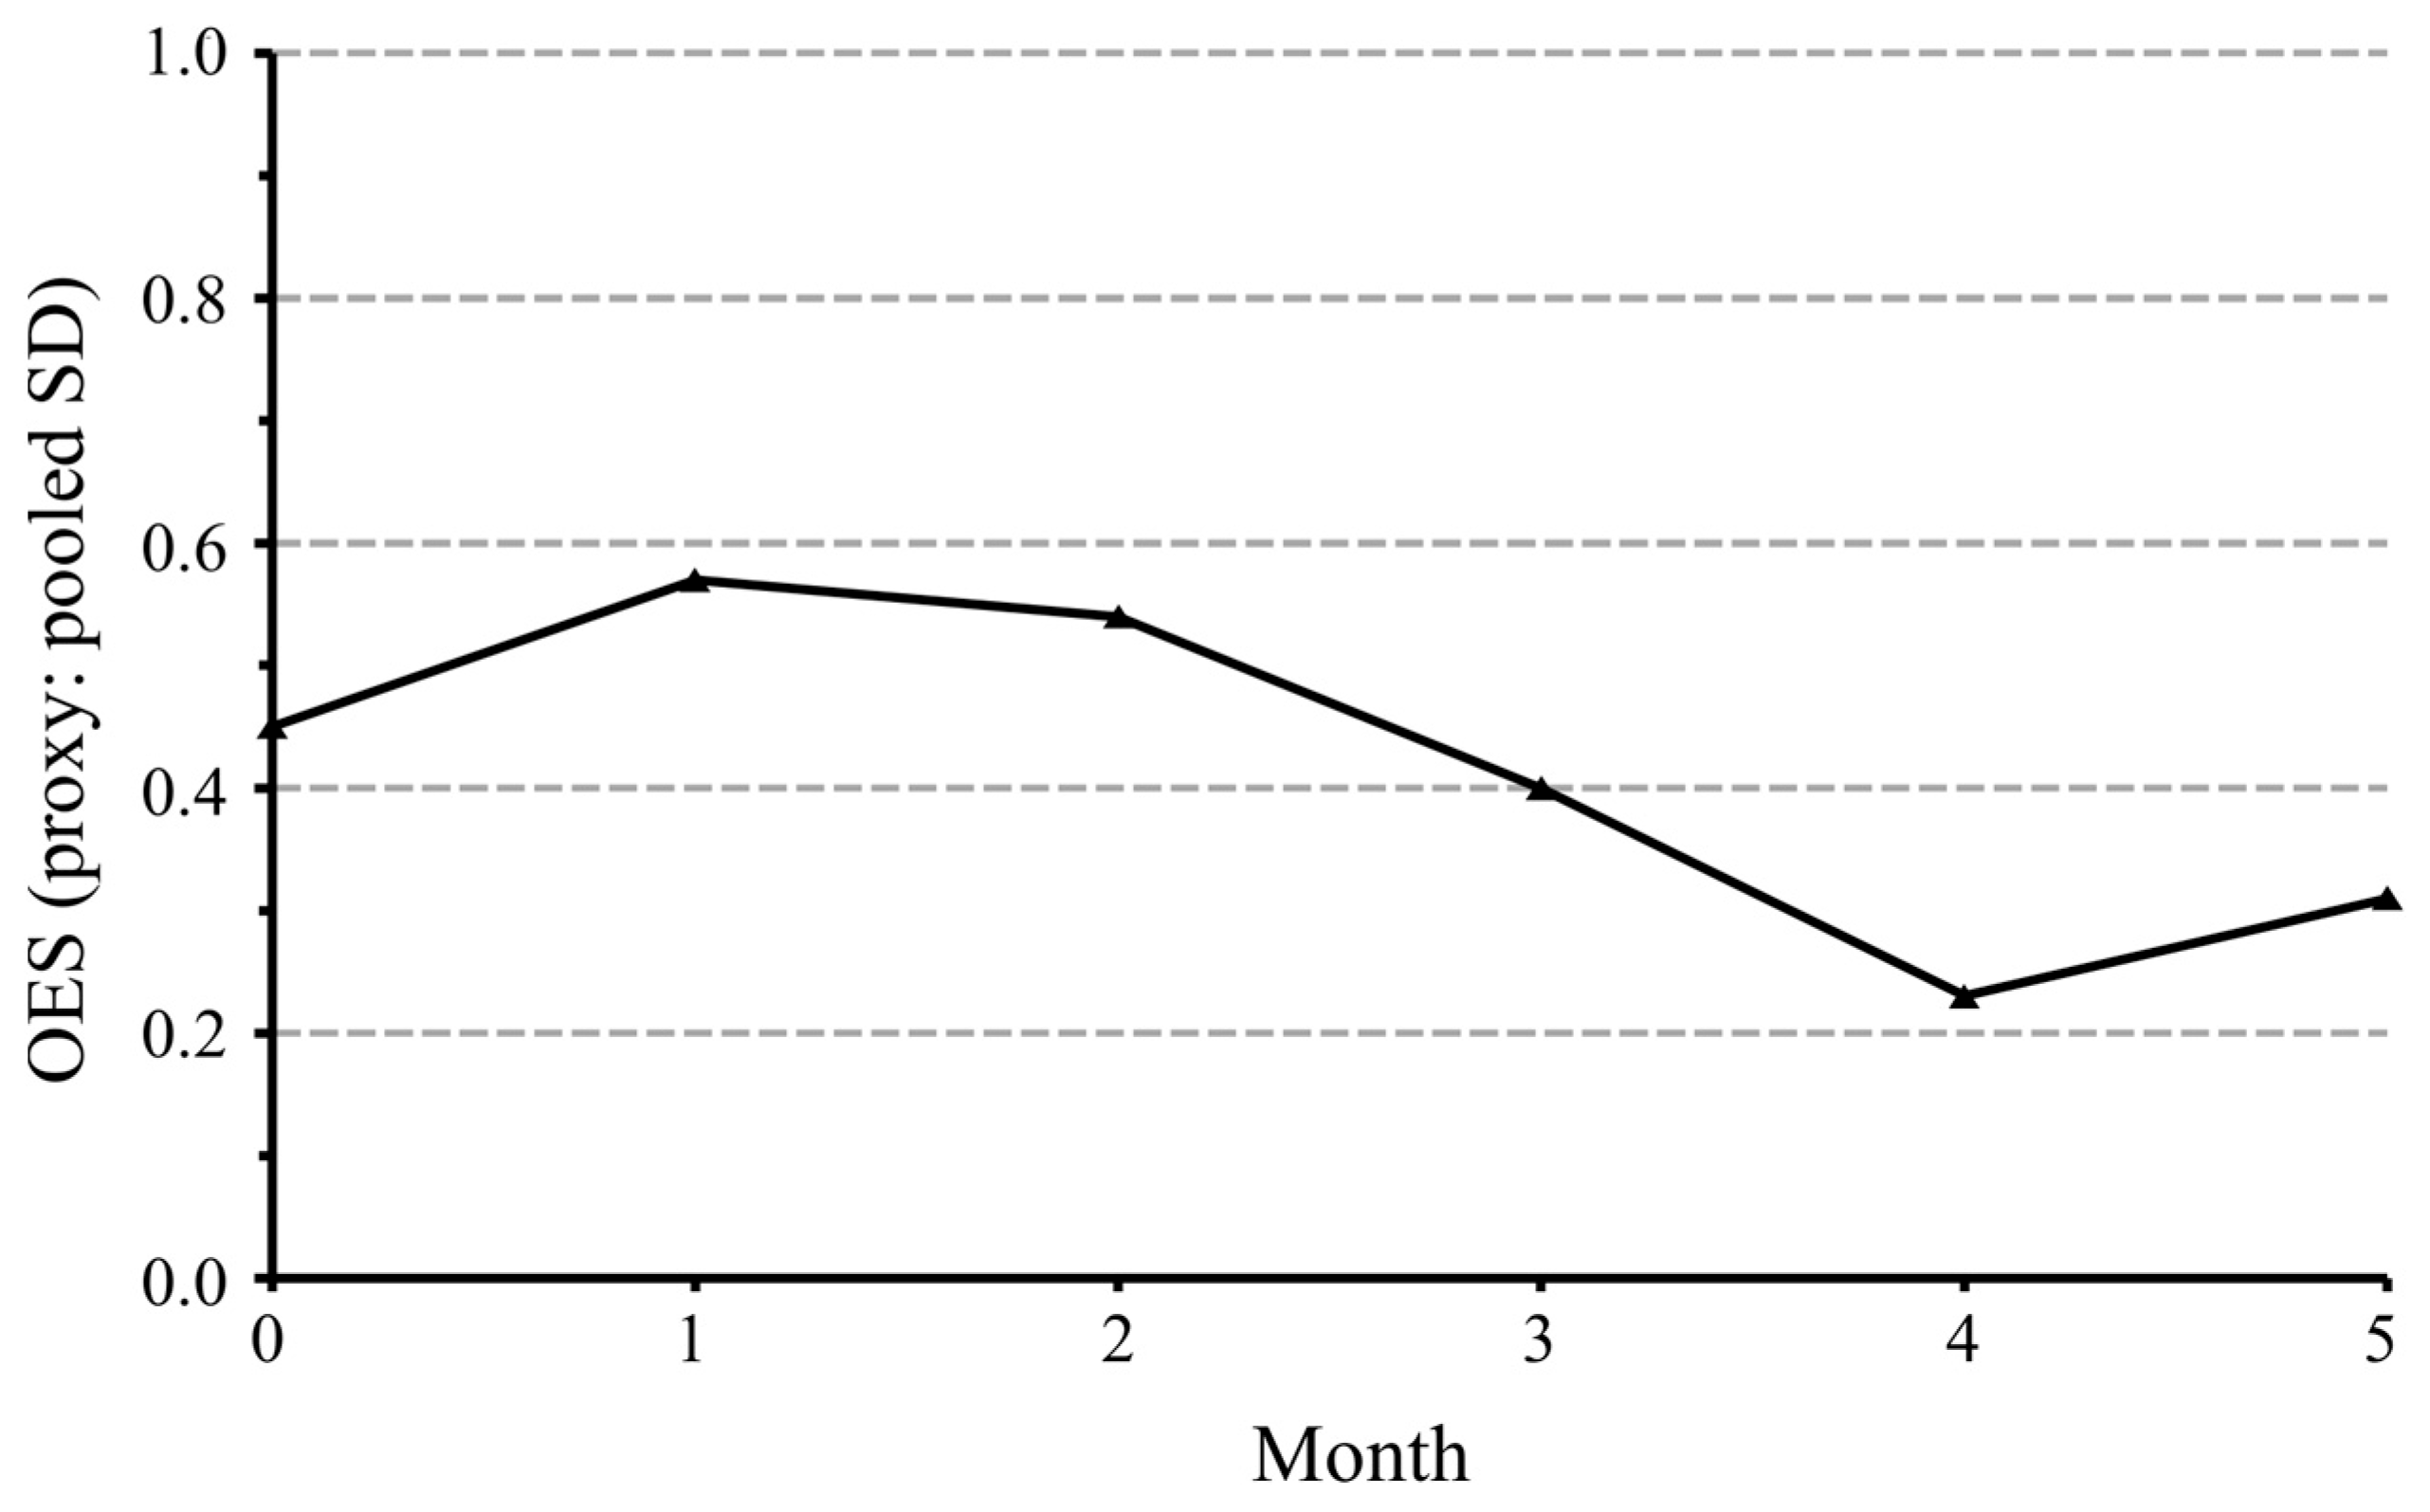
The results obtained using entropy modeling aligned with the classical statistics, namely:
The Overall Entropic State (OES) decreased from 0.43 at baseline to 0.31 at month 5 (
p = 0.018) (
Figure 5).
This reduction indicates that dentists’ perceptions became more consistent and less uncertain as the study progressed.
The triangulation between narrower confidence intervals (statistical results) and declining OES (entropy analysis) strengthens the conclusion that attitudes toward GAI grew clearer and more favorable over time.


