Article

Biogenic Carbon Dots from Hematoxylin with Photodynamic Antimicrobial Action

1
Department of Bioengineering, Faculty of Engineering, Canakkale Onsekiz Mart University, Terzioglu Campus, Canakkale 17100, Turkey
2
Department of Chemistry, Faculty of Sciences, Canakkale Onsekiz Mart University, Terzioglu Campus, Canakkale 17100, Turkey
3
Department of Chemical Engineering, Faculty of Engineering, Canakkale Onsekiz Mart University, Canakkale 17100, Turkey
4
Department of Bioengineering, U. A. Whitaker College of Engineering, Florida Gulf Coast University, Fort Myers, FL 33965, USA
*
Authors to whom correspondence should be addressed.
BioChem 2026, 6(3), 26; https://doi.org/10.3390/biochem6030026
Submission received: 9 July 2026 / Revised: 27 August 2026 / Accepted: 2 September 2026 / Published: 7 September 2026
(This article belongs to the Special Issue Feature Papers in BioChem, 3rd Edition)

Abstract

Background/Objectives: Carbon dots (CDs) are fluorescent carbon-based nanomaterials attracting considerable attention recently because of their high photostability, tunable luminescence characteristics, low toxicity, and versatile surface chemistry. In this study, Hematoxylin (HT), a naturally occurring phenolic aromatic compound used as a histological staining dye, abundant in hydroxyl functional groups, was selected as a sustainable precursor for CD synthesis. The intrinsic fluorescence and favorable carbonization characteristics of HT are also value-added advantages for CDs. Methods: The use of citric acid (CA) during synthesis improves fluorescence behavior, colloidal stability, and biological performance of CDs. HT-based CDs prepared via the bottom-up synthesis method employing the hydrothermal technique as multifunctional fluorescent materials were also evaluated for potential bioimaging and light-activated antimicrobial applications. Results: The obtained HT-based CDs displayed good aqueous dispersion properties. HT CDs had a hydrodynamic diameter of 115 ± 1 nm and showed a fluorescence emission intensity of 5181 a.u. at λem = 329 nm when excited at λex = 300 nm. In contrast, HT:CA CDs prepared at a 1:1 HT-CA weight ratio had a hydrodynamic diameter of 310 ± 19 nm and exhibited a significantly higher fluorescence emission intensity, e.g., 31,840 a.u. at λem = 332 nm when excited at λex = 300 nm. Antioxidant studies of HT CDs and HT CDs using four different assays revealed that the antioxidant capacity of HT was partially retained and exhibited a concentration-dependent response. Notably, HT:CA CDs demonstrated significantly enhanced antimicrobial performance under UV-A irradiation compared to HT CDs, with bacterial cell viability calculated as 13 ± 4% for HT:CA CDs and 59 ± 2% for HT CDs. Moreover, HT CDs and HT:CA CDs demonstrated significantly enhanced cytocompatibility on the L929 fibroblast cell line, high cell viability up to 200 μg/mL, versus toxic HT molecules even at 100 μg/mL. Conclusions: HT-based CDs, particularly HT:CA CDs, demonstrated favorable fluorescence, antioxidant, antimicrobial, and cytocompatibility properties, supporting their potential application as multifunctional fluorescent materials for bioimaging and light-activated antimicrobial applications.

Graphical Abstract

1. Introduction

Carbon dots (CDs) are a class of fluorescent carbon-based nanomaterials that have attracted considerable attention due to their excellent photostability, tunable luminescence, low toxicity, biocompatibility, and versatile surface chemistry [1,2]. Owing to these unique properties, CDs have been extensively investigated for applications in bioimaging, sensing, drug delivery, photocatalysis, theranostics, and antimicrobial technologies [3,4,5]. The continuing emergence of bacterial resistance further highlights the need for new antibacterial agents and alternative antimicrobial strategies [6]. Compared with conventional semiconductor quantum dots, carbon dots exhibit lower toxicity and greater environmental compatibility, making them highly promising candidates for biomedical and environmental applications [7,8,9].
In recent years, the use of naturally occurring organic molecules and biomass-derived precursors for CD synthesis has been an attractive strategy to improve sustainability while introducing functional surface groups that enhance optical properties and bioavailability [10,11,12,13,14]. The molecular structure of the precursor plays a key role in determining the physicochemical and coloring properties of the resulting carbon dots. Therefore, aromatic compounds and coloring precursors are increasingly being investigated to produce CDs with adapted optical properties and improved biological function. The coexistence of antioxidant and antibacterial activities has also been reported for natural polyphenol-rich materials, supporting the potential of bioactive natural precursors for multifunctional applications [15]. CDs can function as photosensitizers in photodynamic therapy by being excited over a broad spectral range from the ultraviolet to the near-infrared. These photosensitizers are chemical agents that can absorb light at the appropriate wavelength, generating reactive oxygen species (ROS) [16,17]. In particular, the UV-induced oxidase-like activity of CDs is shown to be a major contributor to bacterial inhibition and antimicrobial activity [18].
Hematoxylin (HT) is a naturally occurring phenolic compound isolated from the heartwood of the logwood tree, Haematoxylum campechianum [19]. Due to its flavonoid, aromatic structure, and strong affinity for nucleic acids and cell nuclei, HT has been widely employed as a histological staining agent, particularly in hematoxylin–eosin (H&E) staining [20,21]. HT possesses intrinsic fluorescence arising from its conjugated aromatic system and oxidation products, making it an attractive candidate for fluorescence-based imaging and sensing applications [22]. Also, it has pharmacological effects, including antibacterial, anticoagulant, and anticancer activities [19,23]. Its polyphenolic structure, rich in hydroxyl groups and conjugated π-electron systems, can also provide favorable conditions for carbonization and graphitic domain formation during CD synthesis. These structural features can contribute to enhanced fluorescence emission, colloidal stability, and biological interactions [24]. Despite the widespread use of hematoxylin in histopathology, studies focusing on hematoxylin-derived carbon dots remain limited. The development of fluorescent nanomaterials originating from histological dyes is particularly interesting because such systems may combine the intrinsic biological affinity of the parent dye with the advantageous optical properties of CDs [14,25]. Furthermore, incorporation of HT into nanostructured systems may reduce the concentration-dependent cytotoxicity and stability limitations associated with free hematoxylin while improving its fluorescence performance and biomedical applicability.
Recent studies have shown that hematoxylin exhibits excitation-dependent fluorescence behavior that can be exploited in optical sensing and fluorescence imaging when integrated into carbon nanomaterials. Carbon dots are typically nanoscale carbon-based particles smaller than 10 nm and are known to exhibit photocatalytic and photodynamic antimicrobial activity under UV-light irradiation [26,27,28]. Upon photoexcitation, CDs generate reactive oxygen species (ROS), including hydroxyl radicals (•OH), superoxide radicals (O2), and singlet oxygen (1O2) [29]. Recent work has likewise demonstrated antibacterial activity of nitrogen-doped carbon dots against Enterococcus faecalis, further supporting the potential of carbon-dot-based materials as antimicrobial platforms [30]. These ROS induce oxidative stress in bacterial cells by damaging cellular membranes, proteins, and nucleic acids, ultimately leading to bacterial death. This mechanism, commonly referred to as photodynamic antimicrobial action, offers several important advantages, including broad-spectrum antimicrobial activity, low toxicity, reduced likelihood of antimicrobial resistance, and tunable surface functionality [31,32,33].
Consequently, photodynamically active CDs have attracted growing interest for applications in wound dressings, antimicrobial coatings, medical implants, water disinfection, food packaging, and biofilm eradication technologies. Previous studies have demonstrated that photoexcited carbon dots efficiently generate ROS and exhibit strong antibacterial activity against microorganisms such as Escherichia coli under UV and visible-light irradiation [29,34]. Therefore, the present study focuses on the synthesis and characterization of hematoxylin-derived carbon dots (HT CDs) and citric acid-added carbon dots (HT:CA CDs). To our knowledge, this study is the first to report the synthesis and characterization of carbon dots derived from hematoxylin, a natural polyphenol precursor. Furthermore, citric acid was incorporated into the structure as a co-precursor to enhance the surface functionalization, e.g., more oxygen-containing functional groups on the CDs to increase biocompatibility as well as fluorescence intensity and improve overall antimicrobial/photodynamic activity. The physicochemical, optical, fluorescence, and surface properties of the synthesized nanomaterials were systematically evaluated. In addition, their UV-triggered photodynamic antimicrobial activities were investigated to determine the influence of surface modification on ROS-mediated bacterial cell viability. The findings provide new insights into the utilization of hematoxylin as a sustainable and functional precursor for the development of fluorescent, biocompatible, and photoactive carbon dots with potential applications in bioimaging, sensing, and antimicrobial systems.

2. Materials and Methods

2.1. Materials

Hematoxylin Crystalline (HT, Fisher Chemical, 85%, Geel, Belgium) and Citric acid monohydrate (CA, Carlo Erba, >99%, Val-de-Reuil, France) were used to prepare HT-based CDs. In the antioxidant activity determination studies, Copper (II) chloride, anhydrous, (99%, Acros-Organics, Geel, Belgium)), neocuproine (≥99%, HPLC, AFG Bioscience, Northbrook, IL, USA), ammonium acetate (for analysis-ACS-Reagent, Carlo Erba, Val-de-Reuil, France) for CUPRAC assay and 2,4,6-tris(2-pyridyl)-s-triazine (TPTZ, >99%, Sigma-Aldrich, Buchs, Switzerland), Iron(III) Chloride hexahydrate (FeCl3·6H2O, >99%, Acros Organics, Geel, Belgium) for FRAP assay. Sodium nitrite (NaNO2, extra pure, Merck, Darmstadt, Germany) and aluminum chloride (AlCl3, 98%, Merck, Darmstadt, Germany) were used to determine the total flavonoid content. Folin–Ciocalteu reagent (FC, 2 N, Sigma-Aldrich, Schaffhausen, Switzerland) and sodium carbonate (Na2CO3, 99%, Fisher Scientific, Schwerte, Germany) were used to determine total phenolic content. Staphylococcus aureus (ATCC 6538) bacterial strains KWIK-STIKTM (Saint Cloud, MN, USA). Nutrient agar (for microbiology), potato dextrose agar (for microbiology), and nutrient broth (for microbiology) were used as is (Condo Lab, Madrid, Spain). For cell culture assays, the L929 fibroblast cell line (L929/An2 Mouse C3/A connective tissue) was from a local vendor (ŞAP Institute, Ankara, Turkey). Dulbecco’s Modified Eagle’s Medium (DMEM) (4500 mg/L glucose, 3.7 g/L sodium pyruvate, and 0.5 g/mL L-Glutamine, PanBiontech, GmbH, Germany), fetal bovine serum (FBS, heat-inactivated, PanBiontech, GmbH, Germany), and trypsin-EDTA (0.25%, PanBiontech, GmbH, Aidenbach, Germany) were used as cell culture media. The 3-(4,5-dimethylthiazol-2-yl)-2,5-diphenyltetrazolium bromide (MTT, neoFroxx, A GmbH, Hesse, Germany) was used for cell viability analysis. Dimethyl sulfoxide (DMSO, 99.9%, Carlo-Erba, Val-de-Reuil, France) was used as received.

2.2. Synthesis of HT-Based CDs

HT-based CDs were prepared using the hydrothermal technique, a bottom-up synthesis method, following the literature [35]. Briefly, 0.5 g of HT was dissolved in 20 mL of distilled water (DI) and stirred at room temperature at 500 rpm for 10 min. The resulting mixture was then transferred to a 50 mL Teflon-lined reaction chamber, which was placed inside a stainless-steel autoclave. The autoclave was placed in an oven, and after heating from room temperature to 160 °C at a rate of 10 °C/min, it was held at 160 °C for 4 h. The supernatant with the brown dispersion was transferred into a cellulose tube dialysis membrane, one end of which was tightly sealed with a plastic cable tie self-lock. The other end of the dialysis membrane was also tightly sealed and washed with 500 mL of distilled water for 4 h by refreshing the wash water every h.
To obtain HT:CA CDs, 0.5 g of CA was dissolved in 20 mL of distilled water, then 0.5 g of HT was added and mixed at room temperature at 500 rpm for 10 min. Afterwards, the same procedure applied to HT CDs was applied to obtain HT:CA CDs. The prepared CDs were labeled as HT CDs and HT:CA CDs. 1 mL of each HT CD and HT:CA CD taken from the dialysis membrane was precipitated separately in 20 mL of acetone. The supernatant was discarded, and the remaining portion was dried overnight in an oven at 50 °C and used for further studies.

2.3. Characterization of HT-Based CDs

HT-based CDs were characterized by Fourier Transform Infrared Spectroscopy (FT-IR, Thermo Fisher Scientific, WI, USA) for functional group analysis and with thermogravimetric analysis (TGA, Exstar SII TG/DTA 6300, Kyoto, Japan) for thermal stability. For FT-IR analysis, all the spectra were collected with ATR sampling at a resolution of 4 cm−1 and a frequency range of 4000–650 cm−1. In the TGA analysis, about 3 mg of the sample was placed into a ceramic pan, and thermal measurements were performed in two steps. In the first step, the moisture was removed from the samples by heating them between 25 and 100 °C under nitrogen gas at a flow rate of 100 mL/min with increments of 10 °C/min. Subsequently, the thermal stability of the samples was measured in terms of remaining weight with respect to initial weight between 100 and 600 °C at the temperature increase and nitrogen gas flow rate mentioned above.
Zeta potential measurements were performed using a zeta potential analyzer (Anton-Paar, Graz, Austria) for 40 mg of HT CDs and HT:CA CDs suspended in 40 mL of 10 mM KCl solution. Also, the size measurements of HT CDs and HT:CA CDs were carried out using the same particle suspension solution via Dynamic Light Scattering (DLS, Anton-Paar, Graz, Austria) in a 10 mM KCl solution.
The optical properties of HT-based CDs were determined by Fluorescence Spectroscopy (Lumina, Thermo Fisher Scientific, Waltham, MA, USA) using CD sample solutions prepared in DI water at various concentrations ranging from 100 to 2000 µg/mL. The fluorescence emission spectra of the samples were recorded in the emission wavelength range (λem) of 270–600 nm using excitation wavelengths (λex) varying from 270 to 315 nm and under 700 PMT voltage.

2.4. Antioxidant Activity

The antioxidant capacity of bare HT and HT-based CDs was assessed using colorimetric methods such as Total phenolic content (TPC) and Total Flavonoid Content (TFC). The antioxidant activity of bare HT and HT-based CDs was investigated using electron transfer-based methods such as Copper (II) reducing antioxidant capacity (CUPRAC) and Ferric (III) reducing antioxidant power (FRAP) assays.

2.4.1. Total Phenolic Content (TPC)

TPC was determined using the Folin–Ciocalteu method with some modifications based on literature reviews [33,36]. First, aqueous solutions of HT, HT CDs, and HT:CA CDs were prepared at various concentrations of 125–1000 µg/mL. Then, 100 µL of each sample was transferred to separate test tubes. Next, 1.25 mL of 0.2 N Folin–Ciocalteu reagent solution was added to the samples, vortexed, and allowed to stand for 4 min. After four minutes, 1 mL of 0.7 M sodium carbonate was added to the samples. The samples were incubated at room temperature in a dark environment for 2 h. At the end of this period, absorbance values at a wavelength of 760 nm were determined using a UV-Vis spectrophotometer (UV-Vis, T60, PG Instruments, Leicestershire, UK). A standard phenolic compound was used in the TPC calculation, and in this study, gallic acid was chosen as the standard. Each sample was tested in triplicate, and the results are given as standard deviation and µg/mL gallic acid equivalent.

2.4.2. Total Flavonoid Content (TFC)

The TFC of the bare HT and HT-based CDs was quantitatively determined using the standard protocol with minor revisions [33]. In short, 0.5 mL of naked HT or HT CDs or HT:CA CDs at various initial concentrations ranging from 125 to 1000 µg/mL were transferred to test tubes. In each test tube, 0.3 mL of 5% NaNO2 aqueous solution was added and allowed to stand for 5 min. After 5 min, 0.3 mL of 10% AlCl3 aqueous solution and 2 mL of 1 M NaOH aqueous solution were added to the test tubes. The samples were incubated for 15 min at room temperature, and then their absorbance was measured at 510 nm using a UV–Vis spectrophotometer. Catechin was used as the standard, and the results obtained were expressed as catechin equivalent µg/mL.

2.4.3. Copper (II) Reducing Antioxidant Capacity (CUPRAC) Assay

The CUPRAC method was performed following the procedure reported in the literature [37]. The CUPRAC solution, a 10 mM copper(II) solution, a 7.5 mM neocuproin solution, and a 1 M ammonium acetate buffer (pH = 7.0 ± 0.1) were prepared. As working solutions, bare HT or HT CDs, or HT:CA CDs were prepared in 1.1 mL of 1:1 ethanol: water at a final concentration of 50 to 1000 µg/mL. Then, 1.1 mL of the working solution was added to 3 mL of CUPRAC reagent, vortexed, and then incubated at room temperature for 30 min. At the end of this time, the absorbance values of the formed Cu(I)-Nc chelate were measured at 450 nm, the characteristic wavelength of the color, against a reference solution without a sample. In the CUPRAC calculation, Trolox was used as the reference. Each sample was tested in triplicate, and the results are given as Trolox equivalents (µmol TE/mL) and presented as mean ± standard deviation.

2.4.4. Ferric (III) Reducing Antioxidant Power (FRAP) Assay

The FRAP assay was performed according to the method described by Benzie and Strain to evaluate the antioxidant capacities of bare HT, HT CDs, and HT:CA CDs [38]. The reduction of the Fe(III)-TPTZ complex to the ferrous form (Fe(II)-TPTZ) by the antioxidant compounds was monitored spectrophotometrically at 593 nm using UV-Vis spectroscopy. Primarily, a calibration curve at 593 nm was created using standard solutions of FeSO4·7H2O in the initial concentration range of 5–55 ppm, and FRAP values of samples were calculated as µmol Fe(II) equivalents. Briefly, 100 mL of 300 mM acetic acid-sodium acetate buffer was prepared to a pH of 3.6 ± 0.1. Then, a 10 mM TPTZ solution was prepared using 10 mL of 40 mM HCl. Finally, 10 mL of 20 mM FeCl3 solution was prepared. The FRAP reagent was freshly prepared by mixing acetate buffer, TPTZ solution, and FeCl3 solution at a ratio of 10:1:1 (v:v:v). The resulting Fe(III)-TPTZ reagent was incubated in an amber flask for 5 min at room temperature in dark conditions. Bare HT, HT CDs, and HT:CA CDs dispersions prepared in water at initial concentrations ranging from 50 to 1000 µg/mL were used as working solutions. Initially, 3 mL of freshly prepared FRAP reagent was transferred into a test tube and used as the blank solution to autozero the spectrophotometer at 593 nm. Subsequently, 3 mL of FRAP reagent was transferred into each test tube. 0.1 mL of sample solution was added to the FRAP reagent and incubated for 4 min at room temperature under dark conditions. After incubation, the absorbance values of the samples were measured at 593 nm.

2.5. Light-Sensitive Antimicrobial Effects of HT-Based CDs

The photodynamic antimicrobial activity of HT-based CDs upon UV light exposure was determined against the Gram-positive Staphylococcus aureus (ATCC 6538) species. Briefly, 1 mL of an aqueous solution of HT-based CD prepared at a concentration of 1000 µg/mL was added to 1 mL of a bacterial suspension prepared in 0.9% NaCl aqueous solution at a concentration of 1 × 10⁸ CFU/mL (colony-forming units). 1 mL of a bacterial suspension without CD at a concentration of 1 × 10⁸ CFU/mL was used as the control group. The tubes containing the samples were incubated for 30 min under either UV-A irradiation (315–400 nm, UV-A, 300 W, Ostram GmbH, Ultra vitalux, Munich, Germany) or in the dark under otherwise identical conditions. After 30 min, 100 µL of sample was withdrawn from the tubes, inoculated onto solid medium, and incubated at 37 °C for 24 h. The bacterial cell viability (%) at the end of incubation was determined based on colony count and calculated by comparing it to the control group. The experiment was performed in triplicate, and the means and standard deviations are given.

2.6. Cytotoxicity of Bare HT and HT-Based CDs

The toxicity of bare HT and HT-based CDs was determined on the L929 fibroblast cell line. Before analysis, samples were sterilized under UV irradiation at 420 nm for 2 min. Cells were cultured in a CO2 incubator (5% CO2:95% air atmosphere) at 37 °C with DMEM growth medium containing 10% FBS and 1% antibiotics to achieve an 80% cell occupancy rate. Fibroblast cells were then counted, and approximately 5 × 10⁴ cells/well were seeded into a 96-well plate. The samples were incubated in a CO2 incubator at 37 °C for 24 h. The old culture medium was then removed, and 100 µL of HT CDs or HT:CA CDs suspended in DMEM medium at concentrations of 10 to 200 µg/mL were added to the cells. For HT, 100 µL of HT solutions in DMEM medium at concentrations of 50 to 1000 µg/mL were added to the cells. As a negative control, only 100 µL of growth medium was added to the cells in the wells. The plate was incubated for another 24 h under the same conditions for cell growth. At the end of incubation, the samples and medium in the well plate were discarded, and the wells were washed with sterile phosphate buffer solution (PBS). In the presence of samples, in vitro cell viability of fibroblasts was determined by the MTT colorimetric method, which is based on measuring intracellular formazan production in viable cells. For this purpose, 100 μL of 0.5 mg/mL MTT solution (prepared in 1 mL PBS at 5 mg/mL and diluted with 9 mL DMEM) was added to the wells, and the 96-well plate was incubated in the dark at 37 °C for 3 h. After this period, the MTT solution was removed, and 200 µL of DMSO was added to the wells to dissolve the formed formazan crystals. Finally, the well plate was shaken to homogenize the color, and the optical density was measured at 570 nm using a microplate reader (Multiskan™ FC, Microplate Photometer, ThermoFisher Scientific, Waltham, MA, USA). The test was repeated in triplicate, and the results were reported with standard deviations.

2.7. Statistical Analysis

The results of antimicrobial activity and cell viability of HT-based CDs were statistically analyzed using a two-tailed Welch t-test in Microsoft Excel. For the antibacterial assay, each HT-based CD group was compared with the bacterial control group without any particles under the same light conditions (daylight groups to daylight control, UV-A light groups to UV-A control). For cytotoxicity, the statistical significance was determined by comparing each concentration with the control group, which is 0 µg/mL particle concentration. Data are presented as mean ± standard deviation of triplicate measurements (n = 3). In statistical analyses, significance was assessed at a 95% confidence level, and p-values less than 0.05 were considered statistically significant. The statistically significant levels are indicated as follows: ns = not significant (p ≥ 0.05), * p < 0.05, and ** p < 0.01.

3. Results and Discussion

Synthesis and Characterization of HT-Based CDs

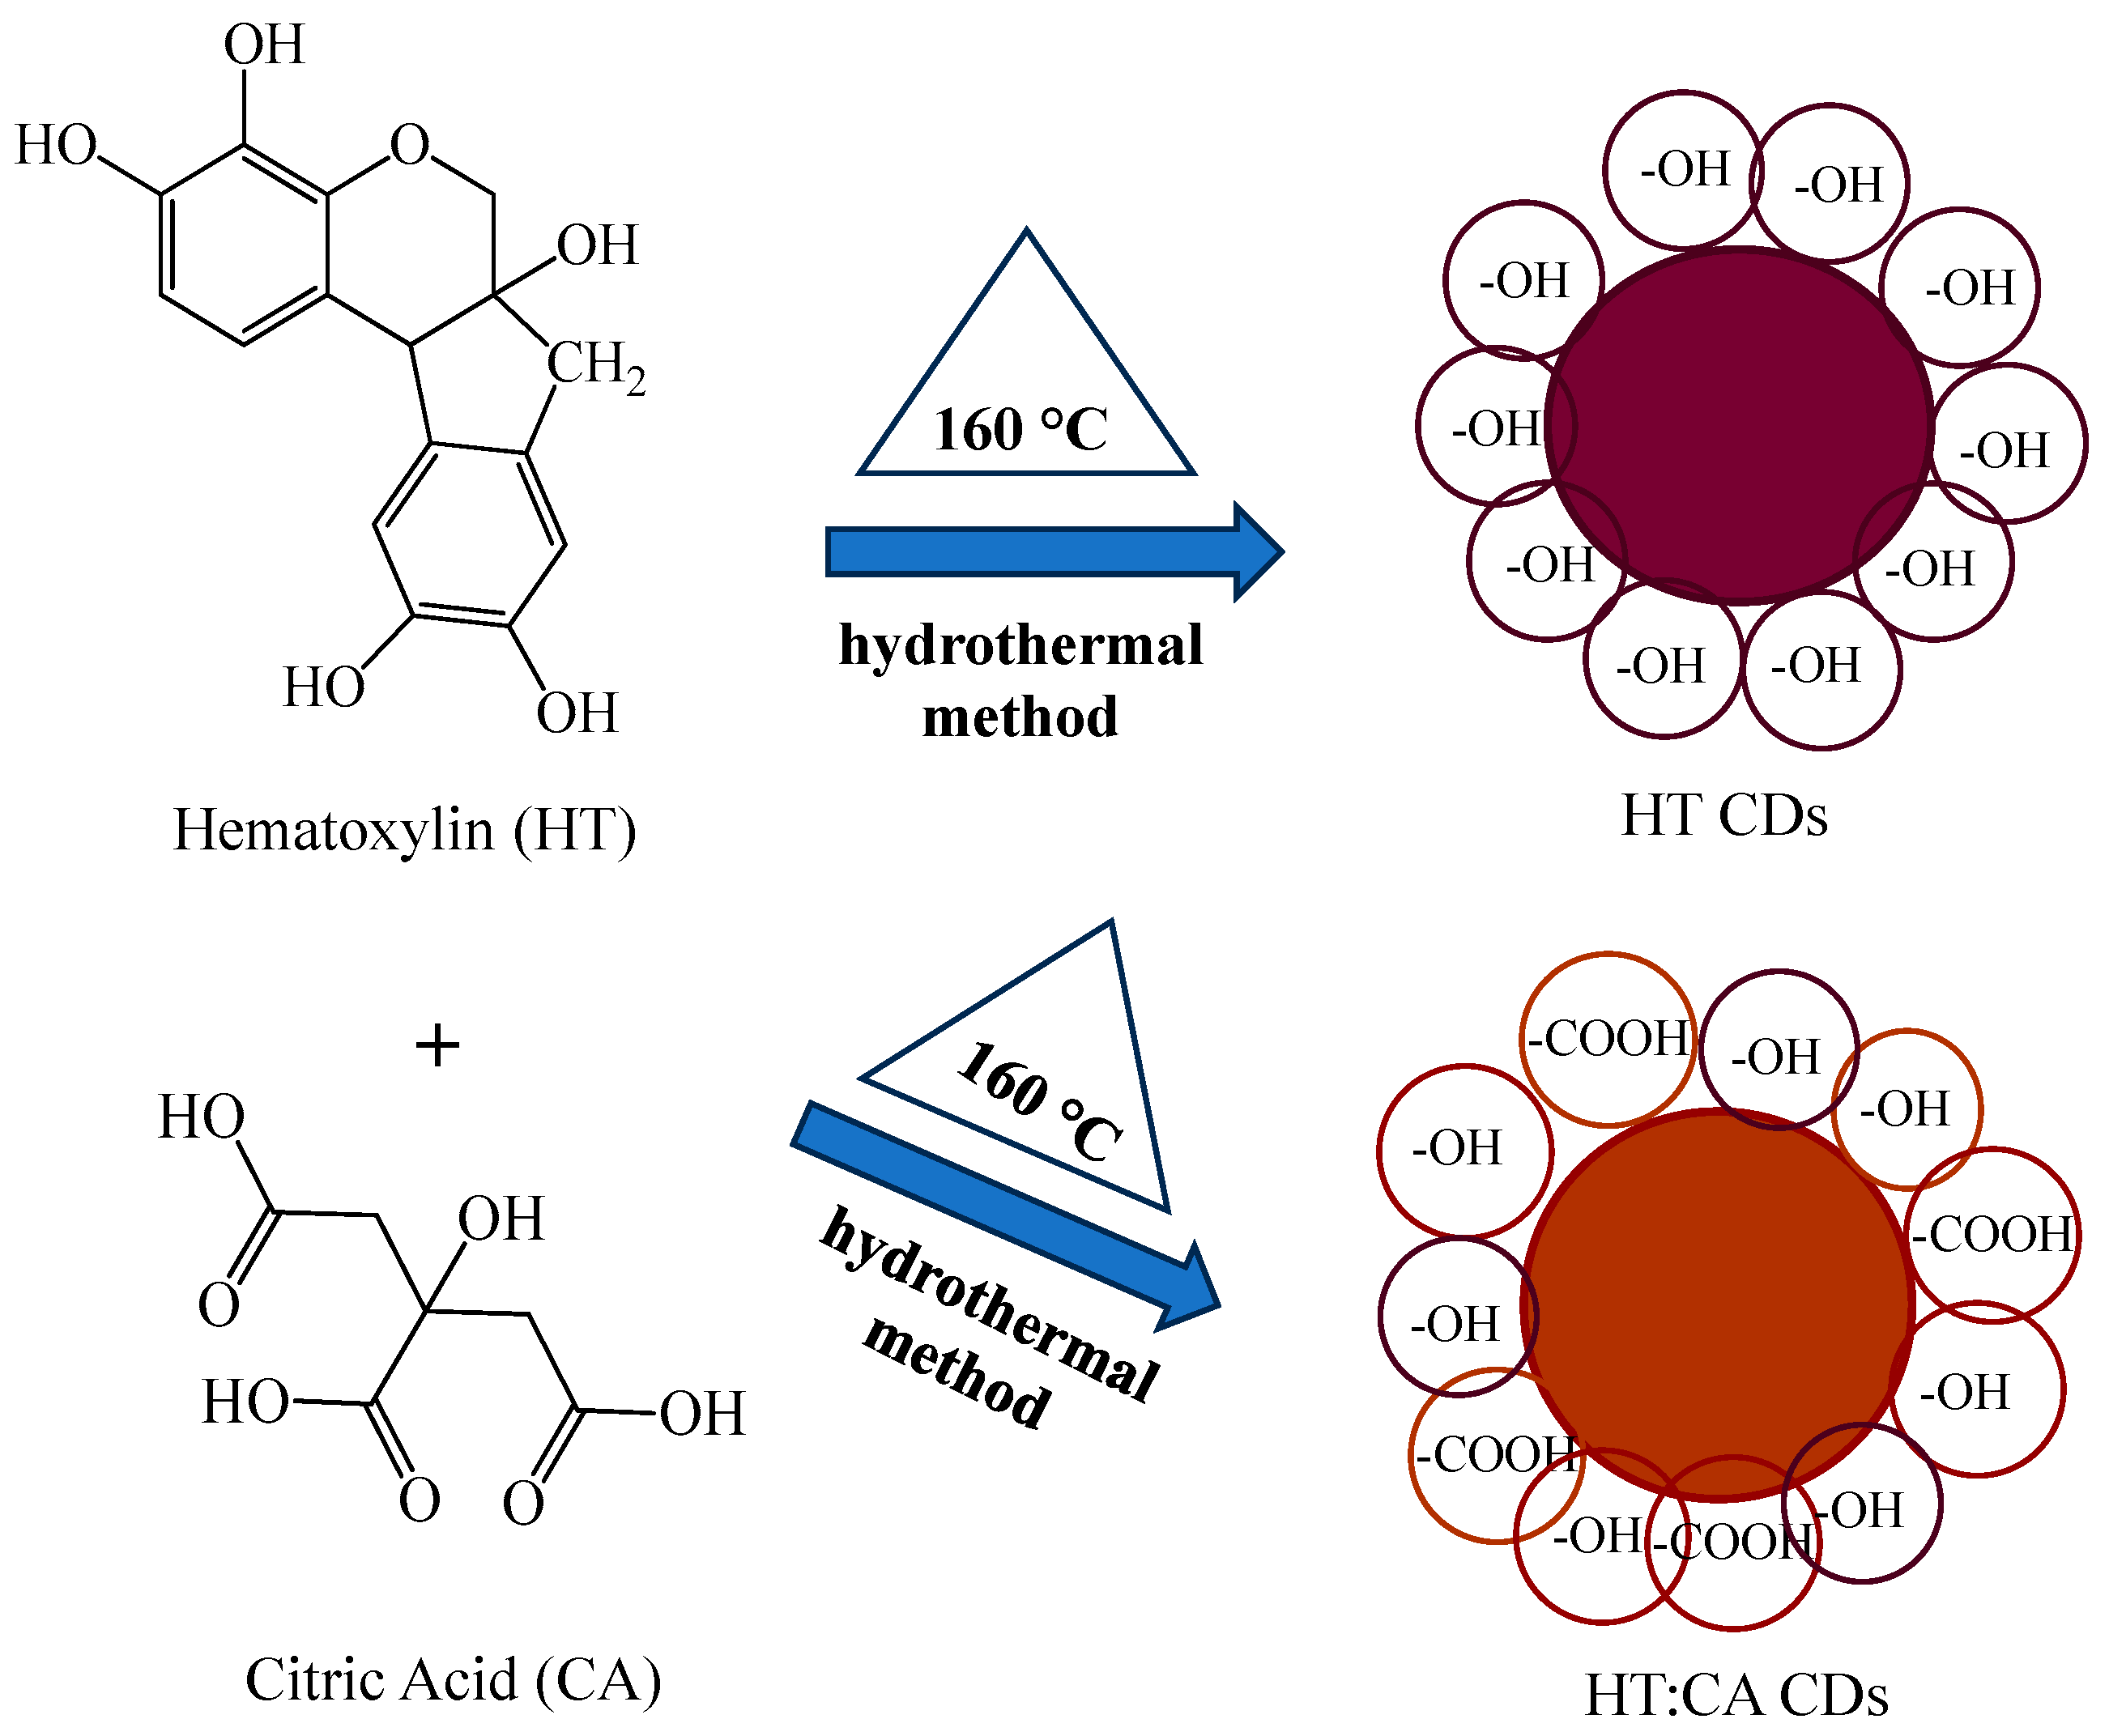
The schematic design of the synthesized HT-based CDs is shown in Figure 1. Firstly, CDs precursor solutions were prepared. As depicted in Figure 1, when CA is used in the preparation of HT-based CD, functional groups such as –COOH groups can be generated on the surface of the CDs (for HT:CA), while HT CDs have only –OH functional groups. As HT CDs are synthesized using only the HT precursor, the outer surface of the carbon core formed after hydrothermal carbonization generates –OH groups originating from the phenolic structure of HT. On the other hand, during the hydrothermal carbonization of HT:CA CDs, dehydration/condensation reactions occur between the –OH groups in HT and the –COOH groups in the CA, resulting in the formation of –OH and –COOH groups on the outer surface of HT:CA CDs.
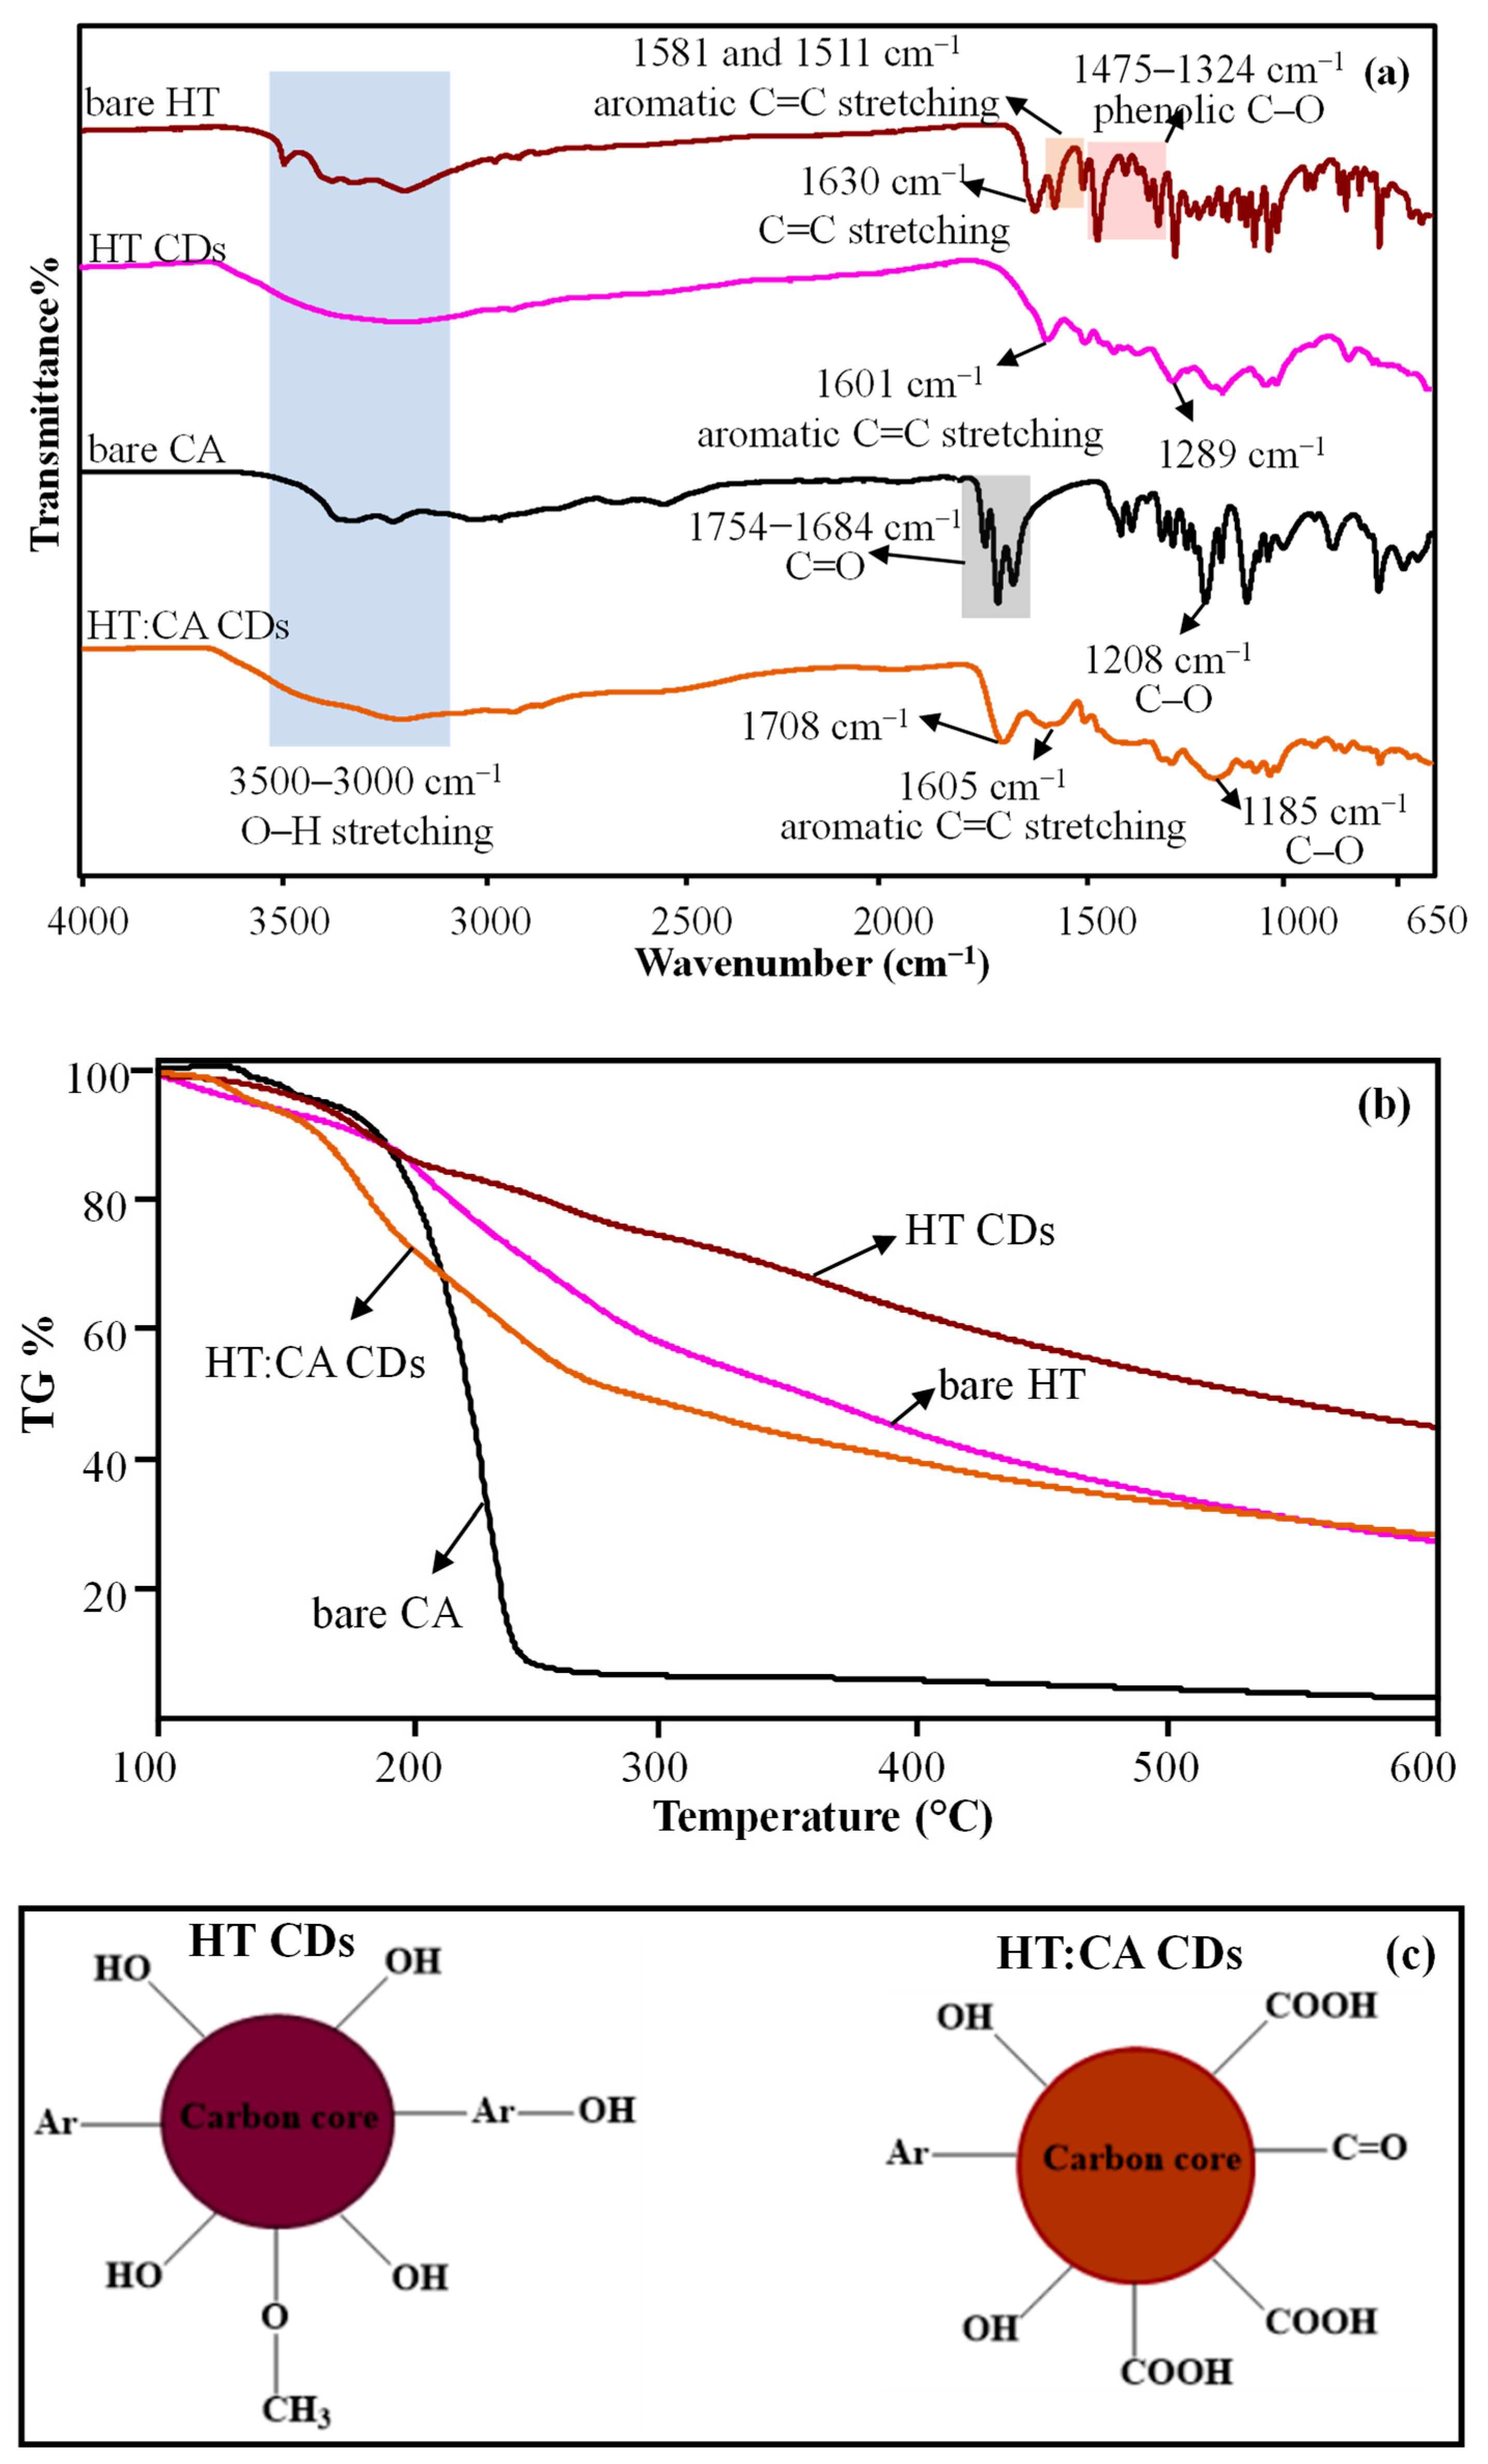
FT-IR spectroscopy was used to assess the surface functional groups of bare CD precursors and synthesized HT-based CDs, and the relevant spectra are shown in Figure 2a. As can be seen from Figure 2a, the characteristic FT-IR peaks of bare HT are observed as a broad band of O–H stretching at 3500–3200 cm−1, C=C vibrations at 1630 cm−1, C=C aromatic stretching vibrations at 1581 and 1511 cm−1, the phenolic –OH bending between 1475 and 1324 cm−1, the C–O/–CH2/C–C vibrations at 1086–1283 cm−1, and C–H bending of the benzene ring at 1030 cm−1 [19]. On the other hand, the characteristic FT-IR peaks of bare CA are assigned to the O–H stretching of vibrations of broadband hydroxyl and carboxylic acid groups at 3500–3000 cm−1, the strong band observed in the range of 1754−1684 cm−1 to the C=O stretching vibrations of the carboxylic acid groups, and the peaks observed at 1208 and 1106 cm−1 to the C–O stretching vibrations [39]. Significant spectral changes were observed in HT-based CDs after the hydrothermal process, supporting the formation of CDs from the HT:CA precursor system. The peak at 1630 cm−1 originating from aromatic C=C stretching vibrations in bare HT shifted to 1605 and 1601 cm−1 in the spectra of HT CDs and HT:CA CDs. Furthermore, the peaks observed at 1289 cm−1 in HT CDs and 1185 cm−1 in HT:CA CDs can be assigned as C–O stretching vibrations belonging to oxygen-containing functional groups on the surface.
The thermal degradation profiles of the bare CD precursors and HT-based CDs were compared with each other as depicted in Figure 2b. Bare HT exhibits two decomposition steps. The first one occurs between 100 and 165 °C, resulting from the dehydration of volatile components with a weight loss of approximately 8%. The second step, where the main decomposition takes place, occurs over a wide temperature range, from 165 to 600 °C, with the pyrolysis of phenolic –OH groups and oxygen-containing functional groups, ending with a cumulative weight loss of 72%. Bare CA exhibits a preliminary dehydration step and a main degradation step. The preliminary dehydration step, occurring between 100 and 150 °C, corresponds to about 5% weight loss due to the release of crystal water from the citric acid monohydrate structure. In the main degradation stage, a sharp weight loss of 92% is observed between 150 and 250 °C, resulting from the degradation of CA components. Synthesized HT CDs exhibited a two-stage but significantly more stable thermal decomposition profile than bare HT. The second degradation step is the main degradation step, where the residual phenolic groups within the HT CDs structure begin to degrade. The first degradation step, occurring between 100 and 176 °C, corresponds to about 8% weight loss due to the removal of volatile components on the surface of HT CDs. The second step starts at 176 °C and continues with a gradual slope up to 600 °C, ending at 600 °C with about 56% weight loss. On the other hand, the HT:CA CDs exhibit two degradation steps. Intriguingly, HT:CA CDs lost more weight in the first degradation step compared to bare HT and bare CA. This behavior can be attributed to the hydrophilic nature of the carbon dots, which hold a greater amount of surface-bound water molecules due to the abundance of oxygen-rich groups derived from both precursors. The first degradation step corresponds to the removal of water molecules from the structure, representing a mass loss of approximately 10% at 100–160 °C. The second step of degradation, where the main degradation occurs, corresponds to a cumulative weight loss of about 70%, with degradation continuing gradually from 160 °C to 600 °C. On the other hand, considering the FT-IR spectra and thermogravimetric analysis results presented in Figure 2a,b, the chemical structures of HT CDs and HT:CA CDs were anticipated and provided in Figure 2c. The mentioned structures demonstrate the retention of phenolic –OH and aromatic structures for HT CDs developed from hematoxylin, whereas, in addition to these groups, the presence of carboxyl –COOH and –OH groups on the surfaces of HT:CA CDs due to CA incorporation is plausible.
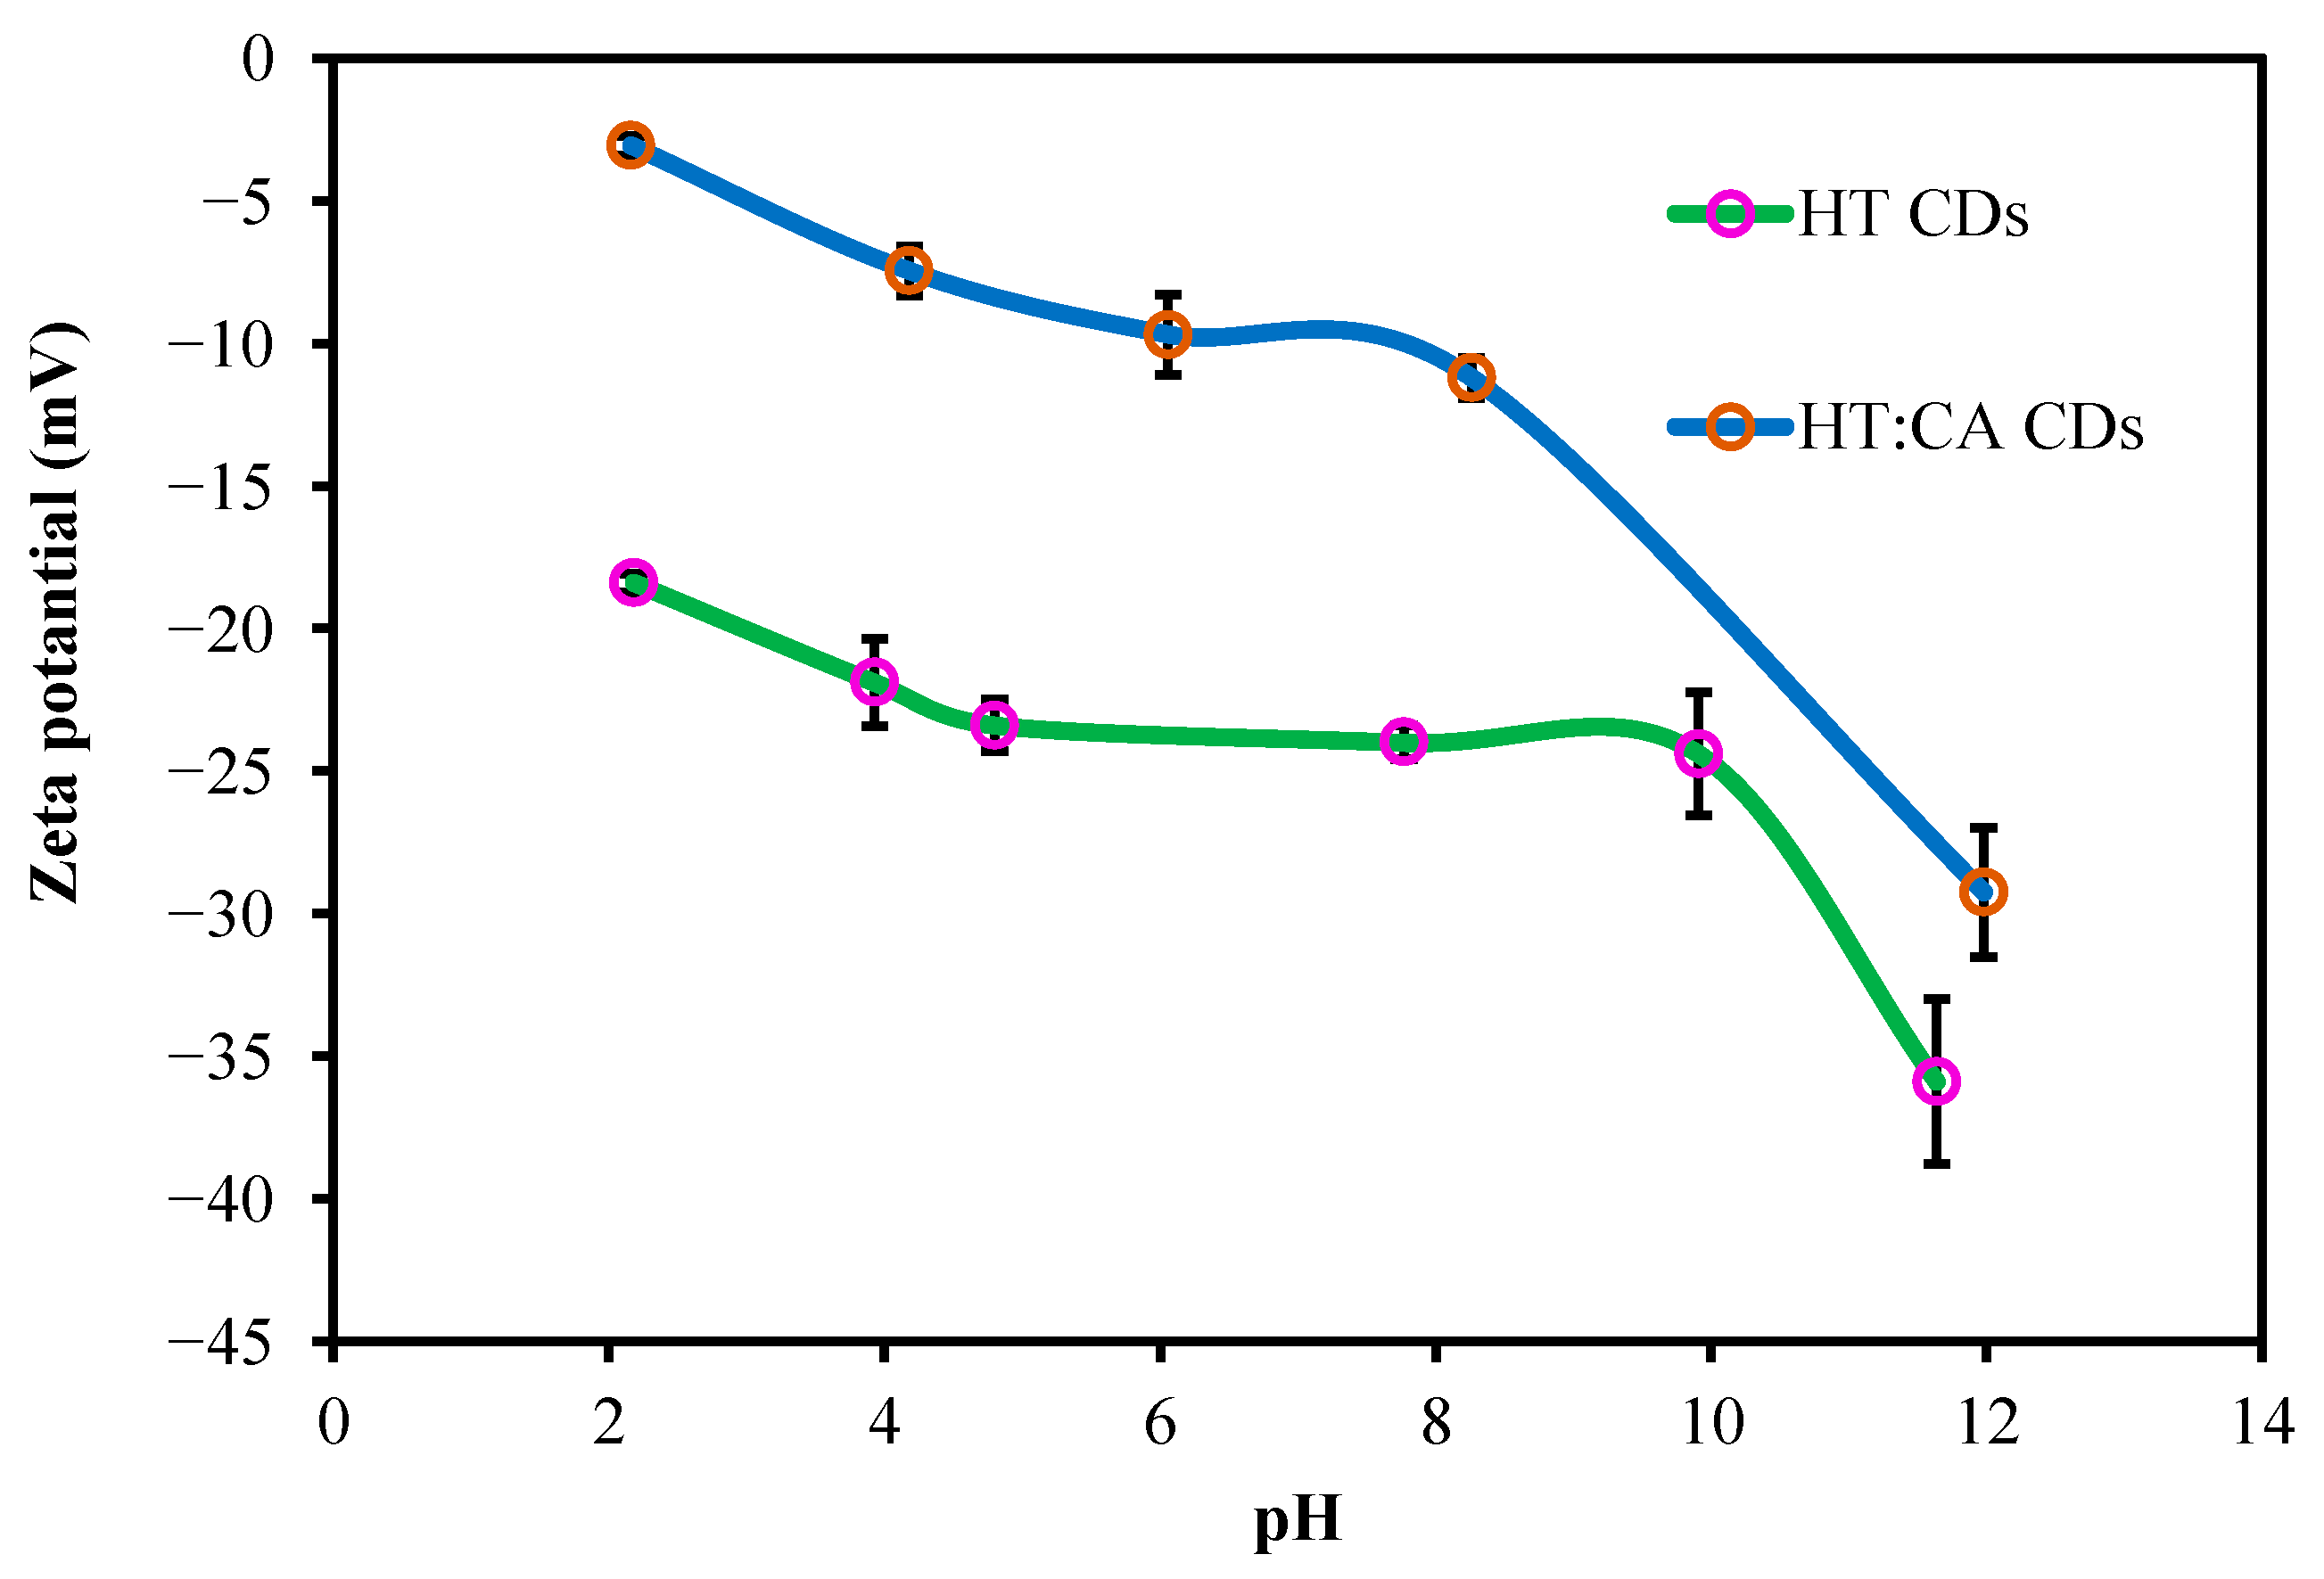
In the previous study conducted by our group, it was stated that the HT zeta potential exhibited an acidic character and the isoelectric point (IEP) limit was below 2 [40]. Zeta potential analyses against solution pH values presented in Figure 3 showed that HT CDs had a more negative surface charge than HT:CA CDs across the entire pH range. In both samples, the shift of the zeta potential to more negative values with increasing pH was attributed to the deprotonation of phenolic and carboxylic groups on the surface. While reaching approximately −36 mV at pH 12 in HT samples indicates high electrostatic stability, the maximum value of approximately −29 mV in HT:CA CDs samples suggests that the addition of citric acid reduced the surface charge density. This can be explained by citric acid-induced surface passivation and the rearrangement of surface functional groups during carbonization. However, the generation of new carboxyl functional groups present in HT:CA CD samples may be advantageous for biological applications.
In a 10 mM KCl solution, the HT CDs sample exhibited a zeta potential of −23.4 mV at pH 4.80, whereas the HT:CA CDs sample showed a zeta potential of −7.4 mV at pH 4.18. The less negative zeta potential of the HT:CA CDs sample indicates a reduction in surface charge density following CA addition, suggesting shifted electrostatic stability compared to the bare HT.
As given in Table 1, the DLS measurements yielded hydrodynamic diameters of 115 ± 1 nm for HT CDs and 310 ± 19 nm for HT:CA CDs under the measurement conditions. These values represent the hydrodynamic size of the dispersed species in solution rather than the primary size of individual carbon dots. The larger hydrodynamic diameter observed for HT:CA CDs could be attributed to the presence of CA at or near the CD surface and/or differences in the aggregation or solvation state of the CD particles in solution. CA can introduce additional functional groups and promote intermolecular interactions such as hydrogen bonding, which may lead to particle aggregation or the formation of a thicker surface layer. As a result, the hydrodynamic diameter of the particles increases. Furthermore, the lower absolute zeta potential (−7.4 mV) compared to HT CDs (−23.4 mV) suggests reduced electrostatic repulsion between particles, which can contribute to aggregation and, consequently, larger particle sizes.
To determine the correct excitation wavelength (λex), the fluorescence emission spectra of HT-based CDs were scanned between λex of 280 and 310 nm at 700 PMT voltage. The corresponding emissions for HT CDs and HT:CA CDs are shown in Figure S1a and Figure S1b, respectively. According to the λex scan, 300 nm was identified as the wavelength with the highest observed fluorescence emission intensity for both CDs and was accepted as the optimum excitation wavelength.
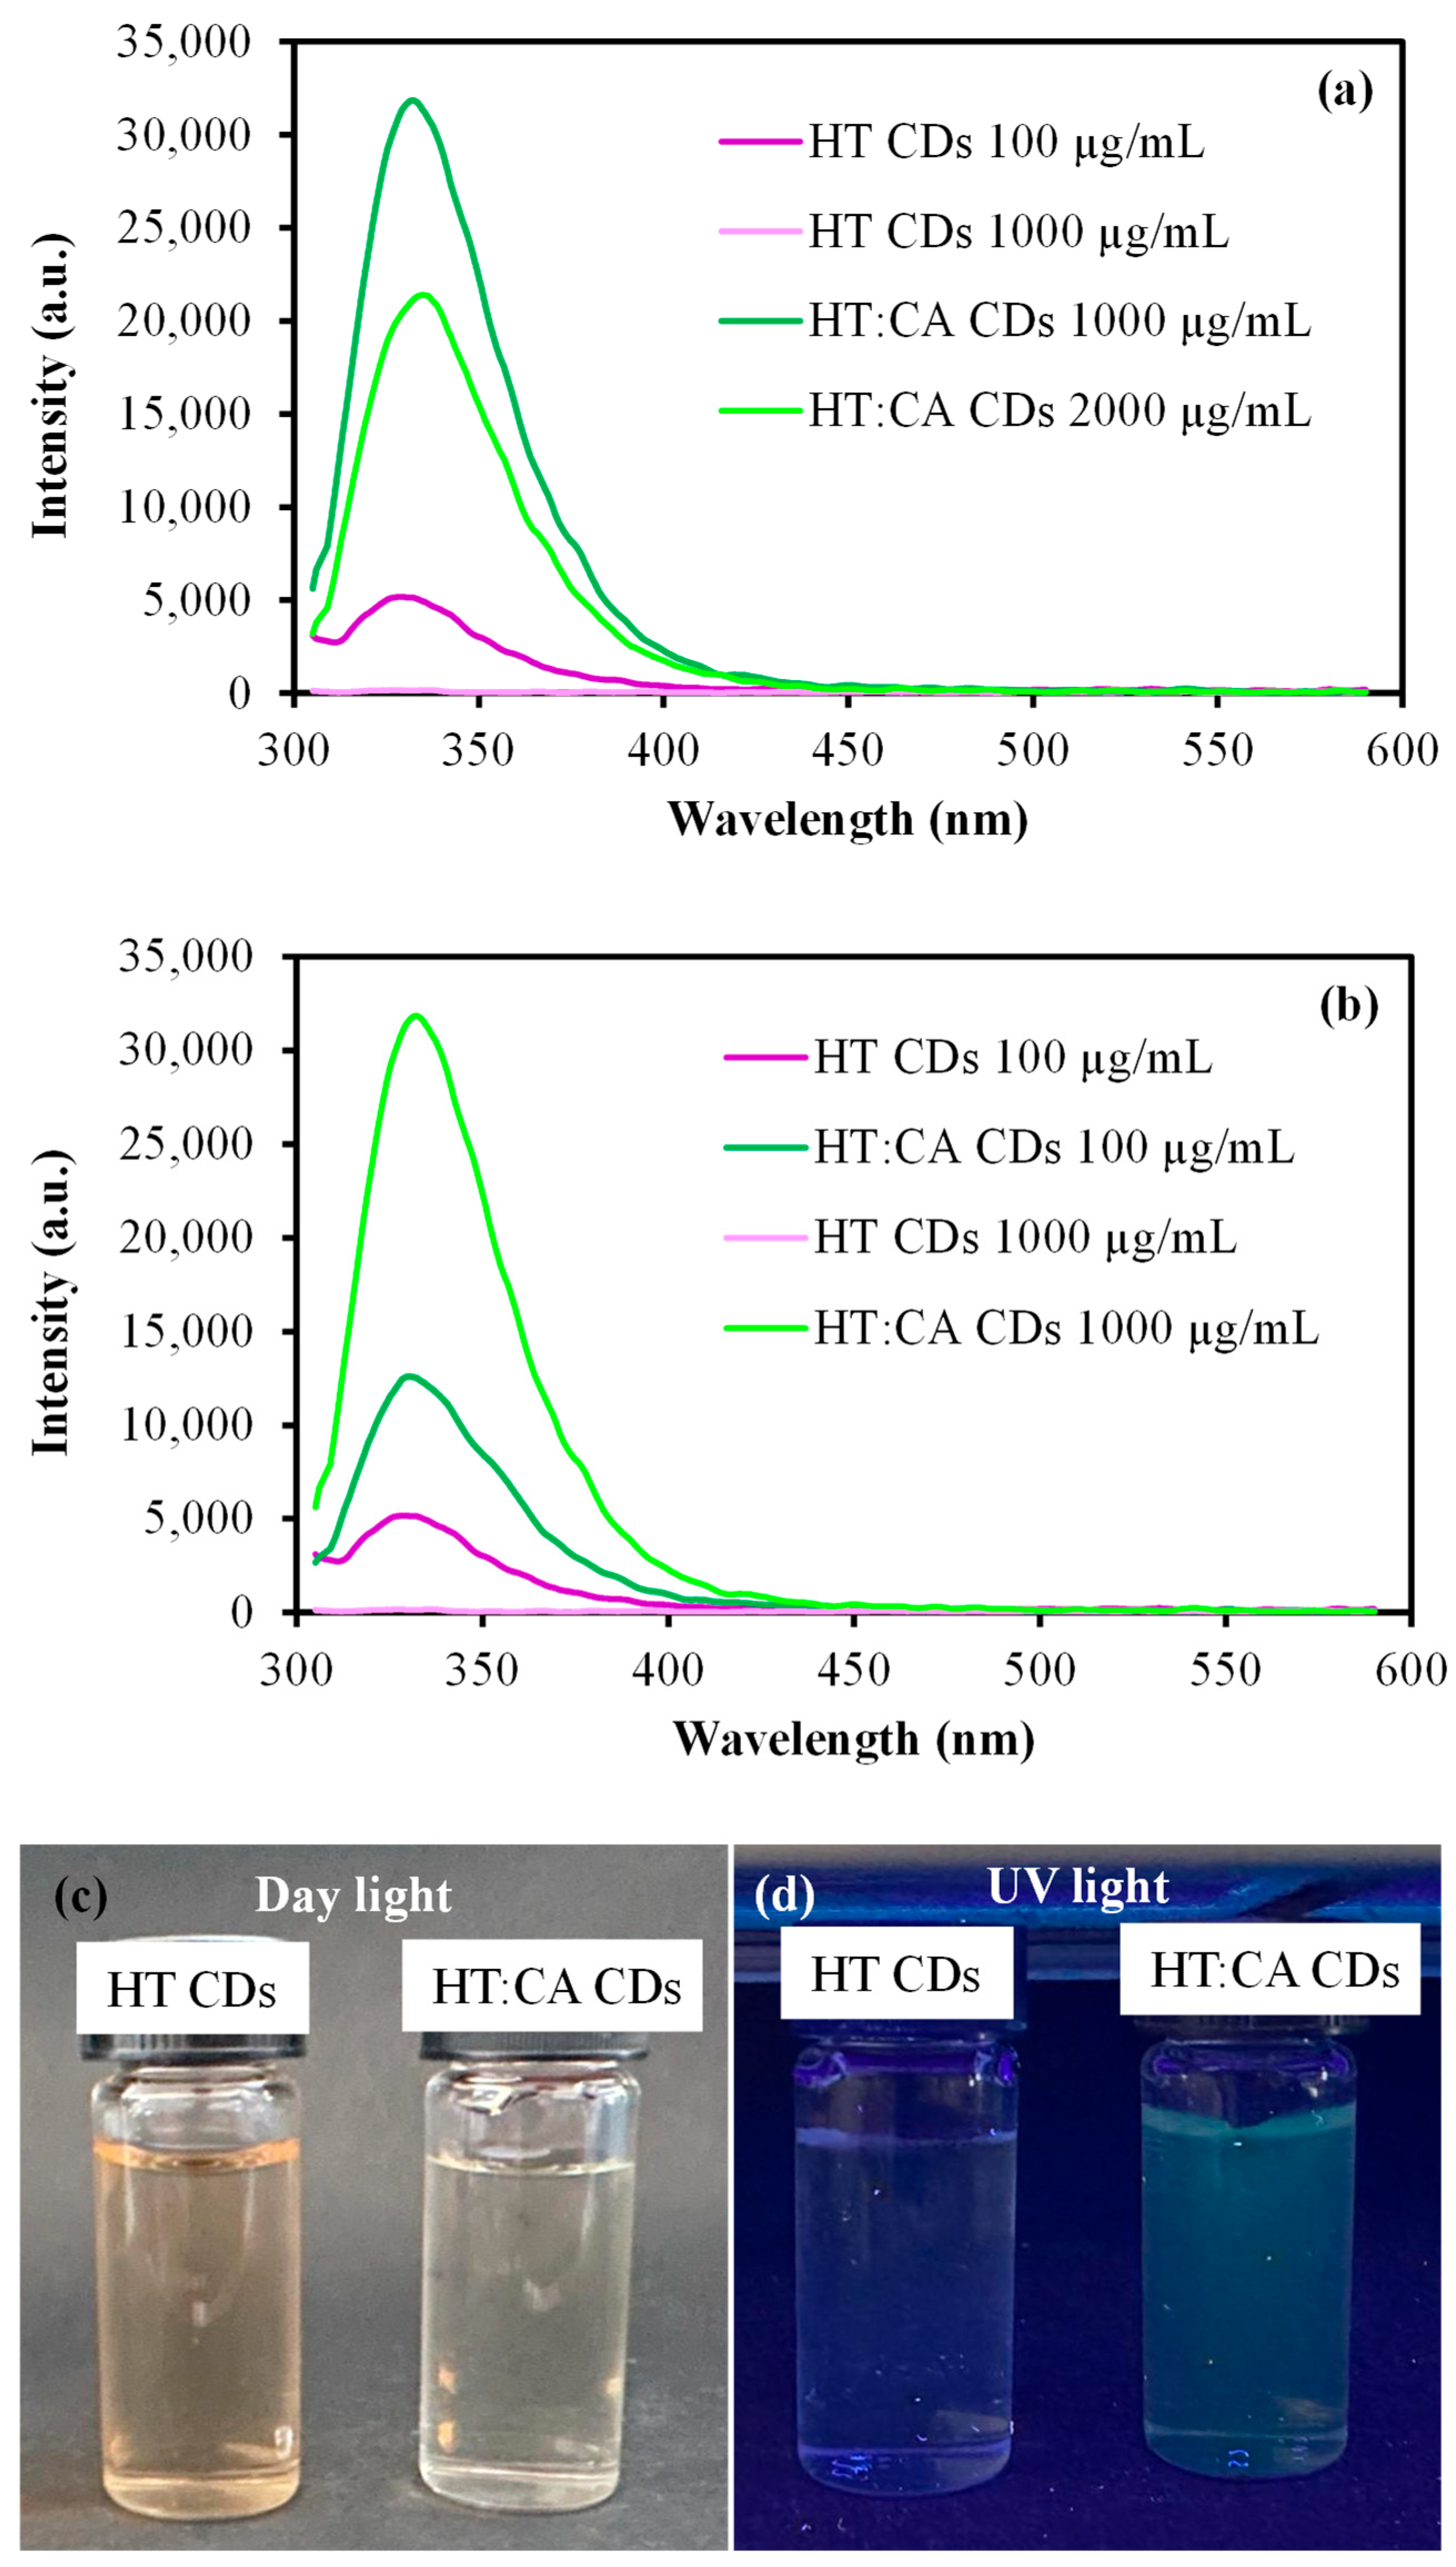
Numerous studies exist regarding the relationship between CD concentration and fluorescence properties. According to these studies, it has been reported that as CD concentration increases, aggregation and concentration-dependent fluorescence quenching occur. To investigate concentration-dependent fluorescence quenching, the effect of the synthesized HT-based CDs was evaluated in aqueous solutions ranging from 25 to 2000 µg/mL, and the results were shown in Figure S2. Measurements performed at the optimum excitation wavelength of 300 nm revealed distinct concentration-dependent behaviors for HT CDs and HT:CA CDs. As can be seen from Figure S2a, HT CDs exhibited linear concentration-dependent fluorescence emission increase behavior in the 25–100 µg/mL concentration range, while concentration-dependent fluorescence emission decreased in the 250–2000 µg/mL. HT CDs exhibited maximum fluorescence emission intensity at a concentration of 100 µg/mL, displaying a peak emission at 329 nm with an intensity of about 5180 a.u. As the concentration increased above 100 µg/mL (i.e., at 250 µg/mL and 500 µg/mL), HT CDs demonstrated a sharp decrease in fluorescence intensity due to aggregation formation and enhanced π–π stacking interactions, leading to complete fluorescence quenching at 1000 and 2000 µg/mL. In contrast, as shown in Figure S2b, HT:CA CDs showed a linear fluorescence intensity increase in 25–500 µg/mL and reached a maximum fluorescence intensity at a higher concentration, e.g., 1000 µg/mL, yielding a strong emission peak at 332 nm with an intensity of about 31,840 a.u. However, further increase in HT:CA CDs concentration did not increase the fluorescence intensity; instead, it was reduced to about 21,250 a.u. This behavior indicates that the incorporation of CA introduces abundant carboxyl groups onto the CD surfaces, leading to the formation of highly stable carbon dots. These surface carboxyl groups provide electrostatic repulsion, which successfully prevents premature π-π stacking and delays concentration-dependent quenching up to high concentration thresholds, i.e., 1000 µg/mL [28,41,42]. As the concentration was further increased to 2000 µg/mL, concentration-dependent quenching was initiated for HT:CA CDs, resulting in a reduced emission intensity of 21,361 a.u. at 332 nm. This aggregation leads to a decrease in fluorescence intensity due to the significant absorption of incident light by the fluorescent materials. Moreover, concentration-dependent quenching can be attributed to the occurrence of a secondary internal filter effect (sIFE) when there is a significant overlap between the absorption and emission spectra in solutions containing fluorescent materials [43,44]. The sIFE can cause the reabsorption of the fluorescence emitted by the sample itself. Consequently, this results in spatial inhomogeneities in detection and quenching of emitted fluorescence [45,46]. The excitation wavelength, emission wavelength at which HT CDs and HT:CA CDs exhibit maximum fluorescence emission, and the optimum concentration and minimum extinction concentrations at these wavelengths are summarized in Table 1. Therefore, the investigation of fluorescence emissions at the optimum excitation wavelength, optimum concentration, and the concentration at which it causes quenching for HT CDs and HT:CA CDs is shown in Figure 4a. As HT CDs were excited at 300 nm, a peak emission was observed at a wavelength of 329 nm, exhibiting a fluorescence intensity of 5181 a.u. The HT:CA CDs, when excited at 300 nm, had a peak emission at a wavelength of 332 nm with a fluorescence intensity of 31,840 a.u. As shown in Figure S2a,b, the concentration at which quenching began for HT CDs was 250 µg/mL, and for HT:CA CDs was >1000 µg/mL, e.g., 2000 µg/mL. While complete fluorescence quenching was observed at the concentration of 1000 µg/mL for HT CDs, HT: CA CDs showed a peak emission at 334 nm when excited at a wavelength of 300 nm at the same concentration; the fluorescence intensity was measured as 21,361 a.u.
Figure 4b shows a direct comparison of the fluorescence intensities of both HT CDs and HT:CA CDs at their respective optimum concentrations (equivalent concentrations of 100 µg/mL and 1000 µg/mL), where each exhibited its maximum fluorescence emission individually. At the low concentration of 100 µg/mL, HT:CA CDs displayed significantly higher fluorescence intensity compared to HT CDs. When the concentration was increased to 1000 µg/mL, the fluorescence emission of HT CDs reached the baseline level due to complete quenching, while the intensity of HT:CA CDs reached its maximum value, showing a remarkable increase compared to its level at the low concentration. Figure 4c and Figure 4d show digital camera images of HT CDs and HT:CA CDs at optimum concentrations under daylight and 365 nm UV light exposure, respectively. Under daylight, the HT CDs solution at optimum concentration is brown/yellowish, while the HT:CA CDs solution at optimum concentration is more transparent/light in color. As expected, HT CDs and HT:CA CDs did not provide fluorescence emission in daylight. Moreover, under a 365 nm UV lamp, HT CDs exhibited almost no visible fluorescence emission, while HT:CA showed a slight yellowish/greenish glow.
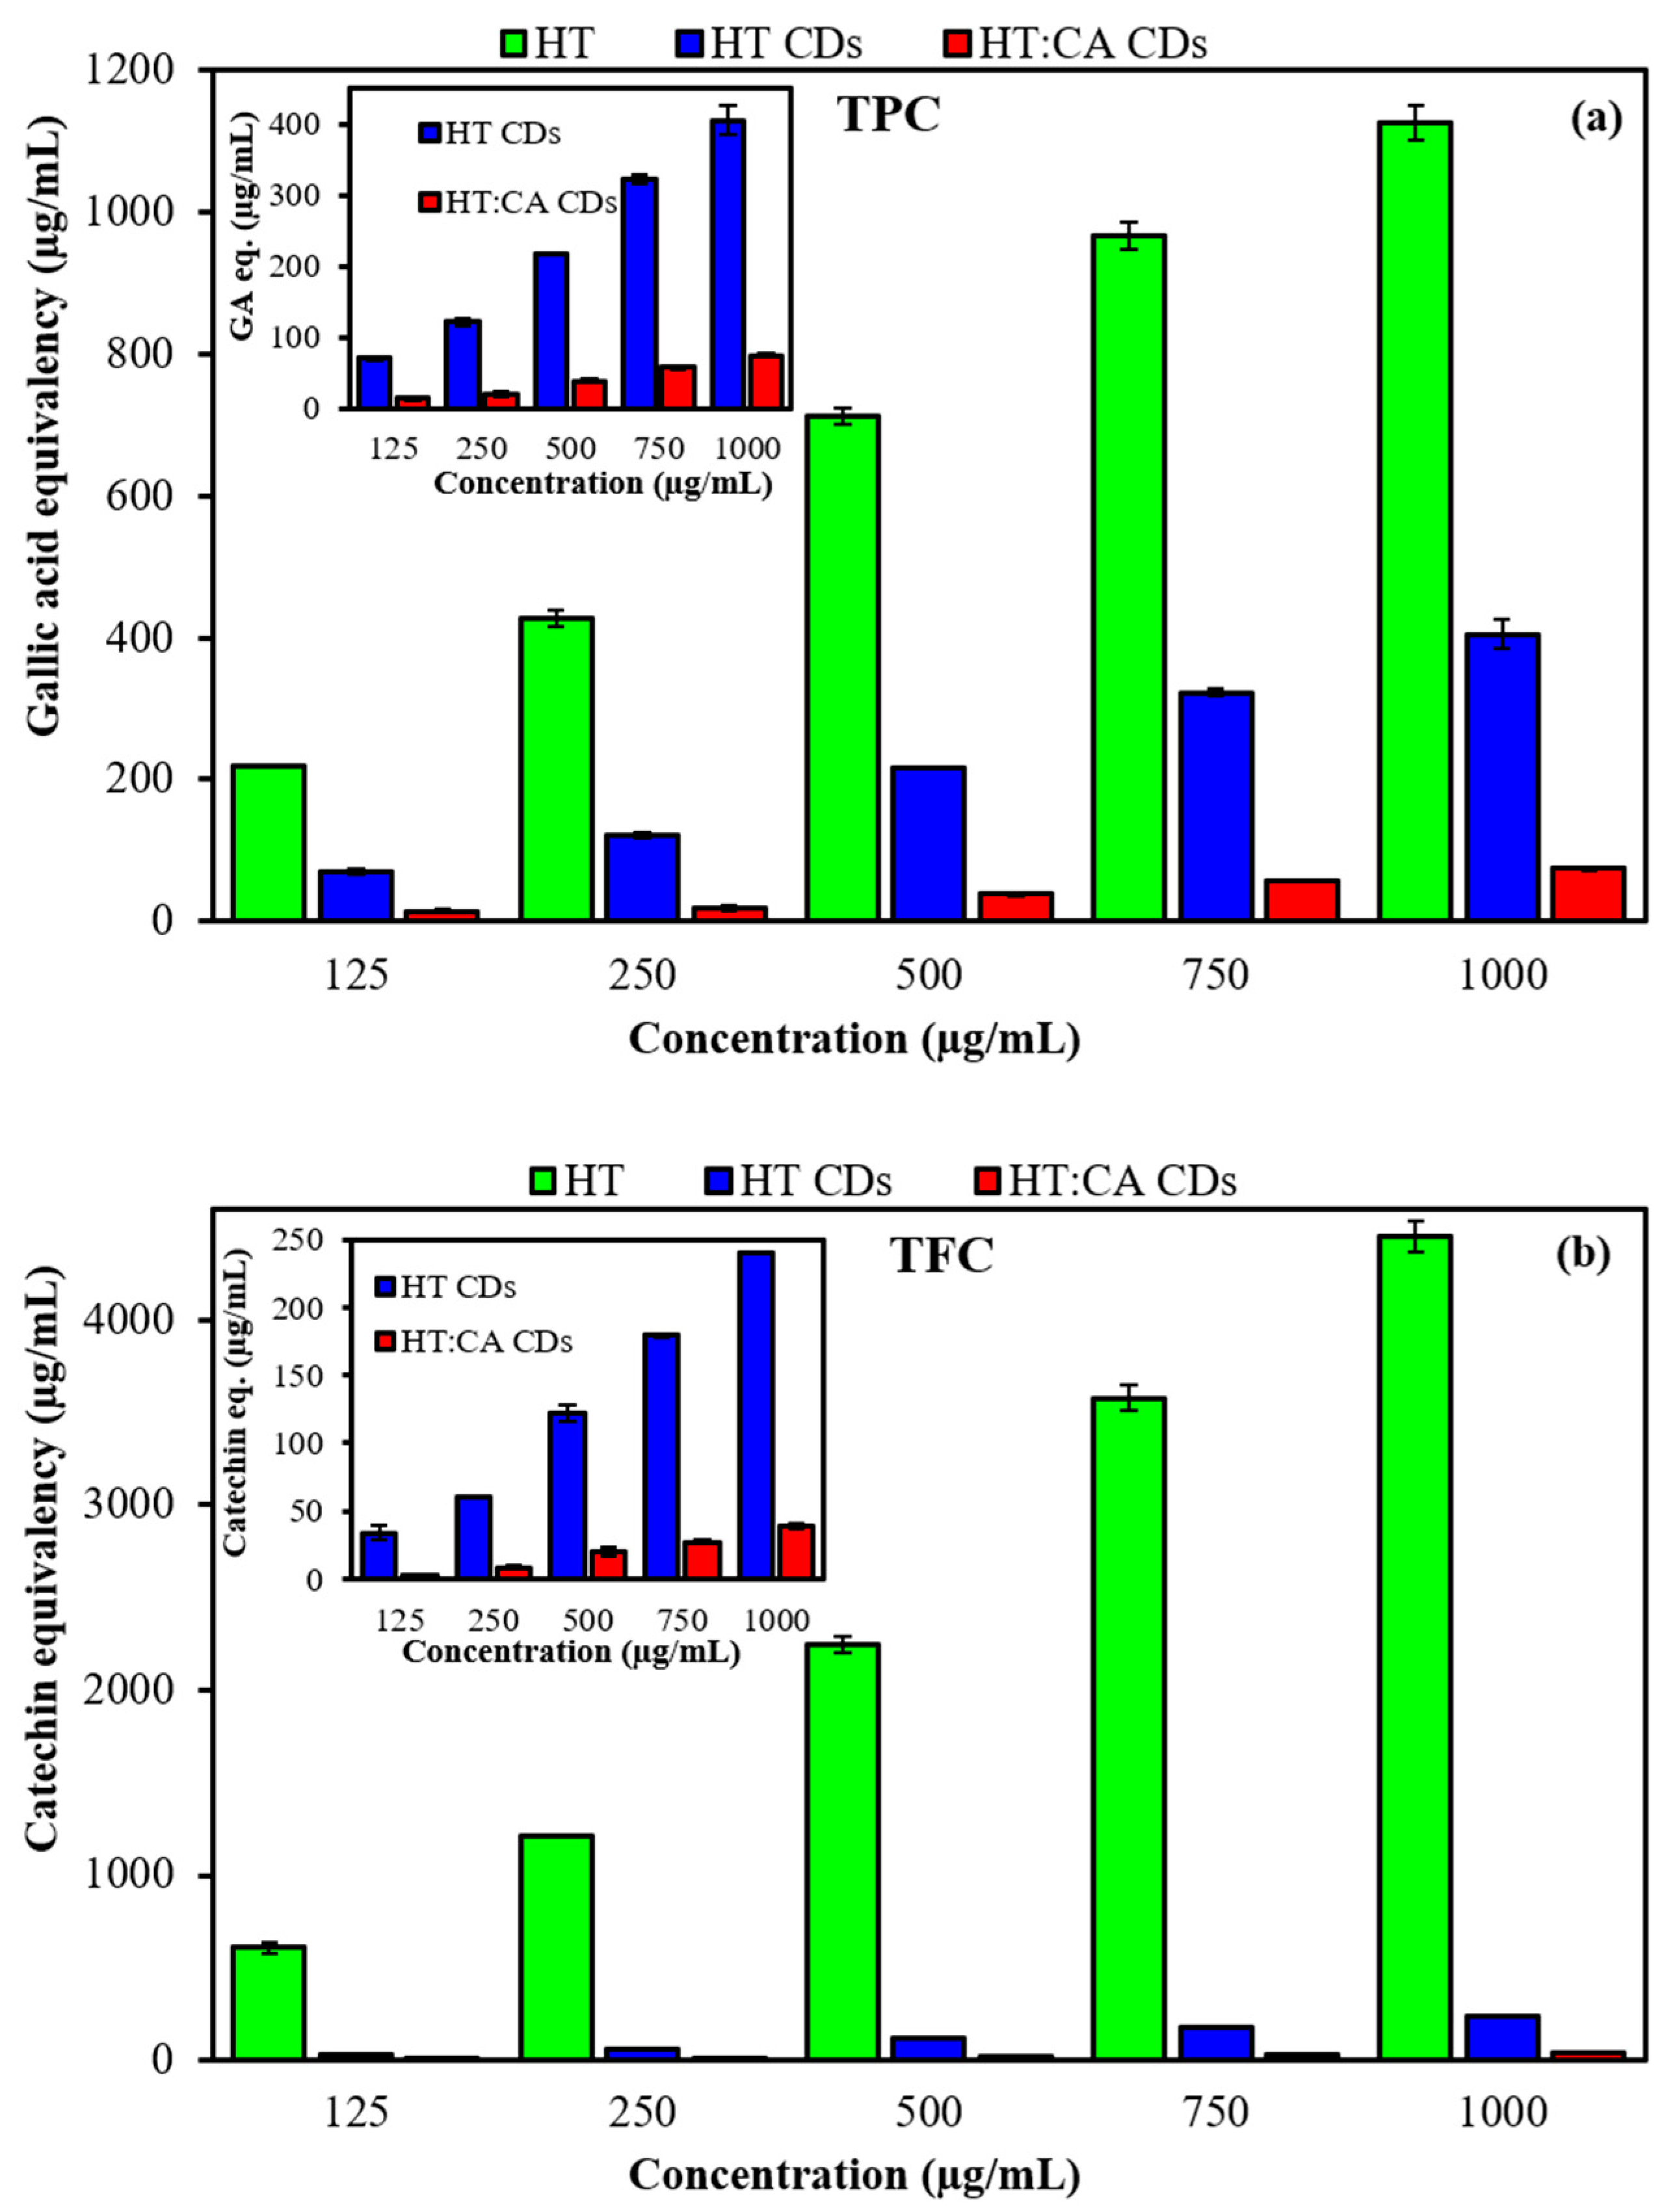
In developing materials for biomedical applications, determining the key parameters such as antioxidant activity, antimicrobial properties, and biocompatibility, which guide the material’s intended use, is crucial. Free radicals, which cause the development of oxidative stress-related diseases, can be stabilized by antioxidants, improving the body’s oxidative status. This dynamic process eventually helps to prevent the development of various oxidative stress-related diseases (cardiovascular, chronic lung, neurodegenerative, and metabolic diseases, etc.). Materials containing polyphenols are powerful antioxidants, and the body fights free radicals through these antioxidant materials. The TPC and TFC analyses were performed to estimate the phenolic and flavonoid contents of the HT and HT-based CDs, whereas FRAP and CUPRAC assays were used to assess the antioxidant activities of these materials. TPC and TFC values of bare HT and HT-based CDs at initial concentrations ranging from 125 to 1000 µg/mL were determined, and the related results are shown in Figure 5a and Figure 5b, respectively, in terms of gallic acid (GA) and catechin equivalency, correspondingly. The results demonstrate that the phenol and flavonoid content of bare HT, HT CDs, and HT:CA CDs exhibited an increase with increasing concentration, as expected, and the phenol content was always higher in HT. Upon converting HT into CDs, e.g., HT CDs and HT:CA CDs, the phenol content was somewhat retained but significantly reduced in comparison to HT molecules. The TPC values of 1000 µg/mL bare HT, HT CDs, and HT:CA CDs were calculated to be 1127 ± 26, 405 ± 20, and 75 ± 3 µg/mL, respectively, as GA equivalents, while the TFC values of bare HT, HT CDs, and HT:CA CDs at the same concentration were determined as 4390 ± 85, 240 ± 1, and 39 ± 2 µg/mL, respectively, as catechin equivalents.
For all the concentrations, the order of phenolic and flavonoid content is HT > HT CDs > HT:CA CDs. For HT-based CDs, these results demonstrate that the surface functionality of reactive phenolic hydroxyl groups on the surface of bare HT changes, being reduced after the hydrothermal process. As HT CDs are prepared using only bare HT as a precursor, it is thought that their phenolic and flavonoid content is partially preserved. However, since HT:CA CDs are prepared using bare HT and CA as precursors, it is thought that the phenolic and flavonoid content is partially oxidized, resulting in more oxygen-rich structures.
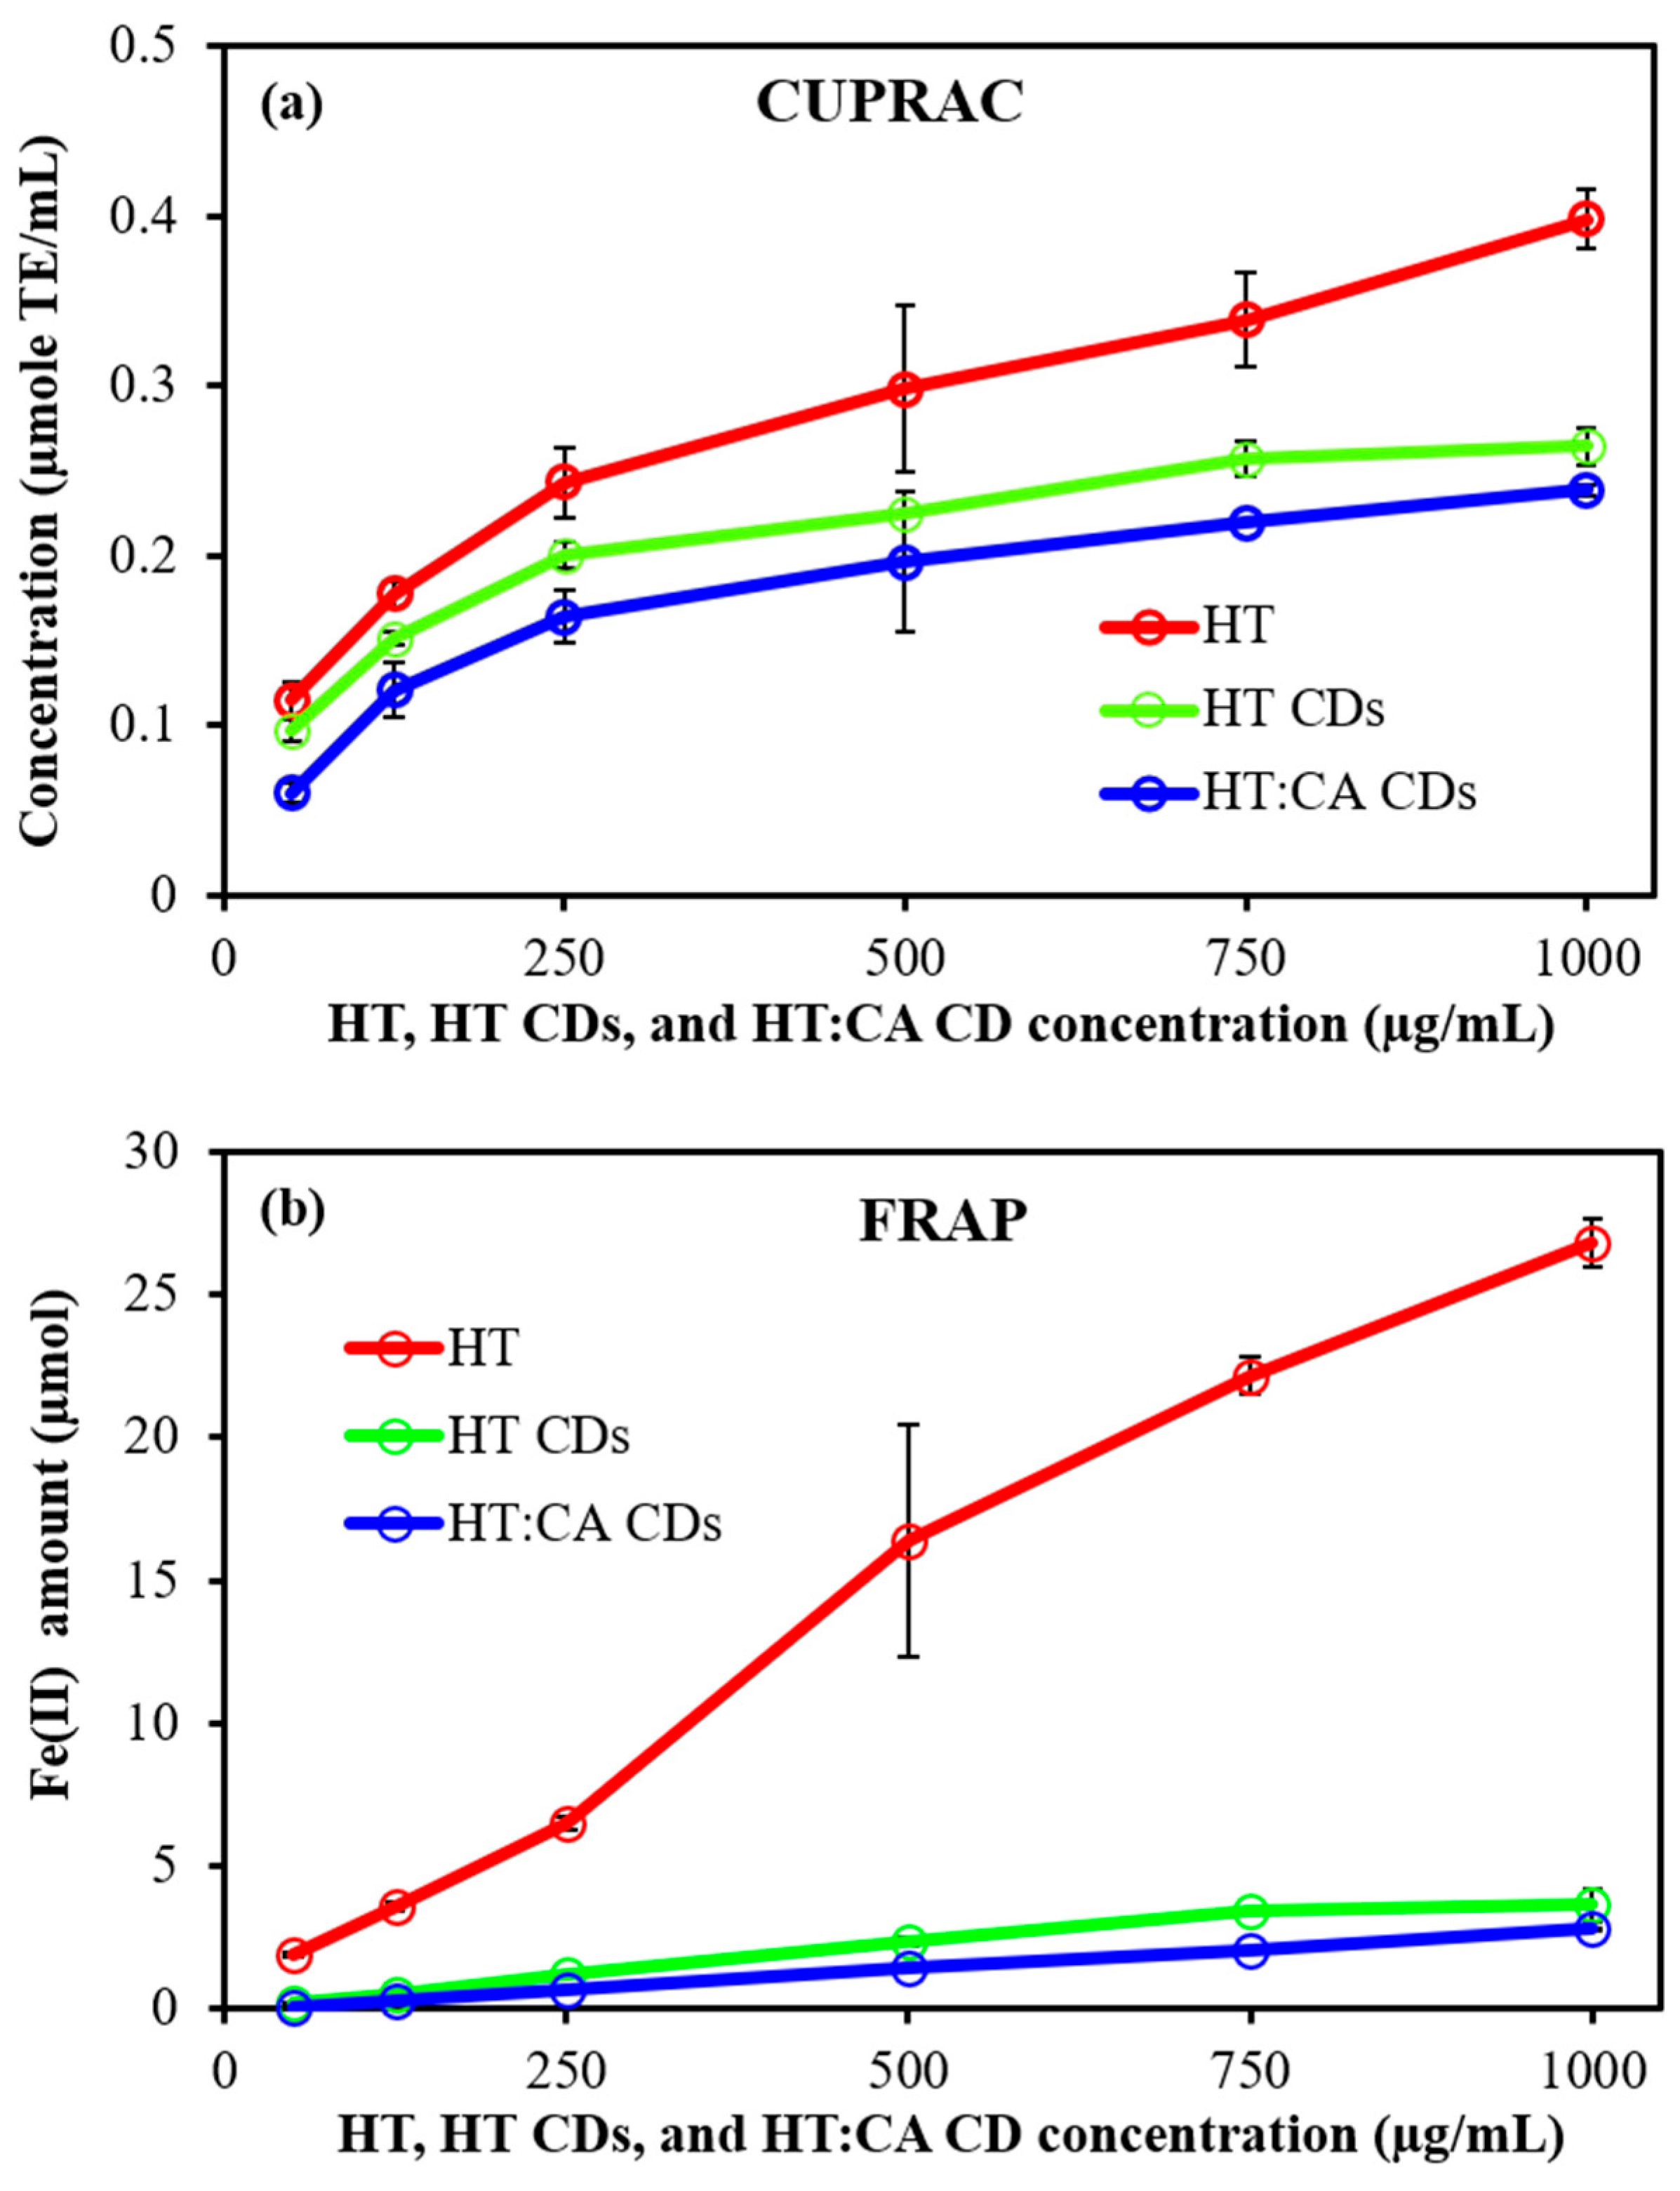
For antioxidant activity, CUPRAC and FRAP assays were performed on bare HT and HT-based CDs at concentrations ranging from 125 to 1000 µg/mL, and the relevant results are shown in Figure 6a and Figure 6b, respectively. As presented in Figure 6a, the CUPRAC assay clearly demonstrated that the antioxidant capacity increased with increasing concentration for all samples, and there was a reduction for HT-based CDs in comparison to HT molecules. The CUPRAC analysis results for bare HT, HT CDs, and HT:CA CDs at a concentration of 1000 µg/mL were calculated as Trolox equivalents of 0.39 ± 0.02, 0.26 ± 0.01, and 0.024 ± 0.01 µmol TE/mL, respectively. The FRAP test is based on the reduction of the Fe (III)-TPTZ complex, formed by the reaction of Fe (III) with TPTZ, to the Fe (II)-TPTZ complex under the influence of antioxidant materials.
As shown in Figure 6b, the reducing capacity of bare HT at a concentration of 1000 µg/mL was calculated as 26.82 ± 0.82 µmol Fe (II), while the same amount of HT CDs and HT:CA CDs could reduce 3.64 ± 0.57 and 2.78 ± 0.05 µmol Fe (II), respectively. The higher antioxidant activity of bare HT compared to HT-based CDs is attributed to the presence of reactive phenolic hydroxyl groups in the HT structure, which readily donate electrons to metal ions in both CUPRAC and FRAP systems. On the other hand, during the hydrothermal synthesis of CDs, the reactive phenolic hydroxyl groups of HT may undergo partial oxidation, leading to more limited electron transfer. Moreover, incorporation of CA, e.g., HT:CA CDs, likely promoted the formation of oxygen-rich surface functional groups such as –COOH in addition to –OH groups. This can reduce access to active –OH groups and limit electron transfer. These observations are consistent with previous literature studies reporting that partial oxidation and carbonization during CD synthesis can affect antioxidant activity by reducing electron-donating capacity [47,48,49,50].
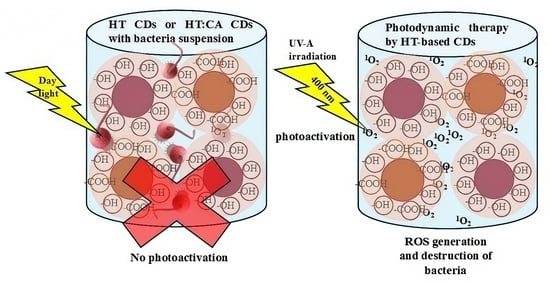
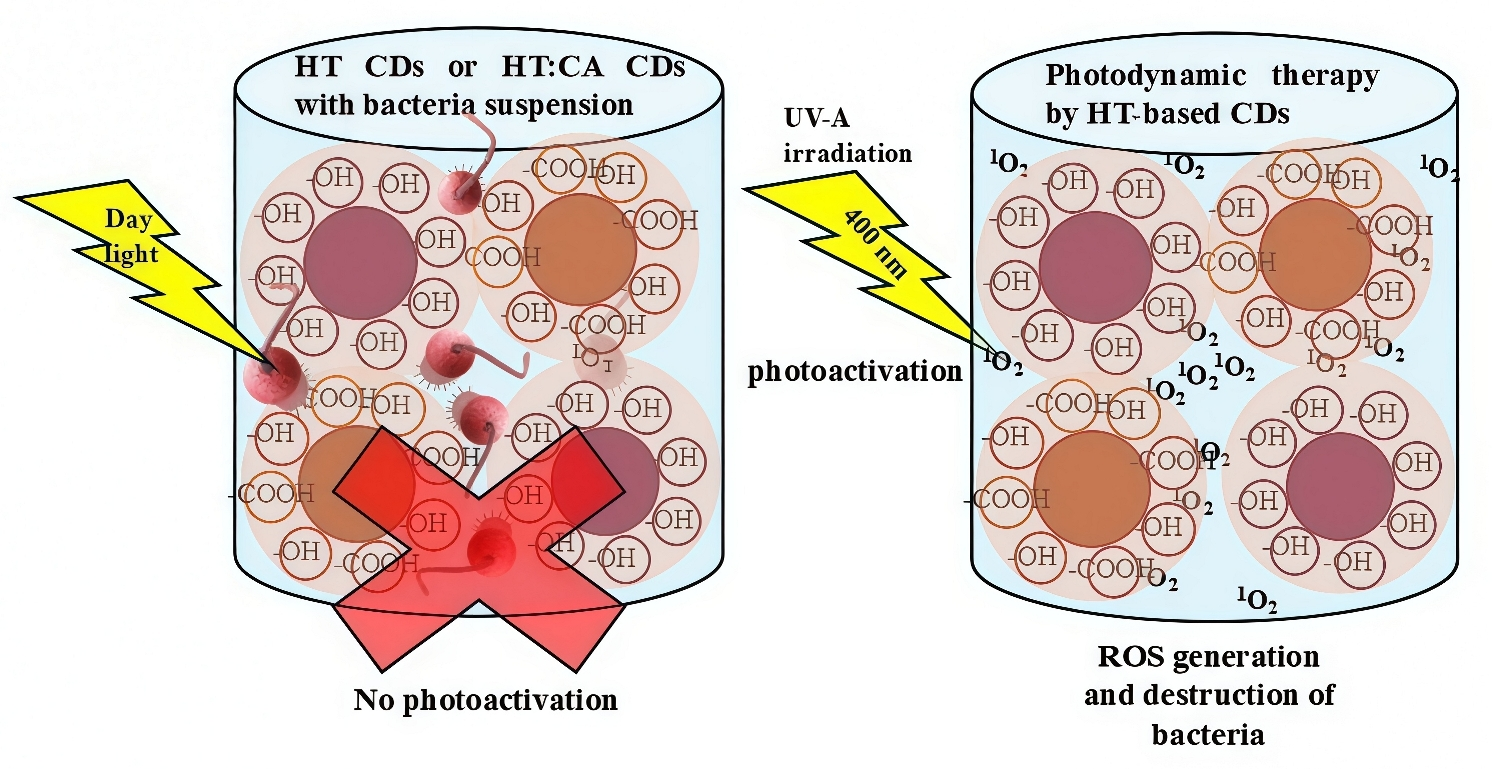
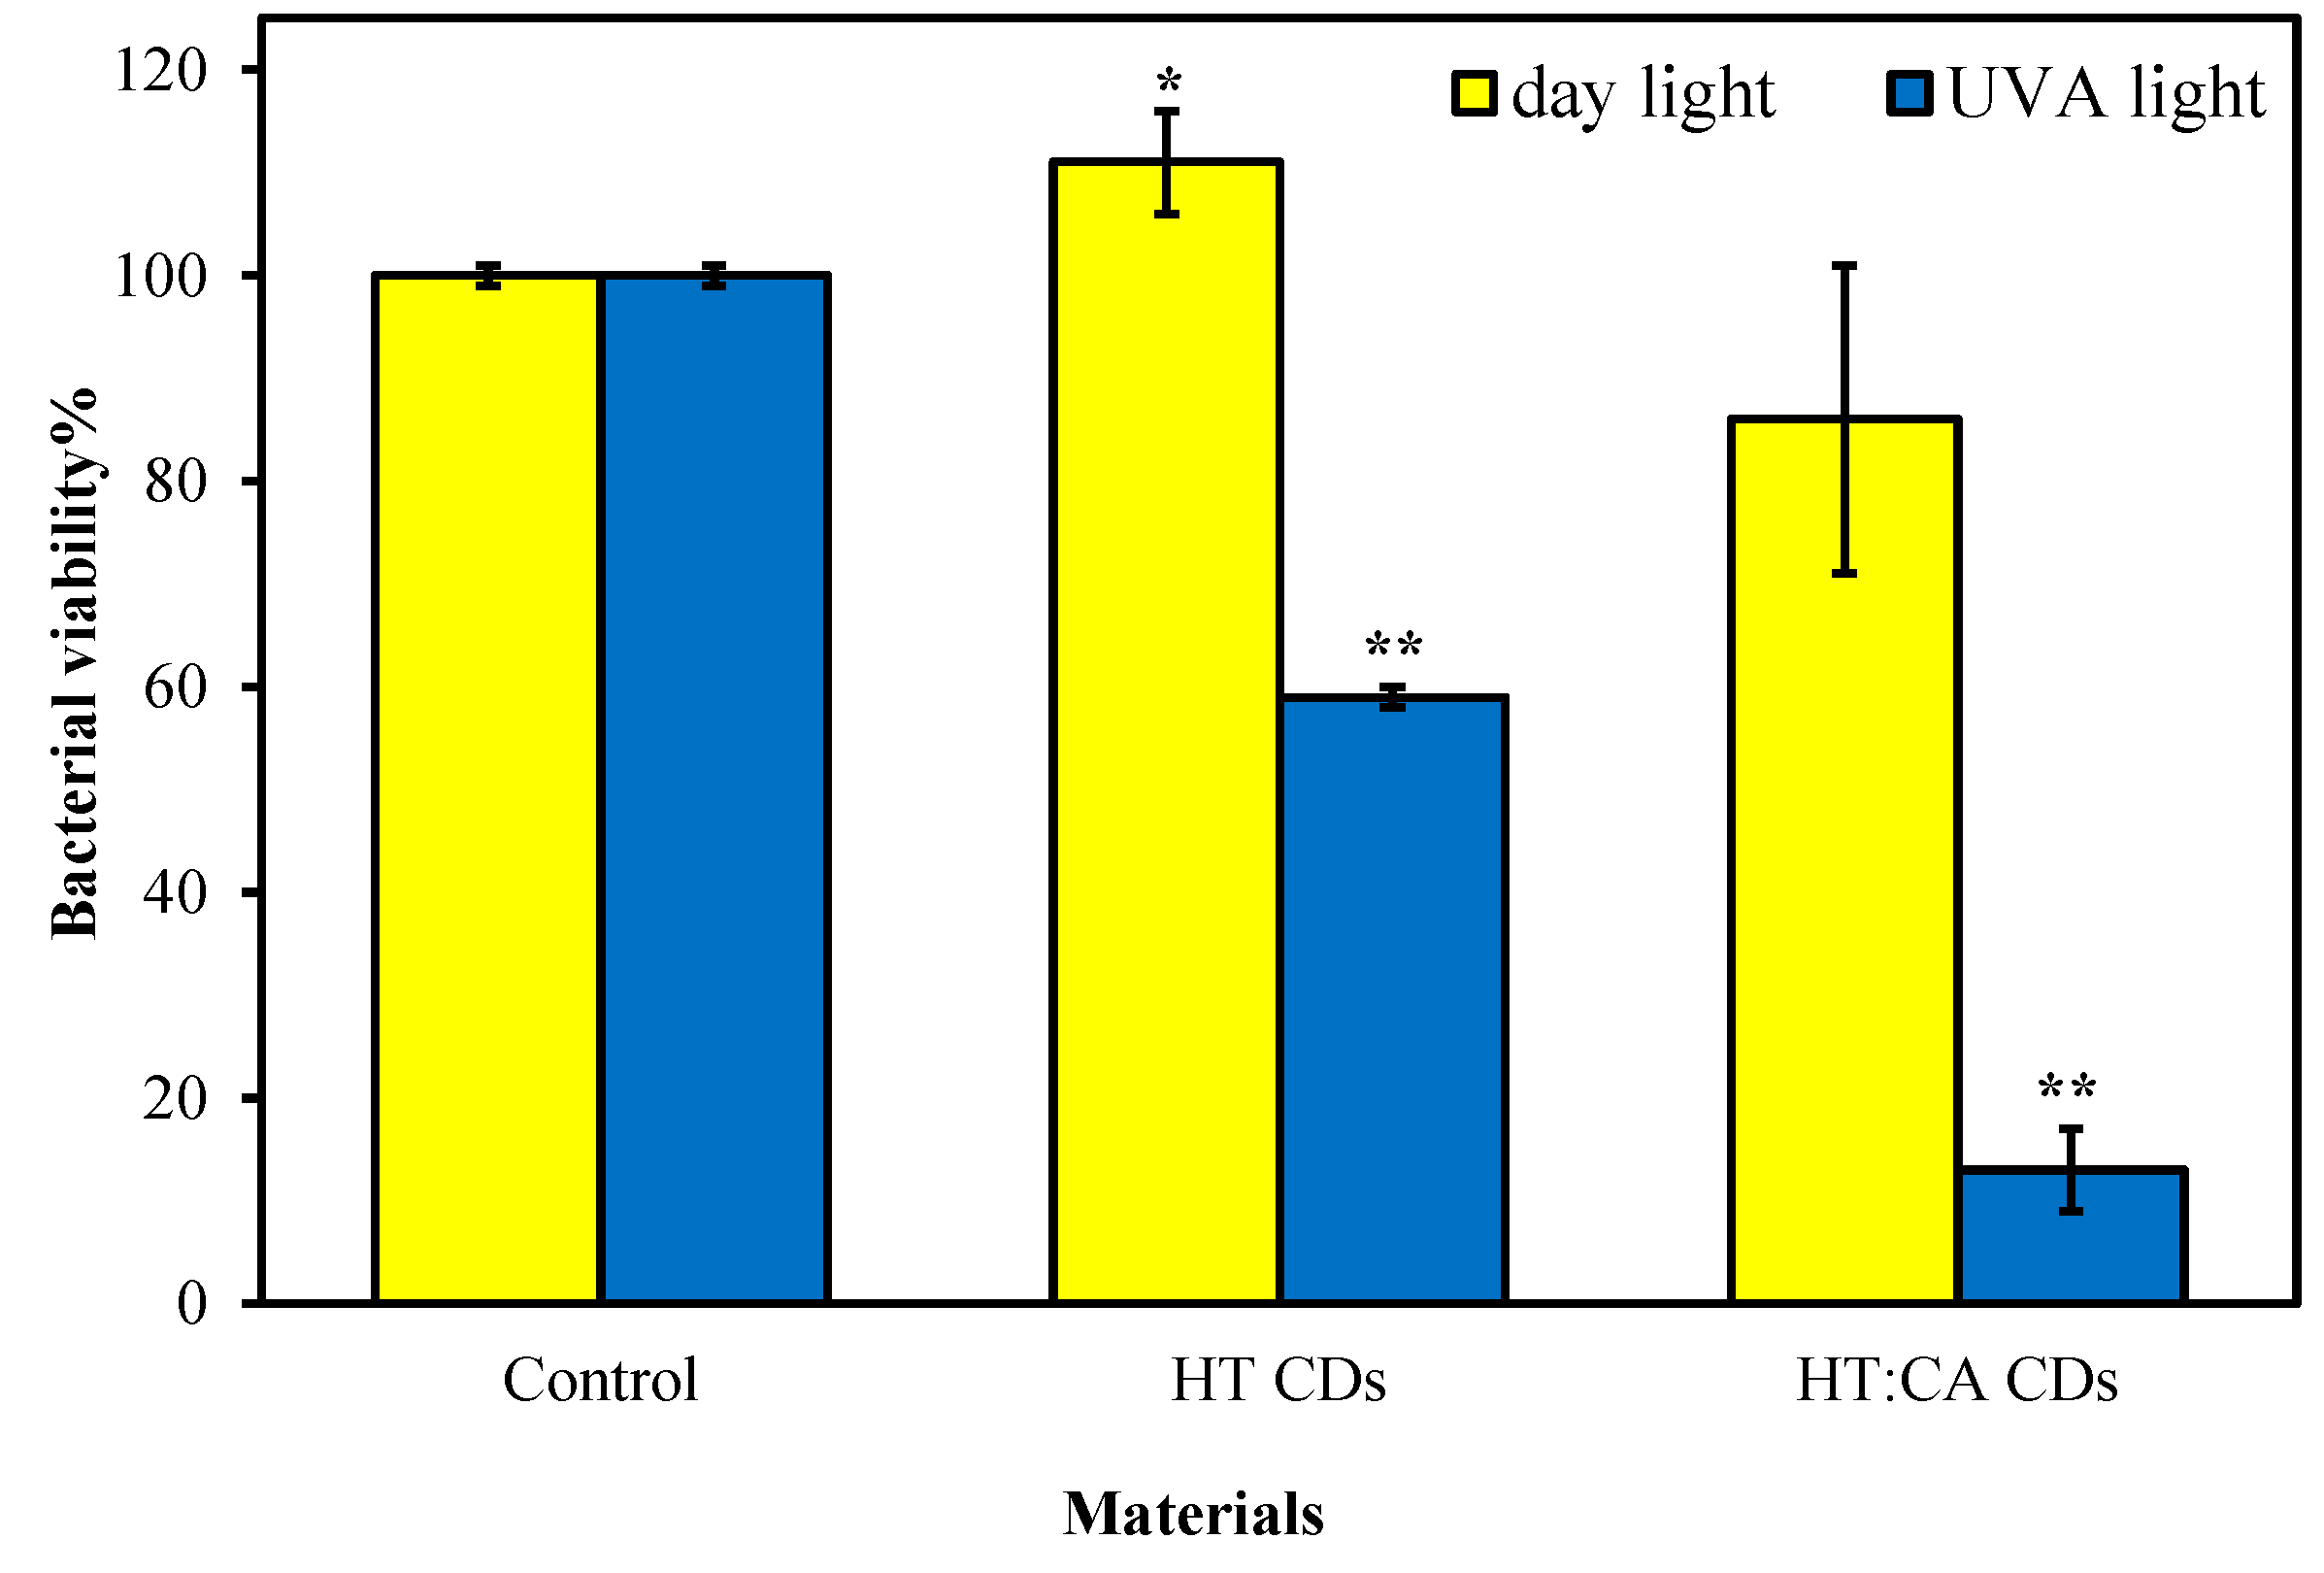
As CDs possess photoactivable materials, the light-activation ability of HT-based CDs was also investigated. As shown in Figure 7, HT CDs exhibited limited photodynamic antimicrobial activity against Staphylococcus aureus (ATCC 6538) under UV-A irradiation, resulting in relatively high bacterial cell viability. In contrast, HT:CA CDs demonstrated significantly enhanced antimicrobial performance upon UV light exposure under the same conditions. Quantitatively, bacterial viability decreased dramatically after treatment with HT:CA CDs, indicating a strong light-induced photodynamic effect. For example, HT:CA CDs achieved approximately 13 ± 4% bacterial cell viability under UV-A irradiation, whereas HT CDs showed considerably lower activity, with bacterial cell viability about 59 ± 2%. This higher antimicrobial efficacy may be associated with enhanced ROS generation by HT:CA CDs under UV-A irradiation, which could contribute to oxidative damage to bacterial membranes and intracellular components. However, ROS generation was not directly measured in the present study; therefore, ROS-mediated oxidative damage is proposed as a possible mechanism underlying the observed photodynamic antimicrobial activity.
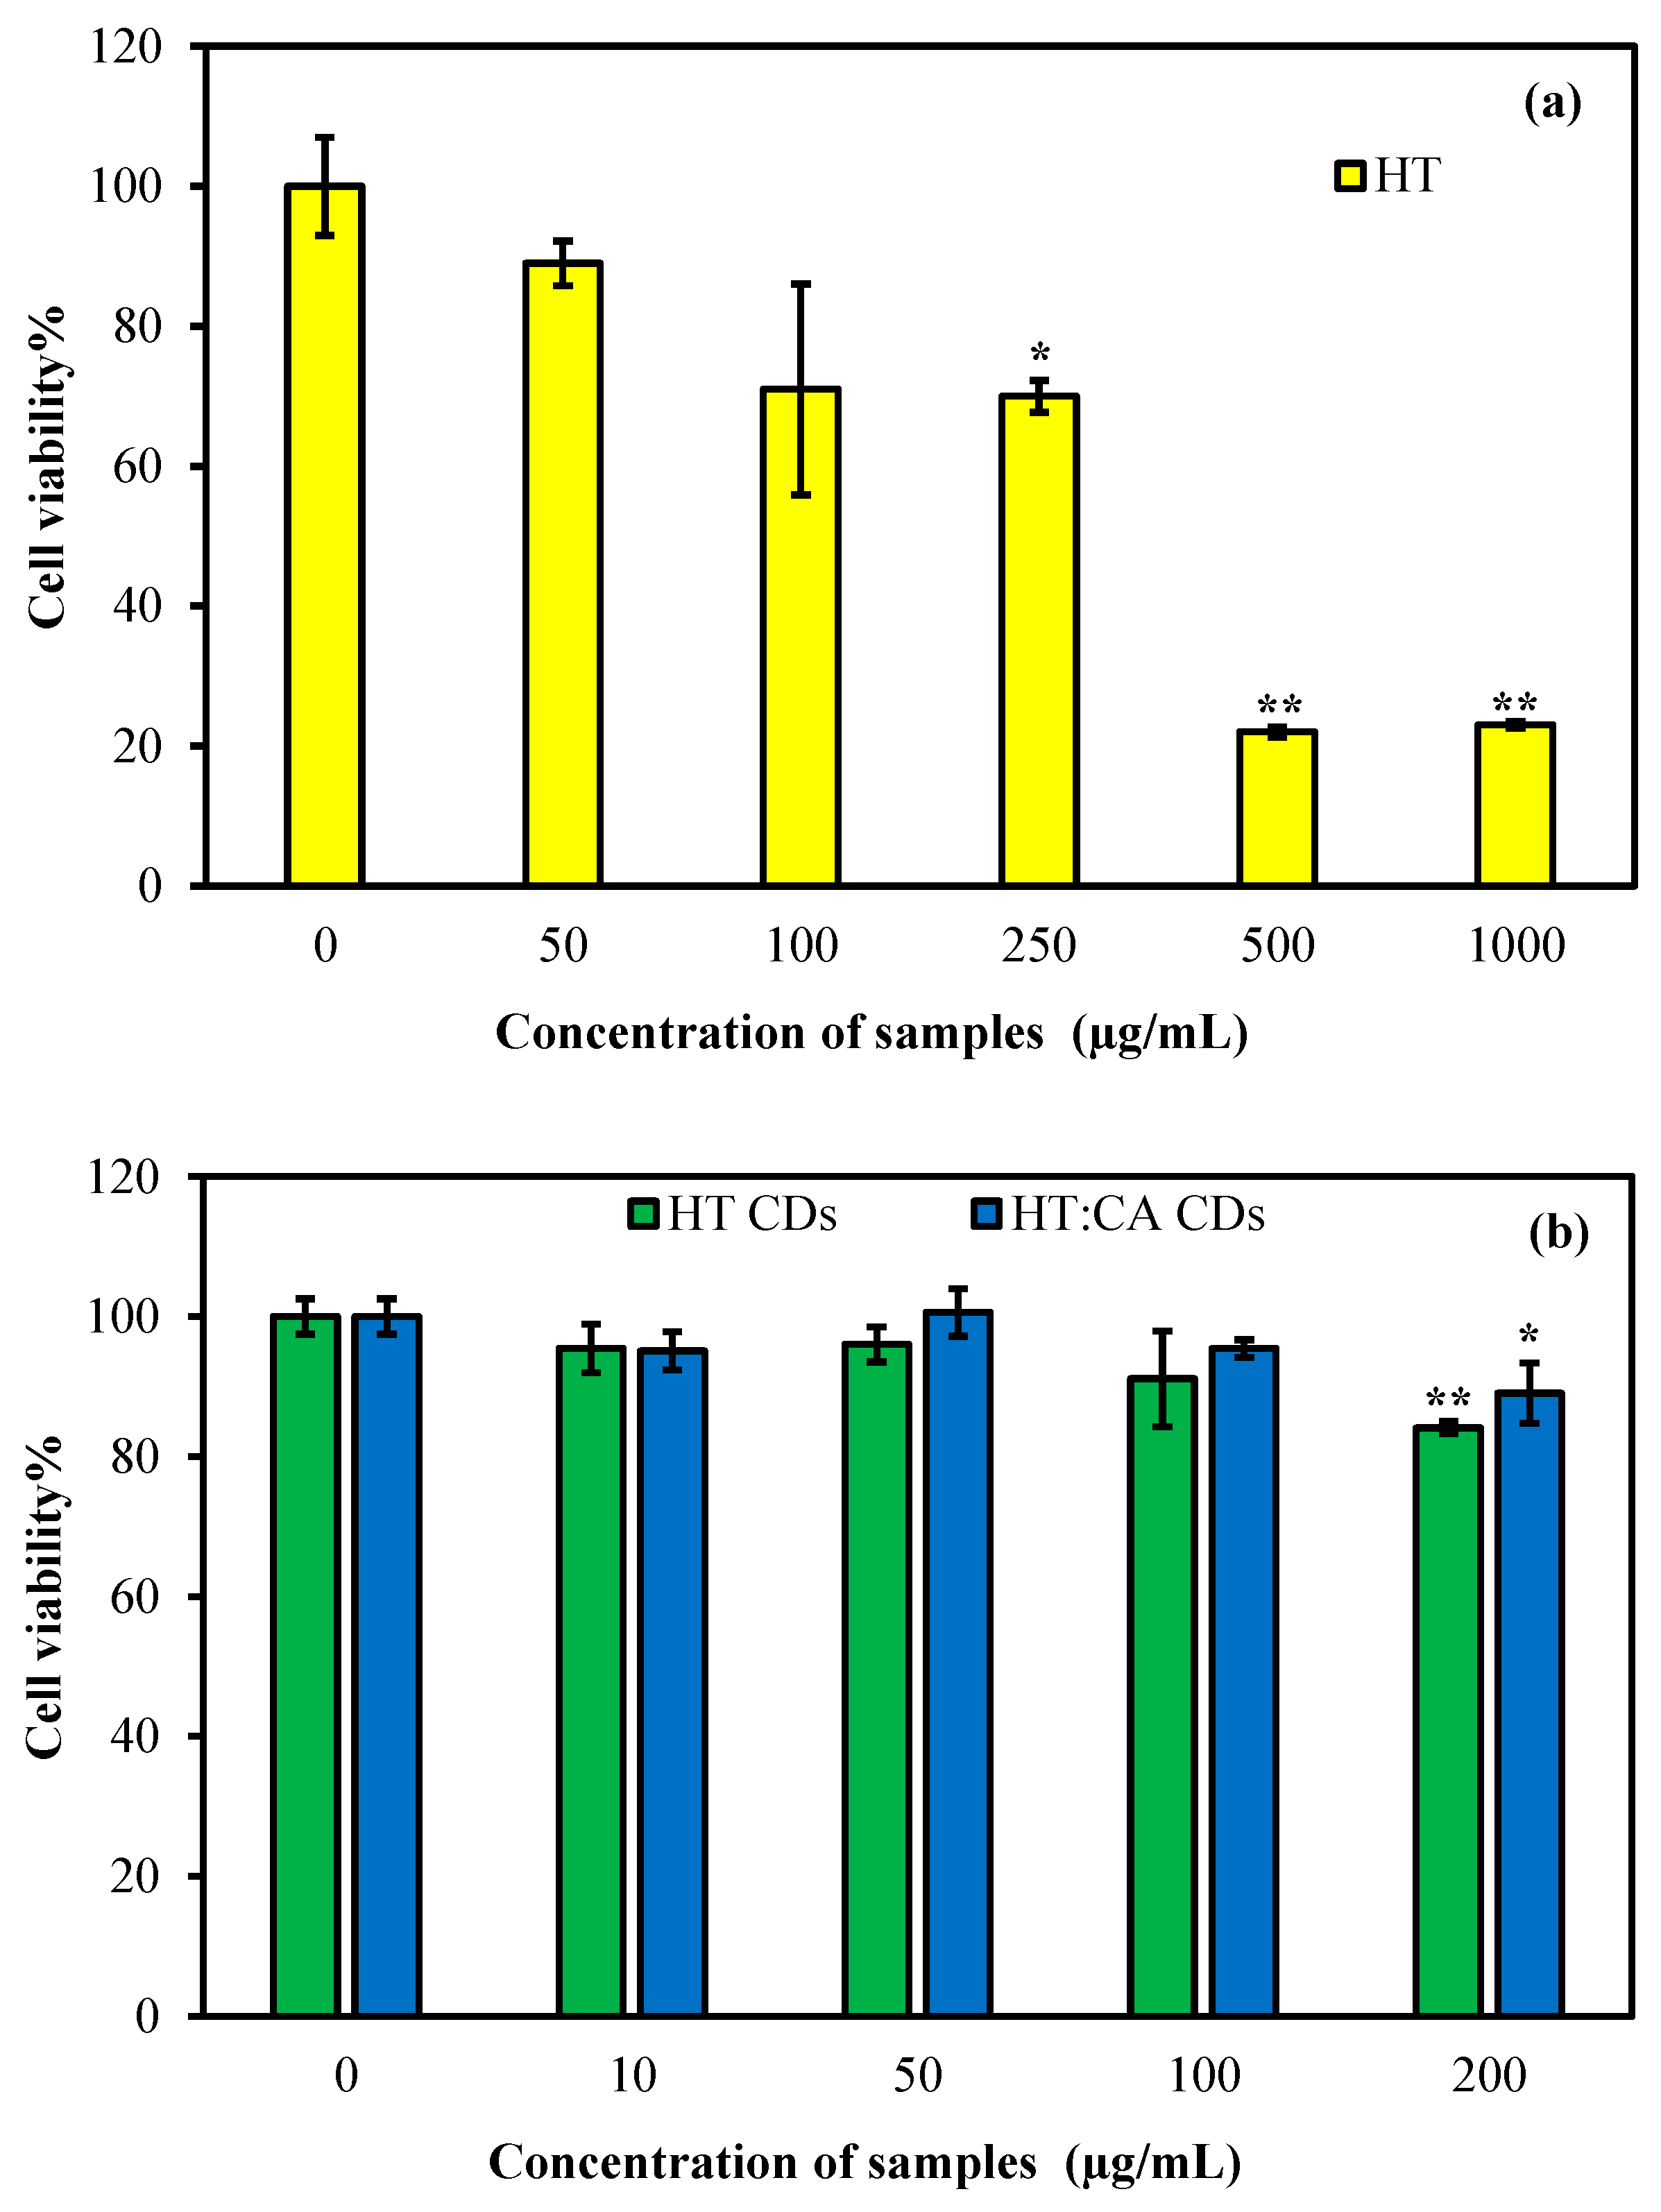
As the toxicity of CDs is the prominent factor in determining their biomedical use, the cytotoxicity of HT-based CDs was investigated using an MTT assay against L929 fibroblast cells. The MTT assay results demonstrated that HT molecules are biocompatible only at 50 μg/mL, with about 89% cell viability, as shown in Figure 8a. In contrast, HT CDs and HT:CA CDs exhibited significantly enhanced cytocompatibility, maintaining cell viability of about 90% up to 200 μg/mL.
The relatively favorable cellular response observed for the CD-based samples may be associated with their innate carbon-dot-based nanostructure. These findings are consistent with previous reports on the favorable biocompatibility and relatively low cytotoxicity of carbon-dot-based materials [51,52,53]. However, further studies are required to confirm their safety and suitability for actual biomedical applications.

4. Conclusions

CDs are generally recognized as low-toxicity nanomaterials with excellent aqueous dispersibility and tunable interaction ability with biological systems. Here, HT CDs or HT:CA CDs were successfully prepared via hydrothermal methods, with HT or HT and CA as precursors. The HT CDs and HT:CA CDs, in 10 mM KCl solution, showed a zeta potential of −23.4 mV at pH 4.80, while the HT:CA sample showed a zeta potential of −7.4 mV at pH 4.18. As expected, the pH decreased with the addition of CA, whereas the zeta potential shifted toward more neutral values, suggesting an increase in carboxyl-containing surface functional groups under acidic conditions. Also, no IEP was observed for either HT CDs or HT:CA CDs. As HT-based CDs are optical materials, it was found that their fluorescent emission intensities depend on the CA content, as HT:CA at a 1:1 ratio provides about a 6-fold increase in emission intensity. Interestingly, HT CDs showed concentration-dependent fluorescence intensity increase up to 100 µg/mL, whereas HT:CA CDs showed the same behavior up to 1000 µg/mL. Above these limit concentrations, both CDs showed reduced fluorescent emission intensities due to the quenching effect of high concentrations. Although fluorescence intensity analyses clearly confirmed the signal enhancement in HT:CA CDs, fluorescence quantum yield measurements will be considered in future studies to comprehensively evaluate the optical properties of CDs. Therefore, HT-based CDs to be used as photoactive devices should be below these concentration levels. Although both HT CDs and HT:CA CDs exhibited lower antioxidant properties, e.g., lower TPC and TFC values compared to bare HT molecules, they still somewhat retained antioxidant properties, which could be useful for bioactivity-related applications. This behavior also indicates that during the synthesis of CDs, the hydrothermal carbonization causes reactive phenolic hydroxyl groups to undergo reactions such as dehydration, oxidation, and condensation, resulting in a decrease in phenol or flavonoid content. Additionally, both the CUPRAC and FRAP tests of HT, HT CDs, and HT:CA CDs suggest that while the reactive phenolic hydroxyl groups in the structure of HT readily donate electrons to metal ions in both the CUPRAC and FRAP systems, there is limited electron transfer for HT CDs, and HT:CA CDs, as the number of the reactive phenolic hydroxyl groups were already lost. This resulted in lower CUPRAC and FRAP values for HT CDs and HT:CA CDs. The antibacterial activity of HT-based CDs was markedly enhanced upon UV-A irradiation compared to the one without UV-A irradiation. These findings indicate that HT-based CDs, particularly HT:CA CDs, exhibit a more potent, light-dependent antimicrobial influence under UV-A irradiation. The underlying mechanism may involve ROS-mediated oxidative processes; however, this mechanism remains to be confirmed by direct ROS measurements or scavenger experiments. Furthermore, the cell toxicity test on L929 fibroblasts for CDs revealed that even at relatively high concentrations, e.g., at 200 µg/mL, both CDs can be considered non-toxic, while HT molecules are toxic at the same concentrations. Therefore, HT CDs and HT:CA CDs afford great potential for future biomedical applications. However, these findings represent a preliminary in vitro proof-of-concept, and further toxicity, biocompatibility, and in vivo studies are required to establish their safety and suitability for broader biomedical or pharmaceutical applications.

Supplementary Materials

The following supporting information can be downloaded at: https://www.mdpi.com/article/10.3390/biochem6030026/s1, Figure S1: Fluorescence emission spectra of (a) HT CDs and (b) HT:CA CDs at various excitation wavelengths. Figure S2: Fluorescence emission spectra of (a) HT CD and (b) HT:CA CDs at various concentrations at 300 nm excitation wavelengths.

Author Contributions

Conceptualization, N.S.; methodology, M.S., B.A. and N.S.; validation, M.S. and B.A.; formal analysis, M.S., B.A. and N.S.; investigation, M.S., B.A. and N.S.; resources, N.S.; writing—original draft preparation, M.S. and B.A.; writing—review and editing, N.S.; visualization, N.S.; supervision, N.S.; project administration, N.S.; funding acquisition, N.S. All authors have read and agreed to the published version of the manuscript.

Funding

This research received no external funding.

Data Availability Statement

All data generated in this research are contained within this article.

Conflicts of Interest

The authors declare no conflicts of interest.

Abbreviations

The following abbreviations are used in this manuscript:
CDsCarbon Dots
HTHematoxylin
CACitric Acid
ROSReactive Oxygen Species
TPCTotal Phenolic Content
FCFolin–Ciocalteu
TFCTotal Flavonoid Content
CUPRACCopper (II) reducing antioxidant capacity
FRAPFerric (III) reducing antioxidant power
TPTZ2,4,6-tris(2-pyridyl)-s-triazine
DMEMDulbecco’s Modified Eagle’s Medium
FBSFetal Bovine Serum
MTT3-(4,5-dimethylthiazol-2-yl)-2,5-diphenyltetrazolium bromide
DMSODimethyl sulfoxide
FT-IRFourier Transform Infrared Spectroscopy
TGAThermogravimetric Analysis
DLSDynamic Light Scattering
PBSPhosphate Buffer Solution
KClPotassium Chloride

References

  1. Jabeen, S.; Li, S.; Chen, X.; Lin, Y.; Ji, Y.; Yu, R.; Chu, J.; Geng, H. Nitrogen-Doped Carbon Dots: A Rapid Route to Blue-Green Luminescence by Na Ion Dispersion Method for Latent Fingerprint Detection. J. Photochem. Photobiol. A Chem. 2026, 478, 117215. [Google Scholar] [CrossRef] [Scilit]
  2. Xue, J.; Hu, H.; Mao, X.; Li, W.; Dong, Y.; Li, Z.; Gao, W. Sunlight-Excited Biomass-Derived Carbon Dots-Alumina Composites with Ultralong Room-Temperature Phosphorescence and Time-Dependent Phosphorescence Color. J. Photochem. Photobiol. A Chem. 2026, 474, 116962. [Google Scholar] [CrossRef] [Scilit]
  3. Jaleel, J.A.; Pramod, K. Artful and Multifaceted Applications of Carbon Dot in Biomedicine. J. Control. Release 2018, 269, 302–321. [Google Scholar] [CrossRef] [Scilit] [PubMed]
  4. Ozyurt, D.; Al Kobaisi, M.; Hocking, R.K.; Fox, B. Properties, Synthesis, and Applications of Carbon Dots: A Review. Carbon Trends 2023, 12, 100276. [Google Scholar] [CrossRef] [Scilit]
  5. Iannazzo, D.; Celesti, C.; Cardo, L.; Prato, M.; Bitto, A. Carbon Dots for Drug Delivery: Insights into Their Potential in Nanopharmacology. Pharmacol. Rev. 2026, 78, 100107. [Google Scholar] [CrossRef] [Scilit] [PubMed]
  6. Phillips, M.J.A.; Ung, A.T.; Harry, E.J.; Ashmore, J.; McDonagh, A.M. Synthesis and Investigation of Tricyclic Isoquinoline Derivatives as Antibacterial Agents. BioChem 2024, 5, 1. [Google Scholar] [CrossRef] [Scilit]
  7. Cai, D.; Zhong, X.; Xu, L.; Xiong, Y.; Deng, W.; Zou, G.; Hou, H.; Ji, X. Biomass-Derived Carbon Dots: Synthesis, Modification and Application in Batteries. Chem. Sci. 2025, 16, 4937–4970. [Google Scholar] [CrossRef] [Scilit] [PubMed]
  8. Li, H.; Wang, G.; Zhang, H. Quantum-Dots-in-Graphitized Carbon Functional Materials for Energy Storage. Next Energy 2026, 12, 100632. [Google Scholar] [CrossRef] [Scilit]
  9. Xu, D.; Lin, Q.; Chang, H. Recent Advances and Sensing Applications of Carbon Dots. Small Methods 2020, 4, 1900387. [Google Scholar] [CrossRef] [Scilit]
  10. Elagamy, S.H.; Ali, M.A.M.; Naguib, I.A. Eco-Friendly Strategies for Carbon Dot Synthesis: Pharmaceutical-Derived CDs as an Emerging Trend. Microchem. J. 2026, 224, 117739. [Google Scholar] [CrossRef] [Scilit]
  11. Turco, F.; Squeo, B.M.; Cama, E.S.; Cataldo, A.; Villafiorita-Monteleone, F.; Botta, C.; Luzzati, S.; Ferretti, A.M.; Scavia, G.; Lamperti, A.; et al. Towards Sustainable and Safe-by-Design Energy Solutions: Citric Acid/Perylene Derived Carbon Dots as Cathode Interfacial Layer in Organic Solar Cells. Synth. Met. 2026, 317, 118034. [Google Scholar] [CrossRef] [Scilit]
  12. Qin, M.; Fang, Q.; Tan, K. Biomass-Derived White Carbon Dots: Green Synthesis, Multicolor Separation, and Applications in White LEDs and Information Encryption. Diam. Relat. Mater. 2026, 164, 113450. [Google Scholar] [CrossRef] [Scilit]
  13. Wang, Z.; He, Q.; Deng, B.; He, L.; Hu, M.; Wang, Y.; Zhang, J.; Yang, S. Synthesis, Characteristics, and Applications of Sustainable Carbon Quantum Dots Derived from Biomass of Recombinant Bacterium. Bioresour. Technol. 2026, 456, 134966. [Google Scholar] [CrossRef] [Scilit] [PubMed]
  14. Das, B.; Pal, P.; Dadhich, P.; Dutta, J.; Dhara, S. In Vivo Cell Tracking, Reactive Oxygen Species Scavenging, and Antioxidative Gene Down Regulation by Long-Term Exposure of Biomass-Derived Carbon Dots. ACS Biomater. Sci. Eng. 2019, 5, 346–356. [Google Scholar] [CrossRef] [Scilit] [PubMed]
  15. Spyrou, S.; Bellou, M.G.; Papanikolaou, A.; Nakou, K.; Kontogianni, V.G.; Chatzikonstantinou, A.V.; Stamatis, H. Evaluation of Antioxidant, Antibacterial and Enzyme-Inhibitory Properties of Dittany and Thyme Extracts and Their Application in Hydrogel Preparation. BioChem 2024, 4, 166–188. [Google Scholar] [CrossRef] [Scilit]
  16. De Almeida, A.J.P.O.; de Oliveira, J.C.P.L.; da Silva Pontes, L.V.; de Souza Júnior, J.F.; Gonçalves, T.A.F.; Dantas, S.H.; de Almeida Feitosa, M.S.; Silva, A.O.; de Medeiros, I.A. ROS: Basic Concepts, Sources, Cellular Signaling, and Its Implications in Aging Pathways. Oxidative Med. Cell. Longev. 2022, 2022, 1225578. [Google Scholar] [CrossRef] [Scilit] [PubMed]
  17. Manful, C.F.; Fordjour, E.; Subramaniam, D.; Sey, A.A.; Abbey, L.; Thomas, R. Antioxidants and Reactive Oxygen Species: Shaping Human Health and Disease Outcomes. Int. J. Mol. Sci. 2025, 26, 7520. [Google Scholar] [CrossRef] [Scilit] [PubMed]
  18. Zhao, D.; Liu, H.; Zhang, C.; Xiao, X.; He, Z. UV-Induced Oxidase Activity of Carbon Dots in Visible UVA Dosage, Escherichia Coli Quantification and Bacterial Typing. Anal. Chim. Acta 2024, 1288, 342140. [Google Scholar] [CrossRef] [Scilit] [PubMed]
  19. Sahiner, M.; Tian, Z.; Demirci, S.; Sunol, A.; Allen-Gipson, D.S.; Sahiner, N. Bio-MOFs Based on Natural Phenolic, Hematoxylin Leverages Biomedical Applications: Enzyme Inhibition, Antioxidant, and Antibacterial Properties. Chem. Biodivers. 2025, 22, e202401857. [Google Scholar] [CrossRef] [Scilit] [PubMed]
  20. Das, A.; Tomita, N.; Syme, K.J.; Ma, W.; O’Connor, P.; Corbett, K.N.; Ren, B.; Liu, X.; Hassanpour, S. Cross-Modality Learning for Predicting Immunohistochemistry Biomarkers from Hematoxylin and Eosin–Stained Whole Slide Images. Am. J. Pathol. 2025, 195, 2400–2410. [Google Scholar] [CrossRef] [Scilit] [PubMed]
  21. Balaha, H.M.; Ali, K.M.; Mahmoud, A.; Aboudessouki, A.; Azam, M.T.; Giridharan, G.A.; Gondim, D.; El-Baz, A. From Hematoxylin and Eosin to Masson’s Trichrome: A Comprehensive Framework for Virtual Stain Transformation in Chronic Liver Disease Diagnosis. Diagnostics 2026, 16, 764. [Google Scholar] [CrossRef] [Scilit] [PubMed]
  22. Jakubovský, J.; Guller, L.; Černá, M.; Balážová, K.; Polák, Š.; Jakubovská, V.; Babál, P. Fluorescence of Hematoxylin and Eosin-Stained Histological Sections of the Human Spleen. Acta Histochem. 2002, 104, 353–356. [Google Scholar] [CrossRef] [Scilit] [PubMed]
  23. Yin, H.-H.; Han, Y.-L.; Yan, X.; Guan, Y.-X. Hematoxylin Modulates Tau-RD Protein Fibrillization and Ameliorates Alzheimer’s Disease-like Symptoms in a Yeast Model. Int. J. Biol. Macromol. 2023, 250, 126140. [Google Scholar] [CrossRef] [Scilit] [PubMed]
  24. Duan, Q.; Guo, Q.; Xi, Y.; Su, H.; Xue, J.; Zhang, Q.; Guo, X.; Han, H.; Zhou, Y.; Sang, S.; et al. A New Staining Method Using Different Targeted Fluorescent Carbon Dots for Tissue Sections Analysis and Diagnosis. Diam. Relat. Mater. 2025, 152, 111949. [Google Scholar] [CrossRef] [Scilit]
  25. Lee, S.-J.; Zheng, Y.-Y.; Chen, W.-M.; Hsueh, Y.-H. Nitrogen-Doped Carbon Dots: A New Powerful Fluorescent Dye with Substantial Effect on Bacterial Cell Labeling. ACS Omega 2024, 9, 36453–36463. [Google Scholar] [CrossRef] [Scilit] [PubMed]
  26. Wang, Y.; Chen, J.; Tian, J.; Wang, G.; Luo, W.; Huang, Z.; Huang, Y.; Li, N.; Guo, M.; Fan, X. Tryptophan-Sorbitol Based Carbon Quantum Dots for Theranostics Against Hepatocellular Carcinoma. J. Nanobiotechnol. 2022, 20, 78. [Google Scholar] [CrossRef] [Scilit] [PubMed]
  27. Meziani, M.J.; Dong, X.; Zhu, L.; Jones, L.P.; LeCroy, G.E.; Yang, F.; Wang, S.; Wang, P.; Zhao, Y.; Yang, L.; et al. Visible-Light-Activated Bactericidal Functions of Carbon “Quantum” Dots. ACS Appl. Mater. Interfaces 2016, 8, 10761–10766. [Google Scholar] [CrossRef] [Scilit] [PubMed]
  28. Jiang, Y.; Tan, Z.; Zhao, T.; Wu, J.; Li, Y.; Jia, Y.; Peng, Z. Indocyanine Green Derived Carbon Dots with Significantly Enhanced Properties for Efficient Photothermal Therapy. Nanoscale 2023, 15, 1925–1936. [Google Scholar] [CrossRef] [Scilit] [PubMed]
  29. Lagos, K.J.; García, D.; Cuadrado, C.F.; de Souza, L.M.; Mezzacappo, N.F.; da Silva, A.P.; Inada, N.; Bagnato, V.; Romero, M.P. Carbon Dots: Types, Preparation, and Their Boosted Antibacterial Activity by Photoactivation. Current Status and Future Perspectives. WIREs Nanomed. Nanobiotechnol. 2023, 15, e1887. [Google Scholar] [CrossRef] [Scilit] [PubMed]
  30. Nait Irahal, I.; Thoume, A.; Chbel, A.; Wahnou, H.; Abdou-Allah, F.; Lafnoune, A.; Achagar, R.; Left, D.B.; Zertoubi, M.; Bourhim, N. Carbon Dot Nanotherapeutics Modulating the Polyol Pathway and Targeting Infection Pathogens Associated with Diabetic Complications. BioChem 2026, 6, 7. [Google Scholar] [CrossRef] [Scilit]
  31. Dong, X.; Liang, W.; Meziani, M.J.; Sun, Y.-P.; Yang, L. Carbon Dots as Potent Antimicrobial Agents. Theranostics 2020, 10, 671–686. [Google Scholar] [CrossRef] [Scilit] [PubMed]
  32. He, Q.; Zhang, L. A Comprehensive Review of Carbon Dots for Antimicrobial Therapy: From Design Mechanisms to Theranostic Applications. Discov. Nano 2026, 21, 95. [Google Scholar] [CrossRef] [Scilit] [PubMed]
  33. Beckhauser, T.F.; Francis-Oliveira, J.; De Pasquale, R. Reactive Oxygen Species: Physiological and Physiopathological Effects on Synaptic Plasticity. J. Exp. Neurosci. 2016, 10, 23–28. [Google Scholar] [CrossRef] [Scilit] [PubMed]
  34. Yu, M.; Li, P.; Huang, R.; Xu, C.; Zhang, S.; Wang, Y.; Gong, X.; Xing, X. Antibacterial and Antibiofilm Mechanisms of Carbon Dots: A Review. J. Mater. Chem. B 2023, 11, 734–754. [Google Scholar] [CrossRef] [Scilit] [PubMed]
  35. Simi, N.J.; Joseph, B.; Mathews, J.M.; Mathew, A.; Raju, A.; Krishnan, A.B.; Sebastian, A. Hydrothermal Synthesis of Carbon Dots: Unveiling Temperature Effects on Optical, Structural, and Agricultural Performance. Results Surf. Interfaces 2026, 23, 100749. [Google Scholar] [CrossRef] [Scilit]
  36. Sharifi-Rad, M.; Kishore Mohanta, Y.; Pohl, P.; Nayak, D.; Messaoudi, M. Facile Phytosynthesis of Gold Nanoparticles Using Nepeta Bodeana Bunge: Evaluation of Its Therapeutics and Potential Catalytic Activities. J. Photochem. Photobiol. A Chem. 2024, 446, 115150. [Google Scholar] [CrossRef] [Scilit]
  37. Çekiç, S.D.; Başkan, K.S.; Tütem, E.; Apak, R. Modified Cupric Reducing Antioxidant Capacity (CUPRAC) Assay for Measuring the Antioxidant Capacities of Thiol-Containing Proteins in Admixture with Polyphenols. Talanta 2009, 79, 344–351. [Google Scholar] [CrossRef] [Scilit] [PubMed]
  38. Das, R.S.; Lingait, D.; Gaharwar, S.S.; Kumar, A.; Gokhale, S. Green Synthesis of Reduced Graphene Oxide with Multiple Environmental Applications. J. Photochem. Photobiol. A Chem. 2023, 444, 115021. [Google Scholar] [CrossRef] [Scilit]
  39. Kim, H.-C.; Kim, E.; Jeong, S.W.; Ha, T.-L.; Park, S.-I.; Lee, S.G.; Lee, S.J.; Lee, S.W. Magnetic Nanoparticle-Conjugated Polymeric Micelles for Combined Hyperthermia and Chemotherapy. Nanoscale 2015, 7, 16470–16480. [Google Scholar] [CrossRef] [Scilit] [PubMed]
  40. Sahiner, M.; Tian, Z.; Allen-Gipson, D.; Sunol, A.K.; Sahiner, N. Natural Molecule-Derived Nanogels from Hematoxylin and l-Lysine for Biomedical Use with Antimicrobial Properties. Int. J. Mol. Sci. 2024, 26, 138. [Google Scholar] [CrossRef] [Scilit] [PubMed]
  41. Zadeh, S.S.; Ebrahimi, A.; Shahraki, A. The Impact of π-π Stacking Interactions on Photo-Physical Properties of Hydroxyanthraquinones. Spectrochim. Acta Part A Mol. Biomol. Spectrosc. 2023, 292, 122453. [Google Scholar] [CrossRef] [Scilit] [PubMed]
  42. Chen, T.; Li, M.; Liu, J. π–π Stacking Interaction: A Nondestructive and Facile Means in Material Engineering for Bioapplications. Cryst. Growth Des. 2018, 18, 2765–2783. [Google Scholar] [CrossRef] [Scilit]
  43. Weitner, T.; Friganović, T.; Šakić, D. Inner Filter Effect Correction for Fluorescence Measurements in Microplates Using Variable Vertical Axis Focus. Anal. Chem. 2022, 94, 7107–7114. [Google Scholar] [CrossRef] [Scilit] [PubMed]
  44. Fonin, A.V.; Sulatskaya, A.I.; Kuznetsova, I.M.; Turoverov, K.K. Fluorescence of Dyes in Solutions with High Absorbance. Inner Filter Effect Correction. PLoS ONE 2014, 9, e103878. [Google Scholar] [CrossRef] [Scilit] [PubMed]
  45. Yang, H.; Liu, Y.; Guo, Z.; Lei, B.; Zhuang, J.; Zhang, X.; Liu, Z.; Hu, C. Hydrophobic Carbon Dots with Blue Dispersed Emission and Red Aggregation-Induced Emission. Nat. Commun. 2019, 10, 1789. [Google Scholar] [CrossRef] [Scilit] [PubMed]
  46. Li, W.; Fu, Y.; Liu, T.; Li, H.; Huang, M. Accurate Correction Method and Algorithm of Fluorescence Secondary Inner Filter Effect (SIEF) in Fluorescence Quantitative Analysis. Spectrochim. Acta Part A Mol. Biomol. Spectrosc. 2023, 288, 122147. [Google Scholar] [CrossRef] [Scilit] [PubMed]
  47. Ji, Z.; Sheardy, A.; Zeng, Z.; Zhang, W.; Chevva, H.; Allado, K.; Yin, Z.; Wei, J. Tuning the Functional Groups on Carbon Nanodots and Antioxidant Studies. Molecules 2019, 24, 152. [Google Scholar] [CrossRef] [Scilit] [PubMed]
  48. Olia, F.; Fiori, F.; Innocenzi, P. Antioxidant-Oxidant Dual Action of Carbon Dots Obtained Through Thermal Processing of Citric Acid. Next Mater. 2025, 8, 100756. [Google Scholar] [CrossRef] [Scilit]
  49. Chen, J.; Yang, J.; Ma, L.; Li, J.; Shahzad, N.; Kim, C.K. Structure-Antioxidant Activity Relationship of Methoxy, Phenolic Hydroxyl, and Carboxylic Acid Groups of Phenolic Acids. Sci. Rep. 2020, 10, 2611. [Google Scholar] [CrossRef] [Scilit] [PubMed]
  50. Li, D.; Na, X.; Wang, H.; Xie, Y.; Cong, S.; Song, Y.; Xu, X.; Zhu, B.-W.; Tan, M. Fluorescent Carbon Dots Derived from Maillard Reaction Products: Their Properties, Biodistribution, Cytotoxicity, and Antioxidant Activity. J. Agric. Food Chem. 2018, 66, 1569–1575. [Google Scholar] [CrossRef] [Scilit] [PubMed]
  51. Li, H.; Kang, Z.; Liu, Y.; Lee, S.-T. Carbon Nanodots: Synthesis, Properties and Applications. J. Mater. Chem. 2012, 22, 24230–24253. [Google Scholar] [CrossRef] [Scilit]
  52. Lim, S.Y.; Shen, W.; Gao, Z. Carbon Quantum Dots and Their Applications. Chem. Soc. Rev. 2015, 44, 362–381. [Google Scholar] [CrossRef] [Scilit] [PubMed]
  53. Baker, S.N.; Baker, G.A. Luminescent Carbon Nanodots: Emergent Nanolights. Angew. Chem. Int. Ed. 2010, 49, 6726–6744. [Google Scholar] [CrossRef] [Scilit] [PubMed]
Figure 1. Schematic of the preparation of HT CDs and HT:CA CDs.
Biochem 06 00026 g001
Figure 2. (a) FT-IR spectra of HT, CA and HT-based CDs and (b) their thermograms, and (c) the schematic representation of the chemical structure and surface functional group evolution of HT CDs and HT:CA CDs.
Biochem 06 00026 g002
Figure 3. The pH-dependent potential measurements of HT CDs and HT: CA CDs.
Biochem 06 00026 g003
Figure 4. Fluorescence emission spectra of the synthesized HT-based CDs exhibiting (a) the individual maximum fluorescence emission concentrations and minimum quenching concentrations for HT CDs and HT:CA CDs, (b) a direct comparison of their fluorescence intensities at 100 μg/mL and 1000 μg/mL concentrations, and digital camera images of HT CDs and HT:CA CDs (c) in day light, and (d) under 365 nm irradiation with a UV light. [Fluorescence analysis condition λex = 300 nm and 700 PMT voltage].
Biochem 06 00026 g004
Figure 5. (a) Total Phenolic Content (TPC) values in terms of gallic acid (GA) equivalency and (b) Total Flavonoid Content (TFC) values in terms of catechin equivalency of bare HT, HT:CDs, and HT:CA CDs.
Biochem 06 00026 g005
Figure 6. (a) Copper (II) reducing antioxidant capacity (CUPRAC) and (b) ferric (III) reducing antioxidant power (FRAP) of bare HT, HT CDs, and HT:CA CDs.
Biochem 06 00026 g006
Figure 7. Light-activated antimicrobial activity of HT CDs and HT:CA CDs against Staphylococcus aureus (ATCC 6538). The statistical significance was determined by comparing each HT-based CD sample with the corresponding bacterial control using a two-tailed Welch’s t-test. (* p < 0.05, ** p < 0.01).
Biochem 06 00026 g007
Figure 8. Cytotoxicity of (a) bare HT and (b) HT CDs and HT:CA CDs against L929 fibroblast cells. Statistical significance was determined by comparing each concentration with the corresponding 0 µg/mL control. (* p <0.05, ** p < 0.01; two-tailed Welch’s t-test).
Biochem 06 00026 g008
Table 1. HT CDs and HT:CA CDs size and zeta potential values in a 10 mM KCl solution, and comparison of their fluorescent (FL) properties.
CDs TypesSize (nm)pHZeta Potential (mV)Con. (µg/mL)Quenching Con. (µg/mL)λex (nm)λem (nm)FL Intensity (a.u.)
HT115 ± 14.80−23.4 ± 0.910010003003295181
HT:CA310 ± 194.18−7.4 ± 0.81000200030033231,840
Disclaimer/Publisher’s Note: The statements, opinions and data contained in all publications are solely those of the individual author(s) and contributor(s) and not of MDPI and/or the editor(s). MDPI and/or the editor(s) disclaim responsibility for any injury to people or property resulting from any ideas, methods, instructions or products referred to in the content.