1. Introduction
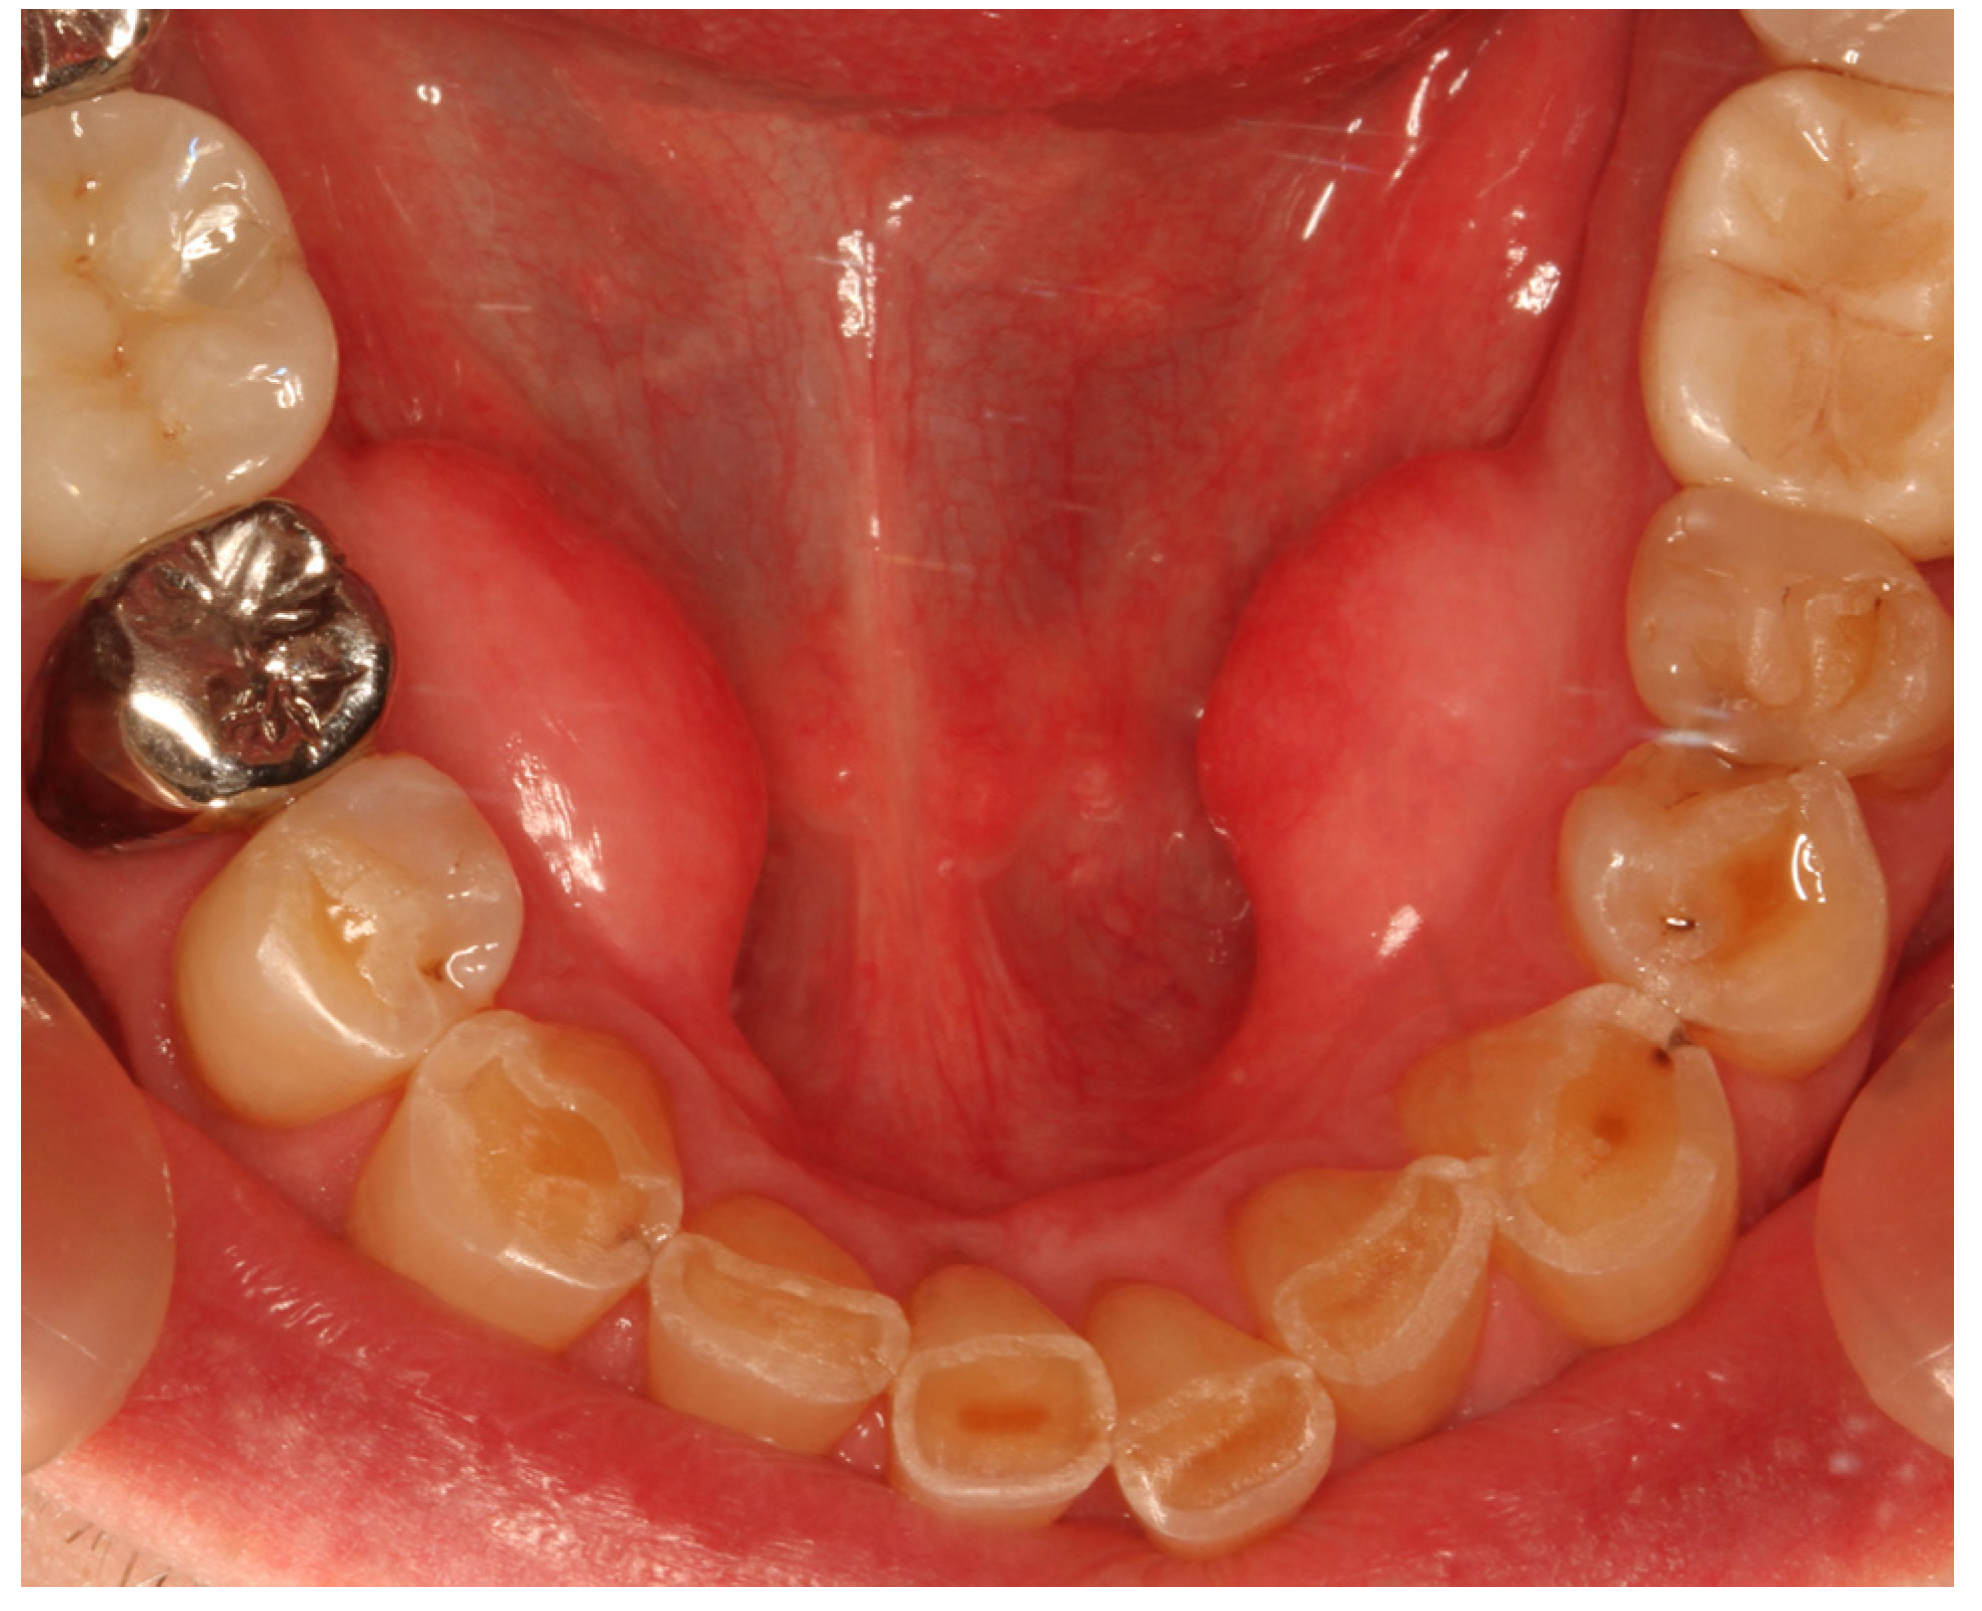
Torus mandibularis (TM) is a frequently occurring, benign bone bulge (exostosis) on the lingual surface of the mandible [
1], usually located bilaterally, between the canines and molars and superior to the mylohyoid line (
Figure 1) [
2].
Mandibular tori usually consist of very dense cortical bone, small amounts of cancellous bone, and fatty pulp, covered by normal but thin oral mucosa with underlying periosteum [
3]. According to Dou et al., the mesenchymal stem cells of TMs have higher osteogenic activity in vitro than stem cells from normal jawbone and are, therefore, rich in osteoblasts [
4].
The development of torus mandibularis usually begins in the third decade of life, tends to grow slowly, and is most frequently observed in middle-aged people [
5]. Mandibular torus thickness showed a clear age-related increase, with the strongest effects observed in males with maintained occlusal contact. Multivariable regression analysis confirmed a significant association between age and torus thickness, which was further influenced by occlusal status and sex [
6].
The etiology and pathogenesis of TM are still unclear, but a genetic predisposition and a multifactorial threshold effect are being discussed [
7]. Connections with dysfunctions, genetic causes, and environmental factors have been discussed [
7,
8,
9,
10,
11,
12]. Mandibular torus may have a multifactorial etiology, with evidence suggesting that severe tooth wear and loss contribute through increased masticatory stress; its higher prevalence in males across populations indicates a potential role of functional and biomechanical factors, rather than solely genetic or demographic influences [
13]. Additional research indicates a positive correlation between mandibular torus size and bite force, supporting the theory of functional adaptation [
11,
14,
15,
16]. TM prevalence is around 12–29% and is slightly higher in men than in women [
17].
Some ethnic frequencies can also be observed. For example, inhabitants of the northern hemisphere, e.g., Scandinavian and Inuit populations, are more likely to have TM. Southeast Asia and Japan also show an increased prevalence [
3].
TM is usually asymptomatic, but increasing growth can lead to articulation difficulties, foreign body sensation, obstructive sleep apnea, or psychological problems, such as carcinophobia, among others [
18,
19]. Based on two case reports, it is proposed that the presence of mandibular tori may alter salivary flow dynamics and, thereby, increase the risk of sialolithiasis [
20]; additionally, they can negatively affect the fit of a prosthetic denture, in which case removal of the bone structure would be indicated. Excision of torus mandibularis does not lead to functional, aesthetic, or structural losses for the patient [
21].
A practical application of mandibular torus may be its use as autologous bone graft material for augmentation procedures, e.g., prior to implantation in periodontal bone lesions, or for sinus lifting [
21,
22,
23,
24].
Previous studies have mainly investigated the etiology and size of TMs. Haugen [
25] and Eggen et al. [
26,
27] classified TMs into those smaller than 2 mm; medium, 2–4 mm; and large, more than 4 mm. Reichert et al. [
28] divided the sizes of TMs into grades 1–3, where grade 1 corresponded to a TM of up to 3 mm, grade 2 to 3–6 mm, and grade 3 to more than 6 mm.
Some studies have even shown increased bone density in patients with torus mandibularis [
1,
17]. Many studies on torus mandibularis have dealt with investigations into its etiology, prevalence, or a snapshot of the bone structure, whereas its temporal development has so far remained undocumented [
3].
This study is the first to focus on the temporal development of torus mandibularis.
With the help of software, cone beam computed tomography (CBCT) images taken at different points in time were converted into surfaces, which were superimposed, allowing for calculations of temporal changes in the dimension of the bone structure. In the first, descriptive, part of this work, we use CBCT measurements to investigate the location, extent, and prevalence of torus mandibularis in a southern German population. In the second, exploratory, part of the investigation, we examine the development of the extent of the exostosis in a patient over a defined period of time and draw conclusions about the dynamics of TM.
2. Materials and Methods
The data were collected as part of a retrospective, randomized study. The CBCTs examined in this scientific study were taken at Zentrum für Zahnmedizin Dr. Schnutenhaus MVZ GmbH, in Hilzingen, Germany, between 21 December 2001 and December 2019. The patients were not X-rayed for study purposes. The images were taken exclusively during the course of treatment and were examined retrospectively. The data were collected after a positive vote was granted by the Ethics Committee of the Baden-Württemberg Medical Association F-2020-024-z on March 6, 2020. In this study, bone structures were measured, which required suitable imaging for the three-dimensional representation of the bone structures in question.
Cone beam computed tomography (CBCT) (Gendex CB500, Gendex Dental Systems, Des Plaines, IL, USA), with a resolution of 0.2–0.4 voxels and a maximum turnaround time of 23 s, was used for X-ray exposure.
Study Design
This study was divided into two different evaluations.
In the first, descriptive, round, CBCTs from 210 patients were measured and statistically analyzed. Three age groups were formed, each with 70 patients consisting of 35 male and 35 female participants. Group one included all patients younger than 41 years; group two included patients between 41 and 60 years of age; and group three included all examined patients over 61 years of age.
The following criteria were used to select the 210 cross-sectional samples: inclusion criteria were complete CBCT data sets and no relevant pre-existing conditions, while patients with pathological changes, previous surgery, or missing demographic data were excluded. The exclusion criteria resulted in a sample with a low proportion of patients from different ethnic backgrounds; however, a detailed analysis of the ethnic distribution could not be performed, which was considered a limitation. The division into three age groups was based on the demographic structure of the total sample and was guided by age-related changes in bone metabolism—Group 1 (<30 years), Group 2 (30–60 years), and Group 3 (>60 years)—categorization which corresponds to age limits on bone development and degeneration, as established in the literature.
As part of the randomization process, a comprehensive compilation of all available CBCT recordings was first conducted. Cases in which a non-South German origin was either clearly identifiable or self-reported by the patients were excluded from further analysis. The remaining cases were entered into Excel spreadsheets and categorized according to predefined age groups and sex (male/female) subgroups. Randomization within each subgroup was then performed using the Excel “RAND” function. The lists were sorted based on the random numbers generated, and the first 30 cases from each subgroup were subsequently included in the study.
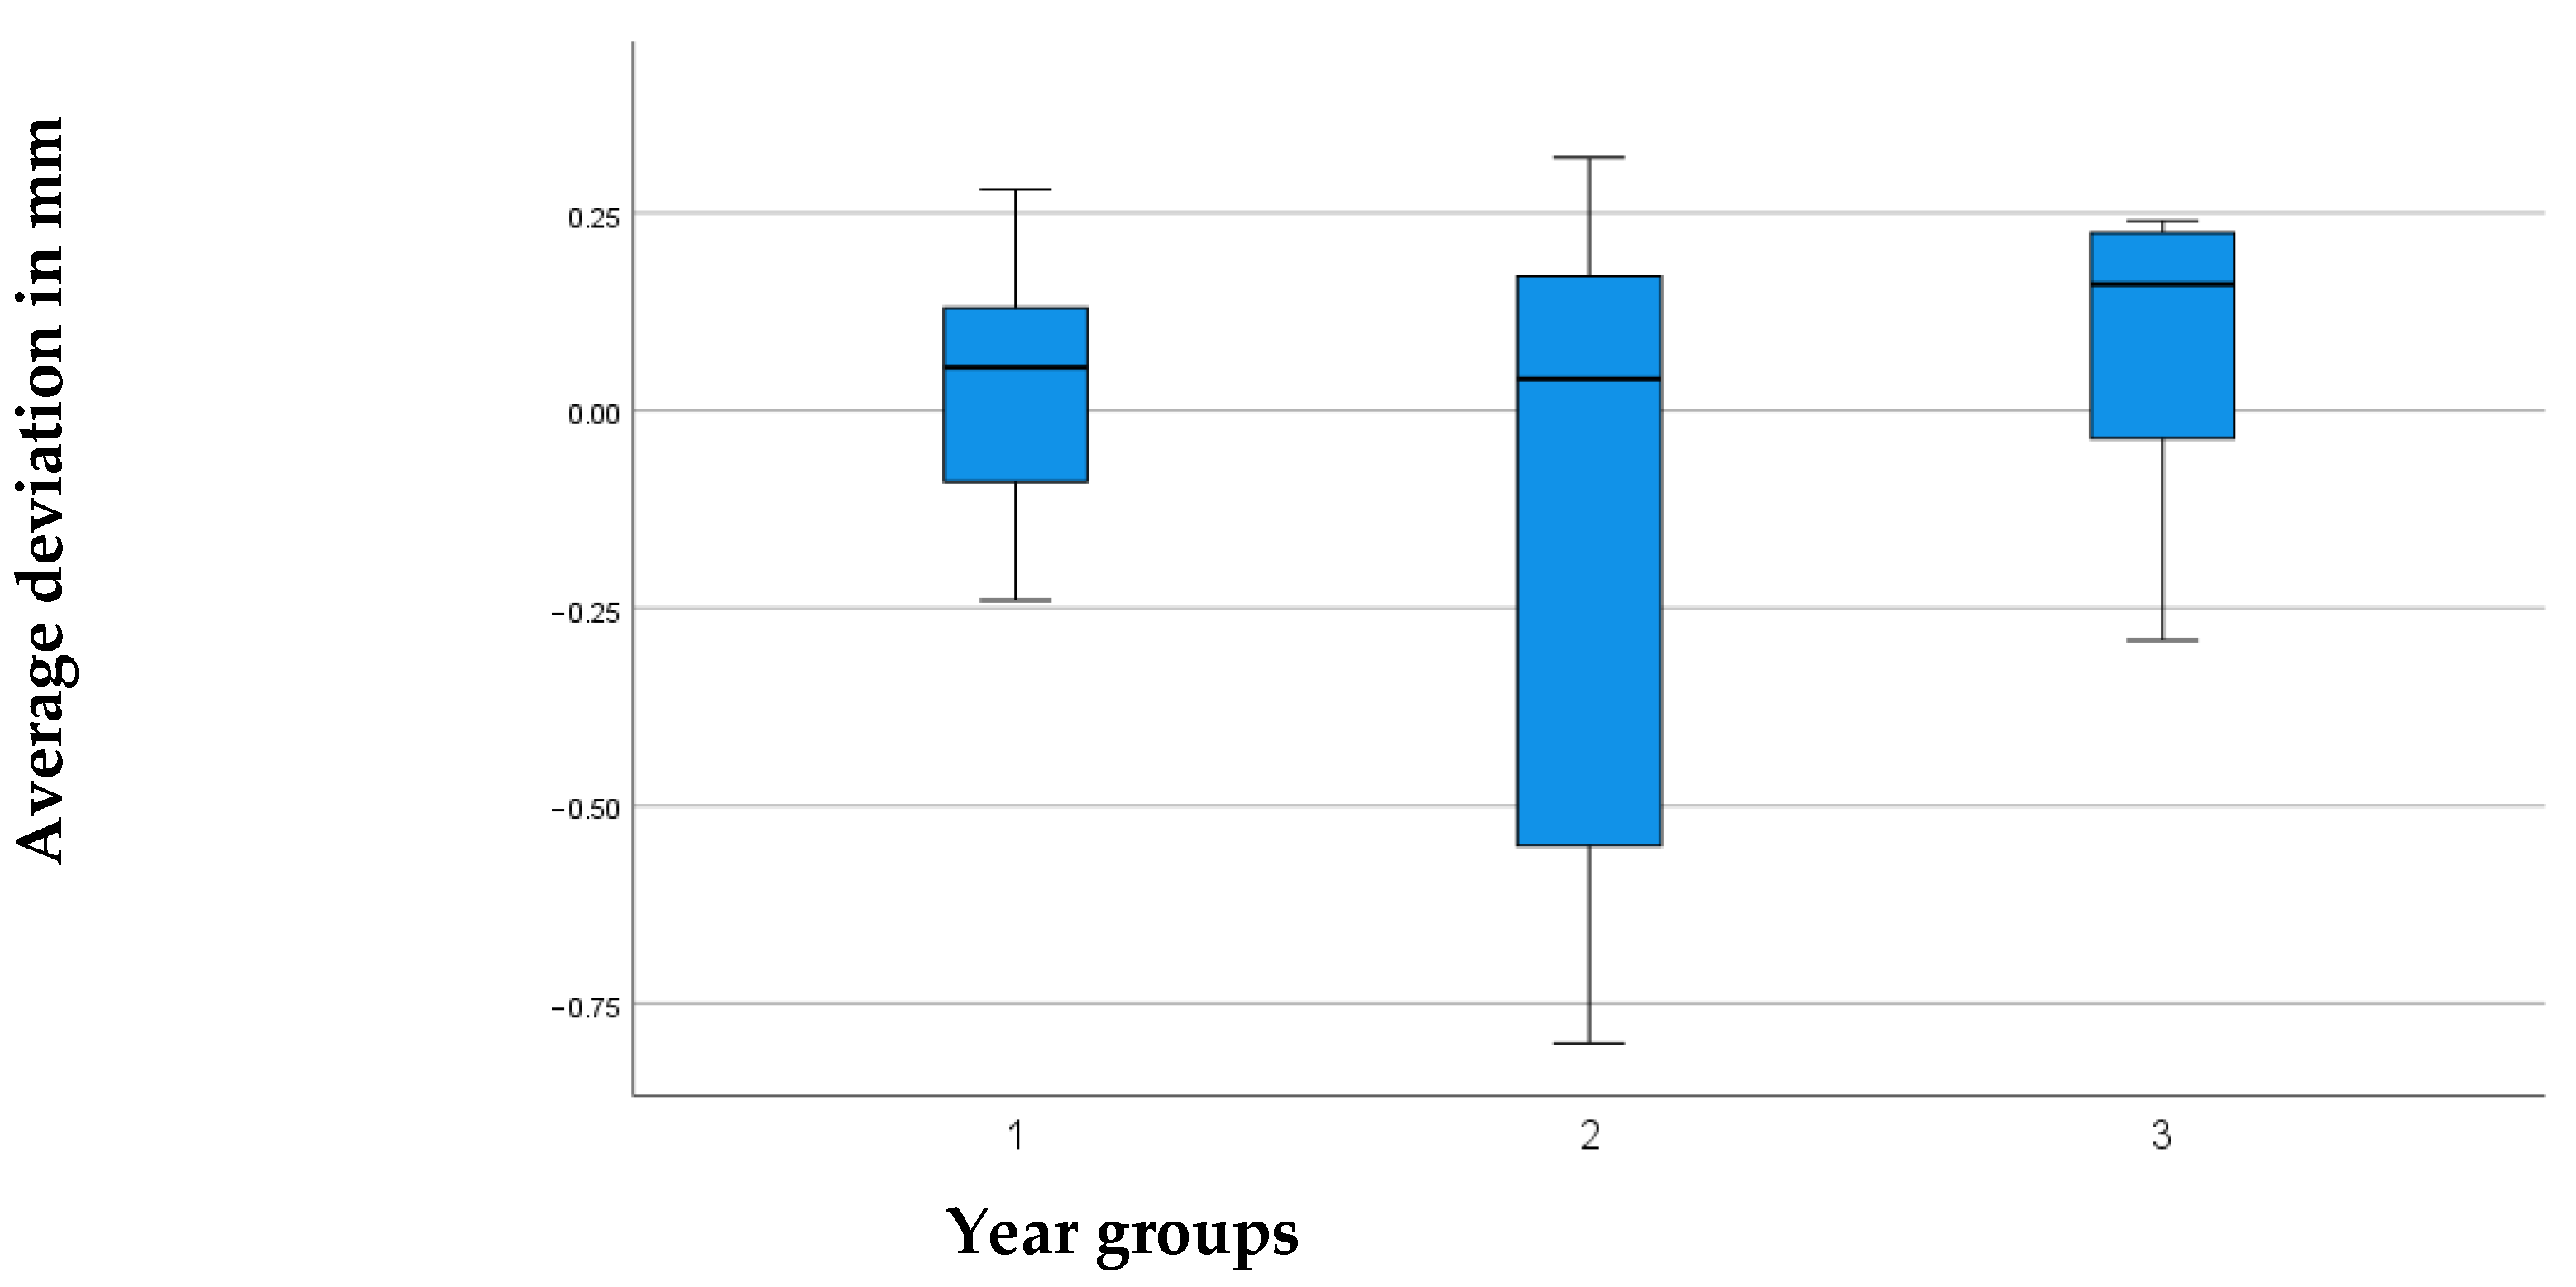
In the second, exploratory part of this study, two data sets from one patient were processed, superimposed, measured, and statistically analyzed. A total of 146 CBCTs from 73 patients of different ages were compared with each other. Year groups were determined based on the interval between each patient’s first and second X-rays. The time intervals between CBCTs included a minimum of two years and a maximum of nine years.
While the grouping in the first part of this study was deliberately gender-balanced, this ratio could not be maintained in the second part, due to the smaller data set. In particular, the proportion of TM in male patients was 38%, while that in female patients was 23%; this uneven distribution could potentially influence the significance of the findings regarding the lack of age differences. A differentiated analysis of the influence of gender was not carried out, due to the number of cases, a factor that should be taken into account in future studies.
Patients in whom an exostosis was not clearly recognizable were documented, jointly assessed, discussed, and evaluated by the team.
Files that could not be evaluated were excluded from the examination and replaced, the reasons for which mainly included excessive artifacts or an insufficiently depicted lower jaw.
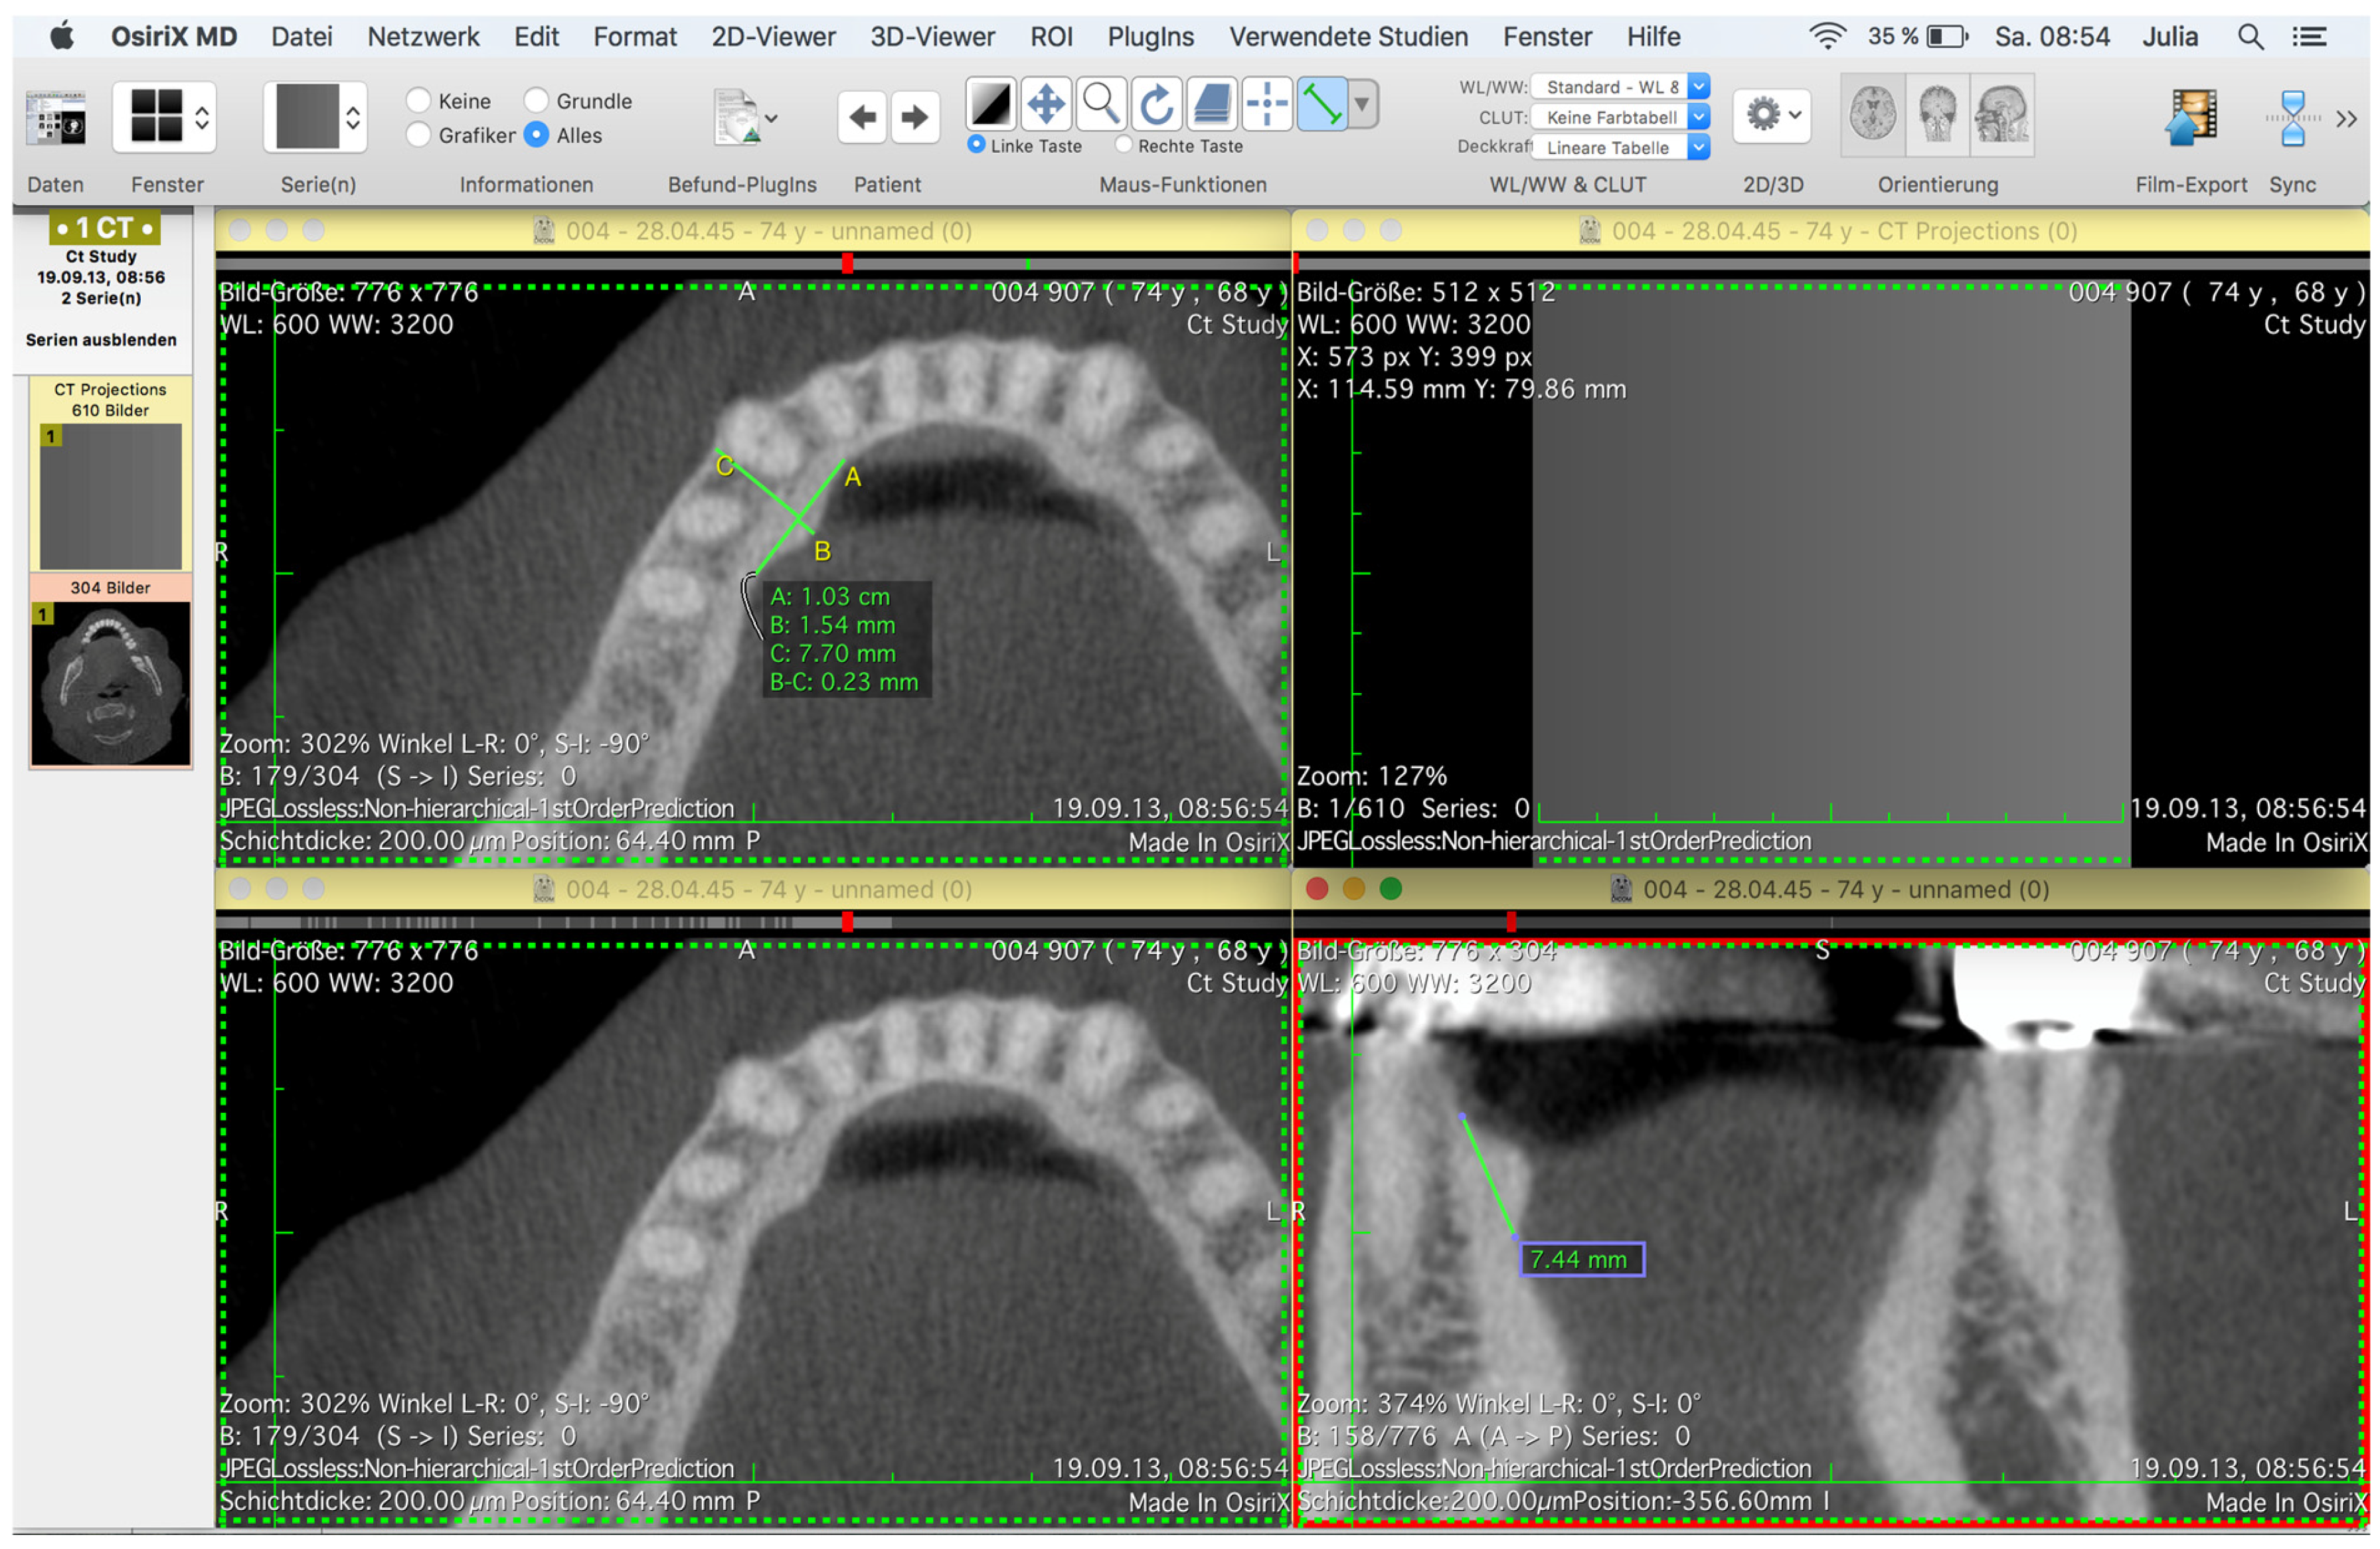
The DICOM (Digital Imaging and Communications in Medicine) data sets were evaluated in anonymized form. The modiCAS/anonymizer software V1.0.0. (modiCAS GmbH, Erlangen, Germany) was used to anonymize all patient data. The CBCTs were analyzed in the OsiriX MD software (version 11.0) (Pixmed SARL, Bernex, Switzerland), which was also used to convert the CBCT data into STL (Surface Tesselation Language) data.
To find the maximum extension of a torus mandibularis, the lingual cortical bone was tracked under dynamic observation, and the maximum extension was determined again in each plane.
The first step was to find the plane in which the structure to be examined had its maximum axial extension.
The maximum extension of a torus mandibularis in the sagittal direction was marked by drawing a tangent line A; starting from this straight line, an orthogonal line B was drawn through a TM in its maximum transversal extension (
Figure 2).
The straight line in question was extended to the mandible’s vestibular cortex, and a straight line was inserted from there to the mental foramen to obtain the distance between a TM and the mental foramen (
Figure 3) and, thus, a conclusion about the localization of the TM.
The maximum vertical extension of the base was determined using the frontal (coronal) view. By dynamically viewing a TM in the frontal view, the maximum extension was again found, and a straight line was drawn through it (
Figure 2 and
Figure 3).
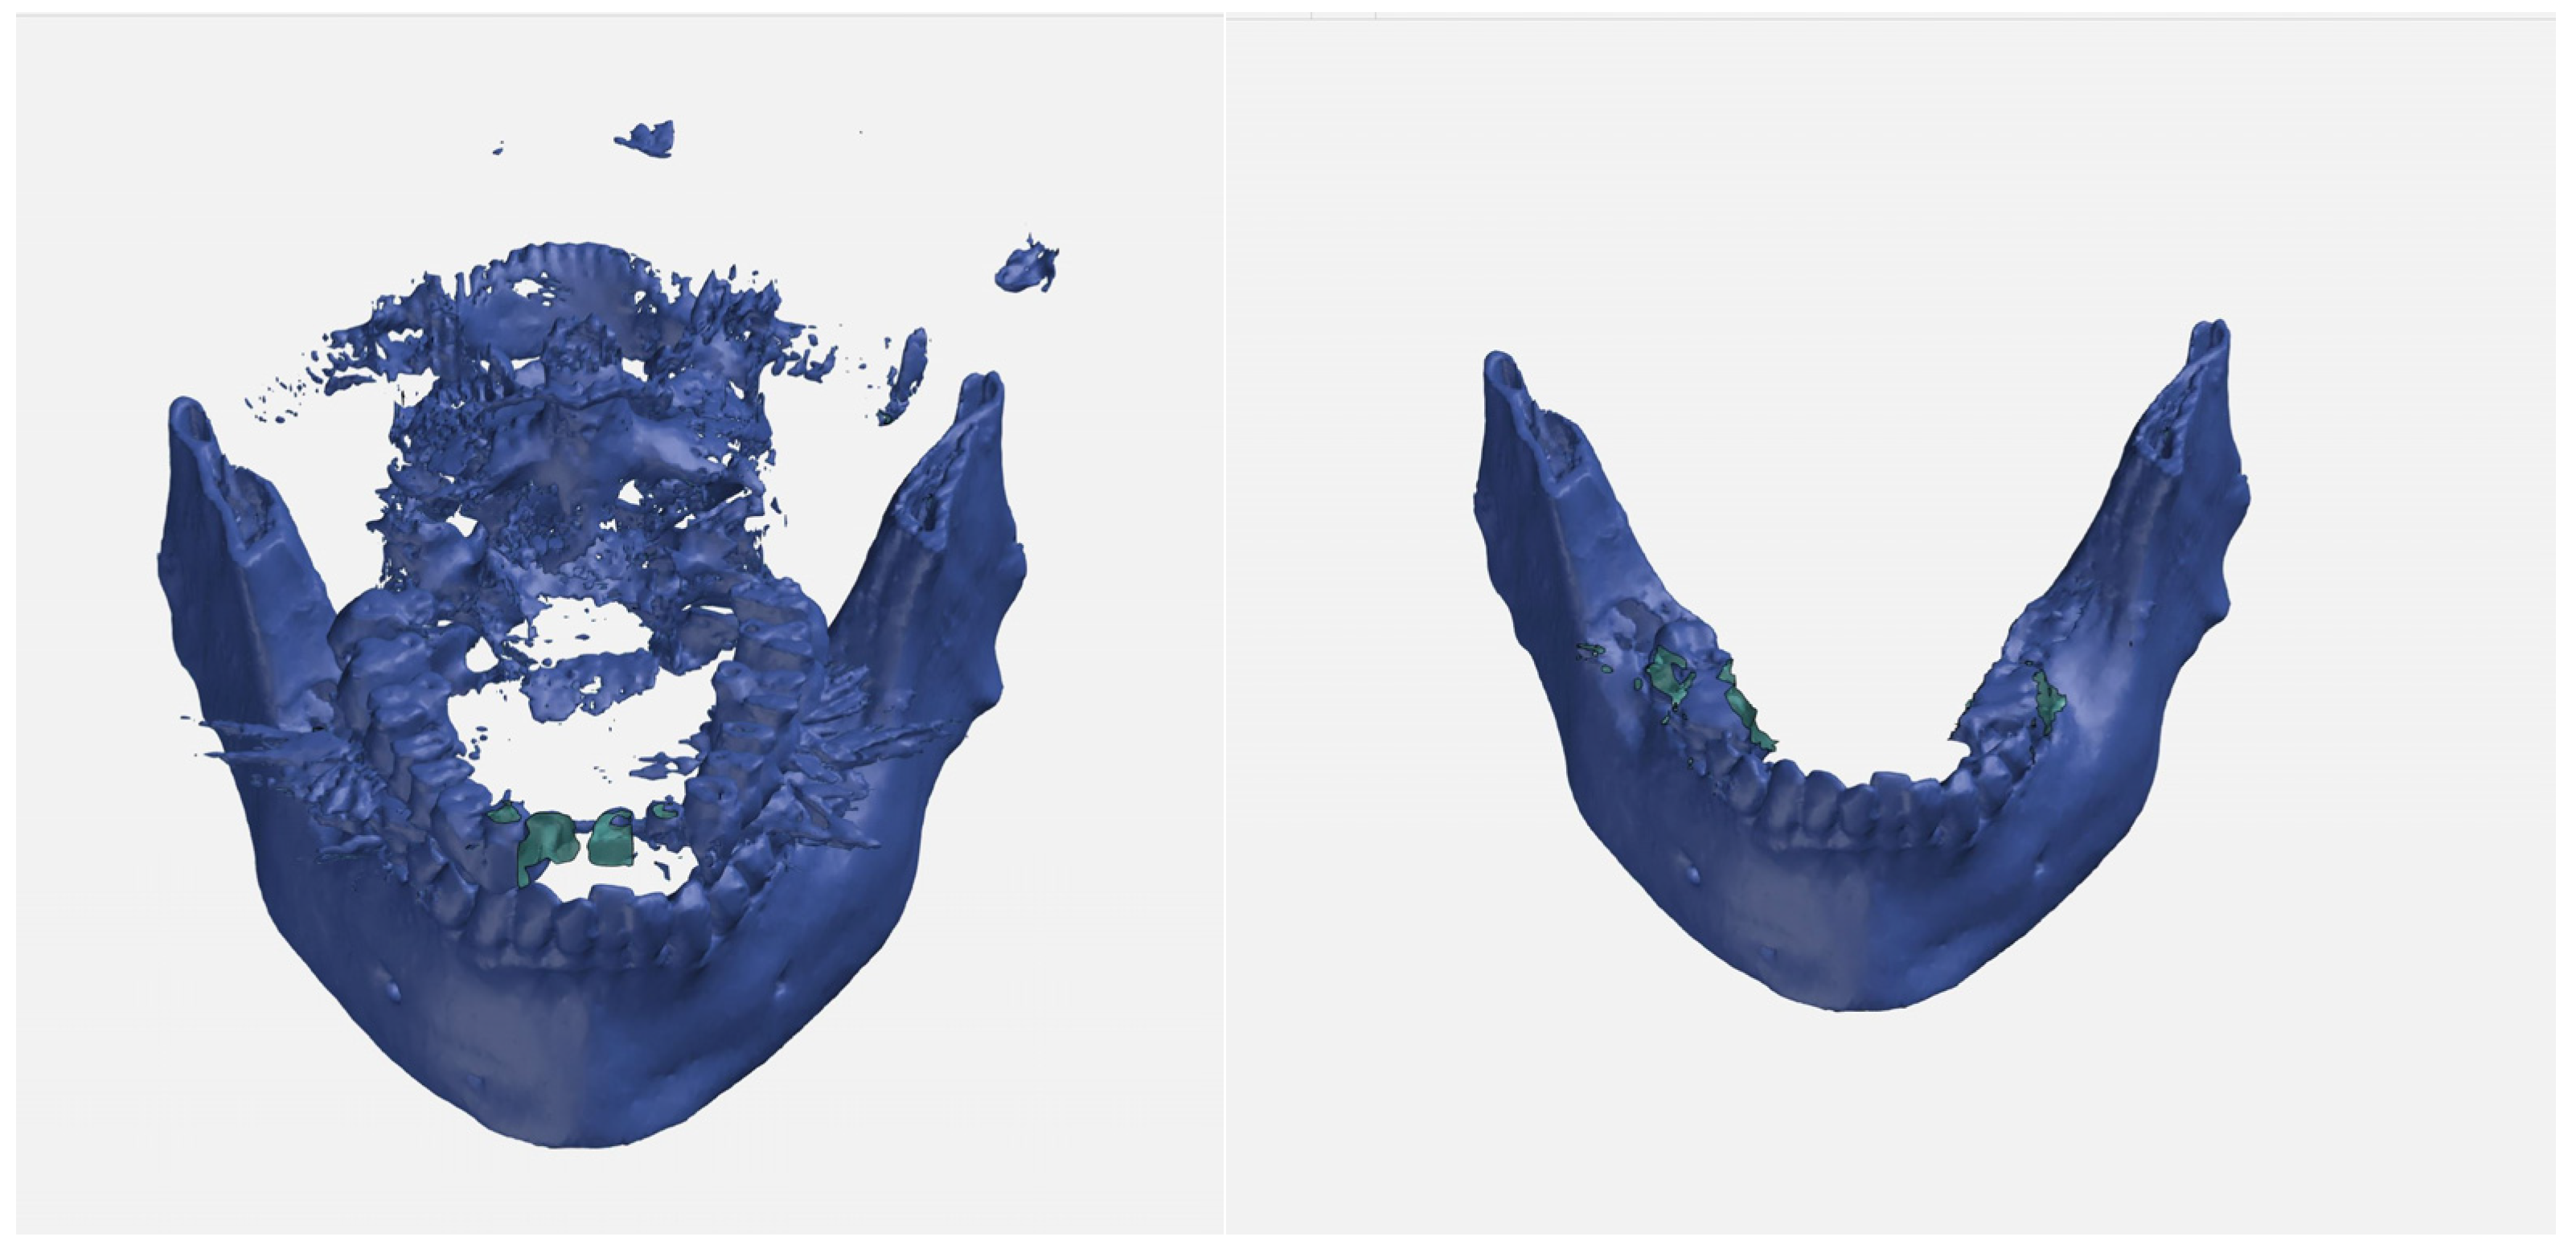
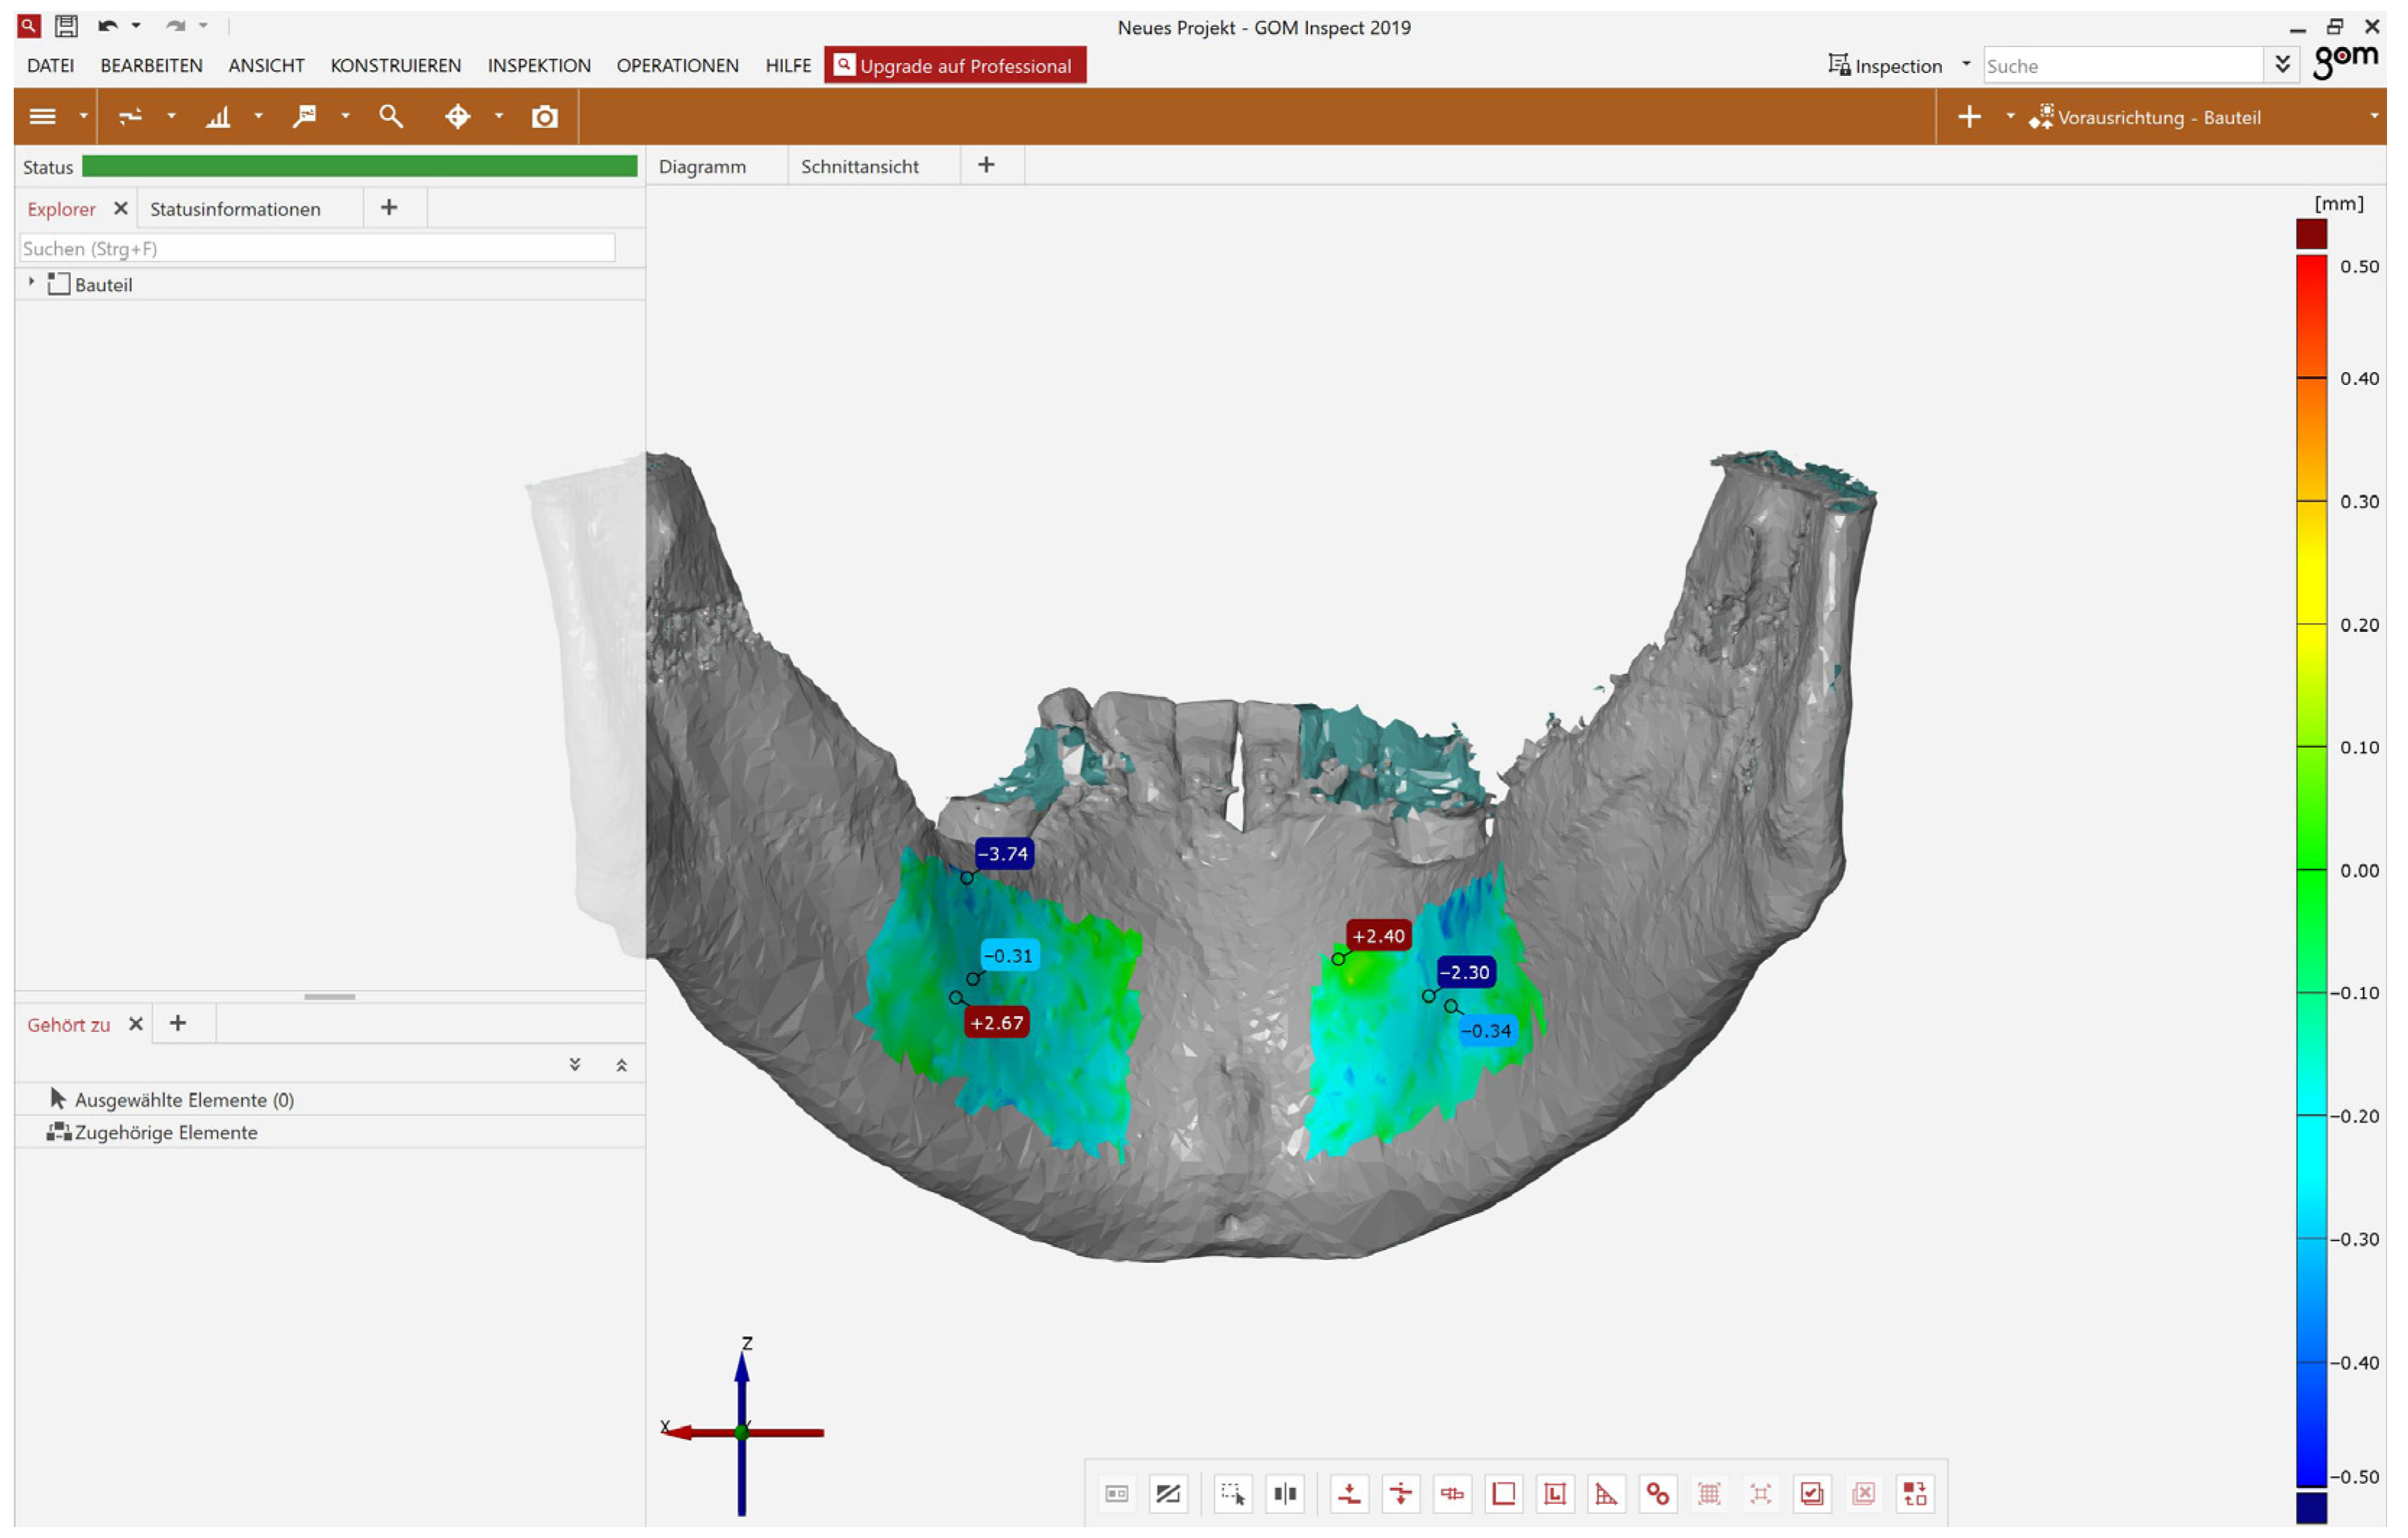
To evaluate the dynamics of TMs, the CBTC images were converted into surface data sets. The analysis was carried out using the GOM Inspect software (version 7.5) (GOM GmbH, Braunschweig, Germany).
The surface data sets were prepared for subsequent overlay by removing artifacts, the spine, the teeth, and, if necessary, the distal mandible from the jaw angle (
Figure 4).
The two surface images were displayed superimposed, using the best fit method calculated in the program. The overlay was checked and, if necessary, corrected using “3-point alignment”. If the overlays were still too imprecise, a data set was eliminated from the analysis and evaluated as a complete dropout. Critical cases were discussed among the team, and a decision was made as to whether the case should be eliminated.
If the surfaces overlapped sufficiently well, a surface comparison was carried out in the software within the area of the marked region of interest (ROI) (
Figure 5). Regions of interest (ROIs) were limited to the region lingual to the canines and premolars, and above the attachment of the mylohyoid muscle.
The data from both evaluations were collected in an Excel spreadsheet and analyzed in the statistical program SPSS Version 26 (IBM Corp. Released 2019. IBM SPSS Statistics for Windows, Version 26.0. Armonk, NY, USA). The mean value (MW), the maximum (Max) and minimum (Min), the standard deviation (SD) and the 95% confidence interval (CI95%) were determined as continuous variables, and a test for normal distribution was performed. Accordingly, parametric and non-parametric tests were used. The T-test or Wilcoxon rank sum test was used to compare two dependent samples. To compare more than two independent samples, the Kruskal–Wallis test was used.
The T-test was used to compare the mean values of two groups (gender), while ANOVA was used to compare the mean values of more than two groups (year groups).
The chi-square test was used to test the correlation between the variables in terms of stochastic independence, presented using cross-tabulations. The linear correlation between two variables was determined using Pearson correlation.
The retrospective data processing means that all statistical results were interpreted as hypothesis-confirming and not generating. The significance level for all statistical tests was alpha = 0.05.
3. Results
3.1. Population
In the first, descriptive, part of this study, 210 patients were divided into three groups of 70 patients each on the basis of age.
The gender distribution was set to 50% in each group.
Group one comprised all patients under the age of 41, group two comprised patients between 41 and 60 years of age, and group three all patients over the age of 61 who were examined. The youngest patient examined in this study was 9 years old at the time of admission, while the oldest patient was 84 years old. The average age was 33 years in the first group, 50 years in the second group, and 69 years in the third group.
In the second, exploratory part of this study, two CBCT images each were collected from a total of 73 patients.
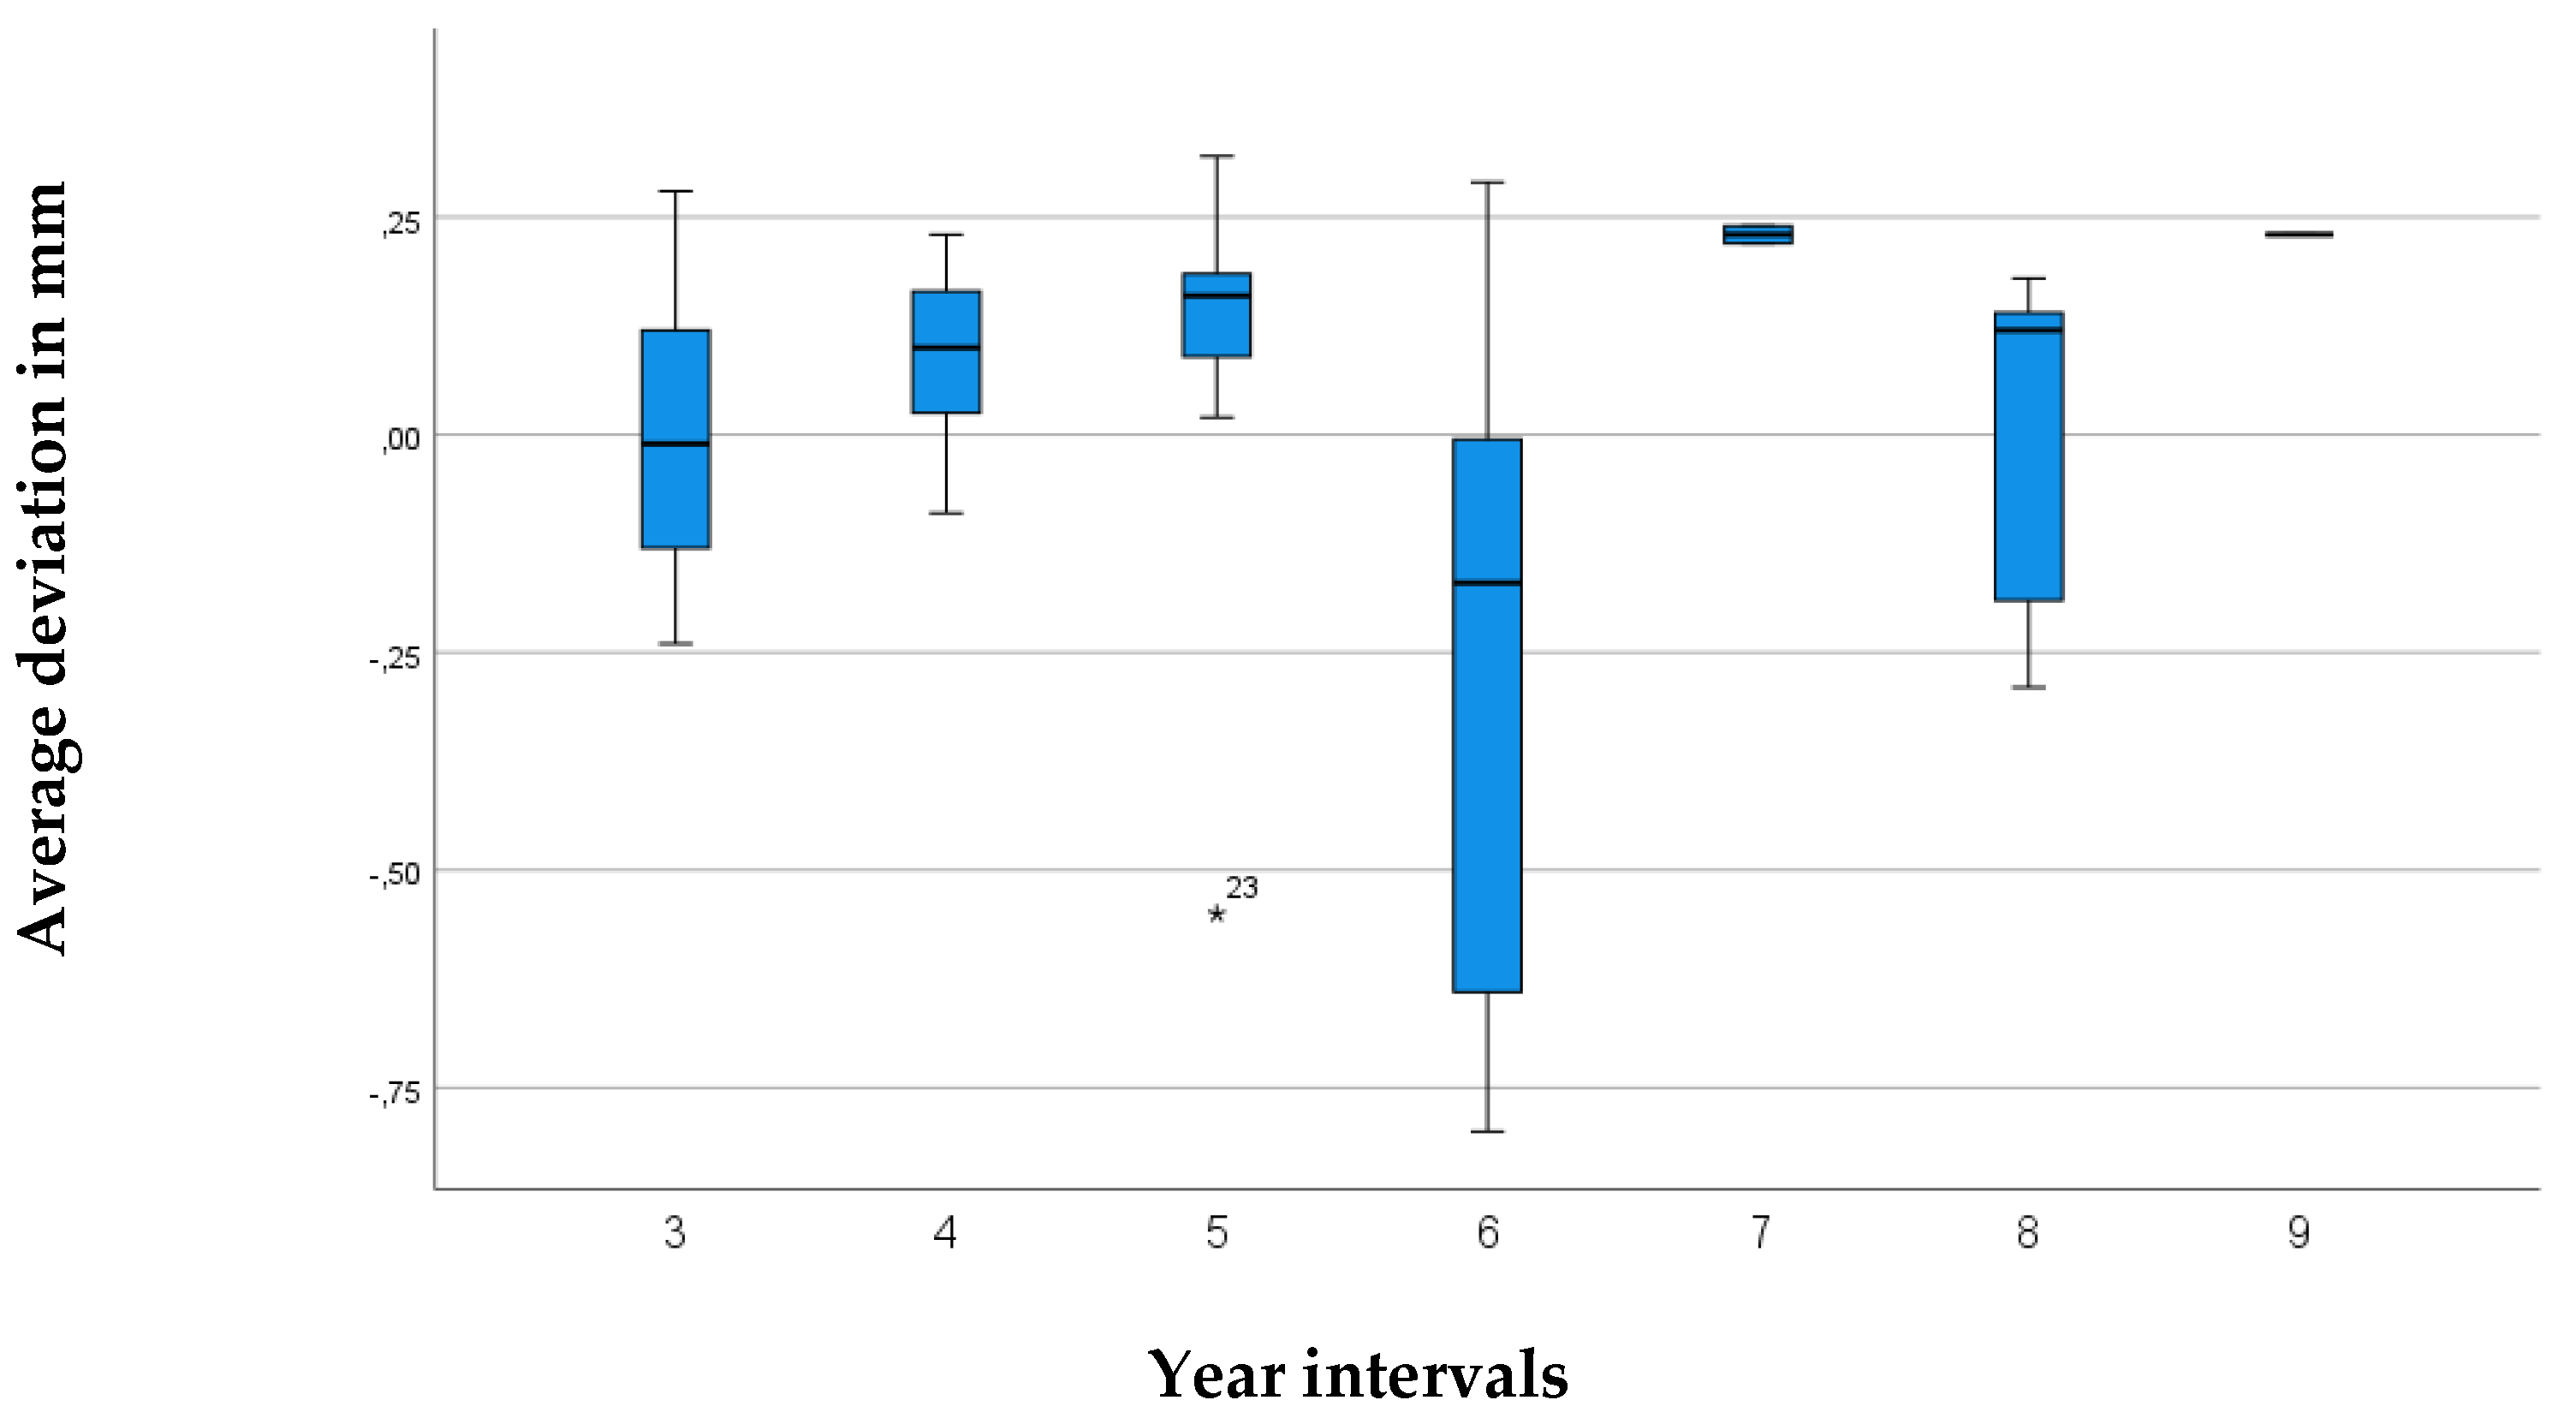
After deducting the dropouts, the remaining 41 patients were also divided into three groups, based on the interval between the first and second CBCT scans. Group one comprised all data sets in which the interval between the two CBCT scans was three or four years; in group two, the second CBCT was taken in the fifth or sixth year; and, in group three, the second CBCT was taken in the seventh to ninth years after the first CBCT was taken. The shortest interval between the scans was 2 years, and the maximum interval was 9 years. On average, the interval between CBCT scans was 5 years.
The average age at the time of the first CBCT scan was 50 years.
The gender distributions were twelve women (66.6%) and six men (33.3%) in group one, eight women (53.3%) and seven men (46.6%) in group two, and seven women (87.5%) and one man (12.5%) in group three.
The overall gender distribution in the exploratory evaluation round was 65.9% (27) female and 34.1% (14) male patients.
3.2. Overlay Accuracy
The superimposition of the data sets in the second, exploratory part was carried out using the reference point of the mental foramen, or a multi-point assignment, e.g., using the existing tooth structure, resulting in an average deviation of 0.27 mm.
3.3. Descriptive Part—Prevalence
In group one, 22 (31%) of 70 patients had torus mandibularis; in group two, 23 (32%) out of 70 patients had the condition; and in group three 19 (27%) out of 70 patients had it. Out of a total of 105 male patients, 40 (38%) had torus mandibularis, compared to 24 (23%) out of 105 females. The overall prevalence was therefore 30.5%, regardless of gender (Abb. 2).
The sagittal base showed mean values of 11.64 mm for women and 11.98 mm for men, with SDs of 3.45 mm for women and 4.84 mm for men.
The vertical bases were, on average, 8.38 mm for women and 9.53 mm for men, with SDs of 2.81 mm for women and 4.19 mm for men.
Maximum deviations showed mean values of 1.16 mm for women and 1.39 mm for men, with SDs of 0.43 mm for women and 0.71 mm for men.
The T-test showed significance for the maximum deviation on the left in the gender distribution, with a value of p = 0.05; the T-test did not show significance for any other parameters (years/groups).
There were no significant differences in the distribution of TM on the right or left between the age groups.
3.4. Exploratory Part—Dynamics
In the second part of the evaluation round, the CBCTs from 41 subjects were superimposed. The overlays were measured for surface deviations in the areas of the right and left mandibular tori, whereby the dynamics of the TMs were examined.
The average deviation on the left was 0.03 mm for women (95% confidence interval −0.05–0.11 mm; standard deviation (SD) 0.04); the mean value for men was 0.07 mm (95% confidence interval −0.28–0.14 mm; standard deviation (SD) 0.10).
The mean value of the maximum transverse deviation for women was 2.85 mm (95% confidence interval 1.77–3.93 mm, standard deviation (SD) of 0.53); that for men was 2.80 mm (95% confidence interval 1.85–3.74 mm; standard deviation (SD) 0.44).
Individual, very high deviations suggested the presence of artifacts.
In terms of the average deviation, there was no difference between overlay accuracy and voxel inaccuracy in women. The average deviation was approximately the same as the evaluation accuracy, which, on the one hand, indicates accurate superimposition, but, on the other hand, also means that there was no significant increase in TM over time. Due to different slice thicknesses (200–400 µm) when recording the CBCTs, the data can only be superimposed with a maximum accuracy corresponding to the slice thickness.
A comparison of the year groups using ANOVA showed that they had no significant influence. The value of the average deviation in relation to the years between the groups was 0.076, higher than the significance value of p < 0.05.
Based on the box plots, one could visually interpret a slight growth trend among the year groups; however, they are below the significance level and, therefore, not statistically significant (
Figure 6 and
Figure 7).
From the overlays of the CBCT images taken at different points in time, the following conclusions can be drawn regarding possible dynamics:
4. Discussion
Torus mandibularis is a bone structure that often initially remains asymptomatic and unnoticed by patients.
With the help of three-dimensional imaging and precise image processing programs, it is now possible to precisely measure bone structures and determine the dynamics of bone structure growth by superimposing surfaces at different points in time.
The aim of this study was to determine the prevalence and growth tendency of torus mandibularis. The follow-up period for the second part of this study was between 2 and 9 years, although the potential influence of the follow-up period on the measurement results was not statistically investigated; the accuracy of the superimposition analysis was also limited by the voxel size of the CBCT data used (0.1–0.4 mm), which defines a methodologically determined range of uncertainty; and intra- and inter-measure reliability tests were not performed, so the robustness of the finding “no significant change” is methodologically limited. These points should be taken into account when interpreting the results, as they represent limitations of this study. A three-dimensional imaging procedure was chosen for examinations to ensure that the two data sets for a patient could be superimposed as accurately as possible at a later date.
In the first part of the evaluation, the descriptive analysis of torus mandibularis, the TM was localized in each patient, via dynamic observation of the individual CBCTs, and then measured in all planes for its maximum extent. If there were several tori in a close positional relationship, the one with the maximum extension was always located and measured.
When measuring the maximum transversal extension of torus mandibularis, the mandible’s lingual concavity was neglected and measured based on straight line A (maximum sagittal extension); it can, therefore, be assumed that the transversal extension tends to be measured as smaller than it is in reality.
In other studies, TMs were measured using plaster models [
7], which made it possible to simultaneously examine the tooth hardness for signs of grinding facets, in order to demonstrate a connection to bruxism. Measurement using a plaster model enables a good representation of the extent of the TM in the sagittal and frontal planes; however, measurement in the transverse plane is likely to be more difficult than in our CBCT examinations. Plaster models also show the mucosa, which is often very thin over a TM, but still leads to distortions. For the above reasons, it can be assumed that this type of measurement tends to show a TM as larger than it actually is.
In their study, Choi et al. used computed tomography (CT) and 3D software to measure TMs [
29]. With this approach, similar results to our study using CBCT is expected, although the higher radiation exposure from CT should be mentioned as a disadvantage of this type of examination.
Hassan et al. [
22], in their study, first examined TMs clinically, then radiographically and histologically after excision, and again radiographically for follow-up after use of the TM as bone augmentation material. In their clinical examinations, it can be assumed that larger TMs tended to be detected by eye, as opposed to radiographic measurement. Histological examination is interesting for the structure of a TM, but is not appropriate for exact measurements, due to impacts from surgery and histological procedures.
In clinical diagnosis, visual inspection was often supported through palpation [
1,
30,
31].
In the study by Scott et al., skeletons were measured [
32]; similar to the measurement of plaster models, assessment in the transverse plane is also likely to be problematic with this method.
Other studies showed a wide range in the incidence of TM. Studies with smaller sample sizes often showed [
33] higher incidences than studies with larger numbers of subjects [
2], with percentages ranging from 0.44 to 42.6%. Our patient sample in the present study showed a high incidence of TM, with a percentage of 30% (23% of women and 38% of men).
Previous study results disagree as to whether the prevalence is dependent on gender, but some studies have found a statistically significant difference.
Kolas et al. conducted a study of 2478 patients in 1953 and found no differences in TM prevalence by gender [
34], with 7.75% of all patients showing TM; however, Kolas et al. also described that TM was most frequently recognized in patients in the third decade of life, and that no statistically significant difference in prevalence could be detected after this age.
A comparison of 1317 German and 947 Thai patients carried out in 1988 showed that 5.2% of German (8.6% of men and 2.4% of women) patients, 9.4% of Thai men, and 9% of Thai women had TM [
28].
In 2006, Ihunwo et al. examined 284 South African skeletons for the presence of TM. Of 246 dentulous skulls, 60 (24.4%) had TM, while there were significantly fewer in the edentulous skulls (4.3%); among these, 80% of TMs were found in male skeletons, and 20% were found in female skeletons [
35].
In their 2015 study, Romanos et al. also described a higher incidence (52%) of TM in male patients [
36].
In contrast, in a large study of 2500 patients in India, torus mandibularis was observed in only 11 patients, with a prevalence of 0.24% in women and 0.2% in men; this study, by Jain S. et al., from 2019 is the only one of the studies listed here in which the distribution of TM is in favor of women [
2].
Simunkovic et al. conducted a study in Croatia in 2011 on 1679 patients, including 985 women and 694 men aged 9–99 years. Overall, 12.6% of the patients were found to have TM, 11.3% of whom were women and 14.6% of whom were men. While the difference in prevalence was found to be statistically significant in gender, no statistically significant difference was seen in age in this study [
37], while our study showed a clustering of TM within the fourth and sixth decades of life.
In the examination of 1000 patients, 1.4% showed TM. TM and TP were found most frequently in patients aged 11 to 30 years, and only rarely in patients younger than 10 years [
38].
In a sample of 47 edentulous patients conducted in Jordan in 2006, the overall prevalence of TM was 42.6% [
33]. Another study of 618 patients in Jordan, with a wider age range of 10 to 82 and excluding dentition, showed a TM prevalence of 25.7% [
39].
Of 1520 Thai patients, 32.2% showed TM, most commonly in patients in their third decade of life [
5].
The study by Al-Zarea et al. on 847 edentulous Arab patients showed 83 (9.8%) TMs, with a cluster in the 60–69 age group; the age group studied was between 51 and 79 years [
40].
In contrast, the study by Maduakor et al. showed an accumulation of TM in the fifth decade of life in the examination of 3000 patients in Southeastern Nigeria in 2017, in which 8% of the patients examined showed TM [
41].
Kumar Singh et al. examined 2666 Malaysian patients aged 11–90 years for the occurrence of TM. Overall, 10.5% of patients showed TM, with the highest incidence in the 31–40 age group [
42].
In 2019, Lahari A. Telang et al. observed TM in 0.9% of the 4443 Malaysian patients they examined. The sizes of the TMs varied between 0.5 and 5 cm, and patients aged between 20 and 29 showed TM most frequently [
43].
Of 1532 Malaysian patients in the study by [
44]), 2.8% had TM. The prevalence rate of 30.5% determined in our study is thus slightly above the values reported in the literature. These differences may be due to population-specific factors and methodological differences in the studies.
One explanation for the high prevalence observed in our study could be diagnosis with the aid of three-dimensional X-rays and the associated possible detection of smaller mandibular tori. Very small mandibular tori may not be detected in clinical situations.
In the present study, no comparisons were made based on confounding factors such as ethnicity or dental status, so interpretation of the prevalence rate in comparison with international data is only possible to a limited extent.
As of this manuscript’s publication, there are no comparable studies dealing with the change in TM over time.
We could not detect any significant surface growth of TM over time. For the first appearance of TM, an average age of 39.2 years [
45], or an age between 30 and 50 years [
25,
46,
47], rarely at a younger age [
38], has been determined. Conclusions about the dynamics of TM cannot be drawn from current studies or our own study.
According to our findings, mandibular tori appear to exhibit static behavior. However, other studies suggest a potential association with functional bite force. Future research should extend over a significantly longer observation period to detect any possible dynamic changes [
11,
14,
15,
16].
According to the classifications by Haugen [
25] and Eggen et al. [
26,
27,
48], our examinations mainly showed TMs of the smallest extent (smaller than 2 mm), assuming measurement in the transverse direction. Of the 210 patients we examined, 51 had a TM on the right side of the smallest size according to Haugen, and 4 of the 210 patients had a medium-sized TM according to Haugen (2–4 mm). None of the 210 patients had a TM larger than 4 mm. On the left side, the results were similar: 41 of the 210 patients had a TM smaller than 2 mm, 4 patients had a TM between 2 and 4 mm, and 1 patient had a TM larger than 4 mm. Based on the sagittal and vertical measurements, TMs in the largest category according to Haugen (greater than 4 mm) were found in both men and women.
We found that only five of our cases had a TM greater than 2 mm, which was considered potentially clinically relevant from a surgical point of view; however, this assessment is based on experience and should be interpreted taking into account individual anatomical conditions and established minimum standards for the removal of augmentations without endangering relevant neighboring structures. The first source of error, which can lead to subsequent inaccuracies in the measurements, is the CBCT imaging parameters, as the patients were X-rayed for the purpose of further diagnostics for medical reasons. Due to a different focus in some patients, different slice thicknesses and settings were used in some cases, which led to distortions and inaccuracies in the overlays of the CBCTs with different slice thicknesses.
Inaccurate positioning of the patient, movement, and metal artifacts have negative impacts on image quality and can lead to inaccuracies in the measurements of mandibular tori, but also in the superimposition of the data sets, potentially leading to a dropout [
29,
30].
5. Summary
The primary aim of this study was to investigate the shape and prevalence of torus mandibularis.
The secondary aim of this retrospective study was to evaluate and describe the growth dynamics of torus mandibularis. The accuracy of the studied overlays was also considered.
TM is a common bone structure, with a prevalence of 30.5% regardless of age and gender.
In our study, torus mandibularis proved to be a very stable bone structure that showed no significant changes over the average examined period of 5 years.
Thanks to modern, three-dimensional imaging techniques and precise image analysis programs, no growth tendency could be detected for torus mandibularis. Superimposition accuracy was limited by the digital volume tomography image’s voxel size, and our investigations in this study reflect this accuracy. On the one hand, this speaks in favor of exact superimposition; on the other hand, it also indicates that the bones did not change significantly over time.
The use of mandibular tori for augmentations, for example, prior to implantation, is conceivable, due to the individual assessment of the bone structure, and has been described as successful in various studies.
In the present study, we exclusively examined the dimensions of TM and, therefore, did not draw any conclusions about its microscopic bone structure or its biological suitability as a transplant material. Based on our results, TM could only be considered as an augmentation material for selected cases, in which further investigations into its structural quality and biological integration would be necessary.
Further retrospective studies, over a long period of time and in younger patients, would be useful to confirm or challenge these results.


