
The Plasmacytoid Dendritic Cell CD123+ Compartment in Acute Leukemia with or without RUNX1 Mutation: High Inter-Patient Variability Disclosed by Immunophenotypic Unsupervised Analysis and Clustering


Abstract
:1. Introduction
2. Materials and Methods
3. Results
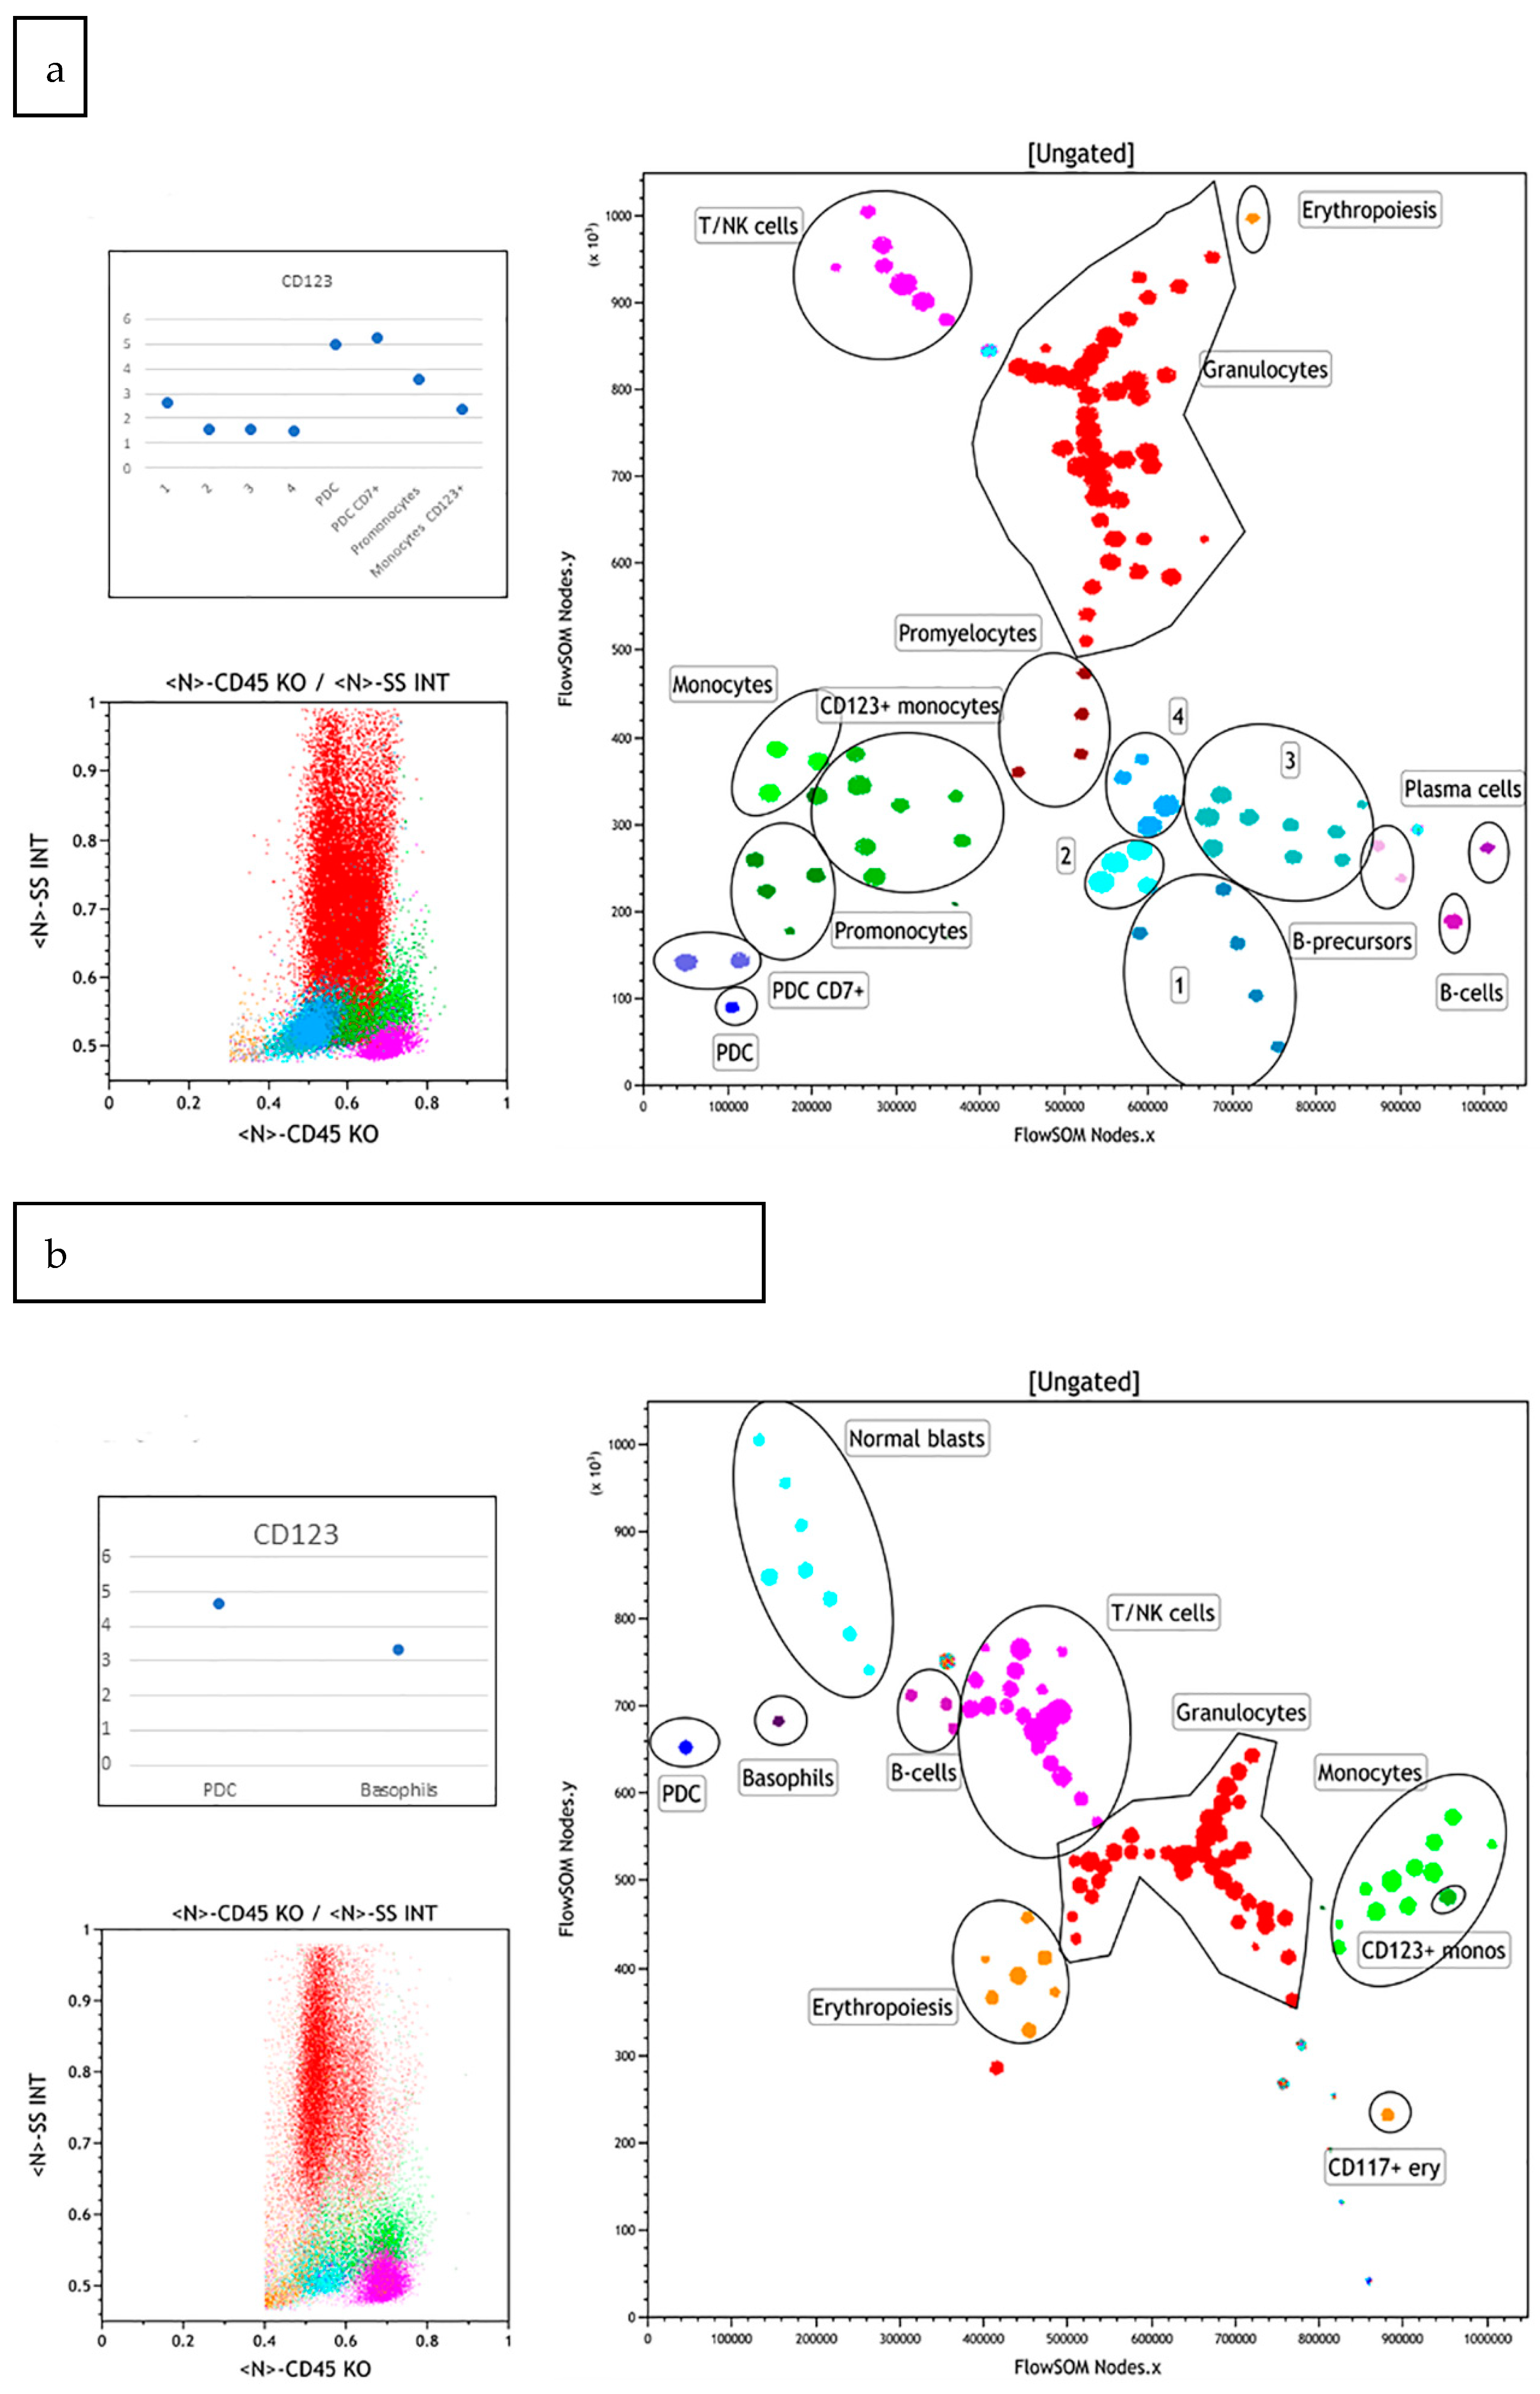
3.1. Normal Bone Marrow Pattern
3.2. Abnormal Bone Marrow Samples
3.2.1. Case 1
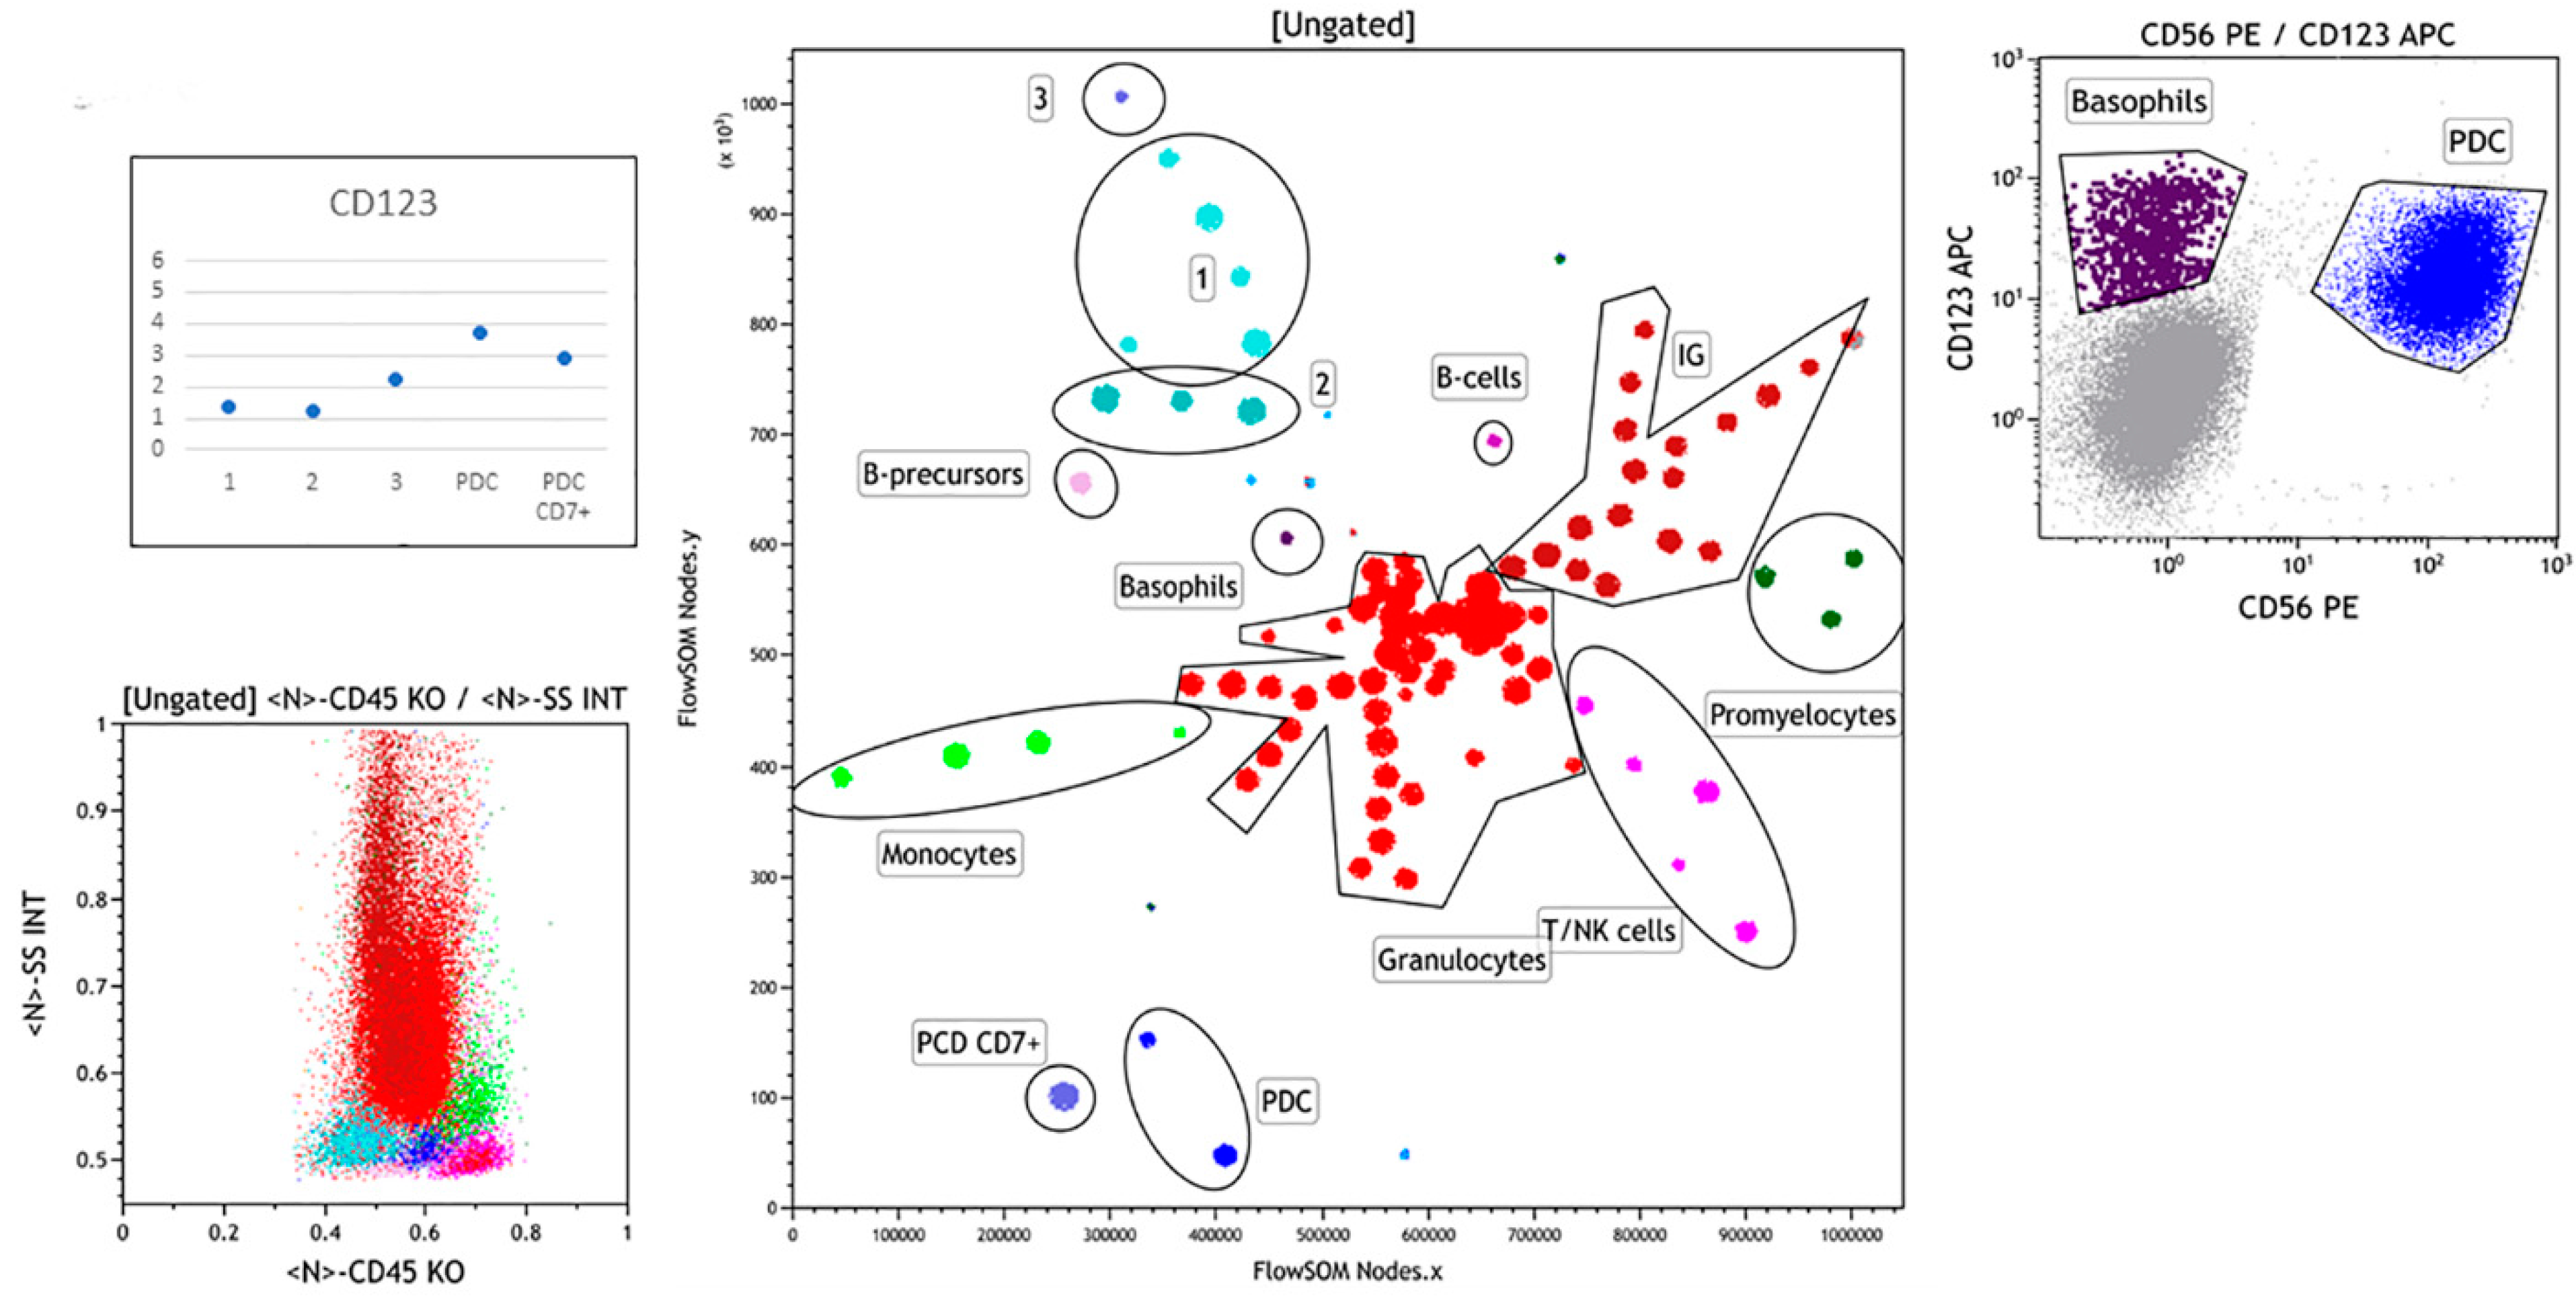
3.2.2. Case 2
3.2.3. Case 3
3.2.4. Case 4
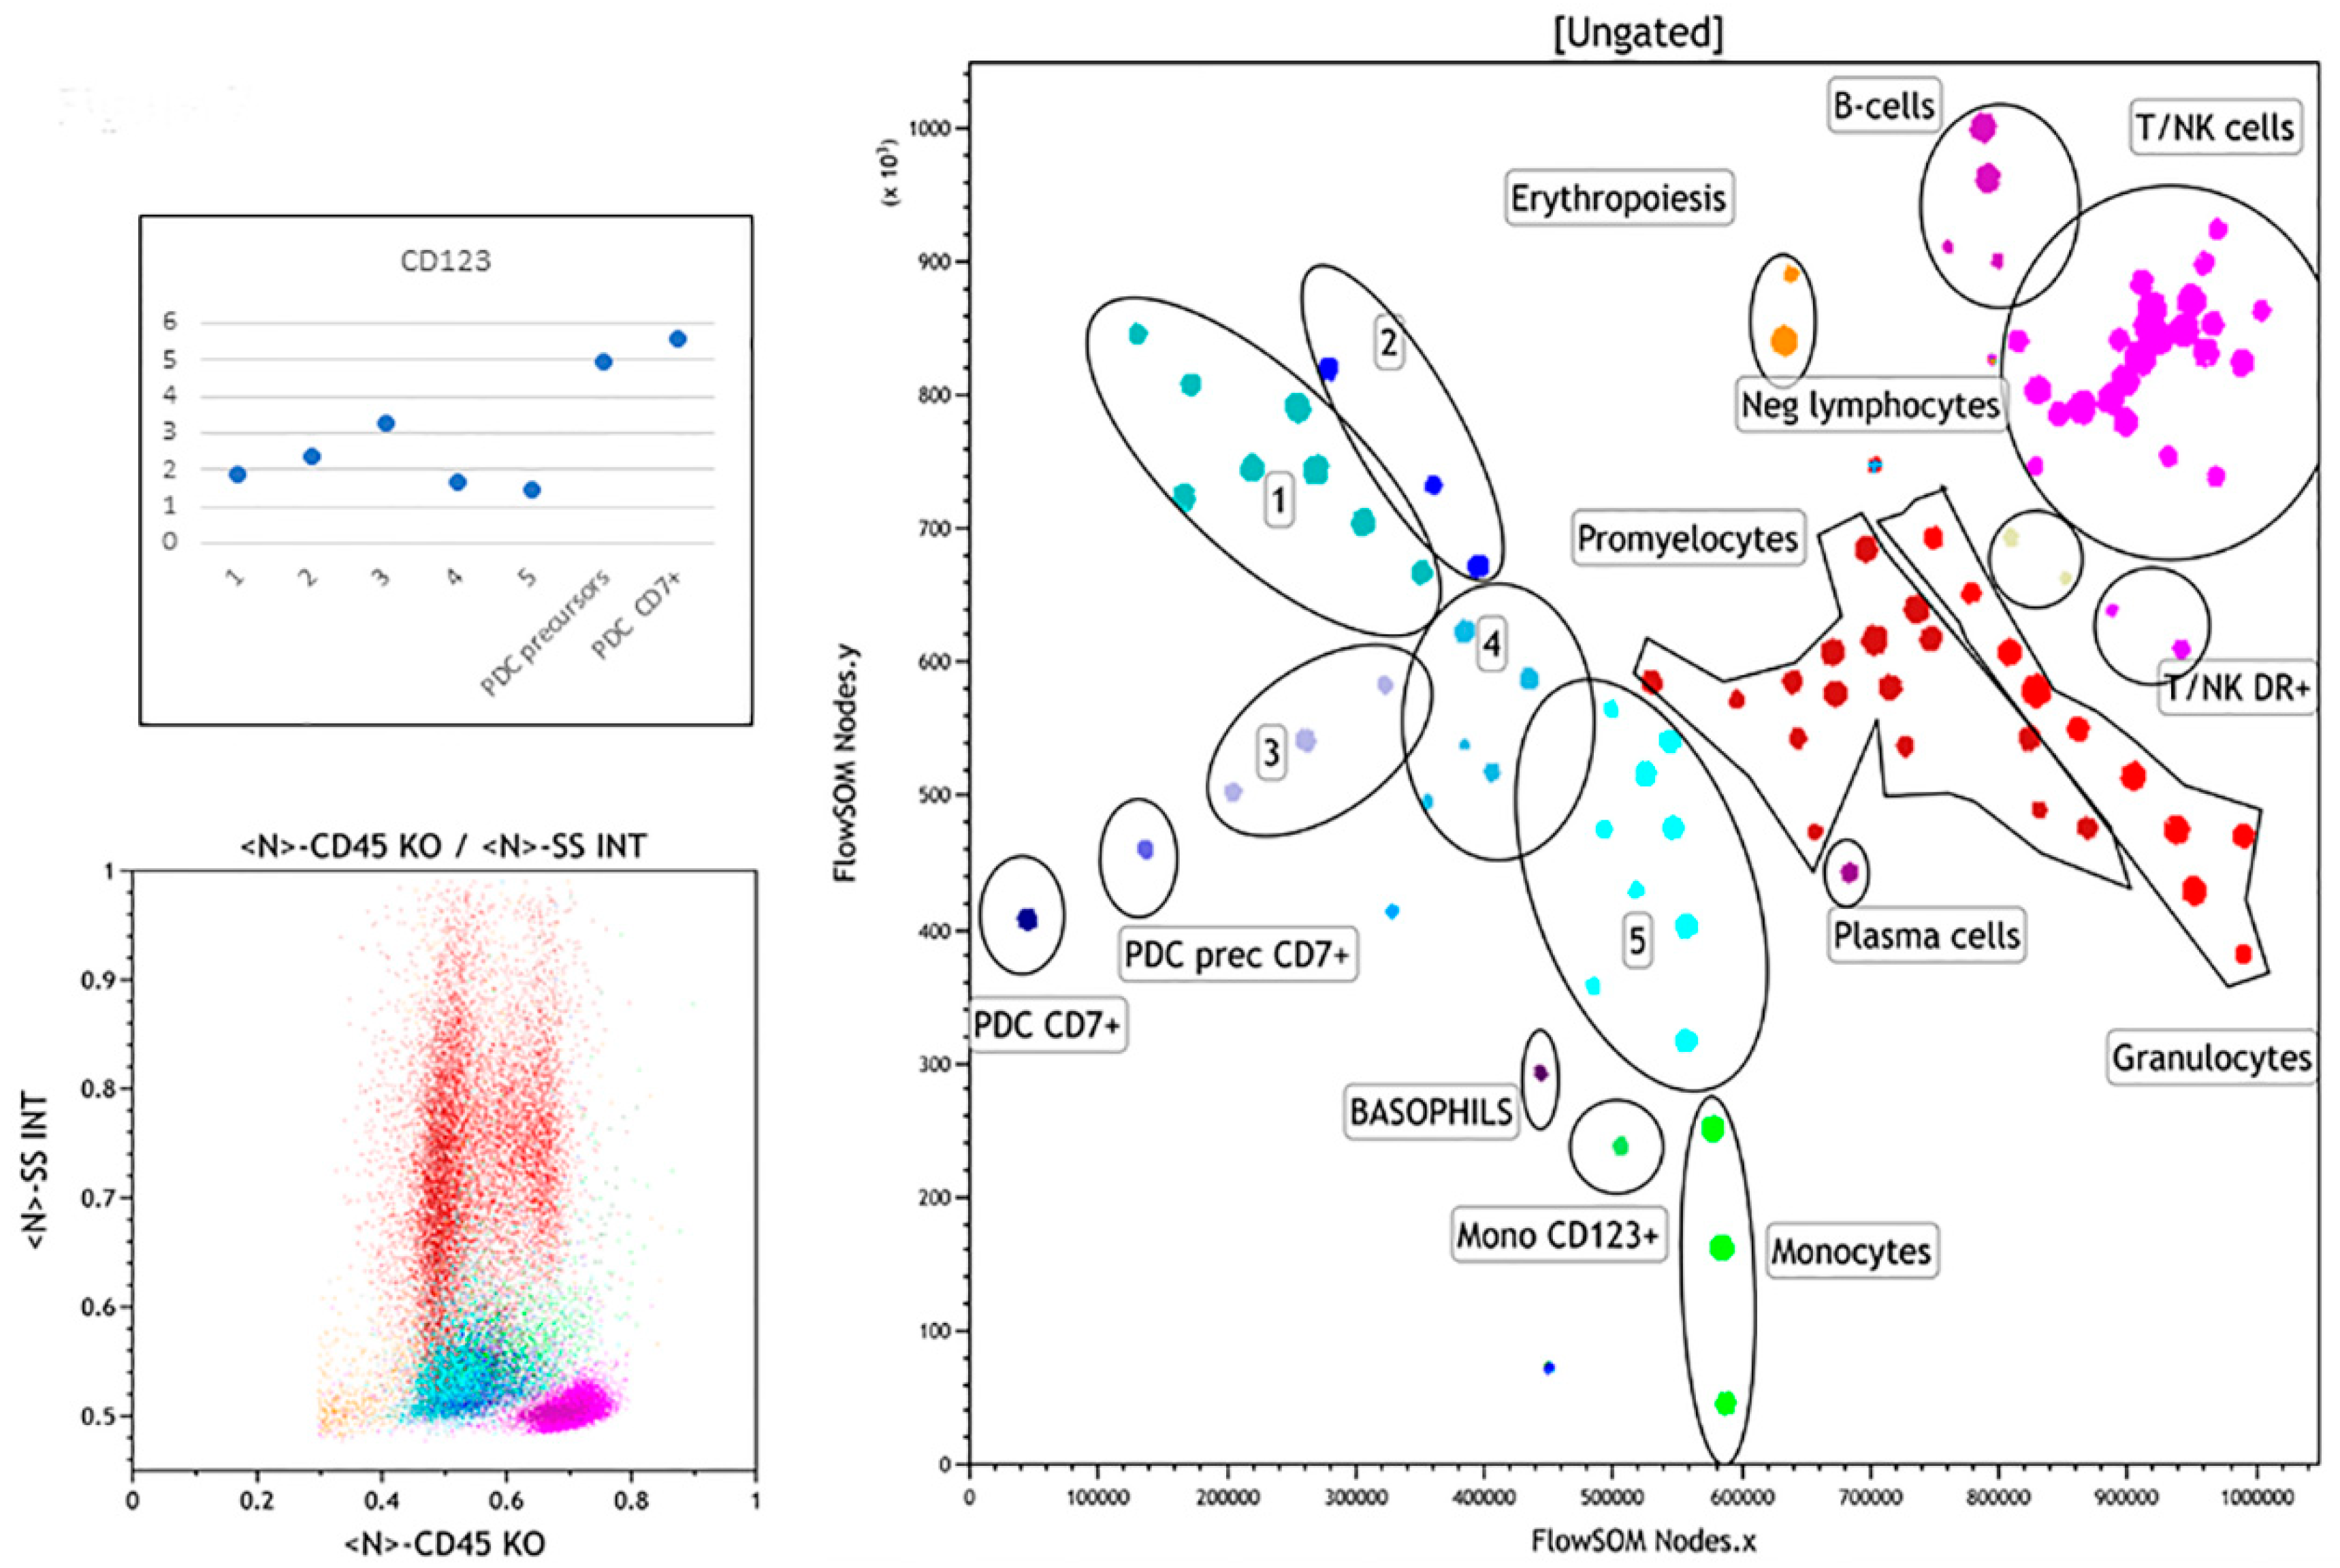
3.2.5. Case 5
3.2.6. Case 6
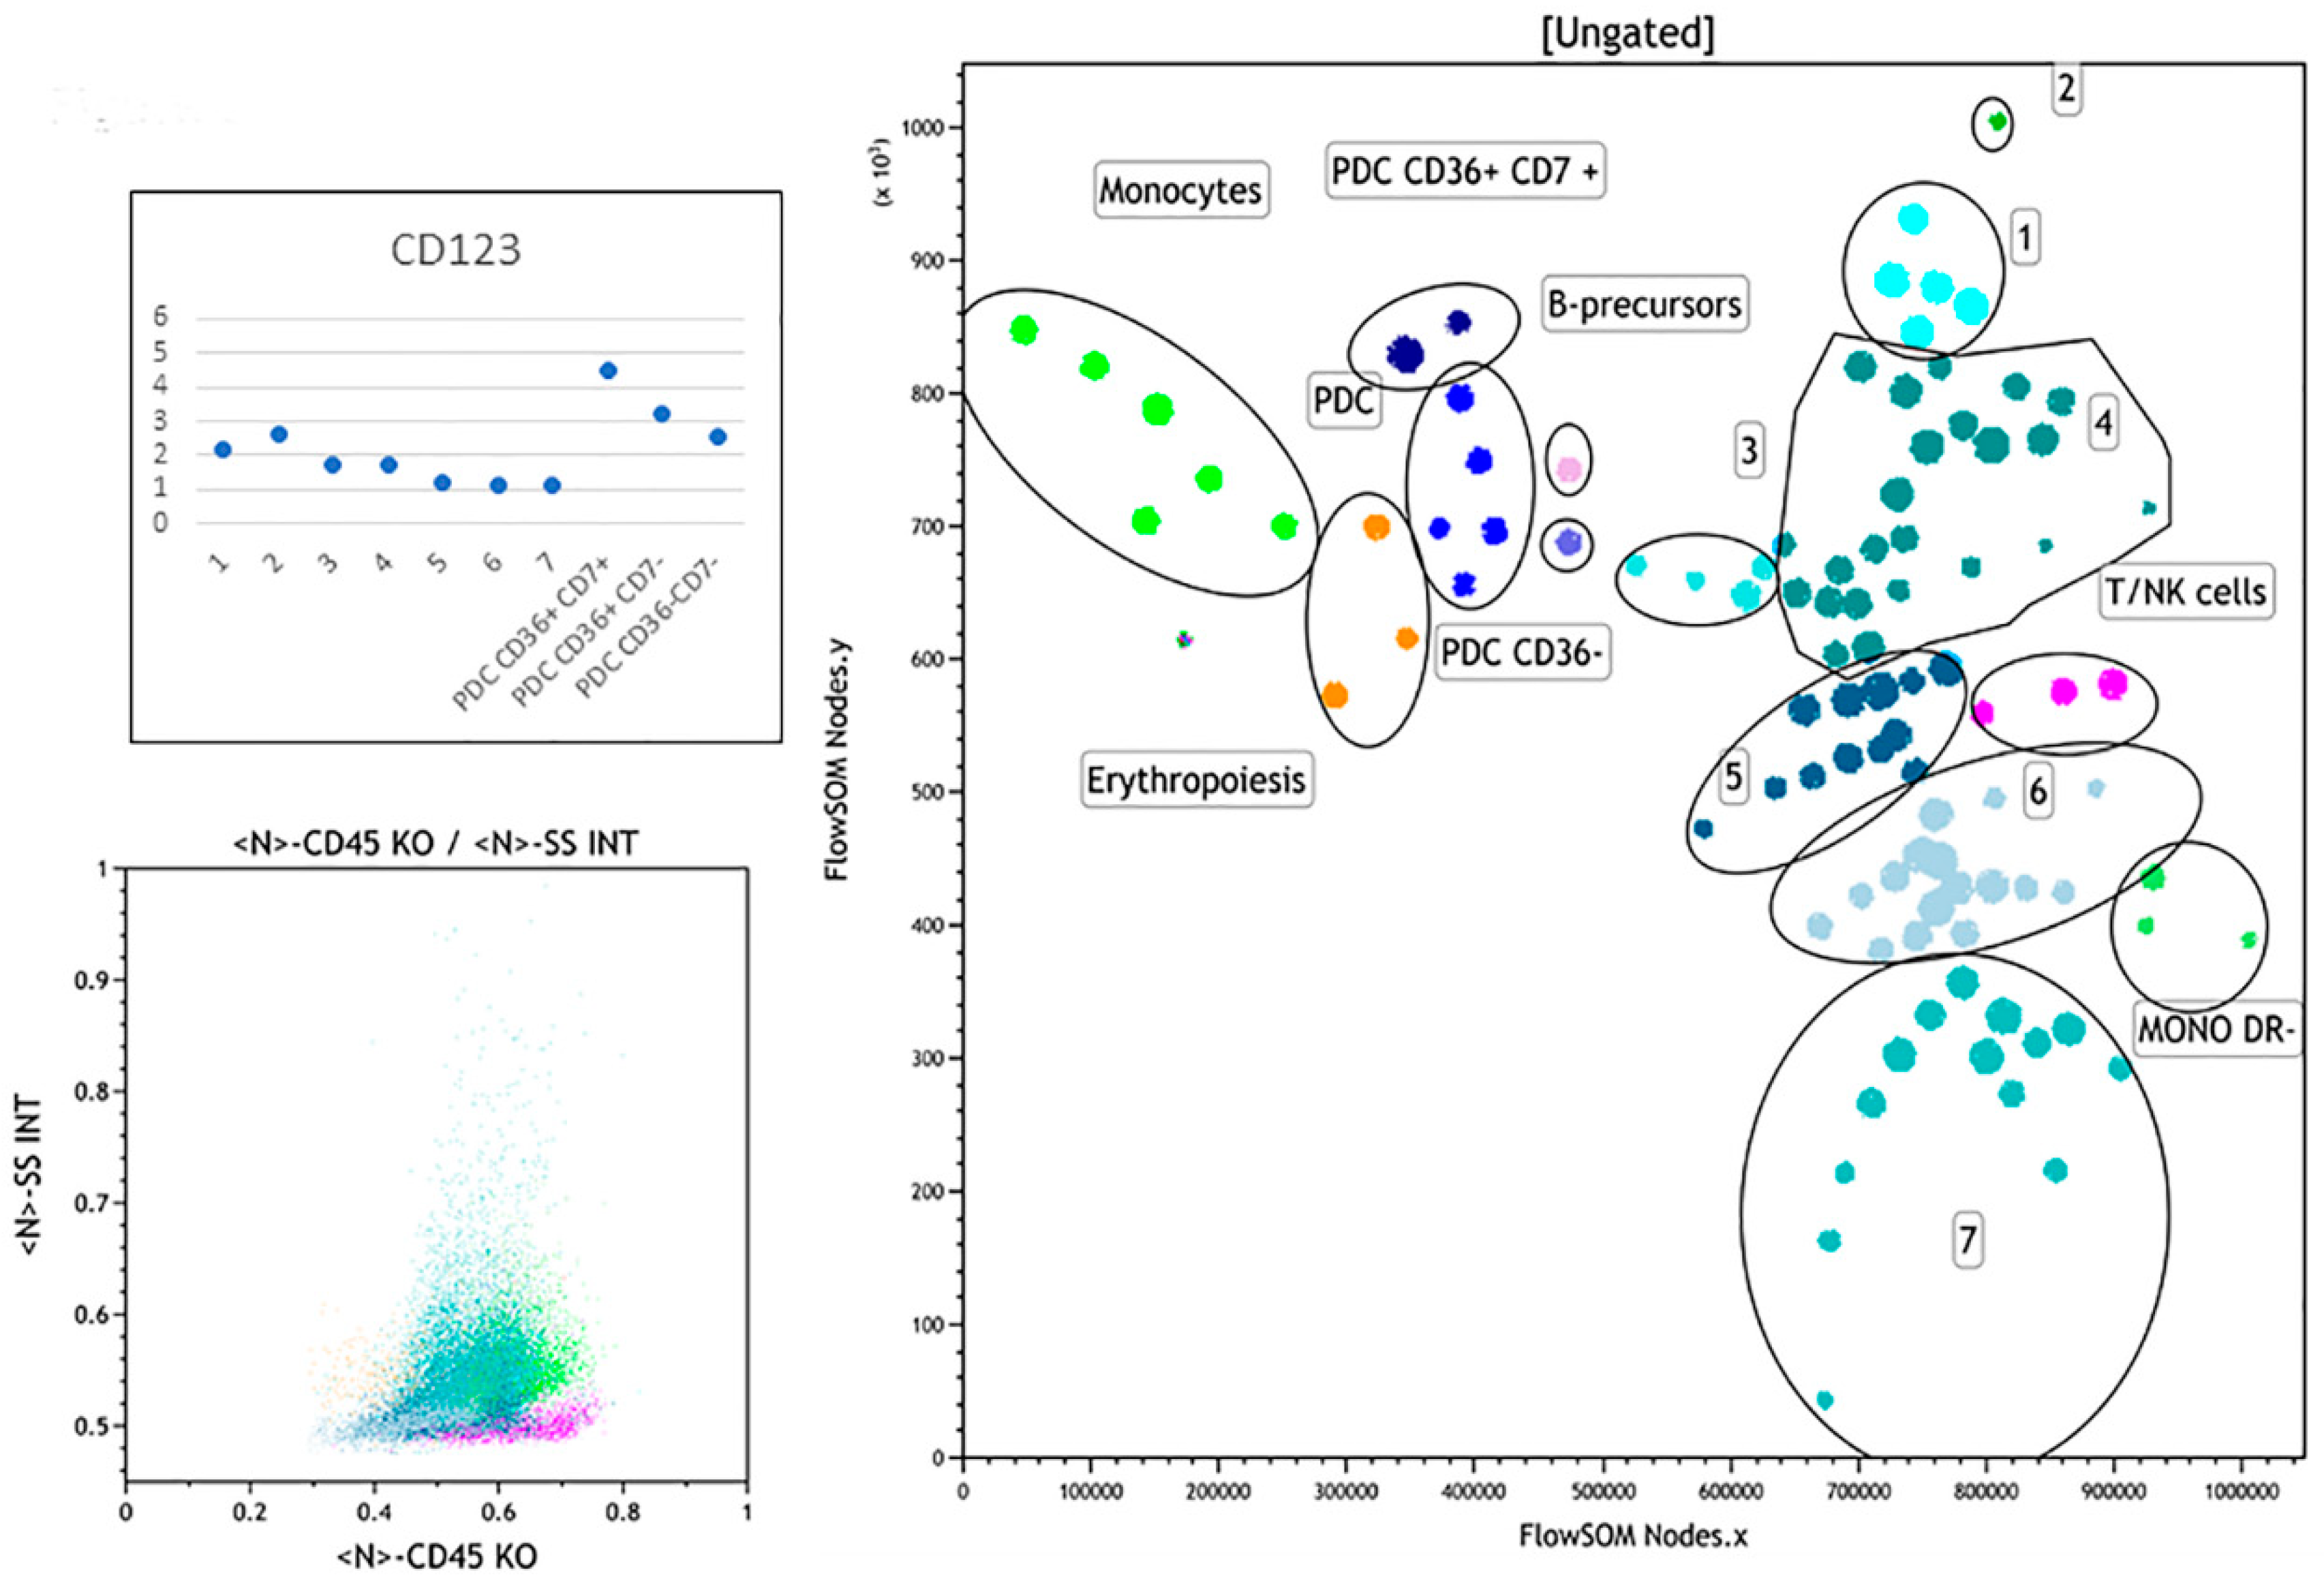
3.2.7. Case 7
3.3. Summary of FlowSOM Analysis
4. Discussion
Supplementary Materials
Author Contributions
Funding
Institutional Review Board Statement
Informed Consent Statement
Data Availability Statement
Acknowledgments
Conflicts of Interest
References
- Sood, R.; Kamikubo, Y.; Liu, P. Role of RUNX1 in hematological malignancies. Blood 2017, 129, 2070–2082. [Google Scholar] [CrossRef] [Green Version]
- Gaidzik, V.I.; Teleanu, V.; Papaemmanuil, E.; Weber, D.; Paschka, P.; Hahn, J.; Wallrabenstein, T.; Kolbinger, B.; Köhne, C.H.; Horst, H.A.; et al. RUNX1 mutations in acute myeloid leukemia are associated with distinct clinico-pathologic and genetic features. Leukemia 2016, 11, 2160–2168. [Google Scholar] [CrossRef] [PubMed]
- Swerdlow, S.; Campo, E.; Harris, N.; Jaffz, E.S.; Pileri, S.A.; Stein, H.; Thiele, J. (Eds.) WHO Classification of Tumours of Haematopoietic and Lymphoid Tissues, 4th ed.; IARC: Lyon, France, 2017. [Google Scholar]
- George, T.I.; Bajel, A. Diagnosis of rare subtypes of acute myeloid leukaemia and related neoplasms. Pathology 2021, 3, 312–327. [Google Scholar] [CrossRef]
- Takahashi, K.; Wang, F.; Morita, K.; Yan, Y.; Hu, P.; Zhao, P.; Zhar, A.A.; Wu, C.J.; Gumbs, C.; Little, L.; et al. Integrative genomic analysis of adult mixed phenotype acute leukemia delineates lineage associated molecular subtypes. Nat. Commun. 2018, 1, 2670. [Google Scholar] [CrossRef] [Green Version]
- Zalmaï, L.; Viailly, P.J.; Biichle, S.; Cheok, M.; Soret, L.; Angelot-Delettre, F.; Petrella, T.; Collonge-Rame, M.A.; Seilles, E.; Geffroy, S.; et al. Plasmacytoid dendritic cells proliferation associated with acute myeloid leukemia: Phenotype profile and mutation landscape. Haematologica 2020. [Google Scholar] [CrossRef] [PubMed]
- Xiao, W.; Chan, A.; Waarts, M.R.; Mishra, T.; Liu, Y.; Cai, S.F.; Yao, J.; Gao, Q.; Bowman, R.L.; Koche, R.P.; et al. Plasmacytoid dendritic cell expansion defines a distinct subset of RUNX1-mutated acute myeloid leukemia. Blood 2021, 137, 1377–1391. [Google Scholar] [CrossRef]
- Renosi, F.; Roggy, A.; Giguelay, A.; Soret, L.; Viailly, P.J.; Cheok, M.; Biichle, S.; Angelot-Delettre, F.; Asnafi, V.; Macintyre, E.; et al. Transcriptomic and genomic heterogeneity in blastic plasmacytoid dendritic cell neoplasms: From ontogeny to oncogenesis. Blood Adv. 2021, 5, 1540–1551. [Google Scholar] [CrossRef]
- Naresh, K.N.; Pavlu, J. Plasmacytoid dendritic cell nodules in bone marrow biopsies of chronic myelomonocytic leukemia. Am. J. Hematol. 2010, 85, 89. [Google Scholar] [CrossRef] [PubMed]
- Vitte, F.; Fabiani, B.; Bénet, C.; Dalac, S.; Balme, B.; Delattre, C.; Vergier, B.; Beylot-Barry, M.; Vignon-Pennamen, D.; Ortonne, N.; et al. Specific skin lesions in chronic myelomonocytic leukemia: A spectrum of myelomonocytic and dendritic cell proliferations: A study of 42 cases. Am. J. Surg. Pathol. 2012, 36, 1302–1316. [Google Scholar] [CrossRef]
- Brunetti, L.; Di Battista, V.; Venanzi, A.; Schiavoni, G.; Martelli, M.P.; Ascani, S.; Mecucci, C.; Tiacci, E.; Falini, B. Blastic plasmacytoid dendritic cell neoplasm and chronic myelomonocytic leukemia: A shared clonal origin. Leukemia 2017, 31, 1238–1240. [Google Scholar] [CrossRef]
- Adnan Awad, S.; Dufva, O.; Ianevski, A.; Ghimire, B.; Koski, J.; Maliniemi, P.; Thomson, D.; Schreiber, A.; Heckman, C.A.; Koskenvesa, P.; et al. RUNX1 mutations in blast-phase chronic myeloid leukemia associate with distinct phenotypes, transcriptional profiles, and drug responses. Leukemia 2021, 35, 1087–1099. [Google Scholar] [CrossRef] [PubMed]
- Facchetti, F.; de Wolf-Peeters, C.; Mason, D.Y.; Pulford, K.; van den Oord, J.J.; Desmet, V.J. Plasmacytoid T cells. Immunohistochemical evidence for their monocyte/macrophage origin. Am. J. Pathol. 1988, 133, 15–21. [Google Scholar]
- Chaperot, L.; Bendriss, N.; Manches, O.; Gressin, R.; Maynadie, M.; Trimoreau, F.; Orfeuvre, H.; Corront, B.; Feuillard, J.; Sotto, J.J.; et al. Identification of a leukemic counterpart of the plasmacytoid dendritic cells. Blood 2001, 97, 3210–3217. [Google Scholar] [CrossRef] [PubMed] [Green Version]
- Galibert, L.; Maliszewski, C.R.; Vandenabeele, S. Plasmacytoid monocytes/T cells: A dendritic cell lineage? Semin. Immunol. 2001, 13, 283–289. [Google Scholar] [CrossRef] [PubMed]
- Feuillard, J.; Jacob, M.C.; Valensi, F.; Maynadié, M.; Gressin, R.; Chaperot, L.; Arnoulet, C.; Brignole-Baudouin, F.; Drénou, B.; Duchayne, E.; et al. Clinical and biologic features of CD4(+)CD56(+) malignancies. Blood 2002, 99, 1556–1563. [Google Scholar] [CrossRef] [PubMed] [Green Version]
- Garnache-Ottou, F.; Feuillard, J.; Ferrand, C.; Biichle, S.; Trimoreau, F.; Seilles, E.; Salaun, V.; Garand, R.; Lepelley, P.; Maynadié, M.; et al. Extended diagnostic criteria for plasmacytoid dendritic cell leukaemia. Br. J. Haematol. 2009, 145, 624–636. [Google Scholar] [CrossRef]
- Wang, W.; Khoury, J.D.; Miranda, R.N.; Jorgensen, J.L.; Xu, J.; Loghavi, S.; Li, S.; Pemmaraju, N.; Nguyen, T.; Medeiros, L.J.; et al. Immunophenotypic characterization of reactive and neoplastic plasmacytoid dendritic cells permits establishment of a 10-color flow cytometric panel for initial workup and residual disease evaluation of blastic plasmacytoid dendritic cell neoplasm. Haematologica 2021, 106, 1047–1055. [Google Scholar] [CrossRef] [Green Version]
- Breton, G.; Lee, J.; Liu, K.; Nussenzweig, M.C. Defining human dendritic cell progenitors by multiparametric flow cytometry. Nat. Protoc. 2015, 10, 1407–1422. [Google Scholar] [CrossRef] [Green Version]
- Musumeci, A.; Lutz, K.; Winheim, E.; Krug, A.B. What Makes a PDC: Recent advances in understanding plasmacytoid dc development and heterogeneity. Front. Immunol. 2019, 10, 1222. [Google Scholar] [CrossRef] [Green Version]
- Deotare, U.; Yee, K.W.; Le, L.W.; Porwi, T.A.; Tierens, A.; Musani, R.; Barth, D.; Torlakovic, E.; Schimmer, A.; Schuh, A.C.; et al. Blastic plasmacytoid dendritic cell neoplasm with leukemic presentation: 10-Color flow cytometry diagnosis and HyperCVAD therapy. Am. J. Hematol. 2016, 91, 283–286. [Google Scholar] [CrossRef] [Green Version]
- Lacombe, F.; Dupont, B.; Lechevalier, N.; Vial, J.P.; Béné, M.C. Innovation in flow cytometry analysis: A new paradigm delineating normal or diseased bone marrow subsets through machine learning. Hemasphere 2019, 3, e173. [Google Scholar] [CrossRef]
- Cheung, M.; Campbell, J.J.; Whitby, L.; Thomas, R.J.; Braybrook, J.; Petzing, J. Current trends in flow cytometry automated data analysis software. Cytom. A 2021. [Google Scholar] [CrossRef]
- Van Gassen, S.; Callebaut, B.; Van Helden, M.J.; Lambrecht, B.N.; Demeester, P.; Dhaene, T.; Saeys, Y. FlowSOM: Using self-organizing maps for visualization and interpretation of cytometry data. Cytom. A 2015, 87, 636–645. [Google Scholar] [CrossRef] [PubMed]
- Lacombe, F.; Lechevalier, N.; Vial, J.P.; Béné, M.C. An R-derived flowsom process to analyze unsupervised clustering of normal and malignant human bone marrow classical flow cytometry data. Cytom. A 2019, 95, 1191–1197. [Google Scholar] [CrossRef] [PubMed]
- Vial, J.P.; Lechevalier, N.; Lacombe, F.; Dumas, P.Y.; Bidet, A.; Leguay, T.; Vergez, F.; Pigneux, A.; Béné, M.C. Unsupervised flow cytometry analysis allows for an accurate identification of minimal residual disease assessment in acute myeloid leukemia. Cancers 2021, 13, 629. [Google Scholar] [CrossRef] [PubMed]
- Béné, M.C.; Axler, O.; Violidaki, D.; Lacombe, F.; Ehinger, M.; Porwit, A. Definition of erythroid differentiation subsets in normal human bone marrow using FlowSOM unsupervised cluster analysis of flow cytometry data. Hemasphere 2020, 5, e512. [Google Scholar] [CrossRef]
- Violidaki, D.; Axler, O.; Jafari, K.; Bild, F.; Nilsson, L.; Mazur, J.; Ehinger, M.; Porwit, A. Analysis of erythroid maturation in the nonlysed bone marrow with help of radar plots facilitates detection of flow cytometric aberrations in myelodysplastic syndromes. Cytom. B Clin. Cytom. 2020, 98, 399–411. [Google Scholar] [CrossRef]
- Rodrigues, P.F.; Tussiwand, R. Novel concepts in plasmacytoid dendritic cell (PDC) development and differentiation. Mol. Immunol. 2020, 126, 25–30. [Google Scholar] [CrossRef]
- Hamadeh, F.; Awadallah, A.; Meyerson, H.J.; Beck, R.C. Flow cytometry identifies a spectrum of maturation in myeloid neoplasms having plasmacytoid dendritic cell differentiation. Cytom. B Clin. Cytom. 2020, 98, 43–51. [Google Scholar] [CrossRef] [PubMed]
- Sapienza, M.R.; Pileri, A.; Derenzini, E.; Melle, F.; Motta, G.; Fiori, S.; Calleri, A.; Pimpinelli, N.; Tabanelli, V.; Pileri, S. Blastic plasmacytoid dendritic cell neoplasm: State of the art and prospects. Cancers 2019, 11, 595. [Google Scholar] [CrossRef] [Green Version]


| Case # | Age (Years) | Sex | Hb g/L | WBC × 109/L | Plt × 109/L | % Blasts by Cytology | Diagnosis WHO 2016 | Karyotype | Molecular Data (VAF) a | %CD34 b | %CD123 b |
|---|---|---|---|---|---|---|---|---|---|---|---|
| 1 | 73 | M | 59 | 35 | 12 | 88% | RUNX1mut AML | 46,XY | RUNX1 46%, IDH2 45%, TET2 47%, SRSF2 50% | 90% | 88% |
| 2 | 75 | F | 94 | 5.6 | 25 | 20% | RUNX1mut AML PDC differentiated | NA * | RUNX1 41%, ASXL1 35%, IDH2 48%, NRAS 45%, SRSF2 45% | 21% | 12% |
| 3 | 29 | M | 114 | 2.5 | 149 | 31% | AML-MRC | 46XY, del 7(q32), ?inv.dup.21 (q22;q11) [19]/46,XY [9] | RUNX1 53%, WT1 10% | 30% | 4% |
| 4 | 79 | M | 93 | 1.6 | 28 | 64% | t-AML | 47, XY,+8 [14]/48, XY, +8, +8 [11] | RUNX1 45%, IDH2 41%, SRSF2 44%, CUX1 5% | 84% | 10% |
| 5 | 71 | F | 134 | 4.4 | 92 | 19% | CMML ** and BPDCN | 46,XX | RUNX1 41%, 2xTET2 (50 and 46%), PHF6 36%, SRSF2 50%, NRAS 10%, | 9% | 3% |
| 6 | 79 | M | 107 | 1.5 | 159 | 21% | t-AML | 46,XY | BCOR 43%, BCORL1 43%, U2AF1 20% | 2% | 1.7% |
| 7 | 62 | M | 96 | 8.3 | 84 | 81% | MPAL (T/Myeloid) | 46,XY,add(14)(q32) | 2xFLT3 (21% and 5%), DNMT3A (48%), ASXL1 (47%), JARID2 (15%), 2xBCL11B (9% and 5%) | 55% | 4% |
| Case # | Normal PDC % Total BM | PDC CD36neg % Total BM | PDC CD7+ % Total BM | MDC % Total BM | Basophils % Total BM |
|---|---|---|---|---|---|
| NBM | 0.32 | ND | 0.03 | 0.17 | 0.29 |
| 1 | ND | ND | ND | ND | ND |
| 2 | 3.14 | 5.07 | 5.24 | 0.67 | 0.63 |
| 3 | 0.5 | ND | 2.24 | ND | ND |
| 4 | ND | ND | <0.01 | <0.01 | <0.01 |
| 5 | 1.14 | ND | 1.6 | ND | 0.29 |
| 6 | ND | ND | 0.89 | ND | 0.39 |
| 7 | 4.06 | 0.89 | 2.52 | ND | ND |
Publisher’s Note: MDPI stays neutral with regard to jurisdictional claims in published maps and institutional affiliations. |
© 2021 by the authors. Licensee MDPI, Basel, Switzerland. This article is an open access article distributed under the terms and conditions of the Creative Commons Attribution (CC BY) license (https://creativecommons.org/licenses/by/4.0/).
Share and Cite
Porwit, A.; Béné, M.C. The Plasmacytoid Dendritic Cell CD123+ Compartment in Acute Leukemia with or without RUNX1 Mutation: High Inter-Patient Variability Disclosed by Immunophenotypic Unsupervised Analysis and Clustering. Hemato 2021, 2, 572-585. https://doi.org/10.3390/hemato2030036
Porwit A, Béné MC. The Plasmacytoid Dendritic Cell CD123+ Compartment in Acute Leukemia with or without RUNX1 Mutation: High Inter-Patient Variability Disclosed by Immunophenotypic Unsupervised Analysis and Clustering. Hemato. 2021; 2(3):572-585. https://doi.org/10.3390/hemato2030036
Chicago/Turabian StylePorwit, Anna, and Marie C. Béné. 2021. "The Plasmacytoid Dendritic Cell CD123+ Compartment in Acute Leukemia with or without RUNX1 Mutation: High Inter-Patient Variability Disclosed by Immunophenotypic Unsupervised Analysis and Clustering" Hemato 2, no. 3: 572-585. https://doi.org/10.3390/hemato2030036
APA StylePorwit, A., & Béné, M. C. (2021). The Plasmacytoid Dendritic Cell CD123+ Compartment in Acute Leukemia with or without RUNX1 Mutation: High Inter-Patient Variability Disclosed by Immunophenotypic Unsupervised Analysis and Clustering. Hemato, 2(3), 572-585. https://doi.org/10.3390/hemato2030036